Washington Area Economy: Performance and Outlook
|
|
|
- Joshua Carr
- 5 years ago
- Views:
Transcription
1 Washington Area Economy: Performance and Outlook Center for Regional Analysis Schar School of Policy and Government George Mason University April 8, 219
2 U.S. Gross Domestic Product 6. Quarterly Change Real GDP (Billions) $2, $19, $18, $17, $16, % 2. $15, $14, $13, $12, $11, $1, Source: Bureau of Economic Analysis (Seasonally Adjusted, Chained 212 Dollars ) % %
, GMU")
3 (s) 4, Annual Change in Payroll Jobs US Month-Over-Year 2, Mar = +2.5M -2, -4, -6, -8, Source: Bureau of Labor Statistics (Not Seasonally Adjusted), GMU Center for Regional Analysis
4 (s) 7 US Payroll Job Change Month-to-Month Mar = +196k Source: Bureau of Labor Statistics (Seasonally Adjusted), GMU Center for Regional Analysis
5 US Payroll Jobs Month-to-Month Change (s) Total (Millions) M Mar +196K Source: Bureau of Labor Statistics (Seasonally Adjusted), GMU Center for Regional Analysis Since M
6 Ranked by Size in 218 Educ & Health Svcs Prof. & Bus. Svcs State & Local Govt Retail Trade Leisure & Hosp. Manufacturing Financial Construction Wholesale Trade Other Services Transp. & Util. Federal Govt. Information U.S. Payroll Job Change by Sector Mar 218 Mar (s) Source: Bureau of Labor Statistics (Seasonally Adjusted), GMU Center for Regional Analysis 246 Total = 2,537,
7 Ranked by Size in 218 Educ & Health Svcs Prof. & Bus. Svcs State & Local Govt Retail Trade Leisure & Hosp. Manufacturing Financial Construction Wholesale Trade Other Services Transp. & Util. Federal Govt. Information U.S. Payroll Job Change by Sector Feb 219 Mar (s) Total = +196k Source: Bureau of Labor Statistics (Seasonally Adjusted), GMU Center for Regional Analysis
8 U.S. Unemployment Rate % Mar Source: Bureau of Labor Statistics (Seasonally Adjusted), GMU Center for Regional Analysis
9 U.S. Unemployment 15. U-6 UR LFPR Mar 7.3% Mar 3.8% Mar 63% Mar18 to Mar19 U-6 -.6% UR -.2% 6 Source: Bureau of Labor Statistics (Seasonally Adjusted), GMU Center for Regional Analysis
10 (s) Initial Claims for Unemployment 4-Week Moving Average Mar 3: 22K Source: Department of Labor (Seasonally Adjusted), GMU Center for Regional Analysis
11 (s) 5 Initial Claims for Unemployment 4-Week Moving Average Mar 3: 22K Source: Department of Labor (Seasonally Adjusted), GMU Center for Regional Analysis
12 Average Weekly Earnings U.S., Total Private, Across all Industries Average Weekly Earnings 1,2 1, Real Average Weekly Earnings ( dollars) Mar 18 Mar 19 Avg Hourly Wages +3.2% Mar 18 Mar19 Avg Weekly Earnings +3.2% Feb 18 Feb 19 Real Avg Weekly Earnings +1.6% Source: Bureau of Labor Statistics, GMU Center for Regional Analysis
13 Labor Productivity Nonfarm business, seasonally adjusted QOTYC Index Source: Bureau of Labor Statistics, GMU Center for Regional Analysis Base year (1) = 212
14 Consumer Confidence Mar-13 Mar-14 Mar-15 Mar-16 Mar-17 Mar-18 Mar-19 Source: The Conference Board, GMU Center for Regional Analysis Current Situation March 219 Cur. = 16.6 Exp. = 99.8 (1985 = 1) Expectations
15 Annual Consumer Prices Source: Bureau of Labor Statistics, GMU Center for Regional Analysis
16 Interest Rates % Yr 1-Yr Treas Fed Source: Federal Reserve Bank of St. Louis, GMU Center for Regional Analysis
17 1-yr./1-yr. yield spread Percentage points Source: FRB Dallas Only false signal '59 '62 '65 '68 '71 '74 '77 '8 '83 '86 '89 '92 '95 '98 '1 '4 '7
18 1-yr./1-yr. yield spread Source: U.S. Treasury, Yield Curve for Treasury Nominal Coupon Issues (TNC yield curve), which is derived from Treasury nominal notes and bonds
19 U.S. New and Existing Home Sales Feb 18 - Feb % Feb 18 - Feb 19.6% 4k (s) 7, 6,5 6, 5,5 5, 4,5 4, 3,5 3, 2,5 2, Existing (Left Axis) New (Right Axis) (s) Source: U.S. Census (New)(Seasonally Adjusted Annual Rate), National Association of Realtors (Existing)
20 Growth in Total Consumption Outlays Source: Bureau of Economic Analysis
21 % 2.6 U.S. GDP (Annual % Change) % Source: Bureau of Economic Analysis, GMU Center for Regional Analysis
22 The Washington Economy
23 Population Change Elements of Population Change Washington MSA 12, +2.% +1.7% +1.5% +1.1% +1.% +1.% +1.1% 1, 8, 6, 23,864 6,843 3,143 37,183 39,715 39,358 41,48 45,41 45,66 44,76 4, 2, 49,16 49,169 47,79 48,651 47,832 44,882 42,616-2, -4, Net Domestic Migration Net Int'l Migration Natural Increase -23,29-31,483-31,492-21, Source: US Census Bureau, Population Estimates Program, V217
24 (s) 15 Annual Job Change MOTYC Washington MSA Source: Bureau of Labor Statistics (Not Seasonally Adjusted), GMU Center for Regional Analysis
25 Annual Job Change - Washington MSA s MOTYC Non-Farm Jobs s 11 3, ,3 3,2 3,1 3, 2,9 Feb 18- Feb K Source: Bureau of Labor Statistics (Not Seasonally Adjusted), GMU Center for Regional Analysis 2,8 February-19 Total: 3,29 K
26 (s) 4 Annual Job Change MOTYC District of Columbia Source: Bureau of Labor Statistics (Not Seasonally Adjusted), GMU Center for Regional Analysis
27 Annual Job Change District of Columbia s MOTYC Non-Farm Jobs s Feb 18- Feb K February-19 Total: 791 K Source: Bureau of Labor Statistics (Not Seasonally Adjusted), GMU Center for Regional Analysis
28 (s) Annual Job Change MOTYC Suburban Maryland Source: Bureau of Labor Statistics (Not Seasonally Adjusted), GMU Center for Regional Analysis
29 Annual Job Change Suburban MD s MOTYC Non-Farm Jobs s 3 1, ,2 1, Feb 18- Feb 19-3, Source: Bureau of Labor Statistics (Not Seasonally Adjusted), GMU Center for Regional Analysis 88 February-19 Total: 1, K
30 Annual Job Change MOTYC Northern Virginia (s) Source: Bureau of Labor Statistics (Not Seasonally Adjusted), GMU Center for Regional Analysis
31 Annual Job Change Northern VA s MOTYC Non-Farm Jobs s 5 1, ,5 1,45 1,4 1,35 1,3 Feb 18- Feb K Source: Bureau of Labor Statistics (Not Seasonally Adjusted), GMU Center for Regional Analysis 1,25 February - 19 Total: 1,484 K
32 Employment Composition by Sector February 219 Washington MSA Professional & Business Services Education & Health Services Federal Government State & Local Government Leisure & Hospitality Retail Trade Other Services Construction Financial Activites Information Transportation & Utilities Wholesale Trade Manufacturing 2.2% 2.1% 1.9% 1.6% 11.% 1.5% 1.1% 8.% 6.3% 4.7% 4.7% 13.5% 23.3% % 5% 1% 15% 2% 25%
33 (Ranked by Size in 218) Prof. & Bus. Svcs Educ & Health Svcs Federal Govt. State & Local Govt Leisure & Hosp. Retail Trade Other Services Construction Financial Information Transp. & Util. Wholesale Trade Manufacturing Job Change by Sector February 218 February 219 Washington MSA (s) Total = 2, Source: Bureau of Labor Statistics (Not Seasonally Adjusted), GMU Center for Regional Analysis
34 (Ranked by Size in 218) Prof. & Bus. Svcs Educ & Health Svcs Federal Govt. State & Local Govt Leisure & Hosp. Retail Trade Other Services Construction Financial Information Transp. & Util. Wlse Trade Manufacturing Job Change by Sector January 219 February 219 Washington MSA (s) Total = 13, Source: Bureau of Labor Statistics (Not Seasonally Adjusted), GMU Center for Regional Analysis
35 (s) 25 Professional & Business Services Washington MSA Source: Bureau of Labor Statistics (Not Seasonally Adjusted), GMU Center for Regional Analysis Feb 18- Feb K MOTYC Total Jobs
36 (s) Professional & Business Services Washington MSA Month Over the Year Change Prof., Sci. & Tech. Svcs. Admin. & Waste Mgt Source: Bureau of Labor Statistics (Not Seasonally Adjusted), GMU Center for Regional Analysis
37 (s) Federal Government Washington MSA Source: Bureau of Labor Statistics (Not Seasonally Adjusted), GMU Center for Regional Analysis (s) Feb 18- Feb 19-9 MOTYC Total Jobs February-19 Total: 363K
38 $ Billions Federal Procurement in the Washington MSA (Fiscal Years) 82.4 TOTAL = $1,471.1 Billion Source: US Census, Consolidated Federal Funds Report and USAspending.gov
39 (Ranked by Size in 218) Federal Govt. Prof. & Bus. Svcs Educ & Health Svcs Leisure & Hosp. Other Services State & Local Govt Financial Retail Trade Information Construction Transp. & Util. Wholesale Trade Manufacturing Job Change by Sector February 218 February 219 District of Columbia (s) Total 2, Source: Bureau of Labor Statistics (Not Seasonally Adjusted), GMU Center for Regional Analysis
40 (Ranked by Size in 218) Federal Govt. Prof. & Bus. Svcs Educ & Health Svcs Leisure & Hosp. Other Services State & Local Govt Financial Retail Trade Information Construction Transp. & Util. Wlse Trade Manufacturing Job Change by Sector January 219 February 219 District of Columbia (s) Total 4, Source: Bureau of Labor Statistics (Not Seasonally Adjusted), GMU Center for Regional Analysis
41 (Ranked by Size in 218) Prof. & Bus. Svcs Educ & Health Svcs State & Local Govt Retail Trade Leisure & Hosp. Federal Govt. Construction Other Services Financial Manufacturing Wholesale Trade Transp. & Util. Information -2.7 Job Change by Sector February 21 February 219 Suburban Maryland (s) Total: -3, Source: Bureau of Labor Statistics (Not Seasonally Adjusted), GMU Center for Regional Analysis
42 (Ranked by Size in 218) Prof. & Bus. Svcs Educ & Health Svcs State & Local Govt Retail Trade Leisure & Hosp. Federal Govt. Construction Other Services Financial Manufacturing Wholesale_Trade Transp. & Util. Information -2.1 Job Change by Sector January 219 February 219 Suburban Maryland (s) Total: 7, Source: Bureau of Labor Statistics (Not Seasonally Adjusted), GMU Center for Regional Analysis 7.5
43 (Ranked by Size in 218) Prof. & Bus. Svcs Educ & Health Svcs State & Local Govt Leisure & Hosp. Retail Trade Federal Govt. Other Services Financial Construction Transp. & Util. Information Wholesale Trade Manufacturing Job Change by Sector February 218 February 219 Northern Virginia Source: Bureau of Labor Statistics (Not Seasonally Adjusted), GMU Center for Regional Analysis (s) Total 18,
44 (Ranked by Size in 218) Prof. & Bus. Svcs Educ & Health Svcs State & Local Govt Leisure & Hosp. Retail Trade Federal Govt. Other Services Financial Construction Transp. & Util. Information Wholesale Trade Manufacturing Job Change by Sector January 219 February 219 Northern Virginia (s) Total: Source: Bureau of Labor Statistics (Not Seasonally Adjusted), GMU Center for Regional Analysis
45 Unemployment Rates in the WMSA By Sub-State Area DC 4. U.S. 4.1 SMD 3.7 MSA 2.8 NVA 2 Source: Bureau of Labor Statistics (Region - Not Seasonally Adjusted, US Seasonally Adjusted)
46 (s) Largest Job Markets Job Change: Feb. 218 Feb. 219 Washington +2, Source: Bureau of Labor Statistics (Not Seasonally Adjusted), GMU Center for Regional Analysis
47 15 Largest Job Markets Job Change: Feb. 218 Feb % 3.% 2.5% 2.% 1.5% 1.%.5%.% -.5% -1.% Washington +.6% Source: Bureau of Labor Statistics (Not Seasonally Adjusted), GMU Center for Regional Analysis Source: Bureau of Labor Statistics (Not Seasonally Adjusted), GMU Center for Regional Analysis
48 6. % U.S. GDP and Washington Area GRP (Annual % Change) % U.S. -2. Washington Source: Bureau of Economic Analysis, GMU Center for Regional Analysis. Chained Dollars
49 % % Economic Outlook (GRP), Washington Area and Sub-State Areas (Annual % Change) NV MSA SM DC Source: GMU Center for Regional Analysis, Forecast: April 216
50 Employment Change in the Washington MSA (Thousands of Jobs) Annual Totals Source: BLS, GMU Center for Regional Analysis (March 218) Average Annual Change = 39,8
51 8 7 Employment Change in the Washington MSA (Thousands of Jobs) Dec-Dec Source: BLS, GMU Center for Regional Analysis (March 218)
52 Employment Change in the WMSA by Sub-State Area (s) Annual Totals D.C Sub. MD No. VA REGION Source: BLS, GMU Center for Regional Analysis (March 218) NOTE: The sub-state totals do not include Jefferson, WV. Average Annual Change = 38,9
53 Employment Change in the WMSA by Sub-State Area (s) (Dec Dec) D.C Sub. MD No. VA REGION Source: BLS, GMU Center for Regional Analysis (March 218) NOTE: The sub-state totals do not include Jefferson, WV.
54 Long commutes diminish quality of life Proportion of workers with travel time to work of 6 or more minutes New York SF-Oakland DC Atlanta Boston Chicago Los Angeles Seattle Philadelphia Houston Miami Dallas United States Phoenix Detroit Minneapolis 5.7% 7.3% 7.1% 14.5% 14.2% 14.1% 13.6% 12.3% 11.8% 11.1% 1.6% 9.4% 9.3% 17.9% 17.5% 22.5% % 5% 1% 15% 2% 25% Source: US Census Bureau, 217 American Community Survey, Table S82
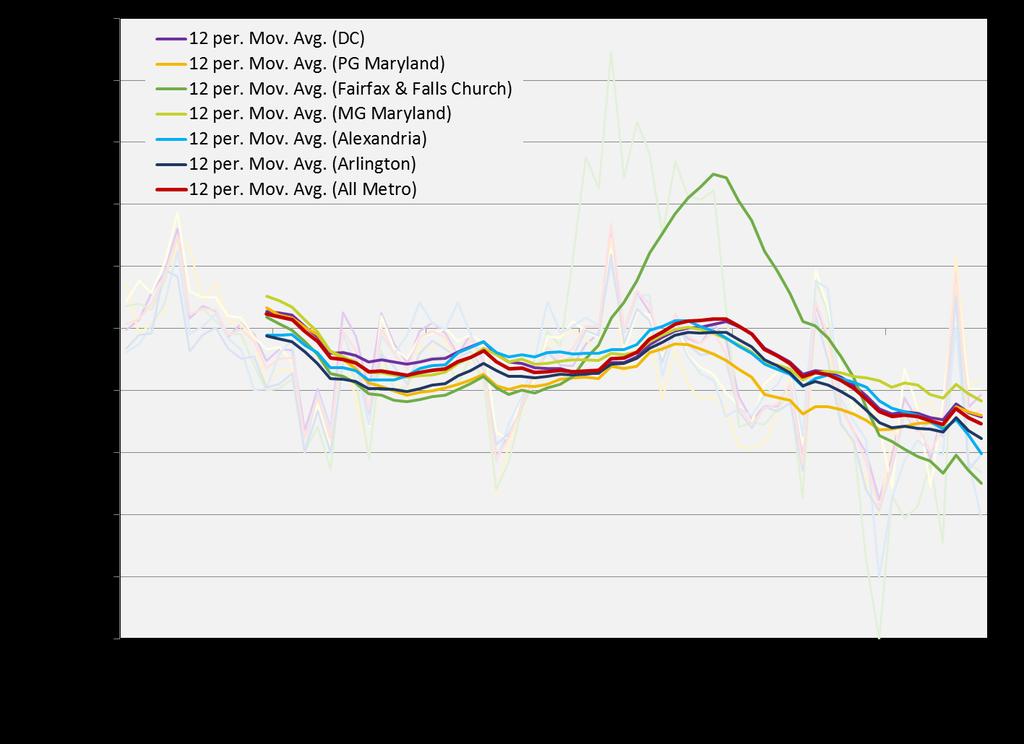
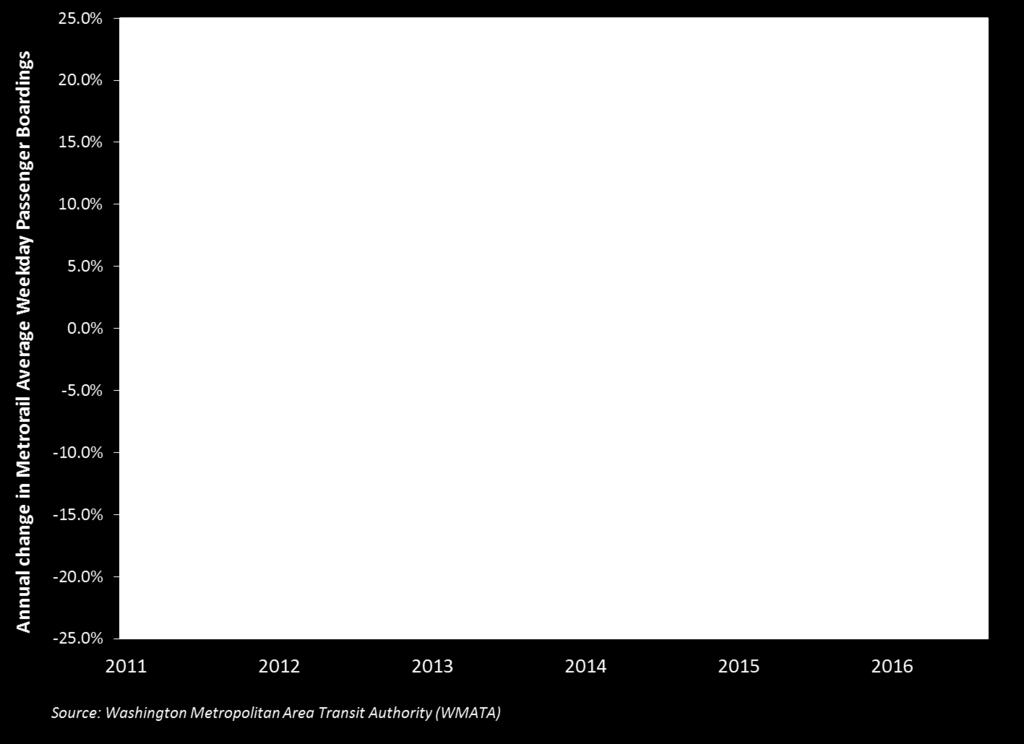
55 Annual change in Metrorail Average Weekday Passenger Boardings Metrorail ridership is in decline 15.% 1.% 5.% DC Maryland All Metro Alexandria Arlington Fairfax.% -5.% -1.% -15.% * Source: Washington Metropolitan Area Transit Authority (WMATA)
56 56
57
58
59 The contributions of foreign-born, non-citizen workers to the Washington region s workforce 59
 files")
60 Source: 216 American Community Survey, Public Use Microdata Sample (PUMS) files 6
61 Most Foreign Born, Non-Citizens originate from Latin America El Salvador 23.5% India Guatemala Mexico Honduras 6.2% 6.1% 5.8% 5.6% Ethiopia China Bolivia Philippines Canada Bangladesh 3.1% 3.% 2.9% 2.7% 1.%.7% % 5% 1% 15% 2% 25% Proportion of Total Foreign-Born, Non-Citizen Workers Source: US Census Bureau ACS 216, GMU Center for Regional Analysis 61
 files")
62 Source: 216 American Community Survey, Public Use Microdata Sample (PUMS) files 62
63 Majority of foreign-born, non-citizen workers have been here 1 years or more 6% 5% Year of Entry, Non Citizen Foreign Born Workers MWCOG Region 48.3% 4% 3% 2% 1% % 22.2% 17.2% 8.4%.2%.5% 1.5% 1.8% before or later Source: US Census Bureau ACS 216, GMU Center for Regional Analysis 63
64 Percentage of Workers Foreign-born, non-citizen workers are about as likely to have a post-secondary degree as all workers nationwide 35% 3% 29.4% Non-Citizen, Foreign-Born Workers Greater Washington Region Workforce 25% 27.4% 25.8% 2% 2.9% 22.7% 15% 16.% 16.2% 16.% 17.5% 1% 5% 8.2% % Less than High School High school diploma/ged Source: US Census Bureau ACS 216, GMU Center for Regional Analysis Associates degree or Some College Bachelors Degree Graduate or Professional Degree 64
65 Several occupational groups rely heavily on foreign-born, non-citizen workers Foreign-Born, Non-Citizen Workers % of Total Occupation Workforce Occupation Group Construction & extraction 65, % Cleaning & maintenence 52, % Farming, fishing, & forestry 1,15 38.% Food preparation & serving 43, % Production 14,22 28.% Healthcare support 1,3 21.6% Personal care & service 21, % Transportation & material moving 22,87 2.7% Life, physical, & social science 1, % Installation, maintenance, & repair 9, % Sales 33, % Computer & mathematical 21,52 1.1% Healthcare practitioners 11,42 8.7% Financial specialists 8,7 8.6% Office & administrative support 27,98 8.6% Source: 216 American Community Survey, Public Use Microdata Sample (PUMS) files 65
66 Housing Market Trends

67 Inventories of Existing Homes Month-Over-Year , MSA % Chg Inv Inventory Feb -4.1% Source: Bright MLS, GMU Center for Regional Analysis. Total monthly inventory includes listings active at the end of the month plus sales during the month.
68 (2.) (4.) (6.) Percent Change in Inventories of Existing Homes Month-Over-Year 2 219, MSA Feb -4.1% Source: Metropolitan Regional Information Systems (MRIS), GMU Center for Regional Analysis. Total monthly inventory includes listings active at the end of the month plus sales during the month.
69 16, 14, 12, 1, 8, 6, 4, 2, Existing Home Sales Washington MSA Through February Month Moving Average ,452 Feb 219 Source: Metropolitan Regional Information Systems (MRIS), GMU Center for Regional Analysis
70 2, 1,5 1, , -1,5-2, Existing Home Sales Washington MSA Month-Over-Year Change -399 Feb 219 Source: Metropolitan Regional Information Systems (MRIS), GMU Center for Regional Analysis
71 3, Washington MSA Building Permits , 3-Month Moving Avg. 2,5 2, Feb 2,292 1,5 1, 5 Source: Census Bureau, GMU Center for Regional Analysis
72 3, 2,5 2, (s) Inventory and Permits Washington MSA Permits Inventory ,5 2 1, Source: Metropolitan Regional Information Systems (MRIS), GMU Center for Regional Analysis
73 8% 6% MOTY Change in Existing Sales and Permits Washington MSA (12 month Moving Average) (s) Permits Existing Home Sales 4% 2% % -2% -4% Source: Metropolitan Regional Information Systems (MRIS), GMU Center for Regional Analysis
74 (s) (s) Median House Sales Price Washington MSA $417 K Feb 219 Source: Metropolitan Regional Information Systems (MRIS), GMU Center for Regional Analysis
75 Median House Sales Price (s) 7 12 per. Mov. Avg. (Washington MSA) 12 per. Mov. Avg. (Arlington) 12 per. Mov. Avg. (Alexandria City) Source: Metropolitan Regional Information Systems (MRIS), GMU Center for Regional Analysis
76 (s) 7 Median House Sales Price Washington MSA Arlington $565K Feb 219 $416 K Feb Source: Metropolitan Regional Information Systems (MRIS), GMU Center for Regional Analysis
77 Median House Sales Price ($s) 7 12 per. Mov. Avg. (Arlington) 12 per. Mov. Avg. (Fairfax County) 12 per. Mov. Avg. (Loudoun County) Source: Metropolitan Regional Information Systems (MRIS), GMU Center for Regional Analysis
78 Number of Sales ($s) per. Mov. Avg. (Arlington) 12 per. Mov. Avg. (Fairfax County) 12 per. Mov. Avg. (Loudoun County) Source: Metropolitan Regional Information Systems (MRIS), GMU Center for Regional Analysis
79 Median Sales Price Percent Change (MOTYC) Washington MSA Source: Metropolitan Regional Information Systems (MRIS), GMU Center for Regional Analysis
80 % Average Sales Price Percent Change (MOTYC) Washington MSA Source: Metropolitan Regional Information Systems (MRIS), GMU Center for Regional Analysis Feb. = $467K
81 % Average Sales Price Percent Change (MOTYC) District of Columbia Source: Metropolitan Regional Information Systems (MRIS), GMU Center for Regional Analysis Feb. = $692K
82 Average Sales Price Percent Change (MOTYC) Suburban Maryland % Source: Metropolitan Regional Information Systems (MRIS), GMU Center for Regional Analysis Feb. = $381K
83 Average Sales Price Percent Change (MOTYC) Northern Virginia % Source: Metropolitan Regional Information Systems (MRIS), GMU Center for Regional Analysis Feb. = $485K
84 Total Listings Per Sale Sep Each Year PW PG ARL MONT FFX LDN DC Source: Metropolitan Regional Information Systems (MRIS), GMU Center for Regional Analysis
85 Total Active Listings Per Sale February Each Year Metro Area Source: Metropolitan Regional Information Systems (MRIS), GMU Center for Regional Analysis
86 Average Home Sales Price Northern VA - Single Family Detached (%) MOTY Change 12 per. Mov. Avg. ($ Sales) (s) 2 $ $7 $6 $5 $4 $3 $2 $1-5 $ February 219 = $644,988, +4.3% Source: Metropolitan Regional Information Systems (MRIS), GMU Center for Regional Analysis
87 Average Home Sales Price Northern VA - Single Family Attached (%) MOTY Change 12 per. Mov. Avg. ($ Sales) (s) 3 $ $5 $4 $3 $2 $1-5 $ Source: Metropolitan Regional Information Systems (MRIS), GMU Center for Regional Analysis February 219 = $472,56, +5.1%
88 Average Home Sales Price Northern VA - Condos (%) MOTY Change 12 per. Mov. Avg. ($ Sales) (s) 25 $ $35 $3 $25 $2 $15 $1 $5-1 $ Source: Metropolitan Regional Information Systems (MRIS), GMU Center for Regional Analysis February 219 = $327,779,.7%
89 Average Home Sales Price DC- Single Family Detached (%) MOTY Change 12 per. Mov. Avg. ($ Sales) (s) 6 $1,4 5 $1,2 4 3 $1, 2 $8 1 $6 $ $2-3 $ Source: Metropolitan Regional Information Systems (MRIS), GMU Center for Regional Analysis February 219 = $956,117, -19.3%
90 Average Home Sales Price DC- Single Family Attached (%) MOTY Change 12 per. Mov. Avg. ($ Sales) (s) 4 $1, 3 $9 $8 2 $7 1 $6 $5 $4-1 $3 $2-2 $1-3 $ Source: Metropolitan Regional Information Systems (MRIS), GMU Center for Regional Analysis February 219 = $78,811, +16.2%
91 (%) MOTY Change 12 per. Mov. Avg. ($ Sales) (s) 3 $ Average Home Sales Price DC- Condos Source: Metropolitan Regional Information Systems (MRIS), GMU Center for Regional Analysis February 219 = $512,695, -2.9% $6 $5 $4 $3 $2 $1 $
92 Where are we? We are growing: Some diversification Some catch-up Recent job growth across all wage levels Growth will continue in 217, but at a moderating pace Advantages Government Center International Institutions Connectivity to the World Concentration of Leaders Access to capital High Quality-of-Life Diverse Population Higher Education Educated Work Force Advanced Occupational Specializations Challenges Drain the swamp/sequester Further market shifts needed Cost of living/doing business Mobility Access to capital Regional branding / cooperation Globally competitive? Understanding changing nature of jobs Productivity
93 Thank You Questions cra.gmu.edu
Washington Area Economy: Performance and Outlook
 Washington Area Economy: Performance and Outlook Center for Regional Analysis Schar School of Policy and Government George Mason University June 18, 218 U.S. Gross Domestic Product 6. Quarterly Change
Washington Area Economy: Performance and Outlook
 Washington Area Economy: Performance and Outlook Center for Regional Analysis Schar School of Policy and Government George Mason University August 22, 218 6. U.S. Gross Domestic Product Quarterly Change
Market and Economic Briefing. Washington Area Economy: Performance and Outlook
 Market and Economic Briefing Washington Area Economy: Performance and Outlook Terry L. Clower, Ph.D. Director, Center for Regional Analysis Schar School of Policy and Government George Mason University
Housing Market Trends in the Washington Area
 Housing Market Trends in the Washington Area Mark White, Ph.D. Deputy Director, Center for Regional Analysis Schar School of Policy and Government George Mason University March 1, 218 6. U.S. Gross Domestic
Washington Area Economy: Performance and Outlook
 Washington Area Economy: Performance and Outlook Presentation to: Greater Washington Association of Financial Professionals Mark C. White, Ph.D. Deputy Director Center for Regional Analysis Schar School
Washington Area Economy: Performance and Outlook
 Washington Area Economy: Performance and Outlook Presentation to: Southeast Fairfax Development Corporation Mount Vernon Lee Chamber of Commerce Terry L. Clower, Ph.D. Director, Center for Regional Analysis
The U.S. and Washington Area Economic Performance and Outlook
 // The U.S. and Washington Area Economic Performance and Outlook Center for Regional Analysis School of Public Policy George Mason University January, 3 Recession Recovery Patterns of GDP Past Four Recessions
The U.S. and Washington Area Economic Performance and Outlook
 /8/ The U.S. and Washington Area Economic Performance and Outlook Center for Regional Analysis School of Public Policy George Mason University November 8, Recession Recovery Patterns of GDP Past Four Recessions
NonProfit Speakers Series. The Economic Outlook for The Washington Metropolitan Area
 /3/ NonProfit Speakers Series The Economic Outlook for The Washington Metropolitan Area Stephen S. Fuller, Ph.D. Dwight Schar Faculty Chair and University Professor Director, Center for Regional Analysis
The U.S. Economy s Current Performance and Outlook
 Delta Associates Spring Seminar The U.S. and Washington Area Economies: Current Performance and Outlook: 24-29 Stephen S. Fuller, Ph.D. Dwight Schar Faculty Chair and University Professor Director, Center
Washington Area & Northern Virginia Economic Performance and Outlook
 Washington Area & Northern Virginia Economic Performance and Outlook Presentation to Northern Virginia Association of Realtors Economic Summit Terry L. Clower, Ph.D. Center for Regional Analysis Schar
SAME/ACEC June Conference. The Outlook for the U.S. and Washington Area Economies In 2013 and Beyond
 6/24/23 SAME/ACEC June Conference The Outlook for the U.S. and Washington Area Economies In 23 and Beyond Stephen S. Fuller, Ph.D. Dwight Schar Faculty Chair and University Professor Director, Center for
The U.S. Economy s Current Performance and Outlook
 /3/4 Board of Directors, Northern Virginia Association of Realtors The Current Economic Outlook & Area Housing Market Conditions Stephen S. Fuller, Ph.D. Dwight Schar Faculty Chair and University Professor
Economic Outlook and Housing Market Forecast
 Economic Outlook and Housing Market Forecast NVAR Housing Finance Summit Terry L, Clower, Ph.D. Director, Center for Regional Analysis Schar School of Policy and Government George Mason University May
The Washington Area Economy: Repositioning for Renewed Growth
 Finance and Administration Roundtable The Washington Area Economy: Repositioning for Renewed Growth Stephen S. Fuller, Ph.D. Dwight Schar Faculty Chair and University Professor Director, Center for Regional
Washington Area Economy: Performance and Outlook
 Washington Area Economy: Performance and Outlook Presentation to: Southeast Fairfax Development Corporation Mount Vernon Lee Chamber of Commerce Terry L. Clower, Ph.D. Director, Center for Regional Analysis
Delta Associates. The U.S. and Washington Area Economic Performance and Outlook
 // Delta Associates The U.S. and Washington Area Economic Performance and Outlook Stephen S. Fuller, Ph.D. Dwight Schar Faculty Chair and University Professor Director, Center for Regional Analysis George
Washington Building Congress. The U.S. and Washington Area Economic Performance and Outlook
 Washington Building Congress The U.S. and Washington Area Economic Performance and Outlook Stephen S. Fuller, Ph.D. Dwight Schar Faculty Chair and University Professor Director, Center for Regional Analysis
The Washington Area s Post- Federally Dependent Economy
 Potomac Officers Club Post-Sequestration Summit The Washington Area s Post- Federally Dependent Economy Stephen S. Fuller, Ph.D. Dwight Schar Faculty Chair and University Professor Director, Center for
Recent Economic Trends and Comparative Performance: U.S., Commonwealth of Virginia, Washington Metropolitan Area and Northern Virginia
 8// Capital One Bank and the GMU Center for Regional Analysis The Washington Area Economy: A Mid-Year Review and Early Forecast for Stephen S. Fuller, Ph.D. Dwight Schar Faculty Chair and University Professor
Finance and Administration Roundtable. The Washington Area Economy: Repositioning for Renewed Growth
 5/2/25 Finance and Administration Roundtable The Washington Area Economy: Repositioning for Renewed Growth Stephen S. Fuller, Ph.D. Dwight Schar Faculty Chair and University Professor George Mason University
The Outlook for the Washington Area and Northern Virginia Economies
 9// Northern Virginia Association of Realtors 5 th Annual Economic Summit The Outlook for the Washington Area and Northern Virginia Economies Stephen S. Fuller, PhD Director, Center for Regional Analysis
The Breakfast Group. The Outlook for the U.S. and Washington Area Economies In 2013 and Beyond
 The Breakfast Group The Outlook for the U.S. and Washington Area Economies In 2013 and Beyond Stephen S. Fuller, Ph.D. Dwight Schar Faculty Chair and University Professor Director, Center for Regional
The Fairfax County Chamber of Commerce. The Driving Forces Behind Fairfax County s Future Growth
 1/22/214 The Fairfax County Chamber of Commerce The Driving Forces Behind Fairfax County s Future Growth Stephen S. Fuller, Ph.D. Dwight Schar Faculty Chair and University Professor Director, Center for
The US and Northern Virginia Economy Trends and Outlook
 NVBCC Annual Meeting The US and Northern Virginia Economy Trends and Outlook Lisa A. Sturtevant, PhD Center for Regional Analysis School of Public Policy George Mason University November 8, 1 Recession
The U. S. Economy: Current Performance and Outlook
 9// D.C. Institutional Investor Conference The Outlook for the U.S., Washington Area and District of Columbia Economies Stephen S. Fuller, Ph.D. Dwight Schar Faculty Chair and University Professor George
What Will The Montgomery County Economy Look Like in 2017
 Montgomery County Chamber of Commerce What Will The Montgomery County Economy Look Like in 217 Stephen S. Fuller, Ph.D. Dwight Schar Faculty Chair and University Professor Director, Center for Regional
The Current Performance and Near-Term Outlook for The U.S. and Washington Region s Economies Plus Prince William County
 Prince William County Chamber of Commerce The Current Performance and Near-Term Outlook for The U.S. and Washington Region s Economies Plus Prince William County 2015-2025 Stephen S. Fuller, Ph.D. The
Northwest Federal Credit Union
 3/28/211 Northwest Federal Credit Union The U.S. and Washington Area Economic Performance and Outlook Stephen S. Fuller, PhD Dwight Sh Schar Faculty Chair and University it Professor Director, Center for
The Vision Series,
 The Vision Series, 212-213 The Washington Area Economy: Transitioning From Federal Dependency to a Global Business Base Stephen S. Fuller, Ph.D. Dwight Schar Faculty Chair and University Professor Director,
What Will The Montgomery County Economy Look Like in 2017
 Leadership Montgomery Breakfast Club What Will The Montgomery County Economy Look Like in 217 Stephen S. Fuller, Ph.D. Dwight Schar Faculty Chair and University Professor Director, Center for Regional
The Commonwealth of Virginia s Economy: Recession and Recovery
 11/18/215 House Appropriations Committee Retreat The Virginia and Northern Virginia Economies: Current Trends and Future Prospects Stephen S. Fuller, Ph.D. Dwight Schar Faculty Chair and University Professor
The Outlook for the U.S. and Washington Area Economies In 2013 and Beyond
 Boland Open House The Outlook for the U.S. and Washington Area Economies In 213 and Beyond Stephen S. Fuller, Ph.D. Dwight Schar Faculty Chair and University Professor Director, Center for Regional Analysis
Economic Performance and Outlook: Washington Metro Area and Northern Virginia
 Economic Performance and Outlook: Washington Metro Area and Northern Virginia Dr. Terry L. Clower, Ph.D. Director, Center for Regional Analysis School of Public Policy George Mason University e 22, 215
Hobart and Wm. Smith Colleges. The Economy of the Washington Metropolitan Area: Its Performance and What Makes It Different
 Hobart and Wm. Smith Colleges The Economy of the Washington Metropolitan Area: Its Performance and What Makes It Different Stephen S. Fuller, Ph.D. Dwight Schar Faculty Chair and University Professor Director,
HAND/CNHED Joint Meeting. Washington Area Economy and Housing Market Trends and Outlook
 1/26/12 HAND/CNHED Joint Meeting Washington Area Economy and Housing ket Trends and Outlook Lisa A. Sturtevant, PhD Center for Regional Analysis School of Public Policy George Mason University October
Atlanta Regional Commission Link. Overview of the Greater Washington Region: Trends and Challenges
 Atlanta Regional Commission Link Overview of the Greater Washington Region: Trends and Challenges Stephen S. Fuller, Ph.D. Dwight Schar Faculty Chair and University Professor Director, Center for Regional
Montgomery County, Maryland Economic Outlook, 2020
 11/9/211 Montgomery County Council Montgomery County, Maryland Economic Outlook, 22 Stephen S. Fuller, PhD Dwight Schar Faculty Chair and University Professor Director, Center for Regional Analysis School
The Washington Region s Housing Market and Outlook
 The Washington Region s Housing Market and Outlook John McClain, AICP Senior Fellow and Deputy Director, Center for Regional Analysis, School of Public Policy George Mason University January 14, 2009 U.S.
NVTC. Economic Performance and Outlook
 3//11 NVTC The U.S. and Washington Area Economic Performance and Outlook John McClain, AICP, Senior Fellow and Deputy Director, Center for Regional Analysis School of Public Policy, George Mason University
WA S H I N G TO N / BALT I M O R E
 D E L T A A S S O C I A T E S WA S H I N G TO N / BALT I M O R E R E A L E S T A T E M A R K E T O V E R V I E W MULTIFAMILY MARKET OVERVIEW 0 9. 2 9. 2 0 1 5 B y W i l l i a m R i c h, C R E P r e s i
Q1 16 ECONOMIC OUTLOOK Washington Metro Area
 www.capitalbankmd.com PARTNERS in YOUR VISION Q1 16 ECONOMIC OUTLOOK Washington Metro Area Dr. Stephen Fuller Published March 216 Capital Bank N.A. 1 Church Street, Suite 3 Rockville, MD 28 www.capitalbankmd.com
Metropolitan Washington Area Key Economic & Demographic Indicators
 Metropolitan Washington Area Key Economic & Demographic Indicators Arlington County Community Facilities Study March 11, 2015 Lisa A. Sturtevant, PhD Vice President of Research National Housing Conference
The Washington Region s Current Economic Performance and Near-Term Outlook
 The Washington Region s Current Economic Performance and Near-Term Outlook Stephen S. Fuller, Ph.D. Dwight Schar Faculty Chair and University Professor Director, The Stephen S. Fuller Institute for Research
Transmission of material in this release is embargoed until 8:30 a.m. (EDT) Wednesday, October 31, 2012
 Wednesday, October 31, 2012") Transmission of material in this release is embargoed until 8:30 a.m. (EDT) Wednesday, October 31, USDL-12-2162 Technical information: Media contact: (202) 691-6199 NCSinfo@bls.gov www.bls.gov/ect (202)
Transmission of material in this release is embargoed until 8:30 a.m. (EDT) Wednesday, October 31, USDL-12-2162 Technical information: Media contact: (202) 691-6199 NCSinfo@bls.gov www.bls.gov/ect (202)
Pendleton County Labor Market Summary Update November 2006
 1 Labor Market Summary Update November 26 Copyright 26 WVU Research Corporation College of Business and Economics West Virginia University www.bber.wvu.edu by George W. Hammond, Ph.D. Anthony Gregory This
Economic Overview Fairfax / Falls Church. October 23, 2017
 Economic Overview Fairfax / Falls Church October 23, 2017 DEMOGRAPHIC PROFILE... 3 EMPLOYMENT TRENDS... 5 UNEMPLOYMENT RATE... 5 WAGE TRENDS... 6 COST OF LIVING INDEX... 6 INDUSTRY SNAPSHOT... 7 OCCUPATION
The U.S. and California Is The Recovery Here at Last? UCLA Anderson School of
 The U.S. and California Is The Recovery Here at Last? Jerry Nickelsburg Senior Economist UCLA Anderson Forecast State of the County January 20, 2010 SEPTEMBER 2008 In September 2008 Financial Markets Stopped
NORTH TEXAS ECONOMY Emily Kerr Federal Reserve Bank of Dallas October 19, 2017
 NORTH TEXAS ECONOMY Emily Kerr October 19, 217 The views expressed are of the speaker and should not be attributed to the Dallas Fed or the Federal Reserve System. North Texas Overview Home to over 7.2
What Does Amazon s HQ2 Mean for the Washington Region? November 13, 2018
 About the Stephen S. Fuller Institute The Stephen S. Fuller Institute is the premier source for information and analysis of Greater Washington s regional economy. Through consistent monitoring of regional
Round 9.0 Cooperative Forecast Results and Methods
 Round 9.0 Cooperative Forecast Results and Methods By Robert Ruiz, Research Manager and Pamela Zorich, Planner Coordinator Montgomery County, Round 9.0 Cooperative Forecast Participation Round 1 1976 Round
Grant County Labor Market Summary Update November 2006
 County Labor Market Summary Update November 26 Copyright 26 WVU Research Corporation College of Business and Economics West Virginia University www.bber.wvu.edu by George W. Hammond, Ph.D. Anthony Gregory
The Washington Region s Economy in 2017 and Outlook for 2018 and Beyond
 The Washington Region s Economy in 2017 and Outlook for 2018 and Beyond By Stephen S. Fuller, Ph.D. and Jeannette Chapman The Stephen S. Fuller Institute for Research on the Washington Region s Economic
Planning for the. Thinking Big & Taking The Long View. Jane Hayse Director, Center for Livable Communities Atlanta Regional Commission
 Planning for the Atlanta t Region: Thinking Big & Taking The Long View Jane Hayse Director, Center for Livable Communities Atlanta Regional Commission Transportation Access & Mobility Center for Livable
Economic Outlook and Forecast 2015
 Economic Outlook and Forecast 2015 Prince William County Fe b r u ar y 17, 2 0 15 Overview National growth Labor market improving but still weaknesses GDP growth expected to remain moderate Next 2 years
The Roadmap for the Washington Region s Future Economy: Pivoting the Region s Economy Away From Its Federal Dependence An Assessment
 The Roadmap for the Washington Region s Future Economy: Pivoting the Region s Economy Away From Its Federal Dependence An Assessment The Stephen S. Fuller Institute for Research on the Washington Region
Real Deal The U.S. and Washington Area Economic Performance and Outlook
 Real Deal 2011 The U.S. and Washington Area Economic Performance and Outlook Stephen S. Fuller, PhD Dwight Schar Faculty Chair and University Professor Director, Center for Regional Analysis George Mason
Acknowledgements. The Center for Regional Analysis would like to thank the following sponsors for their support for this research project:
 Housin using the Region s Futu uture Workforce Policy Challe allenges for Local Jurisdictions ons Final Report by Lisa A. Sturtevant, PhD Stephen S. Fuller, PhD George Maso ason University School of Public
Robert D. Cruz, PhD, Chief Economist
 Robert D. Cruz, PhD, Chief Economist Office of Economic Development and International Trade Miami-Dade County cruzr1@miamidade.gov / www.miamidade.gov/oedit Office of Economic Development and International
Texas Economic Outlook: Strong Growth Continues
 Texas Economic Outlook: Strong Growth Continues Keith Phillips Assistant Vice President and Senior Economist 1/23/18 The views expressed in this presentation are strictly those of the presenter and do
Economic Overview York County, South Carolina. February 14, 2018
 Economic Overview York County, February 14, 2018 DEMOGRAPHIC PROFILE... 3 EMPLOYMENT TRENDS... 5 UNEMPLOYMENT RATE... 5 WAGE TRENDS... 6 COST OF LIVING INDEX... 6 INDUSTRY SNAPSHOT... 7 OCCUPATION SNAPSHOT...
Economic Overview Capital District
 August 29, 2017 Economic Overview Capital District Contact: Lisa.Montiel@suny.edu DEMOGRAPHIC PROFILE... 3 EMPLOYMENT TRENDS... 5 UNEMPLOYMENT RATE... 5 WAGE TRENDS... 6 COST OF LIVING INDEX... 6 INDUSTRY
Economic Overview Loudoun County, Virginia. October 23, 2017
 Economic Overview October 23, 2017 DEMOGRAPHIC PROFILE... 3 EMPLOYMENT TRENDS... 5 UNEMPLOYMENT RATE... 5 WAGE TRENDS... 6 COST OF LIVING INDEX... 6 INDUSTRY SNAPSHOT... 7 OCCUPATION SNAPSHOT... 9 INDUSTRY
Economic Overview Prince William/Manassas. October 23, 2017
 Economic Overview Prince William/Manassas October 23, 2017 DEMOGRAPHIC PROFILE... 3 EMPLOYMENT TRENDS... 5 UNEMPLOYMENT RATE... 5 WAGE TRENDS... 6 COST OF LIVING INDEX... 6 INDUSTRY SNAPSHOT... 7 OCCUPATION
Review FY09 Subsidy Allocation
 Finance, Administration and Oversight Committee Information Item IV-D March 13, 2008 Review FY09 Subsidy Allocation Washington Metropolitan Area Transportation Authority Board Action/Information Summary
Economic Overview New York
 Report created on October 20, 2015 Economic Overview Created using: Contact: Lisa.Montiel@suny.edu DEMOGRAPHIC PROFILE...3 EMPLOYMENT TRENDS...5 UNEMPLOYMENT RATE...5 WAGE TRENDS...6 COST OF LIVING INDEX...6
NEW ENGLAND ECONOMIC OUTLOOK
 NEW ENGLAND ECONOMIC OUTLOOK Lincoln Institute of Land Policy Economic Perspectives on State and Local Taxes May 11, 2018 Mary A. Burke Senior Economist New England Public Policy Center Federal Reserve
Structure and Function of the Federal Reserve System
 1/17/17 Economic Outlook Cortney Cowley Economist Federal Reserve Bank of Kansas City Omaha Branch October, 17 The views expressed are those of the author and do not necessarily reflect the opinions of
Economic Overview Long Island
 Report created on October 20, 2015 Economic Overview Long Island Created using: Contact: Lisa.Montiel@suny.edu DEMOGRAPHIC PROFILE...3 EMPLOYMENT TRENDS...5 UNEMPLOYMENT RATE...5 WAGE TRENDS...6 COST OF
Gorfine, Schiller, & Gardyn, P.A. Real Deal Seminar
 Gorfine, Schiller, & Gardyn, P.A. Real Deal Seminar The U.S. and Washington Economies: Current Performance and Near Term Outlook Stephen S. Fuller, PhD Dwight Schar Faculty Chair and University Professor
Outlook for the Texas Economy. Luis Bernardo Torres Ruiz, Ph.D. August 26, 2016
 Outlook for the Texas Economy Luis Bernardo Torres Ruiz, Ph.D. August 26, 2016 Research Economist Texas Society of Architects Contents 1. U.S. Economic Outlook 2. Texas Economic Outlook 3. Challenges and
Economic Overview Long Island
 Report created on August 29, 2017 Economic Overview Long Island Contact: Lisa.Montiel@suny.edu DEMOGRAPHIC PROFILE... 3 EMPLOYMENT TRENDS... 5 UNEMPLOYMENT RATE... 5 WAGE TRENDS... 6 COST OF LIVING INDEX...
VOLUME FINANCE HOUSING COMMERCIAL REAL ESTATE EMPLOYMENT TRANSIT & TOURISM
 VOLUME 3 2018 EMPLOYMENT FINANCE HOUSING COMMERCIAL REAL ESTATE TRANSIT & TOURISM Published March 2018 VOLUME 3 2018 HIGHLIGHTS Unemployment in New York City fell to a record low in February 2018 NYC-based
ANALYSIS OF THE CENTRAL VIRGINIA AREA HOUSING MARKET Annual Market Report. Lisa A. Fowler, PhD. John McClain, AICP
 ANALYSIS OF THE CENTRAL VIRGINIA AREA HOUSING MARKET 2008 Annual Market Report By Lisa A. Fowler, PhD John McClain, AICP George Mason University Center for Regional Analysis The U.S. officially entered
Economic Overview City of Tyler, TX. January 8, 2018
 Economic Overview City of Tyler, TX January 8, 2018 DEMOGRAPHIC PROFILE...3 EMPLOYMENT TRENDS...5 WAGE TRENDS...5 COST OF LIVING INDEX...6 INDUSTRY SNAPSHOT...7 OCCUPATION SNAPSHOT...9 INDUSTRY CLUSTERS...
June 9, Economic Overview Billings, MT MSA
 June 9, 2016 Economic Overview Billings, MT MSA DEMOGRAPHIC PROFILE... 3 EMPLOYMENT TRENDS... 5 UNEMPLOYMENT RATE... 5 WAGE TRENDS... 6 COST OF LIVING INDEX... 6 INDUSTRY SNAPSHOT... 7 OCCUPATION SNAPSHOT...
Economic Overview Western New York
 Report created on August 29, 2017 Economic Overview Western New Contact: Lisa.Montiel@suny.edu DEMOGRAPHIC PROFILE... 3 EMPLOYMENT TRENDS... 5 UNEMPLOYMENT RATE... 5 WAGE TRENDS... 6 COST OF LIVING INDEX...
U.S. Economic and Medical Office Market Overview and Outlook. November, 2014
 2014 U.S. Economic and Medical Office Market Overview and Outlook November, 2014 Economic & Demographic Overview U.S. GDP Growth and Health Care Spending Trends GDP Health Care Expenditures Annualized
THREE DISPARATE CHICAGO-AREA HOUSING MARKETS
 Manufactured Housing Community Council ULI 2008 FALL MEETING MIAMI, FLA OCTOBER 27-28, 2008 Understanding Demographics/Market Analysis: THREE DISPARATE CHICAGO-AREA HOUSING MARKETS Three Disparate Chicago-area
The US and California Economic Outlook
 Regional Economic Forum April 25, 2018 The US and California Economic Outlook Robert A. Kleinhenz, Ph.D. Economist/Executive Director of Research LLC Outline U.S. Economy State & Region Conclusion/Looking
Economic Overview Monterey County, California. July 22, 2016
 Economic Overview Monterey July 22, 2016 DEMOGRAPHIC PROFILE... 3 EMPLOYMENT TRENDS... 5 UNEMPLOYMENT RATE... 5 WAGE TRENDS... 6 COST OF LIVING INDEX... 6 INDUSTRY SNAPSHOT... 7 OCCUPATION SNAPSHOT...
ECONOMIC IMPACT OF AMAZON S MAJOR CORPORATE HEADQUARTERS
 PREPARED FOR THE December 7, 2018 ECONOMIC IMPACT OF AMAZON S MAJOR CORPORATE HEADQUARTERS IN VIRGINIA AND THE WASHINGTON MSA Contents 1. EXECUTIVE SUMMARY... 1 ECONOMIC IMPACT 101... 2 ECONOMIC IMPACT
Texas Mid-Year Economic Outlook: Strong Growth Continues
 Texas Mid-Year Economic Outlook: Strong Growth Continues Keith Phillips Assistant Vice President and Senior Economist 9/27/18 The views expressed in this presentation are strictly those of the presenter
Economic Overview. Lawrence, KS MSA
 Economic Overview Lawrence, KS MSA March 5, 2019 DEMOGRAPHIC PROFILE... 3 EMPLOYMENT TRENDS... 5 UNEMPLOYMENT RATE... 5 WAGE TRENDS... 6 COST OF LIVING INDEX... 7 INDUSTRY SNAPSHOT... 8 OCCUPATION SNAPSHOT...
DFW Real Estate FAIRcast. Britt Fair April 1, Fair Texas Title 8201 Preston Road Suite 160 Dallas, TX 75225
 DFW Real Estate FAIRcast Britt Fair April 1, 2019 Fair Texas Title 8201 Preston Road Suite 160 Dallas, TX 75225 Interest Rate Improvement Rates hit all-time lows in July 2016 but rose through Nov 2018
Current Economic Review April 16, 2014
 Current Economic Review April 16, 2014 Brian Bonnenfant Project Manager Center for Regional Studies University of Nevada, Reno 784-1771 bonnen@unr.edu 230,000 225,000 **Peak = 228,100 Emp **Start of Great
Economic Overview Mohawk Valley
 Report created on August 29, 2017 Economic Overview Mohawk Valley Contact: Lisa.Montiel@suny.edu DEMOGRAPHIC PROFILE... 3 EMPLOYMENT TRENDS... 5 UNEMPLOYMENT RATE... 5 WAGE TRENDS... 6 COST OF LIVING INDEX...
Assessing Alexandria/Arlington s Regional Labor Market
 Assessing Alexandria/Arlington s Regional Labor Market Mark C. White, Ph.D. Center for Regional Analysis Schar School of Policy and Government George Mason University March 6, 2017 Agenda Key demographic
DEMOGRAPHIC PROFILE...3 EMPLOYMENT TRENDS...5 UNEMPLOYMENT RATE...5 WAGE TRENDS...6 COST OF LIVING INDEX...6 INDUSTRY SNAPSHOT...7
 March 14, 2017 DEMOGRAPHIC PROFILE...3 EMPLOYMENT TRENDS...5 UNEMPLOYMENT RATE...5 WAGE TRENDS...6 COST OF LIVING INDEX...6 INDUSTRY SNAPSHOT...7 OCCUPATION SNAPSHOT...9 INDUSTRY CLUSTERS... 12 EDUCATION
Office of the Chief Economist National Credit Union Administration. Economic Overview. California State Examiner School.
 Office of the Chief Economist National Credit Union Administration California State Examiner School May 30, 2017 Credit Union Performance Trends Recent Data About Credit Union Performance in California,
Multifamily Market Outlook
 Multifamily Market Outlook Kim Betancourt Multifamily Economics and Market Research Multifamily Mortgage Business NMHC Research Forum April 2014 1 2 Real Estate Fundamentals: Demographics Favorable Demographics
October 28, Economic Overview Yellowstone County, Montana
 October 28, 2016 Economic Overview Yellowstone DEMOGRAPHIC PROFILE...3 EMPLOYMENT TRENDS...5 UNEMPLOYMENT RATE...5 WAGE TRENDS...6 COST OF LIVING INDEX...6 INDUSTRY SNAPSHOT...7 OCCUPATION SNAPSHOT...9
The Economic Outlook for 2007
 The Economic Outlook for 7 Harvey Rosenblum Executive Vice President & Director of Research Federal Reserve Bank of Dallas Presented (with minor modifications) by: John V. Duca, Vice President and Senior
 Robert D. Cruz, PhD, Chief Economist Miami-Dade County 305-375-1879 cruzr1@miamidade.gov www.miamidade.gov/economicdevelopment Department of Regulatory and Economic Resources Page 1 Local economic indicators
Tyler Area Economic Overview
 Tyler Area Economic Overview Demographic Profile. 2 Unemployment Rate. 4 Wage Trends. 4 Cost of Living Index...... 5 Industry Clusters. 5 Occupation Snapshot. 6 Education Levels 7 Gross Domestic Product
Projected Job Growth
 1 Projected Job Growth Baton Rouge is projected to increase employment by 1.1% in 2018, which translates into approximately 4,500 new jobs Percentage change in nonfarm jobs* Actual Growth YTD Actual Growth
VOLUME FINANCE HOUSING COMMERCIAL REAL ESTATE EMPLOYMENT TRANSIT & TOURISM
 VOLUME 4 2018 EMPLOYMENT FINANCE HOUSING COMMERCIAL REAL ESTATE TRANSIT & TOURISM Published April 2018 VOLUME 4 2018 HIGHLIGHTS Unemployment in New York City remained at a record low in March 2018 Median
Economic Overview Marlboro County Labor Shed. June 29, 2016
 Economic Overview Marlboro County Labor June 29, 2016 DEMOGRAPHIC PROFILE...3 EMPLOYMENT TRENDS...5 UNEMPLOYMENT RATE...5 WAGE TRENDS...6 COST OF LIVING INDEX...6 INDUSTRY SNAPSHOT...7 OCCUPATION SNAPSHOT...9
HIGH AND WIDE: INCOME INEQUALITY GAP IN THE DISTRICT ONE OF BIGGEST IN THE U.S. By Wes Rivers
 An Affiliate of the Center on Budget and Policy Priorities 820 First Street NE, Suite 510 Washington, DC 20002 (202) 408-1080 Fax (202) 325-8839 www.dcfpi.org March 13, 2014 HIGH AND WIDE: INCOME INEQUALITY
ECONOMIC OVERVIEW DuPage County, Illinois
 ECONOMIC OVERVIEW DuPage County, Illinois DEMOGRAPHIC PROFILE... 3 EMPLOYMENT TRENDS... 5 UNEMPLOYMENT RATE... 5 WAGE TRENDS... 6 COST OF LIVING INDEX... 7 INDUSTRY SNAPSHOT... 8 OCCUPATION SNAPSHOT...