William Ellis Middle
|
|
|
- Jeffery Daniel
- 5 years ago
- Views:
Transcription

1 NC School District/300 Davie County/Middle School William Ellis Middle Final Campus Assessment Report March 10, 2017 PARSONS
2 Campus Assessment Report Table of Contents Campus Executive Summary 5 Campus Dashboard Summary 8 Campus Condition Summary Main 11 Executive Summary 11 Dashboard Summary 12 Condition Summary 13 Photo Album 14 Condition Detail 15 System Listing 16 System Notes 18 Renewal Schedule 31 Forecasted Sustainment Requirement 33 Deficiency Summary By System 34 Deficiency Summary By Priority 35 Deficiency By Priority Investment 36 Deficiency Summary By Category 37 Deficiency Details By Priority Tractor Shed 39 Executive Summary 39 Dashboard Summary 40 Condition Summary 41 Photo Album 42 Condition Detail 43 System Listing 44 System Notes 45 Renewal Schedule 47 Forecasted Sustainment Requirement 48 Deficiency Summary By System 49 Mar 10, 2017 Page 2 of 91
3 Campus Assessment Report Deficiency Summary By Priority 50 Deficiency By Priority Investment 51 Deficiency Summary By Category 52 Deficiency Details By Priority Concessions/RR 54 Executive Summary 54 Dashboard Summary 55 Condition Summary 56 Photo Album 57 Condition Detail 58 System Listing 59 System Notes 60 Renewal Schedule 65 Forecasted Sustainment Requirement 67 Deficiency Summary By System 68 Deficiency Summary By Priority 69 Deficiency By Priority Investment 70 Deficiency Summary By Category 71 Deficiency Details By Priority 72 Site 73 Executive Summary 73 Dashboard Summary 74 Condition Summary 75 Photo Album 76 Condition Detail 77 System Listing 78 System Notes 79 Renewal Schedule 85 Forecasted Sustainment Requirement 86 Deficiency Summary By System 87 Deficiency Summary By Priority 88 Mar 10, 2017 Page 3 of 91
4 Campus Assessment Report Deficiency By Priority Investment 89 Deficiency Summary By Category 90 Deficiency Details By Priority 91 Mar 10, 2017 Page 4 of 91
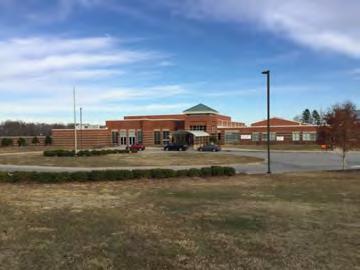
5 Campus Assessment Report - William Ellis Middle Campus Executive Summary Building condition is evaluated based on the functional systems and elements of a building and organized according to the UNIFORMAT II Elemental Classification. The grouping of these systems and elements and applying a current replacement value to them develops a representative building cost model. Cost Models are developed for similar building types and functions. Systems and their elements are evaluated based on their current replacement values, life cycles, installation dates and next renewal dates. Systems and their elements that are within their useful lives are further evaluated to identify current deficient conditions that may have a significant impact on a system's or element's remaining service life, and to determine if they are beyond their predicted expected life. The system's or element's current replacement value is based on RS Means Commercial Cost Data. Following are the cost model's system details for this facility. The Replacement Value is the amount needed to replace the property of the same present scope. The Repair Cost (the sum of the cost to repair/replace the Deficiencies) represents the budgeted contractor-installed costs plus owner's soft costs for the repair, replacement or renewal for a component or system level deficiency. It excludes contributing costs for other components or systems that might also be associated with the corrective actions due to packaging of the work. Facility Condition Index ( FCI) is an industry-standard measurement of facility condition calculated as the ratio of the costs to correct a facility's deficiencies (Condition Needs) to the facility's Current Replacement Value. It ranges from 0% (new) to 100% (very poor - beyond service life). The Remaining Service Life Index (RSLI) is calculated as the sum of a renewable system's Remaining Service Life (RSL) divided by the sum of a system's Replacement Value (both values exclude soft-cost to simplify calculation updates) expressed as a percentage ranging from 100% (new) to 0% (expired). The relationship between the key metrics FCI and RSLI is an important indicator, at either the facility, building, system, or component levels, of the condition trend and the imminent need for capital renewal. These indices exist in an inverse relationship wherein the FCI increases when systems reach their expected life-cycle age, whereas the RSLI decreases annually indicating the relative time remaining before reaching the life-cycle expiration age. For example, a facility or a system with a high RSLI and a low FCI indicates it is in the early portion of its useful life. However, a low RSLI indicates that expiration dates are approaching at which point the FCI would increase. The term FCA Score is the inverse of Total FCI and calculated as 100-Total FCI (without the %) where 100 is best and 0 is worst condition.. Gross Area (SF): Year Built: 93, Last Renovation: Replacement Value: Repair Cost: Total FCI: Total RSLI: $23,437,233 $171, % % FCA Score: Description: GENERAL William Ellis Middle School campus is located at144 William Ellis Drive, Advance, NC. The campus consists of a 92,255 square foot one-story building constructed in There have been no additions and no major renovations. There is also a storage garage constructed in 2007 and a concessions/restroom building constructed in This report contains condition and adequacy data collected during the Facility Condition Assessment (FCA). Detailed condition and deficiency statements are contained in this report for the site and building elements. A. SUBSTRUCTURE Mar 10, 2017 Page 5 of 91
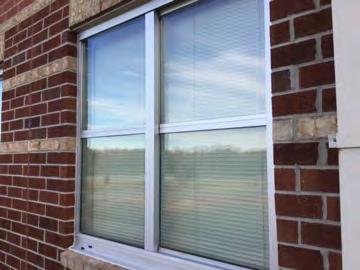
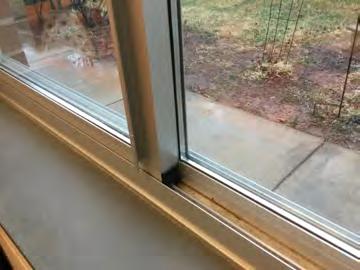
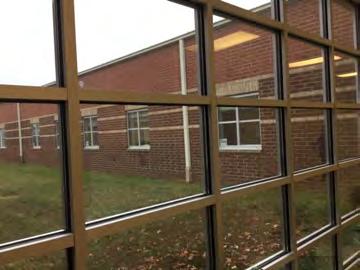
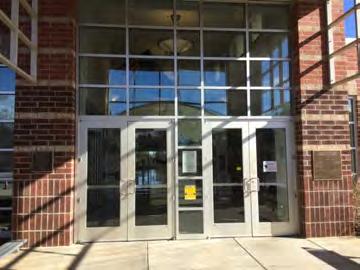
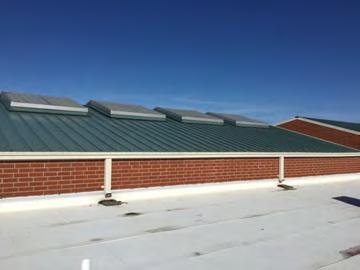
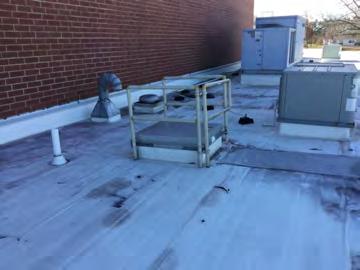
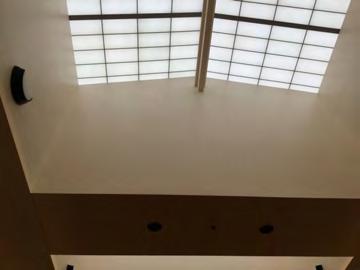
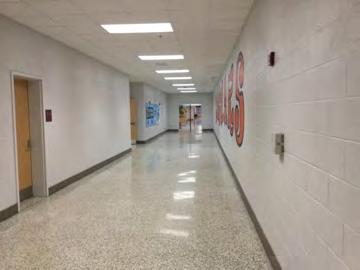
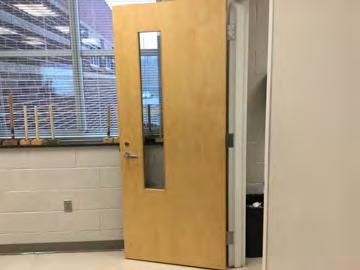
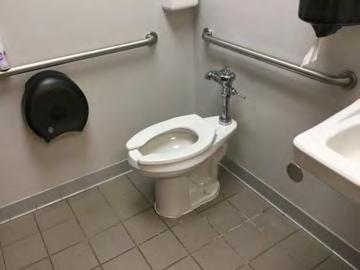
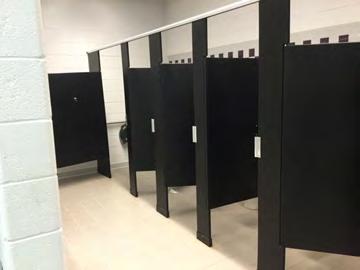
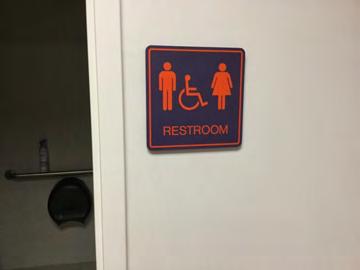
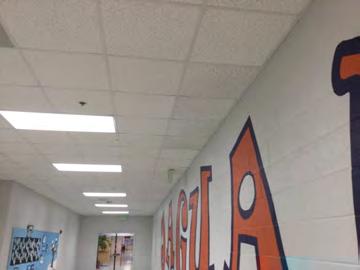
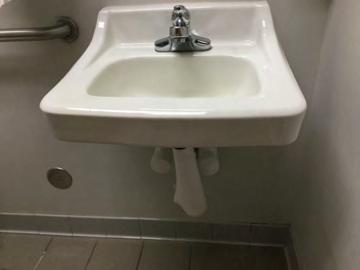
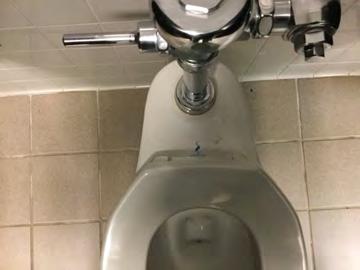
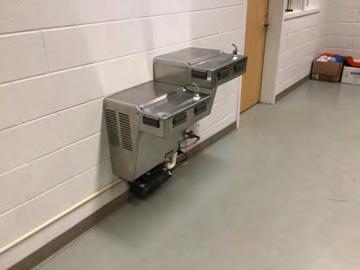
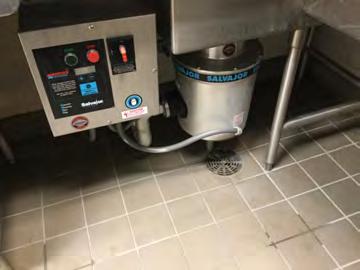
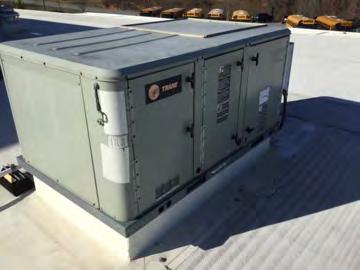
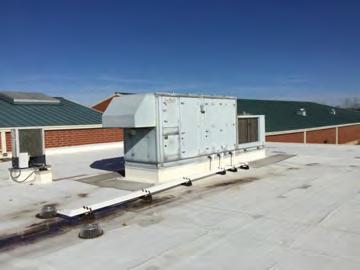
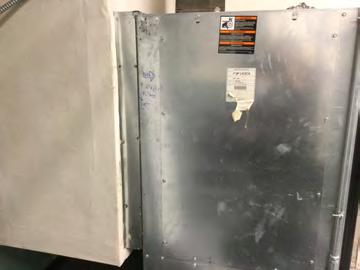
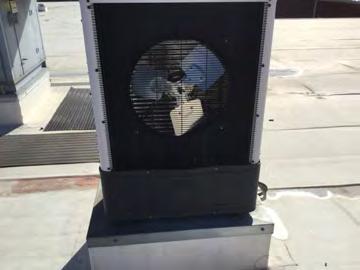
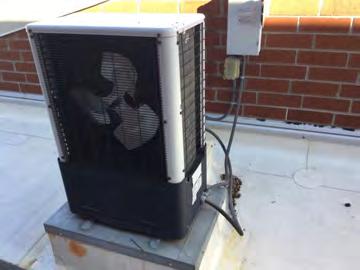
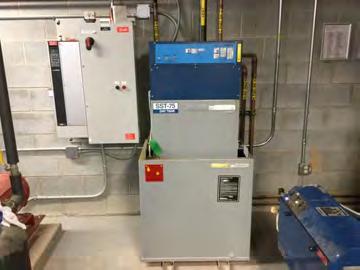
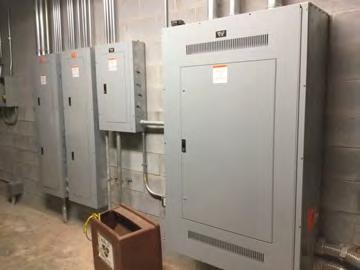
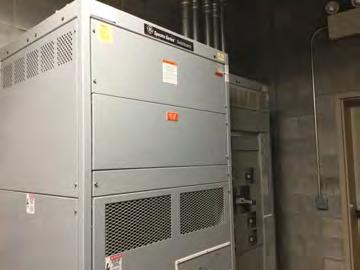
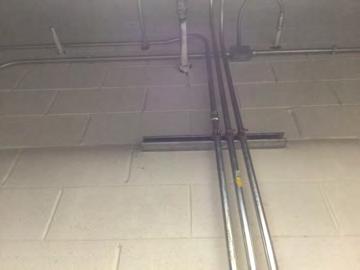
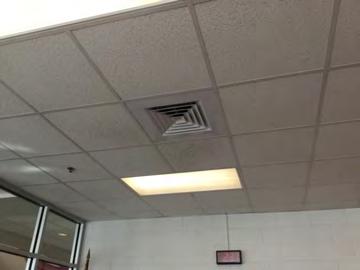
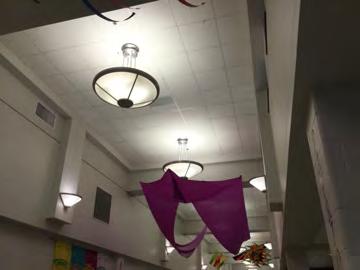
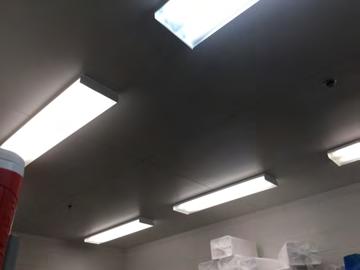
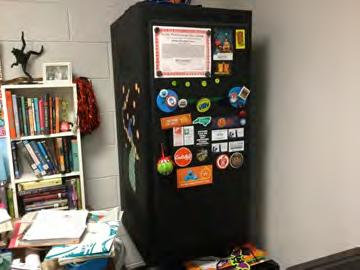
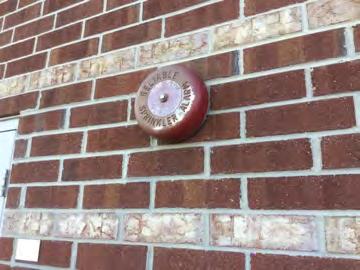
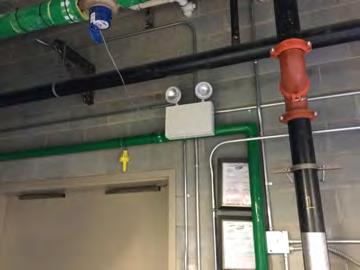
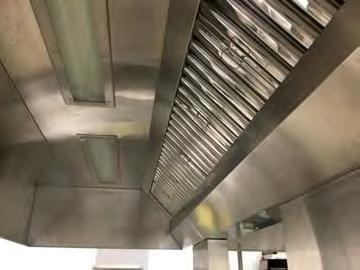
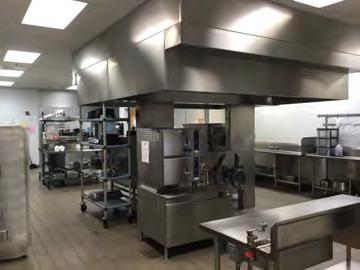
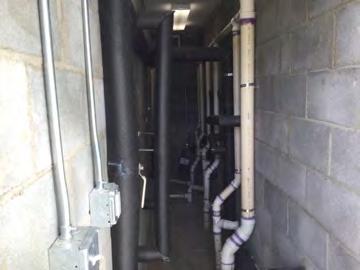
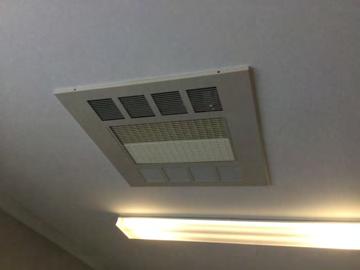
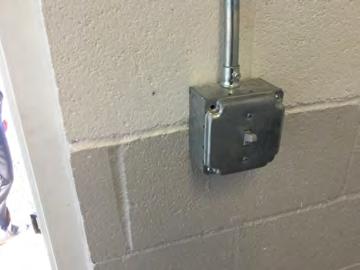
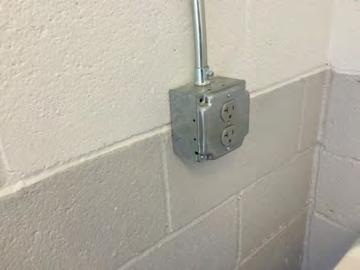
6 Campus Assessment Report - William Ellis Middle The buildings rest on slab on grade and what is assumed to be standard concrete standard foundations. There is no basement. B. SUPERSTRUCTURE Roof construction is steel frame. The exterior enclosure is composed of walls of brick veneer over CMU. Exterior windows are typically painted aluminum frame with fixed and operable panes with insulated, tinted glazing. There are clerestory windows of insulated translucent panels at the main entry hall. Exterior doors are typically aluminum with glazing. Roofing is steep pre-finished preformed metal with gutters and downspouts. There are areas of low-slope roofing of white single ply membrane. Roof openings include a roof hatch and insulated translucent panels skylights over the media center. Building entrances appear to comply with ADA requirements C. INTERIORS Partitions are typically CMU. There is a folding partition separating the stage and the cafeteria. Interior doors are typically solid core wood veneer in hollow metal frames with slot lites and lever hardware. Doors at area separations are rated assemblies. Fittings include ADA compliant building signage, whiteboards and tack boards, toilet accessories and toilet partitions, storage shelving, ramp handrails, and lockers. Wall finishes are typically paint. There is ceramic tile in toilet rooms and showers. Floor finishes include terrazzo in corridors, VCT in typical classrooms, carpet in the media center and select classrooms, wood in the gym and on the stage, ceramic/quarry tile in toilet rooms and the kitchen, and sealed concrete in utility rooms. Ceiling finishes are typically 2 x 2 suspended acoustical tiles with vinyl faced tiles in the kitchen. Other ceiling finishes include painted gypboard in toilet rooms and at decorative soffits, and painted exposed structure in the gym. D. SERVICES CONVEYING: The building has no conveying systems and none are required. PLUMBING: Plumbing fixtures are typically white porcelain. Water closets are floor mounted with lever handle flush valves. Urinals are wall-hung with lever handle flush valves. Lavatories are wall hung with two-handle or single faucets. Accessible showers are provided at locker rooms and in the school nurse space. Service sinks are floor mounted precast. Dual height drinking fountains are provided in corridors. Domestic water supply piping is soldered copper. Electric water heaters are distributed throughout the building and oil fired water heaters serve the kitchen. Sanitary drain/vent piping is PVC. Floor drains are provided in toilet rooms. Storm water drainage is PVC. Other plumbing systems are fuel oil piping. HVAC: The general HVAC system uses water source heat pumps with a 2-pipe distribution system. Supplemental heat is provided by three Weil-McClain oil-fired boilers. Supplemental cooling is provided by a BAC cooling tower. Heat pumps are located above lay-in ceilings and supply conditioned air through externally insulated sheet metal ductwork. Fresh air is introduced through roof mounted air handling units. Toilet rooms have ceiling mounted exhaust grilles ducted to fans discharging above the roof. Digital controls are centrally monitored and controlled utilizing a web-based system. FIRE PROTECTION: The building does have a fire sprinkler system. The building also has dry chemical fire protection at the kitchen hood. Fire extinguishers and cabinets are distributed near fire exits, in corridors and in other rooms where required. ELECTRICAL: The electrical system is fed from a pad mounted transformer to a 3000 amp 277/480 volt, 3-phase, 4-wire power panel. Typical lighting is T8 fluorescent lay-in fixtures. The main entrance hall, cafeteria, and media center have Mar 10, 2017 Page 6 of 91
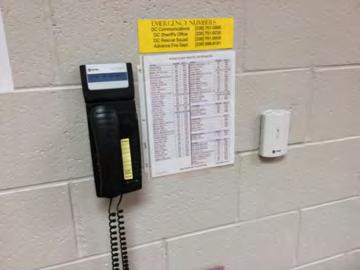
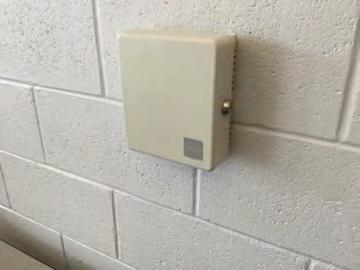
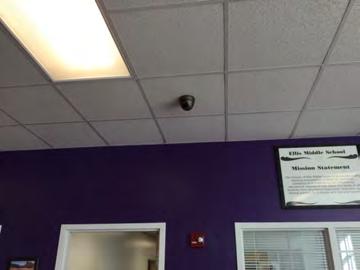
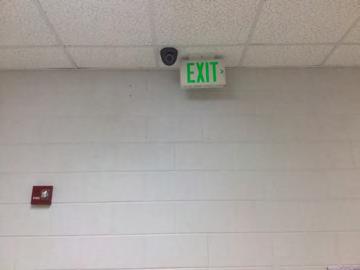
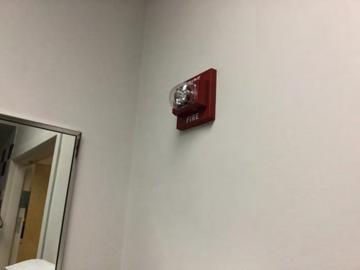
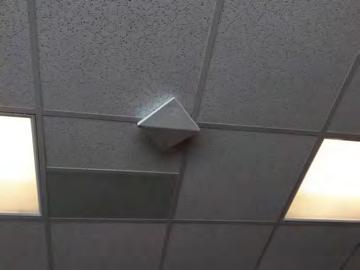
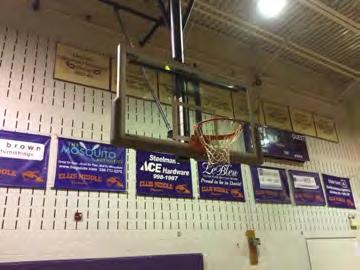
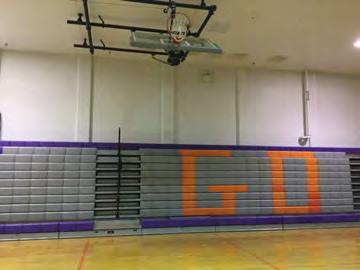
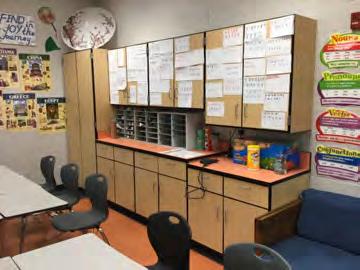
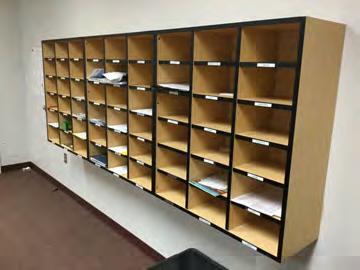
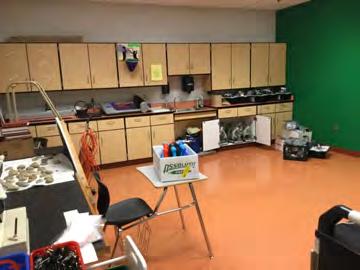
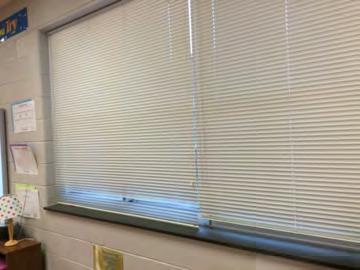
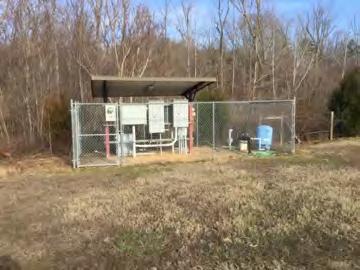
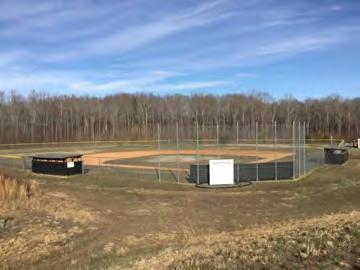
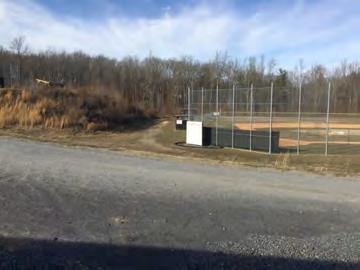
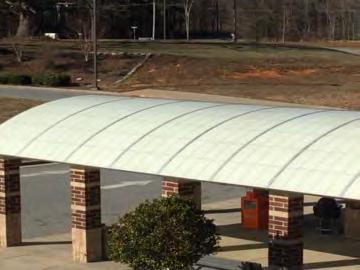
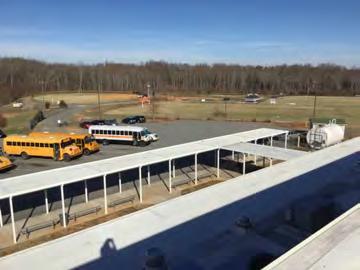
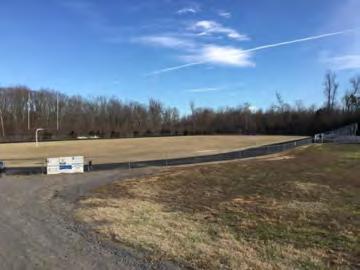
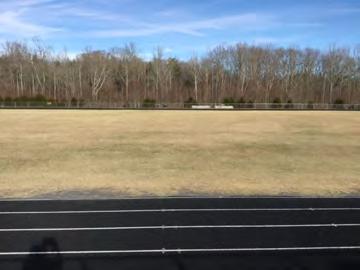
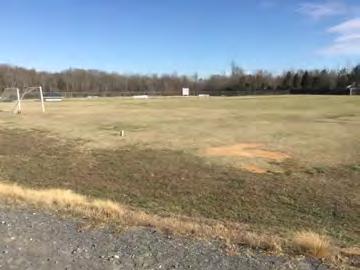
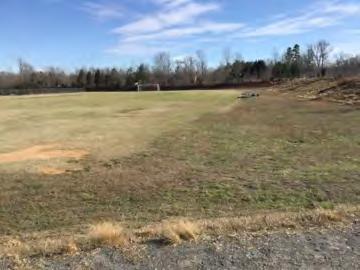
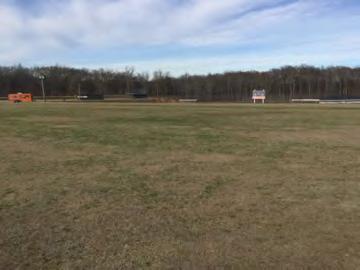
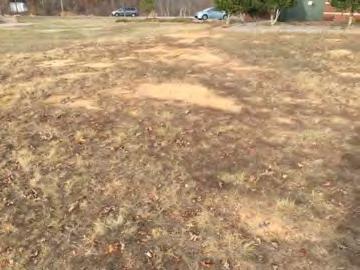
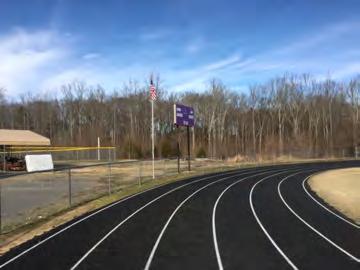
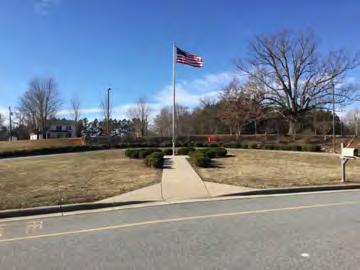
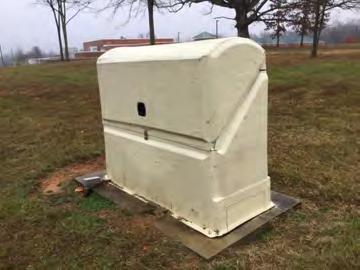
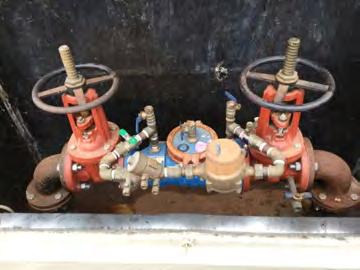
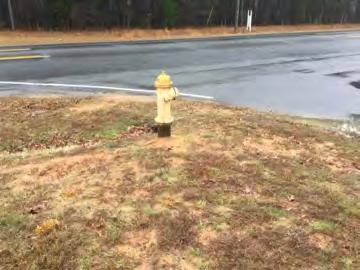
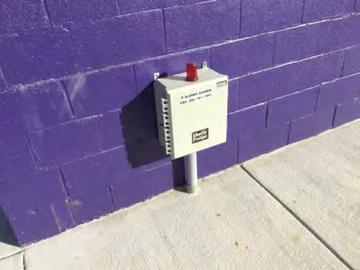
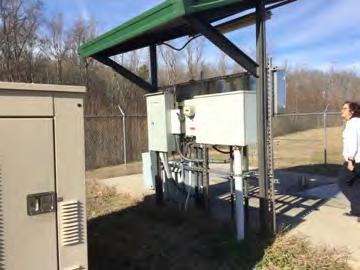
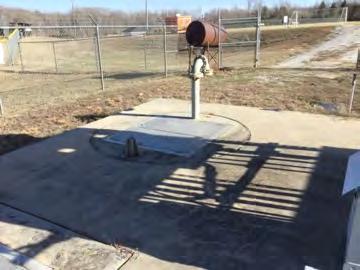
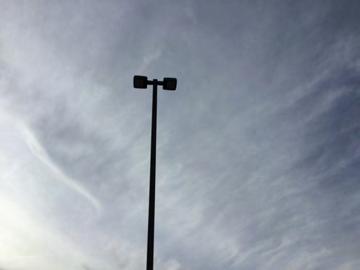
7 Campus Assessment Report - William Ellis Middle ceiling hung indirect lighting fixtures. GFCI outlets are provided at wet areas. The building has battery back-up emergency lighting and illuminated exit signs. There is no emergency generator. COMMUNICATIONS AND SECURITY: The fire alarm system consists of audio and visual annunciators in corridors and common areas. They can also be activated by pull stations and smoke detectors and the system is centrally monitored. This building has a locally monitored security camera system with both interior and exterior cameras, and controlled access doors. E. EQUIPMENT & FURNISHINGS This building includes the following items and equipment: fixed food service, residential appliances, library equipment, laboratory equipment, gym backstops and other gym equipment, telescoping bleachers, audio-visual equipment, Smartboards, a kiln, fixed plastic laminate casework, and window treatment consisting of horizontal miniblinds. G. SITE Campus site features include asphalt paved driveways and parking lots, gravel surfaced driveways, concrete pedestrian pavement, covered walkways, fencing, a flag pole, landscaping, a monument sign, softball and baseball fields, a football field with track, and a soccer/practice fields. There is an irrigation system at the sports fields utilizing well water. Site mechanical and electrical features include water, sanitary sewer including a lift station with an emergency generator, storm sewer discharging to surface waters, oil fuel storage, an FDC standpipe, and site lighting. Attributes: General Attributes: Condition Assessor: Ann Buerger Linden Assessment Date: Suitability Assessor: School Inofrmation: HS Attendance Area: Davie - Davie County HS LEA School No.: No. of Mobile Units: 0 No. of Bldgs.: 1 SF of Mobile Units: Status: School Grades: Site Acreage: Mar 10, 2017 Page 7 of 91
8 Campus Assessment Report - William Ellis Middle Campus Dashboard Summary Gross Area: Year Built: Repair Cost: FCI: 93, $171, % Last Renovation: Replacement Value: RSLI%: $23,437, % Deficiency By Category Deficiency By Priority Deferred Maintenance / Safety - $171, Currently Critical (Immediate) 2 - Potentially Critical (Year 1) 3 - Necessary/Not Yet Critical (Years 2-5) 4 - Recommended (Years 6-10) - $171, Codes or Standards Compliance $150,000 Deficiency By System $130K $100,000 $50,000 $0 Site Improvements $10,000,000 $8,000,000 $6,000,000 $4,000,000 $2,000,000 $0 10 Year Investment Forecast $9M $2M $0 $0 $0 $0 $0 $0 $687K $ Mar 10, 2017 Page 8 of 91
9 Campus Assessment Report - William Ellis Middle Campus Condition Summary The Table below shows the RSLI and FCI for each major system shown at the UNIFORMAT II classification Level 2. Note that Systems with lower FCIs require less investment than systems with higher FCIs. Current Investment Requirement and Condition by Uniformat Classification UNIFORMAT Classification RSLI% FCI % Current Repair A10 - Foundations % 0.00 % $0.00 B10 - Superstructure % 0.00 % $0.00 B20 - Exterior Enclosure % 0.00 % $0.00 B30 - Roofing % 0.00 % $0.00 C10 - Interior Construction % 0.00 % $0.00 C30 - Interior Finishes % 0.00 % $0.00 D20 - Plumbing % 0.00 % $0.00 D30 - HVAC % 0.00 % $0.00 D40 - Fire Protection % 0.00 % $0.00 D50 - Electrical % 0.00 % $0.00 E10 - Equipment % 0.00 % $0.00 E20 - Furnishings % 0.00 % $0.00 G20 - Site Improvements % 5.54 % $171, G30 - Site Mechanical Utilities % 0.00 % $0.00 G40 - Site Electrical Utilities % 0.00 % $0.00 Totals: % 0.73 % $171, Condition Deficiency Priority Facility Name Gross Area (S.F.) FCI % 1 - Currently Critical (Immediate) 2 - Potentially Critical (Year 1) 3 - Necessary/Not Yet Critical (Years 2-5) 4 - Recommended (Years 6-10) 5 - Codes or Standards Compliance 2007 Main 92, $0.00 $0.00 $0.00 $0.00 $ Tractor Shed $0.00 $0.00 $0.00 $0.00 $ Concessions/RR $0.00 $0.00 $0.00 $0.00 $0.00 Site 93, $0.00 $0.00 $0.00 $171, $0.00 Deficiencies By Priority Total: 0.73 $0.00 $0.00 $0.00 $171, $0.00 Mar 10, 2017 Page 9 of 91
10 Campus Assessment Report - William Ellis Middle 1 - Currently Critical (Immediate) 2 - Potentially Critical (Year 1) 3 - Necessary/Not Yet Critical (Years 2-5) 4 - Recommended (Years 6-10) - $171, Codes or Standards Compliance Budget Estimate Total: $171, Mar 10, 2017 Page 10 of 91
11 Campus Assessment Report Main Executive Summary Building condition is evaluated based on the functional systems and elements of a building and organized according to the UNIFORMAT II Elemental Classification. The grouping of these systems and elements and applying a current replacement value to them develops a representative building cost model. Cost Models are developed for similar building types and functions. Systems and their elements are evaluated based on their current replacement values, life cycles, installation dates and next renewal dates. Systems and their elements that are within their useful lives are further evaluated to identify current deficient conditions that may have a significant impact on a system's or element's remaining service life, and to determine if they are beyond their predicted expected life. The system's or element's current replacement value is based on RS Means Commercial Cost Data. Following are the cost model's system details for this facility. The Replacement Value is the amount needed to replace the property of the same present scope. The Repair Cost (the sum of the cost to repair/replace the Deficiencies) represents the budgeted contractor-installed costs plus owner's soft costs for the repair, replacement or renewal for a component or system level deficiency. It excludes contributing costs for other components or systems that might also be associated with the corrective actions due to packaging of the work. Facility Condition Index ( FCI) is an industry-standard measurement of facility condition calculated as the ratio of the costs to correct a facility's deficiencies (Condition Needs) to the facility's Current Replacement Value. It ranges from 0% (new) to 100% (very poor - beyond service life). The Remaining Service Life Index (RSLI) is calculated as the sum of a renewable system's Remaining Service Life (RSL) divided by the sum of a system's Replacement Value (both values exclude soft-cost to simplify calculation updates) expressed as a percentage ranging from 100% (new) to 0% (expired). The relationship between the key metrics FCI and RSLI is an important indicator, at either the facility, building, system, or component levels, of the condition trend and the imminent need for capital renewal. These indices exist in an inverse relationship wherein the FCI increases when systems reach their expected life-cycle age, whereas the RSLI decreases annually indicating the relative time remaining before reaching the life-cycle expiration age. For example, a facility or a system with a high RSLI and a low FCI indicates it is in the early portion of its useful life. However, a low RSLI indicates that expiration dates are approaching at which point the FCI would increase. The term FCA Score is the inverse of Total FCI and calculated as 100-Total FCI (without the %) where 100 is best and 0 is worst condition. Function: Gross Area (SF): Year Built: Last Renovation: Replacement Value: Repair Cost: Total FCI: Total RSLI: MS -Middle School 92, $18,895,119 $ % % FCA Score: Description: School was originally designed with mezzanines for access to HVAC equipment. Mezzanines were value engineered out of the building. Attributes: This asset has no attributes. Mar 10, 2017 Page 11 of 91
12 Campus Assessment Report Main Dashboard Summary Function: Year Built: Repair Cost: FCI: MS -Middle School 2007 $ % Gross Area: Last Renovation: Replacement Value: RSLI%: 92,255 $18,895, % No data found for this asset No data found for this asset No data found for this asset $7,000,000 $6,000,000 $5,000,000 $4,000,000 $3,000,000 $2,000,000 $1,000,000 $0 10 Year Investment Forecast $6M $2M $0 $0 $0 $0 $0 $0 $431K $ Mar 10, 2017 Page 12 of 91
13 Campus Assessment Report Main Condition Summary The Table below shows the RSLI and FCI for each major building system shown at the UNIFORMAT classification Level II. Note that Systems with lower FCIs require less investment than systems with higher FCIs. UNIFORMAT Classification RSLI % FCI % Current Repair Cost A10 - Foundations % 0.00 % $0.00 B10 - Superstructure % 0.00 % $0.00 B20 - Exterior Enclosure % 0.00 % $0.00 B30 - Roofing % 0.00 % $0.00 C10 - Interior Construction % 0.00 % $0.00 C30 - Interior Finishes % 0.00 % $0.00 D20 - Plumbing % 0.00 % $0.00 D30 - HVAC % 0.00 % $0.00 D40 - Fire Protection % 0.00 % $0.00 D50 - Electrical % 0.00 % $0.00 E10 - Equipment % 0.00 % $0.00 E20 - Furnishings % 0.00 % $0.00 Totals: % 0.00 % $0.00 Mar 10, 2017 Page 13 of 91

.")
.")
14 Campus Assessment Report Main Photo Album The photo album consists of the various cardinal directions of the building.. 1). West Elevation - Feb 13, ). North Elevation - Feb 13, ). East Elevation - Feb 13, ). South Elevation - Feb 13, 2017 Mar 10, 2017 Page 14 of 91
15 Campus Assessment Report Main Condition Detail This section of the report contains results of the Facility Condition Assessment. The building is separated into system components based on UNIFORMAT II. The columns in the System Listing table represent the following: 1. System Code: A code that identifies the system. 2. System Description: A brief description of a system present in the building. 3. Unit Price $: The unit price of the system. 4. UoM: The unit of measure of the system. 5. Qty: The quantity for the system 6. Life: Building Owners and Managers Association (BOMA) recommended system design life. 7. Year Installed: The date of system installation. 8. Calc Next Renewal Year: The date of system expiration based on the life, NR stands for non renewable. 9. Next Renewal Year: The suggested system expiration date by the assessor based on visual inspection. 10. RSLI: The Remaining Service Life Index of the system. 11. FCI: The Facility Condition Index of the system. 12. RSL: Remaining Service Life in years. 13. ecr: ecomet Condition Rating (not used in this assessment). 14. Deficiency $: The financial investment to repair/replace system to address deficiency. 15. Replacement Value $: The replacement cost of the system. Mar 10, 2017 Page 15 of 91
16 Campus Assessment Report Main System Listing The System Listing table below lists each of the systems organized by their UNIFORMAT II classification. The assessment team was tasked with recording the most recent replacement year of each system, determining the remaining service life based on the theoretical life, and evaluating the condition to confirm the forecast next replacement year. The system listing is the basis for all data contained in the Building Assessment Report. Mar 10, 2017 Page 16 of 91
17 Campus Assessment Report Main System Code System Description Unit Price $ UoM Qty Life Year Installed Calc Next Renewal Year Next Renewal Year RSLI% FCI% RSL ecr Deficiency $ Replacement Value $ A1010 Standard Foundations $1.52 S.F. 92, % 0.00 % 90 $140,228 A1030 Slab on Grade $10.07 S.F. 92, % 0.00 % 90 $929,008 B1020 Roof Construction $16.84 S.F. 92, % 0.00 % 90 $1,553,574 B2010 Exterior Walls $9.02 S.F. 92, % 0.00 % 90 $832,140 B2020 Exterior Windows $10.52 S.F. 92, % 0.00 % 20 $970,523 B2030 Exterior Doors $1.02 S.F. 92, % 0.00 % 20 $94,100 B Single Ply Membrane $6.98 S.F. 45, % 0.00 % 10 $316,194 B Preformed Metal Roofing $9.66 S.F. 46, % 0.00 % 20 $453,585 B3020 Roof Openings $1.25 S.F. 92, % 0.00 % 15 $115,319 C1010 Partitions $6.07 S.F. 92, % 0.00 % 65 $559,988 C1020 Interior Doors $2.46 S.F. 92, % 0.00 % 20 $226,947 C1030 Fittings $13.11 S.F. 92, % 0.00 % 10 $1,209,463 C3010 Wall Finishes $3.35 S.F. 92, % 0.00 % 8 $309,054 C3020 Floor Finishes $10.41 S.F. 92, % 0.00 % 10 $960,375 C3030 Ceiling Finishes $11.37 S.F. 92, % 0.00 % 15 $1,048,939 D2010 Plumbing Fixtures $9.64 S.F. 92, % 0.00 % 20 $889,338 D2020 Domestic Water Distribution $1.03 S.F. 92, % 0.00 % 20 $95,023 D2030 Sanitary Waste $1.62 S.F. 92, % 0.00 % 20 $149,453 D2040 Rain Water Drainage $0.59 S.F. 92, % 0.00 % 20 $54,430 D2090 Other Plumbing Systems -Fuel Oil $0.16 S.F. 92, % 0.00 % 30 $14,761 D3020 Heat Generating Systems $8.66 S.F. 92, % 0.00 % 20 $798,928 D3030 Cooling Generating Systems $8.99 S.F. 92, % 0.00 % 15 $829,372 D3040 Distribution Systems $10.65 S.F. 92, % 0.00 % 20 $982,516 D3050 Terminal & Package Units $5.00 S.F. 92, % 0.00 % 5 $461,275 D3060 Controls & Instrumentation $3.33 S.F. 92, % 0.00 % 10 $307,209 D4010 Sprinklers $3.92 S.F. 92, % 0.00 % 20 $361,640 D4020 Standpipes $0.67 S.F. 92, % 0.00 % 20 $61,811 D5010 Electrical Service/Distribution $1.64 S.F. 92, % 0.00 % 30 $151,298 D5020 Branch Wiring $4.91 S.F. 92, % 0.00 % 20 $452,972 D5020 Lighting $11.44 S.F. 92, % 0.00 % 20 $1,055,397 D Security & Detection Systems $2.27 S.F. 92, % 0.00 % 5 $209,419 D Fire Alarm Systems $4.11 S.F. 92, % 0.00 % 5 $379,168 D Data Communication $5.32 S.F. 92, % 0.00 % 5 $490,797 D5090 Other Electrical Systems $0.51 S.F. 92, % 0.00 % 10 $47,050 E1020 Institutional Equipment $2.73 S.F. 92, % 0.00 % 10 $251,856 E1090 Other Equipment $6.82 S.F. 92, % 0.00 % 10 $629,179 E2010 Fixed Furnishings $5.45 S.F. 92, % 0.00 % 10 $502,790 Total % $18,895,119 Mar 10, 2017 Page 17 of 91


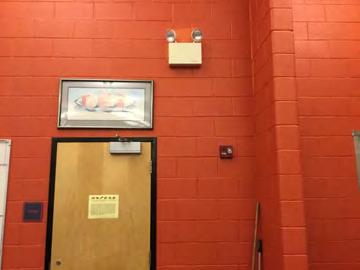
18 Campus Assessment Report Main System Notes The facility description in the executive summary contains an overview of each system. The photos of each system and any associated notes listed below provide additional information on select systems found within the facility: A Slab on Grade B Roof Construction B Exterior Walls Mar 10, 2017 Page 18 of 91
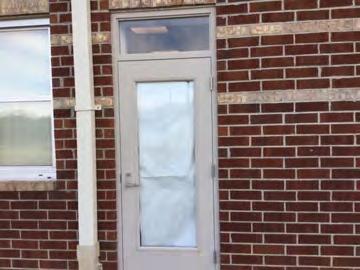
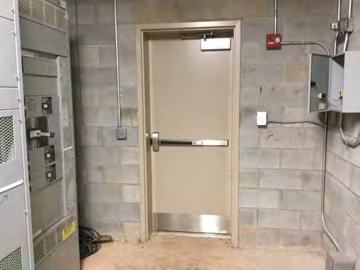
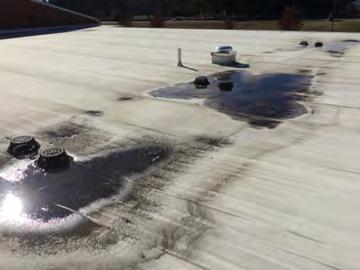
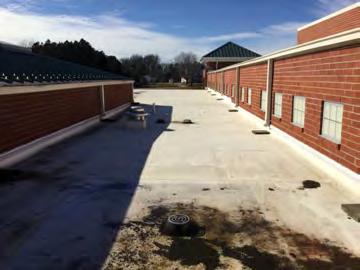
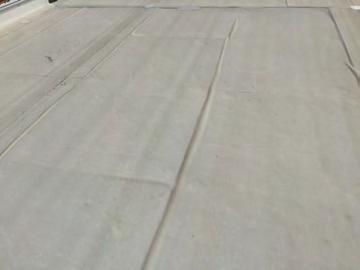
19 Campus Assessment Report Main B Exterior Windows B Exterior Doors B Single Ply Membrane Mar 10, 2017 Page 19 of 91
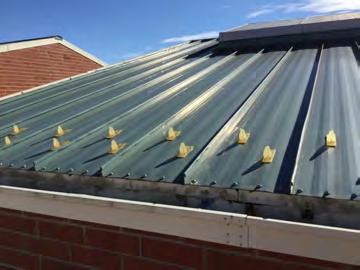
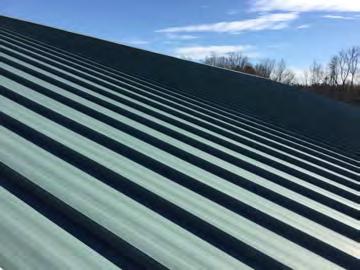
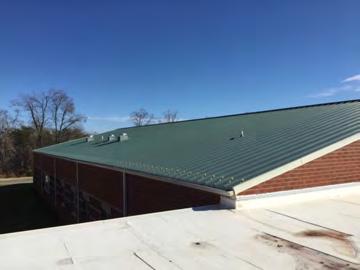
20 Campus Assessment Report Main B Preformed Metal Roofing B Roof Openings C Partitions Mar 10, 2017 Page 20 of 91
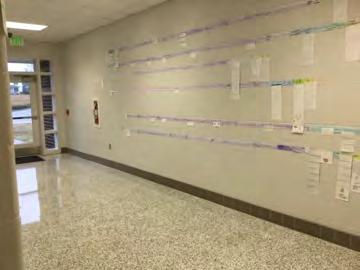
21 Campus Assessment Report Main C Interior Doors C Fittings C Wall Finishes Mar 10, 2017 Page 21 of 91
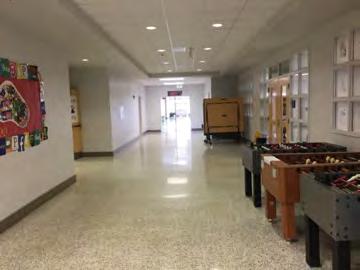
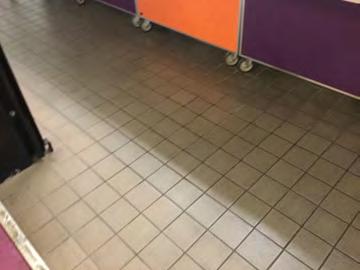
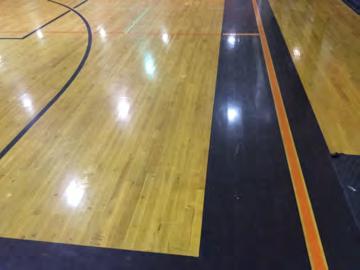
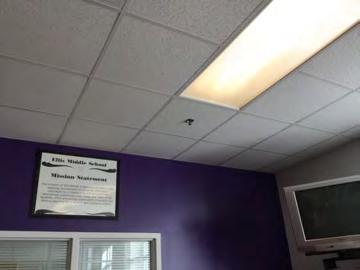
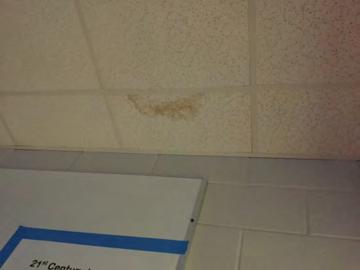
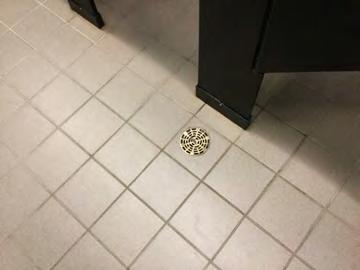
22 Campus Assessment Report Main C Floor Finishes C Ceiling Finishes D Plumbing Fixtures Mar 10, 2017 Page 22 of 91
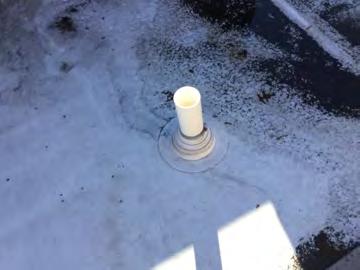
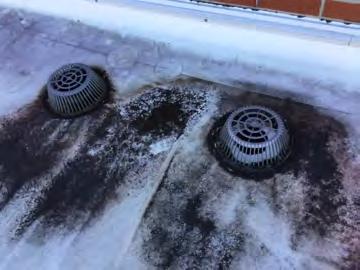
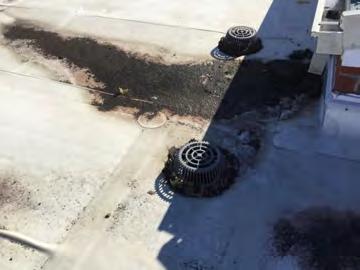
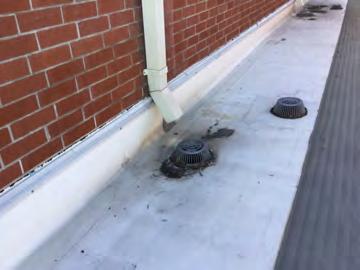
23 Campus Assessment Report Main D Domestic Water Distribution D Sanitary Waste D Rain Water Drainage Mar 10, 2017 Page 23 of 91
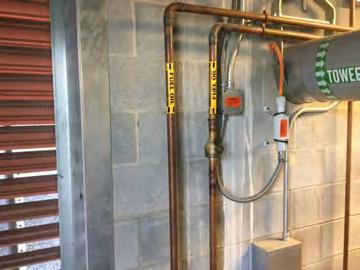
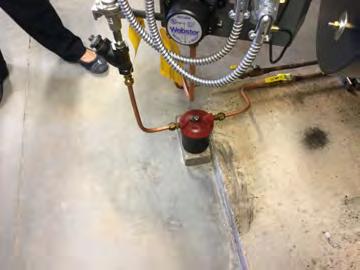
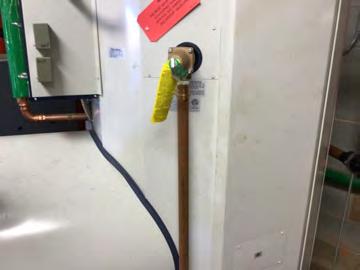
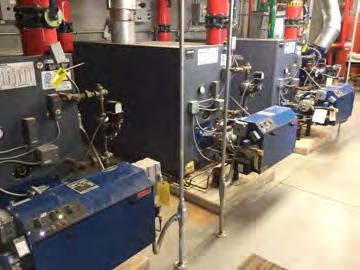
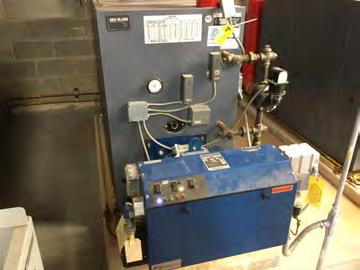
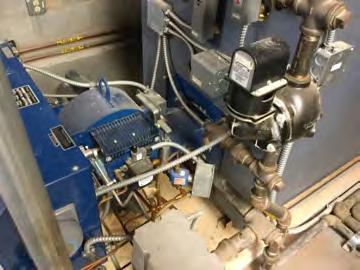
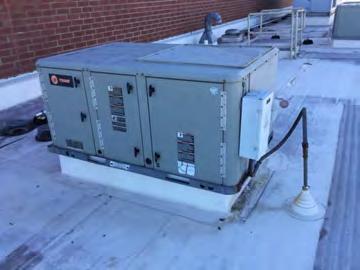
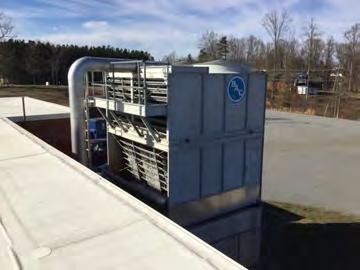
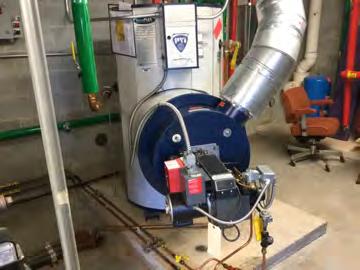
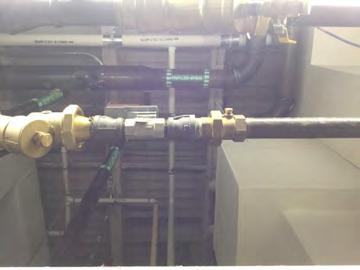
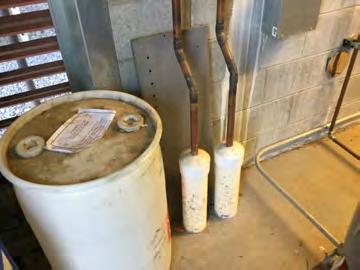
24 Campus Assessment Report Main D Other Plumbing Systems -Fuel Oil D Heat Generating Systems D Cooling Generating Systems Mar 10, 2017 Page 24 of 91
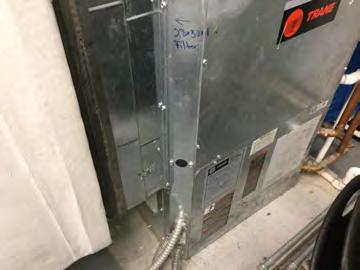
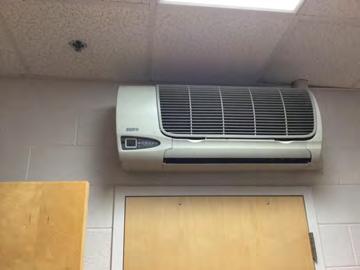
25 Campus Assessment Report Main D Distribution Systems D Terminal & Package Units D Controls & Instrumentation Mar 10, 2017 Page 25 of 91


26 Campus Assessment Report Main D Sprinklers D Standpipes D Electrical Service/Distribution Mar 10, 2017 Page 26 of 91
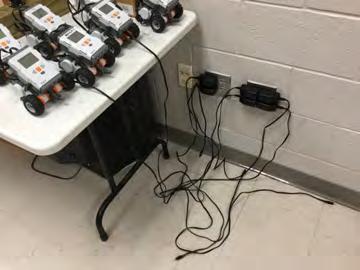
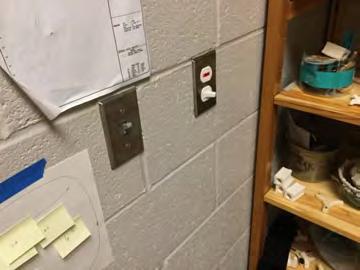
27 Campus Assessment Report Main D Branch Wiring D Lighting D Security & Detection Systems Mar 10, 2017 Page 27 of 91

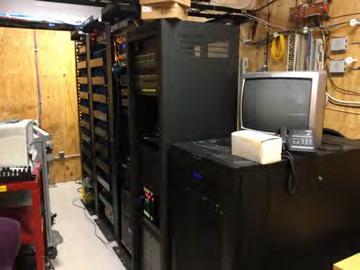
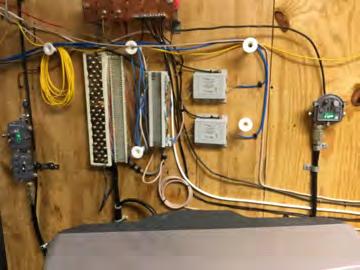
28 Campus Assessment Report Main D Fire Alarm Systems D Data Communication D Other Electrical Systems Mar 10, 2017 Page 28 of 91

29 Campus Assessment Report Main E Institutional Equipment Mar 10, 2017 Page 29 of 91

30 Campus Assessment Report Main E Other Equipment E Fixed Furnishings Mar 10, 2017 Page 30 of 91
31 Campus Assessment Report Main Renewal Schedule ecomet forecasts future Capital Renewal projects for expiring systems based on the Calculated Next Renewal year found in the system listing. There is a 3% yearly inflation factor applied to the system costs expiring in the future. The table below reflects Capital Renewal projects over the next 10 years. Blank cells (or $0) indicate no systems are scheduled for renewal in that year. Inflation Rate: 3% System Current Deficiencies Total Total: $0 $0 $0 $0 $0 $1,964,651 $0 $0 $430,651 $0 $6,414,520 $8,809,822 * A - Substructure $0 $0 $0 $0 $0 $0 $0 $0 $0 $0 $0 $0 * A10 - Foundations $0 $0 $0 $0 $0 $0 $0 $0 $0 $0 $0 $0 * A Standard Foundations $0 $0 $0 $0 $0 $0 $0 $0 $0 $0 $0 $0 * A Slab on Grade $0 $0 $0 $0 $0 $0 $0 $0 $0 $0 $0 $0 B - Shell $0 $0 $0 $0 $0 $0 $0 $0 $0 $0 $0 $0 B10 - Superstructure $0 $0 $0 $0 $0 $0 $0 $0 $0 $0 $0 $0 * B Roof Construction $0 $0 $0 $0 $0 $0 $0 $0 $0 $0 $0 $0 B20 - Exterior Enclosure $0 $0 $0 $0 $0 $0 $0 $0 $0 $0 $0 $0 * B Exterior Walls $0 $0 $0 $0 $0 $0 $0 $0 $0 $0 $0 $0 B Exterior Windows $0 $0 $0 $0 $0 $0 $0 $0 $0 $0 $0 $0 B Exterior Doors $0 $0 $0 $0 $0 $0 $0 $0 $0 $0 $0 $0 B30 - Roofing $0 $0 $0 $0 $0 $0 $0 $0 $0 $0 $0 $0 B Roof Coverings $0 $0 $0 $0 $0 $0 $0 $0 $0 $0 $0 $0 B Single Ply Membrane $0 $0 $0 $0 $0 $0 $0 $0 $0 $0 $637,407 $637,407 B Preformed Metal Roofing $0 $0 $0 $0 $0 $0 $0 $0 $0 $0 $0 $0 B Roof Openings $0 $0 $0 $0 $0 $0 $0 $0 $0 $0 $0 $0 C - Interiors $0 $0 $0 $0 $0 $0 $0 $0 $0 $0 $0 $0 C10 - Interior Construction $0 $0 $0 $0 $0 $0 $0 $0 $0 $0 $0 $0 * C Partitions $0 $0 $0 $0 $0 $0 $0 $0 $0 $0 $0 $0 C Interior Doors $0 $0 $0 $0 $0 $0 $0 $0 $0 $0 $0 $0 C Fittings $0 $0 $0 $0 $0 $0 $0 $0 $0 $0 $1,787,958 $1,787,958 C30 - Interior Finishes $0 $0 $0 $0 $0 $0 $0 $0 $0 $0 $0 $0 C Wall Finishes $0 $0 $0 $0 $0 $0 $0 $0 $430,651 $0 $0 $430,651 C Floor Finishes $0 $0 $0 $0 $0 $0 $0 $0 $0 $0 $1,419,729 $1,419,729 C Ceiling Finishes $0 $0 $0 $0 $0 $0 $0 $0 $0 $0 $0 $0 Mar 10, 2017 Page 31 of 91
32 Campus Assessment Report Main D - Services $0 $0 $0 $0 $0 $0 $0 $0 $0 $0 $0 $0 D20 - Plumbing $0 $0 $0 $0 $0 $0 $0 $0 $0 $0 $0 $0 D Plumbing Fixtures $0 $0 $0 $0 $0 $0 $0 $0 $0 $0 $0 $0 D Domestic Water Distribution $0 $0 $0 $0 $0 $0 $0 $0 $0 $0 $0 $0 D Sanitary Waste $0 $0 $0 $0 $0 $0 $0 $0 $0 $0 $0 $0 D Rain Water Drainage $0 $0 $0 $0 $0 $0 $0 $0 $0 $0 $0 $0 D Other Plumbing Systems -Fuel Oil $0 $0 $0 $0 $0 $0 $0 $0 $0 $0 $0 $0 D30 - HVAC $0 $0 $0 $0 $0 $0 $0 $0 $0 $0 $0 $0 D Heat Generating Systems $0 $0 $0 $0 $0 $0 $0 $0 $0 $0 $0 $0 D Cooling Generating Systems $0 $0 $0 $0 $0 $0 $0 $0 $0 $0 $0 $0 D Distribution Systems $0 $0 $0 $0 $0 $0 $0 $0 $0 $0 $0 $0 D Terminal & Package Units $0 $0 $0 $0 $0 $588,219 $0 $0 $0 $0 $0 $588,219 D Controls & Instrumentation $0 $0 $0 $0 $0 $0 $0 $0 $0 $0 $454,150 $454,150 D40 - Fire Protection $0 $0 $0 $0 $0 $0 $0 $0 $0 $0 $0 $0 D Sprinklers $0 $0 $0 $0 $0 $0 $0 $0 $0 $0 $0 $0 D Standpipes $0 $0 $0 $0 $0 $0 $0 $0 $0 $0 $0 $0 D50 - Electrical $0 $0 $0 $0 $0 $0 $0 $0 $0 $0 $0 $0 D Electrical Service/Distribution $0 $0 $0 $0 $0 $0 $0 $0 $0 $0 $0 $0 D Branch Wiring $0 $0 $0 $0 $0 $0 $0 $0 $0 $0 $0 $0 D Lighting $0 $0 $0 $0 $0 $0 $0 $0 $0 $0 $0 $0 D Communications and Security $0 $0 $0 $0 $0 $0 $0 $0 $0 $0 $0 $0 D Security & Detection Systems $0 $0 $0 $0 $0 $267,052 $0 $0 $0 $0 $0 $267,052 D Fire Alarm Systems $0 $0 $0 $0 $0 $483,516 $0 $0 $0 $0 $0 $483,516 D Data Communication $0 $0 $0 $0 $0 $625,864 $0 $0 $0 $0 $0 $625,864 D Other Electrical Systems $0 $0 $0 $0 $0 $0 $0 $0 $0 $0 $69,554 $69,554 E - Equipment & Furnishings $0 $0 $0 $0 $0 $0 $0 $0 $0 $0 $0 $0 E10 - Equipment $0 $0 $0 $0 $0 $0 $0 $0 $0 $0 $0 $0 E Institutional Equipment $0 $0 $0 $0 $0 $0 $0 $0 $0 $0 $372,321 $372,321 E Other Equipment $0 $0 $0 $0 $0 $0 $0 $0 $0 $0 $930,120 $930,120 E20 - Furnishings $0 $0 $0 $0 $0 $0 $0 $0 $0 $0 $0 $0 E Fixed Furnishings $0 $0 $0 $0 $0 $0 $0 $0 $0 $0 $743,278 $743,278 * Indicates non-renewable system Mar 10, 2017 Page 32 of 91
33 Campus Assessment Report Main Forecasted Capital Renewal Requirement The following chart shows the current building deficiencies and forecasting capital renewal or sustainment requirements over the next ten years. $7,000,000 $6,000,000 $6,414,520 $5,000,000 $4,000,000 $3,000,000 $2,000,000 $1,964,651 $1,000,000 $430,651 $0 Current Deficiencies Mar 10, 2017 Page 33 of 91
34 Campus Assessment Report Main Deficiency Summary by System Current deficiencies included assemblies that have reached or exceeded their design life or components of the assemblies that are in need of repair. Assemblies that have reached their design life are identified as current deficiencies and assigned the distress 'Beyond Useful Life'. The following chart lists all current deficiencies associated with this facility. No data found for this asset Mar 10, 2017 Page 34 of 91
35 Campus Assessment Report Main Deficiency Summary by Priority The following chart shows the total repair costs broken down by priority. Assessors assigned deficiencies within ecomet to one of the following priority categories: No data found for this asset Mar 10, 2017 Page 35 of 91
36 Campus Assessment Report Main Deficiency By Priority Investment Table The table below shows the current investment cost grouped by deficiency priority and building system. No data found for this asset Mar 10, 2017 Page 36 of 91
37 Campus Assessment Report Main Deficiency Summary by Category The following chart shows the total repair costs broken down by deficiency categories. Assessors assigned deficiencies to one of the following categories: No data found for this asset Mar 10, 2017 Page 37 of 91
38 Campus Assessment Report Main Deficiency Details by Priority The deficiency detail notes listed below provide additional information on identified deficiencies found within the facility. No data found for this asset Mar 10, 2017 Page 38 of 91
39 Campus Assessment Report Tractor Shed Executive Summary Building condition is evaluated based on the functional systems and elements of a building and organized according to the UNIFORMAT II Elemental Classification. The grouping of these systems and elements and applying a current replacement value to them develops a representative building cost model. Cost Models are developed for similar building types and functions. Systems and their elements are evaluated based on their current replacement values, life cycles, installation dates and next renewal dates. Systems and their elements that are within their useful lives are further evaluated to identify current deficient conditions that may have a significant impact on a system's or element's remaining service life, and to determine if they are beyond their predicted expected life. The system's or element's current replacement value is based on RS Means Commercial Cost Data. Following are the cost model's system details for this facility. The Replacement Value is the amount needed to replace the property of the same present scope. The Repair Cost (the sum of the cost to repair/replace the Deficiencies) represents the budgeted contractor-installed costs plus owner's soft costs for the repair, replacement or renewal for a component or system level deficiency. It excludes contributing costs for other components or systems that might also be associated with the corrective actions due to packaging of the work. Facility Condition Index ( FCI) is an industry-standard measurement of facility condition calculated as the ratio of the costs to correct a facility's deficiencies (Condition Needs) to the facility's Current Replacement Value. It ranges from 0% (new) to 100% (very poor - beyond service life). The Remaining Service Life Index (RSLI) is calculated as the sum of a renewable system's Remaining Service Life (RSL) divided by the sum of a system's Replacement Value (both values exclude soft-cost to simplify calculation updates) expressed as a percentage ranging from 100% (new) to 0% (expired). The relationship between the key metrics FCI and RSLI is an important indicator, at either the facility, building, system, or component levels, of the condition trend and the imminent need for capital renewal. These indices exist in an inverse relationship wherein the FCI increases when systems reach their expected life-cycle age, whereas the RSLI decreases annually indicating the relative time remaining before reaching the life-cycle expiration age. For example, a facility or a system with a high RSLI and a low FCI indicates it is in the early portion of its useful life. However, a low RSLI indicates that expiration dates are approaching at which point the FCI would increase. The term FCA Score is the inverse of Total FCI and calculated as 100-Total FCI (without the %) where 100 is best and 0 is worst condition. Function: Gross Area (SF): Year Built: Last Renovation: Replacement Value: Repair Cost: Total FCI: Total RSLI: MS -Middle School $28,242 $ % % FCA Score: Description: The narrative for this building is included in the Executive Summary Description at the front of this report. Attributes: This asset has no attributes. Mar 10, 2017 Page 39 of 91
40 Campus Assessment Report Tractor Shed Dashboard Summary Function: Year Built: Repair Cost: FCI: MS -Middle School 2007 $ % Gross Area: Last Renovation: Replacement Value: RSLI%: 252 $28, % No data found for this asset No data found for this asset No data found for this asset $2,500 $2,000 $1,500 $1,000 $500 $0 10 Year Investment Forecast $2K $0 $0 $0 $0 $0 $0 $0 $0 $ Mar 10, 2017 Page 40 of 91
41 Campus Assessment Report Tractor Shed Condition Summary The Table below shows the RSLI and FCI for each major building system shown at the UNIFORMAT classification Level II. Note that Systems with lower FCIs require less investment than systems with higher FCIs. UNIFORMAT Classification RSLI % FCI % Current Repair Cost A10 - Foundations % 0.00 % $0.00 B10 - Superstructure % 0.00 % $0.00 B20 - Exterior Enclosure % 0.00 % $0.00 B30 - Roofing % 0.00 % $0.00 D50 - Electrical % 0.00 % $0.00 Totals: % 0.00 % $0.00 Mar 10, 2017 Page 41 of 91

.")
.")
42 Campus Assessment Report Tractor Shed Photo Album The photo album consists of the various cardinal directions of the building.. 1). West Elevation - Feb 11, ). South Elevation - Feb 11, ). East Elevation - Feb 11, ). North Elevation - Feb 11, 2017 Mar 10, 2017 Page 42 of 91
43 Campus Assessment Report Tractor Shed Condition Detail This section of the report contains results of the Facility Condition Assessment. The building is separated into system components based on UNIFORMAT II. The columns in the System Listing table represent the following: 1. System Code: A code that identifies the system. 2. System Description: A brief description of a system present in the building. 3. Unit Price $: The unit price of the system. 4. UoM: The unit of measure of the system. 5. Qty: The quantity for the system 6. Life: Building Owners and Managers Association (BOMA) recommended system design life. 7. Year Installed: The date of system installation. 8. Calc Next Renewal Year: The date of system expiration based on the life, NR stands for non renewable. 9. Next Renewal Year: The suggested system expiration date by the assessor based on visual inspection. 10. RSLI: The Remaining Service Life Index of the system. 11. FCI: The Facility Condition Index of the system. 12. RSL: Remaining Service Life in years. 13. ecr: ecomet Condition Rating (not used in this assessment). 14. Deficiency $: The financial investment to repair/replace system to address deficiency. 15. Replacement Value $: The replacement cost of the system. Mar 10, 2017 Page 43 of 91
44 Campus Assessment Report Tractor Shed System Listing The System Listing table below lists each of the systems organized by their UNIFORMAT II classification. The assessment team was tasked with recording the most recent replacement year of each system, determining the remaining service life based on the theoretical life, and evaluating the condition to confirm the forecast next replacement year. The system listing is the basis for all data contained in the Building Assessment Report. System Code System Description Unit Price $ UoM Qty Life Year Installed Calc Next Renewal Year Next Renewal Year RSLI% FCI% RSL ecr Deficiency $ Replacement Value $ A1010 Standard Foundations $20.13 S.F % 0.00 % 90 $5,073 A1030 Slab on Grade $19.75 S.F % 0.00 % 90 $4,977 B1020 Roof Construction $16.26 S.F % 0.00 % 90 $4,098 B2010 Exterior Walls $29.79 S.F % 0.00 % 90 $7,507 B2030 Exterior Doors $8.66 S.F % 0.00 % 20 $2,182 B Asphalt Shingles $4.32 S.F % 0.00 % 10 $1,089 D5020 Branch Wiring $3.58 S.F % 0.00 % 20 $902 D5020 Lighting $9.58 S.F % 0.00 % 20 $2,414 Total % $28,242 Mar 10, 2017 Page 44 of 91


45 Campus Assessment Report Tractor Shed System Notes The facility description in the executive summary contains an overview of each system. The photos of each system and any associated notes listed below provide additional information on select systems found within the facility: B Roof Construction B Exterior Walls B Exterior Doors Mar 10, 2017 Page 45 of 91


46 Campus Assessment Report Tractor Shed B Asphalt Shingles D Branch Wiring D Lighting Mar 10, 2017 Page 46 of 91
47 Campus Assessment Report Tractor Shed Renewal Schedule ecomet forecasts future Capital Renewal projects for expiring systems based on the Calculated Next Renewal year found in the system listing. There is a 3% yearly inflation factor applied to the system costs expiring in the future. The table below reflects Capital Renewal projects over the next 10 years. Blank cells (or $0) indicate no systems are scheduled for renewal in that year. Inflation Rate: 3% System Current Deficiencies Total Total: $0 $0 $0 $0 $0 $0 $0 $0 $0 $0 $2,135 $2,135 * A - Substructure $0 $0 $0 $0 $0 $0 $0 $0 $0 $0 $0 $0 * A10 - Foundations $0 $0 $0 $0 $0 $0 $0 $0 $0 $0 $0 $0 * A Standard Foundations $0 $0 $0 $0 $0 $0 $0 $0 $0 $0 $0 $0 * A Slab on Grade $0 $0 $0 $0 $0 $0 $0 $0 $0 $0 $0 $0 B - Shell $0 $0 $0 $0 $0 $0 $0 $0 $0 $0 $0 $0 B10 - Superstructure $0 $0 $0 $0 $0 $0 $0 $0 $0 $0 $0 $0 * B Roof Construction $0 $0 $0 $0 $0 $0 $0 $0 $0 $0 $0 $0 B20 - Exterior Enclosure $0 $0 $0 $0 $0 $0 $0 $0 $0 $0 $0 $0 * B Exterior Walls $0 $0 $0 $0 $0 $0 $0 $0 $0 $0 $0 $0 B Exterior Doors $0 $0 $0 $0 $0 $0 $0 $0 $0 $0 $0 $0 B30 - Roofing $0 $0 $0 $0 $0 $0 $0 $0 $0 $0 $0 $0 B Roof Coverings $0 $0 $0 $0 $0 $0 $0 $0 $0 $0 $0 $0 B Asphalt Shingles $0 $0 $0 $0 $0 $0 $0 $0 $0 $0 $2,135 $2,135 D - Services $0 $0 $0 $0 $0 $0 $0 $0 $0 $0 $0 $0 D50 - Electrical $0 $0 $0 $0 $0 $0 $0 $0 $0 $0 $0 $0 D Branch Wiring $0 $0 $0 $0 $0 $0 $0 $0 $0 $0 $0 $0 D Lighting $0 $0 $0 $0 $0 $0 $0 $0 $0 $0 $0 $0 * Indicates non-renewable system Mar 10, 2017 Page 47 of 91
48 Campus Assessment Report Tractor Shed Forecasted Capital Renewal Requirement The following chart shows the current building deficiencies and forecasting capital renewal or sustainment requirements over the next ten years. $2,500 $2,000 $2,135 $1,500 $1,000 $500 $0 Current Deficiencies Mar 10, 2017 Page 48 of 91
49 Campus Assessment Report Tractor Shed Deficiency Summary by System Current deficiencies included assemblies that have reached or exceeded their design life or components of the assemblies that are in need of repair. Assemblies that have reached their design life are identified as current deficiencies and assigned the distress 'Beyond Useful Life'. The following chart lists all current deficiencies associated with this facility. No data found for this asset Mar 10, 2017 Page 49 of 91
50 Campus Assessment Report Tractor Shed Deficiency Summary by Priority The following chart shows the total repair costs broken down by priority. Assessors assigned deficiencies within ecomet to one of the following priority categories: No data found for this asset Mar 10, 2017 Page 50 of 91
51 Campus Assessment Report Tractor Shed Deficiency By Priority Investment Table The table below shows the current investment cost grouped by deficiency priority and building system. No data found for this asset Mar 10, 2017 Page 51 of 91
52 Campus Assessment Report Tractor Shed Deficiency Summary by Category The following chart shows the total repair costs broken down by deficiency categories. Assessors assigned deficiencies to one of the following categories: No data found for this asset Mar 10, 2017 Page 52 of 91
53 Campus Assessment Report Tractor Shed Deficiency Details by Priority The deficiency detail notes listed below provide additional information on identified deficiencies found within the facility. No data found for this asset Mar 10, 2017 Page 53 of 91
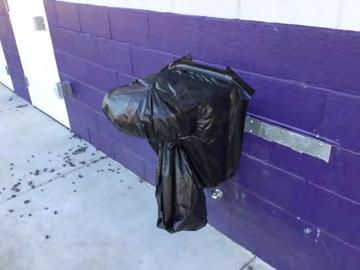
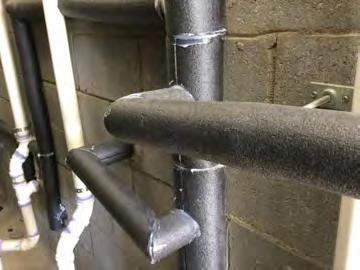
54 Campus Assessment Report Concessions/RR Executive Summary Building condition is evaluated based on the functional systems and elements of a building and organized according to the UNIFORMAT II Elemental Classification. The grouping of these systems and elements and applying a current replacement value to them develops a representative building cost model. Cost Models are developed for similar building types and functions. Systems and their elements are evaluated based on their current replacement values, life cycles, installation dates and next renewal dates. Systems and their elements that are within their useful lives are further evaluated to identify current deficient conditions that may have a significant impact on a system's or element's remaining service life, and to determine if they are beyond their predicted expected life. The system's or element's current replacement value is based on RS Means Commercial Cost Data. Following are the cost model's system details for this facility. The Replacement Value is the amount needed to replace the property of the same present scope. The Repair Cost (the sum of the cost to repair/replace the Deficiencies) represents the budgeted contractor-installed costs plus owner's soft costs for the repair, replacement or renewal for a component or system level deficiency. It excludes contributing costs for other components or systems that might also be associated with the corrective actions due to packaging of the work. Facility Condition Index ( FCI) is an industry-standard measurement of facility condition calculated as the ratio of the costs to correct a facility's deficiencies (Condition Needs) to the facility's Current Replacement Value. It ranges from 0% (new) to 100% (very poor - beyond service life). The Remaining Service Life Index (RSLI) is calculated as the sum of a renewable system's Remaining Service Life (RSL) divided by the sum of a system's Replacement Value (both values exclude soft-cost to simplify calculation updates) expressed as a percentage ranging from 100% (new) to 0% (expired). The relationship between the key metrics FCI and RSLI is an important indicator, at either the facility, building, system, or component levels, of the condition trend and the imminent need for capital renewal. These indices exist in an inverse relationship wherein the FCI increases when systems reach their expected life-cycle age, whereas the RSLI decreases annually indicating the relative time remaining before reaching the life-cycle expiration age. For example, a facility or a system with a high RSLI and a low FCI indicates it is in the early portion of its useful life. However, a low RSLI indicates that expiration dates are approaching at which point the FCI would increase. The term FCA Score is the inverse of Total FCI and calculated as 100-Total FCI (without the %) where 100 is best and 0 is worst condition. Function: Gross Area (SF): Year Built: Last Renovation: Replacement Value: Repair Cost: Total FCI: Total RSLI: MS -Middle School $55,993 $ % % FCA Score: Description: The narrative for this building is included in the Executive Summary Description at the front of this report. Attributes: This asset has no attributes. Mar 10, 2017 Page 54 of 91
55 Campus Assessment Report Concessions/RR Dashboard Summary Function: Year Built: Repair Cost: FCI: MS -Middle School 2015 $ % Gross Area: Last Renovation: Replacement Value: RSLI%: 540 $55, % No data found for this asset No data found for this asset No data found for this asset $1 $1 $1 $0 $0 $0 10 Year Investment Forecast $0 $0 $0 $0 $0 $0 $0 $0 $0 $ Mar 10, 2017 Page 55 of 91
56 Campus Assessment Report Concessions/RR Condition Summary The Table below shows the RSLI and FCI for each major building system shown at the UNIFORMAT classification Level II. Note that Systems with lower FCIs require less investment than systems with higher FCIs. UNIFORMAT Classification RSLI % FCI % Current Repair Cost A10 - Foundations % 0.00 % $0.00 B10 - Superstructure % 0.00 % $0.00 B20 - Exterior Enclosure % 0.00 % $0.00 B30 - Roofing % 0.00 % $0.00 C10 - Interior Construction % 0.00 % $0.00 D20 - Plumbing % 0.00 % $0.00 D30 - HVAC % 0.00 % $0.00 D50 - Electrical % 0.00 % $0.00 Totals: % 0.00 % $0.00 Mar 10, 2017 Page 56 of 91

.")
.")
57 Campus Assessment Report Concessions/RR Photo Album The photo album consists of the various cardinal directions of the building.. 1). North Elevation - Feb 11, ). West Elevation - Feb 11, ). South Elevation - Feb 11, ). East Elevation - Feb 11, 2017 Mar 10, 2017 Page 57 of 91
58 Campus Assessment Report Concessions/RR Condition Detail This section of the report contains results of the Facility Condition Assessment. The building is separated into system components based on UNIFORMAT II. The columns in the System Listing table represent the following: 1. System Code: A code that identifies the system. 2. System Description: A brief description of a system present in the building. 3. Unit Price $: The unit price of the system. 4. UoM: The unit of measure of the system. 5. Qty: The quantity for the system 6. Life: Building Owners and Managers Association (BOMA) recommended system design life. 7. Year Installed: The date of system installation. 8. Calc Next Renewal Year: The date of system expiration based on the life, NR stands for non renewable. 9. Next Renewal Year: The suggested system expiration date by the assessor based on visual inspection. 10. RSLI: The Remaining Service Life Index of the system. 11. FCI: The Facility Condition Index of the system. 12. RSL: Remaining Service Life in years. 13. ecr: ecomet Condition Rating (not used in this assessment). 14. Deficiency $: The financial investment to repair/replace system to address deficiency. 15. Replacement Value $: The replacement cost of the system. Mar 10, 2017 Page 58 of 91
59 Campus Assessment Report Concessions/RR System Listing The System Listing table below lists each of the systems organized by their UNIFORMAT II classification. The assessment team was tasked with recording the most recent replacement year of each system, determining the remaining service life based on the theoretical life, and evaluating the condition to confirm the forecast next replacement year. The system listing is the basis for all data contained in the Building Assessment Report. System Code System Description Unit Price $ UoM Qty Life Year Installed Calc Next Renewal Year Next Renewal Year RSLI% FCI% RSL ecr Deficiency $ Replacement Value $ A1010 Standard Foundations $6.93 S.F % 0.00 % 98 $3,742 A1030 Slab on Grade $7.37 S.F % 0.00 % 98 $3,980 B1020 Roof Construction $5.98 S.F % 0.00 % 98 $3,229 B2010 Exterior Walls $18.04 S.F % 0.00 % 98 $9,742 B2020 Exterior Windows $1.98 S.F % 0.00 % 28 $1,069 B2030 Exterior Doors $10.56 S.F % 0.00 % 28 $5,702 B Asphalt Shingles $4.32 S.F % 0.00 % 18 $2,333 C1010 Partitions $10.34 S.F % 0.00 % 73 $5,584 C1030 Fittings $8.47 S.F % 0.00 % 18 $4,574 D2010 Plumbing Fixtures $9.98 S.F % 0.00 % 28 $5,389 D2020 Domestic Water Distribution $0.84 S.F % 0.00 % 28 $454 D2030 Sanitary Waste $5.94 S.F % 0.00 % 28 $3,208 D3040 Distribution Systems $5.35 S.F % 0.00 % 28 $2,889 D5020 Branch Wiring $4.01 S.F % 0.00 % 28 $2,165 D5020 Lighting $3.58 S.F % 0.00 % 28 $1,933 Total % $55,993 Mar 10, 2017 Page 59 of 91


60 Campus Assessment Report Concessions/RR System Notes The facility description in the executive summary contains an overview of each system. The photos of each system and any associated notes listed below provide additional information on select systems found within the facility: B Roof Construction B Exterior Walls B Exterior Windows Mar 10, 2017 Page 60 of 91


61 Campus Assessment Report Concessions/RR B Exterior Doors B Asphalt Shingles C Partitions Mar 10, 2017 Page 61 of 91


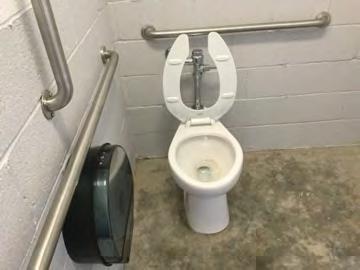
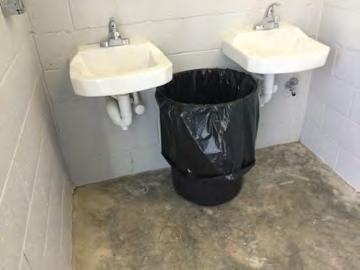
62 Campus Assessment Report Concessions/RR C Fittings D Plumbing Fixtures D Domestic Water Distribution Mar 10, 2017 Page 62 of 91


63 Campus Assessment Report Concessions/RR D Sanitary Waste D Distribution Systems D Branch Wiring Mar 10, 2017 Page 63 of 91

64 Campus Assessment Report Concessions/RR D Lighting Mar 10, 2017 Page 64 of 91
65 Campus Assessment Report Concessions/RR Renewal Schedule ecomet forecasts future Capital Renewal projects for expiring systems based on the Calculated Next Renewal year found in the system listing. There is a 3% yearly inflation factor applied to the system costs expiring in the future. The table below reflects Capital Renewal projects over the next 10 years. Blank cells (or $0) indicate no systems are scheduled for renewal in that year. Mar 10, 2017 Page 65 of 91
66 Campus Assessment Report Concessions/RR Inflation Rate: 3% System Current Deficiencies Total Total: $0 $0 $0 $0 $0 $0 $0 $0 $0 $0 $0 $0 * A - Substructure $0 $0 $0 $0 $0 $0 $0 $0 $0 $0 $0 $0 * A10 - Foundations $0 $0 $0 $0 $0 $0 $0 $0 $0 $0 $0 $0 * A Standard Foundations $0 $0 $0 $0 $0 $0 $0 $0 $0 $0 $0 $0 * A Slab on Grade $0 $0 $0 $0 $0 $0 $0 $0 $0 $0 $0 $0 B - Shell $0 $0 $0 $0 $0 $0 $0 $0 $0 $0 $0 $0 B10 - Superstructure $0 $0 $0 $0 $0 $0 $0 $0 $0 $0 $0 $0 * B Roof Construction $0 $0 $0 $0 $0 $0 $0 $0 $0 $0 $0 $0 B20 - Exterior Enclosure $0 $0 $0 $0 $0 $0 $0 $0 $0 $0 $0 $0 * B Exterior Walls $0 $0 $0 $0 $0 $0 $0 $0 $0 $0 $0 $0 B Exterior Windows $0 $0 $0 $0 $0 $0 $0 $0 $0 $0 $0 $0 B Exterior Doors $0 $0 $0 $0 $0 $0 $0 $0 $0 $0 $0 $0 B30 - Roofing $0 $0 $0 $0 $0 $0 $0 $0 $0 $0 $0 $0 B Roof Coverings $0 $0 $0 $0 $0 $0 $0 $0 $0 $0 $0 $0 B Asphalt Shingles $0 $0 $0 $0 $0 $0 $0 $0 $0 $0 $0 $0 C - Interiors $0 $0 $0 $0 $0 $0 $0 $0 $0 $0 $0 $0 C10 - Interior Construction $0 $0 $0 $0 $0 $0 $0 $0 $0 $0 $0 $0 * C Partitions $0 $0 $0 $0 $0 $0 $0 $0 $0 $0 $0 $0 C Fittings $0 $0 $0 $0 $0 $0 $0 $0 $0 $0 $0 $0 D - Services $0 $0 $0 $0 $0 $0 $0 $0 $0 $0 $0 $0 D20 - Plumbing $0 $0 $0 $0 $0 $0 $0 $0 $0 $0 $0 $0 D Plumbing Fixtures $0 $0 $0 $0 $0 $0 $0 $0 $0 $0 $0 $0 D Domestic Water Distribution $0 $0 $0 $0 $0 $0 $0 $0 $0 $0 $0 $0 D Sanitary Waste $0 $0 $0 $0 $0 $0 $0 $0 $0 $0 $0 $0 D30 - HVAC $0 $0 $0 $0 $0 $0 $0 $0 $0 $0 $0 $0 D Distribution Systems $0 $0 $0 $0 $0 $0 $0 $0 $0 $0 $0 $0 D50 - Electrical $0 $0 $0 $0 $0 $0 $0 $0 $0 $0 $0 $0 D Branch Wiring $0 $0 $0 $0 $0 $0 $0 $0 $0 $0 $0 $0 D Lighting $0 $0 $0 $0 $0 $0 $0 $0 $0 $0 $0 $0 * Indicates non-renewable system Mar 10, 2017 Page 66 of 91
67 Campus Assessment Report Concessions/RR Forecasted Capital Renewal Requirement The following chart shows the current building deficiencies and forecasting capital renewal or sustainment requirements over the next ten years. $1 $1 $1 $0 $0 $0 Current Deficiencies Mar 10, 2017 Page 67 of 91
68 Campus Assessment Report Concessions/RR Deficiency Summary by System Current deficiencies included assemblies that have reached or exceeded their design life or components of the assemblies that are in need of repair. Assemblies that have reached their design life are identified as current deficiencies and assigned the distress 'Beyond Useful Life'. The following chart lists all current deficiencies associated with this facility. No data found for this asset Mar 10, 2017 Page 68 of 91
69 Campus Assessment Report Concessions/RR Deficiency Summary by Priority The following chart shows the total repair costs broken down by priority. Assessors assigned deficiencies within ecomet to one of the following priority categories: No data found for this asset Mar 10, 2017 Page 69 of 91
70 Campus Assessment Report Concessions/RR Deficiency By Priority Investment Table The table below shows the current investment cost grouped by deficiency priority and building system. No data found for this asset Mar 10, 2017 Page 70 of 91
71 Campus Assessment Report Concessions/RR Deficiency Summary by Category The following chart shows the total repair costs broken down by deficiency categories. Assessors assigned deficiencies to one of the following categories: No data found for this asset Mar 10, 2017 Page 71 of 91
72 Campus Assessment Report Concessions/RR Deficiency Details by Priority The deficiency detail notes listed below provide additional information on identified deficiencies found within the facility. No data found for this asset Mar 10, 2017 Page 72 of 91
73 Campus Assessment Report - Site Executive Summary Building condition is evaluated based on the functional systems and elements of a building and organized according to the UNIFORMAT II Elemental Classification. The grouping of these systems and elements and applying a current replacement value to them develops a representative building cost model. Cost Models are developed for similar building types and functions. Systems and their elements are evaluated based on their current replacement values, life cycles, installation dates and next renewal dates. Systems and their elements that are within their useful lives are further evaluated to identify current deficient conditions that may have a significant impact on a system's or element's remaining service life, and to determine if they are beyond their predicted expected life. The system's or element's current replacement value is based on RS Means Commercial Cost Data. Following are the cost model's system details for this facility. The Replacement Value is the amount needed to replace the property of the same present scope. The Repair Cost (the sum of the cost to repair/replace the Deficiencies) represents the budgeted contractor-installed costs plus owner's soft costs for the repair, replacement or renewal for a component or system level deficiency. It excludes contributing costs for other components or systems that might also be associated with the corrective actions due to packaging of the work. Facility Condition Index ( FCI) is an industry-standard measurement of facility condition calculated as the ratio of the costs to correct a facility's deficiencies (Condition Needs) to the facility's Current Replacement Value. It ranges from 0% (new) to 100% (very poor - beyond service life). The Remaining Service Life Index (RSLI) is calculated as the sum of a renewable system's Remaining Service Life (RSL) divided by the sum of a system's Replacement Value (both values exclude soft-cost to simplify calculation updates) expressed as a percentage ranging from 100% (new) to 0% (expired). The relationship between the key metrics FCI and RSLI is an important indicator, at either the facility, building, system, or component levels, of the condition trend and the imminent need for capital renewal. These indices exist in an inverse relationship wherein the FCI increases when systems reach their expected life-cycle age, whereas the RSLI decreases annually indicating the relative time remaining before reaching the life-cycle expiration age. For example, a facility or a system with a high RSLI and a low FCI indicates it is in the early portion of its useful life. However, a low RSLI indicates that expiration dates are approaching at which point the FCI would increase. The term FCA Score is the inverse of Total FCI and calculated as 100-Total FCI (without the %) where 100 is best and 0 is worst condition. Function: Gross Area (SF): Year Built: Last Renovation: Replacement Value: Repair Cost: Total FCI: Total RSLI: MS -Middle School 93, $4,457,879 $171, % % FCA Score: Description: The narrative for this site is included in the Executive Summary Description at the front of this report. Attributes: This asset has no attributes. Mar 10, 2017 Page 73 of 91
74 Campus Assessment Report - Site Dashboard Summary Function: Year Built: Repair Cost: FCI: MS -Middle School 2007 $171, % Gross Area: Last Renovation: Replacement Value: RSLI%: 93,047 $4,457, % Deficiency By Category Deficiency By Priority Deferred Maintenance / Safety - $171, Currently Critical (Immediate) 2 - Potentially Critical (Year 1) 3 - Necessary/Not Yet Critical (Years 2-5) 4 - Recommended (Years 6-10) - $171, Codes or Standards Compliance $150,000 Deficiency By System $130K $100,000 $50,000 $0 Site Improvements $3,000,000 $2,000, Year Investment Forecast $3M $1,000,000 $0 $0 $0 $0 $0 $104K $257K $0 $0 $ Mar 10, 2017 Page 74 of 91
75 Campus Assessment Report - Site Condition Summary The Table below shows the RSLI and FCI for each major building system shown at the UNIFORMAT classification Level II. Note that Systems with lower FCIs require less investment than systems with higher FCIs. UNIFORMAT Classification RSLI % FCI % Current Repair Cost G20 - Site Improvements % 5.54 % $171, G30 - Site Mechanical Utilities % 0.00 % $0.00 G40 - Site Electrical Utilities % 0.00 % $0.00 Totals: % 3.85 % $171, Mar 10, 2017 Page 75 of 91
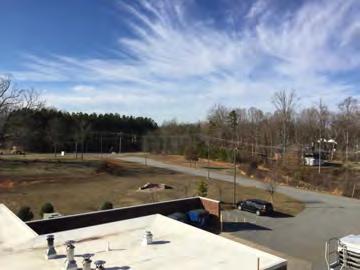
76 Campus Assessment Report - Site Photo Album The photo album consists of the various cardinal directions of the building.. 1). Aerial Image of William Ellis Middle School - Mar 03, 2017 Mar 10, 2017 Page 76 of 91
77 Campus Assessment Report - Site Condition Detail This section of the report contains results of the Facility Condition Assessment. The building is separated into system components based on UNIFORMAT II. The columns in the System Listing table represent the following: 1. System Code: A code that identifies the system. 2. System Description: A brief description of a system present in the building. 3. Unit Price $: The unit price of the system. 4. UoM: The unit of measure of the system. 5. Qty: The quantity for the system 6. Life: Building Owners and Managers Association (BOMA) recommended system design life. 7. Year Installed: The date of system installation. 8. Calc Next Renewal Year: The date of system expiration based on the life, NR stands for non renewable. 9. Next Renewal Year: The suggested system expiration date by the assessor based on visual inspection. 10. RSLI: The Remaining Service Life Index of the system. 11. FCI: The Facility Condition Index of the system. 12. RSL: Remaining Service Life in years. 13. ecr: ecomet Condition Rating (not used in this assessment). 14. Deficiency $: The financial investment to repair/replace system to address deficiency. 15. Replacement Value $: The replacement cost of the system. Mar 10, 2017 Page 77 of 91
78 Campus Assessment Report - Site System Listing The System Listing table below lists each of the systems organized by their UNIFORMAT II classification. The assessment team was tasked with recording the most recent replacement year of each system, determining the remaining service life based on the theoretical life, and evaluating the condition to confirm the forecast next replacement year. The system listing is the basis for all data contained in the Building Assessment Report. System Code System Description Unit Price $ UoM Qty Life Year Installed Calc Next Renewal Year Next Renewal Year RSLI% FCI% RSL ecr Deficiency $ Replacement Value $ G2010 Roadways $4.22 S.F. 93, % % 15 $171, $392,658 G2020 Parking Lots $1.39 S.F. 93, % 0.00 % 15 $129,335 G2030 Pedestrian Paving $1.98 S.F. 93, % 0.00 % 20 $184,233 G Fence & Guardrails $1.20 S.F. 93, % 0.00 % 20 $111,656 G Baseball Field $7.08 S.F. 93, % 0.00 % 10 $658,773 G Covered Walkways $1.21 S.F. 93, % 0.00 % 15 $112,587 G Football Field $4.73 S.F. 93, % 0.00 % 10 $440,112 G Playing Field $2.47 S.F. 93, % 0.00 % 10 $229,826 G Softball Field $5.11 S.F. 93, % 0.00 % 10 $475,470 G Track $1.98 S.F. 93, % 0.00 % 8 $184,233 G2050 Landscaping $1.91 S.F. 93, % 0.00 % 5 $177,720 G3010 Water Supply $2.42 S.F. 93, % 0.00 % 40 $225,174 G3020 Sanitary Sewer $1.52 S.F. 93, % 0.00 % 40 $141,431 G3030 Storm Sewer $4.67 S.F. 93, % 0.00 % 40 $434,529 G3060 Fuel Distribution $1.03 S.F. 93, % 0.00 % 30 $95,838 G4010 Electrical Distribution $2.59 S.F. 93, % 0.00 % 40 $240,992 G4020 Site Lighting $1.52 S.F. 93, % 0.00 % 20 $141,431 G4030 Site Communications & Security $0.88 S.F. 93, % 0.00 % 5 $81,881 Total % 3.85 % $171, $4,457,879 Mar 10, 2017 Page 78 of 91


79 Campus Assessment Report - Site System Notes The facility description in the executive summary contains an overview of each system. The photos of each system and any associated notes listed below provide additional information on select systems found within the facility: G Roadways G Parking Lots G Pedestrian Paving Mar 10, 2017 Page 79 of 91

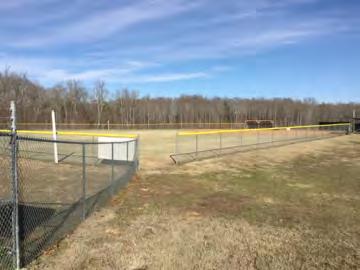
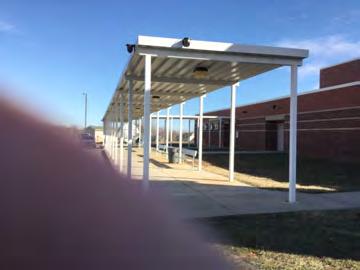
80 Campus Assessment Report - Site G Fence & Guardrails G Baseball Field G Covered Walkways Mar 10, 2017 Page 80 of 91
81 Campus Assessment Report - Site G Football Field G Playing Field G Softball Field Mar 10, 2017 Page 81 of 91
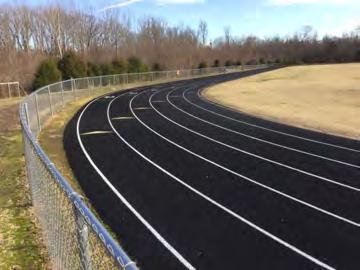
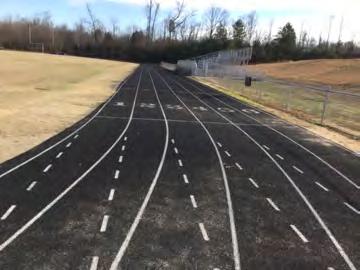
82 Campus Assessment Report - Site G Track G Landscaping G Water Supply Mar 10, 2017 Page 82 of 91
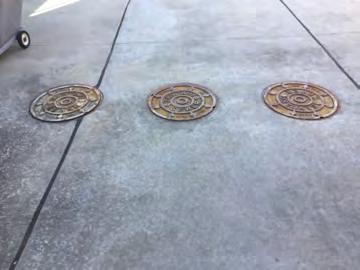

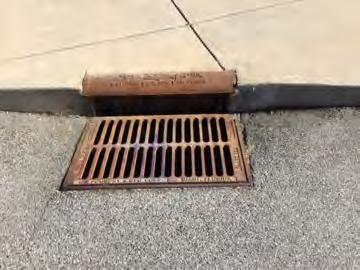

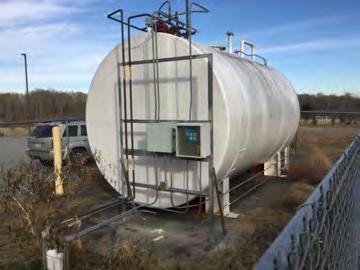
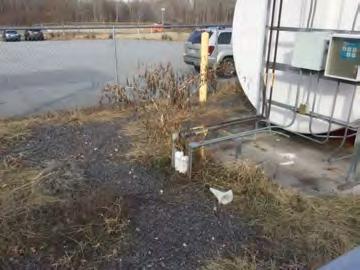
83 Campus Assessment Report - Site G Sanitary Sewer G Storm Sewer G Fuel Distribution Mar 10, 2017 Page 83 of 91


84 Campus Assessment Report - Site G Electrical Distribution G Site Lighting G Site Communications & Security Mar 10, 2017 Page 84 of 91
85 Campus Assessment Report - Site Renewal Schedule ecomet forecasts future Capital Renewal projects for expiring systems based on the Calculated Next Renewal year found in the system listing. There is a 3% yearly inflation factor applied to the system costs expiring in the future. The table below reflects Capital Renewal projects over the next 10 years. Blank cells (or $0) indicate no systems are scheduled for renewal in that year. Inflation Rate: 3% System Current Deficiencies Total Total: $171,600 $0 $0 $0 $0 $104,415 $0 $0 $256,719 $0 $2,667,136 $3,199,870 G - Building Sitework $0 $0 $0 $0 $0 $0 $0 $0 $0 $0 $0 $0 G20 - Site Improvements $0 $0 $0 $0 $0 $0 $0 $0 $0 $0 $0 $0 G Roadways $171,600 $0 $0 $0 $0 $0 $0 $0 $0 $0 $0 $171,600 G Parking Lots $0 $0 $0 $0 $0 $0 $0 $0 $0 $0 $0 $0 G Pedestrian Paving $0 $0 $0 $0 $0 $0 $0 $0 $0 $0 $0 $0 G Site Development $0 $0 $0 $0 $0 $0 $0 $0 $0 $0 $0 $0 G Fence & Guardrails $0 $0 $0 $0 $0 $0 $0 $0 $0 $0 $0 $0 G Baseball Field $0 $0 $0 $0 $0 $0 $0 $0 $0 $0 $973,869 $973,869 G Covered Walkways $0 $0 $0 $0 $0 $0 $0 $0 $0 $0 $0 $0 G Football Field $0 $0 $0 $0 $0 $0 $0 $0 $0 $0 $650,622 $650,622 G Playing Field $0 $0 $0 $0 $0 $0 $0 $0 $0 $0 $339,754 $339,754 G Softball Field $0 $0 $0 $0 $0 $0 $0 $0 $0 $0 $702,891 $702,891 G Track $0 $0 $0 $0 $0 $0 $0 $0 $256,719 $0 $0 $256,719 * G Landscaping $0 $0 $0 $0 $0 $0 $0 $0 $0 $0 $0 $0 G30 - Site Mechanical Utilities $0 $0 $0 $0 $0 $0 $0 $0 $0 $0 $0 $0 G Water Supply $0 $0 $0 $0 $0 $0 $0 $0 $0 $0 $0 $0 G Sanitary Sewer $0 $0 $0 $0 $0 $0 $0 $0 $0 $0 $0 $0 G Storm Sewer $0 $0 $0 $0 $0 $0 $0 $0 $0 $0 $0 $0 G Fuel Distribution $0 $0 $0 $0 $0 $0 $0 $0 $0 $0 $0 $0 G40 - Site Electrical Utilities $0 $0 $0 $0 $0 $0 $0 $0 $0 $0 $0 $0 G Electrical Distribution $0 $0 $0 $0 $0 $0 $0 $0 $0 $0 $0 $0 G Site Lighting $0 $0 $0 $0 $0 $0 $0 $0 $0 $0 $0 $0 G Site Communications & Security $0 $0 $0 $0 $0 $104,415 $0 $0 $0 $0 $0 $104,415 * Indicates non-renewable system Mar 10, 2017 Page 85 of 91
86 Campus Assessment Report - Site Forecasted Capital Renewal Requirement The following chart shows the current building deficiencies and forecasting capital renewal or sustainment requirements over the next ten years. $3,000,000 $2,667,136 $2,000,000 $1,000,000 $171,600 $104,415 $256,719 $0 Current Deficiencies Mar 10, 2017 Page 86 of 91
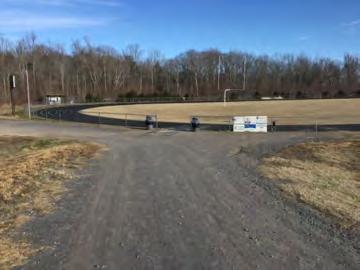
87 Campus Assessment Report - Site Deficiency Summary by System Current deficiencies included assemblies that have reached or exceeded their design life or components of the assemblies that are in need of repair. Assemblies that have reached their design life are identified as current deficiencies and assigned the distress 'Beyond Useful Life'. The following chart lists all current deficiencies associated with this facility. G2010 Roadways $171, Budget Estimate Total: $171, Mar 10, 2017 Page 87 of 91
88 Campus Assessment Report - Site Deficiency Summary by Priority The following chart shows the total repair costs broken down by priority. Assessors assigned deficiencies within ecomet to one of the following priority categories: 1 - Currently Critical (Immediate) 2 - Potentially Critical (Year 1) 3 - Necessary/Not Yet Critical (Years 2-5) 4 - Recommended (Years 6-10) - $171, Codes or Standards Compliance Budget Estimate Total: $171, Mar 10, 2017 Page 88 of 91
89 Campus Assessment Report - Site Deficiency By Priority Investment Table The table below shows the current investment cost grouped by deficiency priority and building system. 1 - Currently Critical (Immediate) 2 - Potentially Critical (Year 1) 3 - Necessary/Not Yet Critical (Years 2-5) 4 - Recommended (Years 6-10) 5 - Codes or Standards Compliance System Code System Description Total G2010 Roadways $0.00 $0.00 $0.00 $171, $0.00 $171, Total: $0.00 $0.00 $0.00 $171, $0.00 $171, Mar 10, 2017 Page 89 of 91
90 Campus Assessment Report - Site Deficiency Summary by Category The following chart shows the total repair costs broken down by deficiency categories. Assessors assigned deficiencies to one of the following categories: Deferred Maintenance / Safety - $171, Budget Estimate Total: $171, Mar 10, 2017 Page 90 of 91
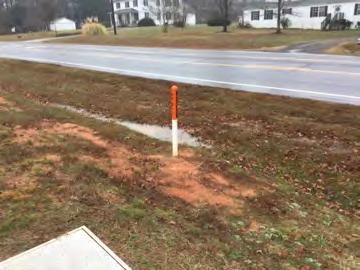
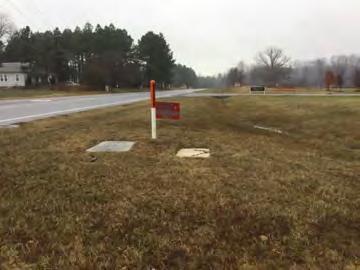
: G2010 - Roadways Location: Distress: Category: Priority: Correction: Qty: Unit of Measure: Estimate: Assessor Name: Date Created: Bus lot to athletic fields")
91 Campus Assessment Report - Site Deficiency Details by Priority The deficiency detail notes listed below provide additional information on identified deficiencies found within the facility. Priority 4 - Recommended (Years 6-10): G Roadways Location: Distress: Category: Priority: Correction: Qty: Unit of Measure: Estimate: Assessor Name: Date Created: Bus lot to athletic fields Missing Deferred Maintenance / Safety 4 - Recommended (Years 6-10) Resurface the roadway 1, L.F. $171, Terence Davis 02/11/2017 Notes: The road to the athletic fields is gravel. The circulation road east of the building is gravel. Paving with asphalt is recommended for safety and appearance.. Mar 10, 2017 Page 91 of 91
Davie County Early College High
 NC School District/300 Davie County/High School Davie County Early College High Final Campus Assessment Report March 10, 2017 PARSONS Campus Assessment Report Table of Contents Campus Executive Summary
NC School District/430 Harnett County/Middle School Highland Middle Final Campus Assessment Report March 11, 2017
 NC School District/430 Harnett County/Middle School Highland Middle Final Campus Assessment Report March 11, 2017 PARSONS Campus Assessment Report Table of Contents Campus Executive Summary 5 Campus Dashboard
Anson County Early College High
 NC School District/040 Anson County/High School Anson County Early College High Final Campus Assessment Report March 11, 2017 PARSONS Campus Assessment Report Table of Contents Campus Executive Summary
Laurel Hill Elementary
 NC School District/830 Scotland County/Elementary School Laurel Hill Elementary Final Campus Assessment Report March 11, 2017 PARSONS Campus Assessment Report Table of Contents Campus Executive Summary
Mocksville Elementary
 NC School District/300 Davie County/Elementary School Mocksville Elementary Final Campus Assessment Report March 10, 2017 PARSONS Campus Assessment Report Table of Contents Campus Executive Summary 5 Campus
Anderson Creek Primary
 NC School District/430 Harnett County/Elementary School Anderson Creek Primary Final Campus Assessment Report March 11, 2017 PARSONS Campus Assessment Report Table of Contents Campus Executive Summary
Harnett Central High
 NC School District/430 Harnett County/High School Harnett Central High Final Campus Assessment Report March 11, 2017 PARSONS Campus Assessment Report Table of Contents Campus Executive Summary 6 Campus
Pinebrook Elementary
 NC School District/300 Davie County/Elementary School Pinebrook Elementary Final Campus Assessment Report March 10, 2017 PARSONS Campus Assessment Report Table of Contents Campus Executive Summary 6 Campus
NC School District/520 Jones County/Elementary School Trenton Elementary Final Campus Assessment Report March 11, 2017
 NC School District/520 Jones County/Elementary School Trenton Elementary Final Campus Assessment Report March 11, 2017 PARSONS Campus Assessment Report Table of Contents Campus Executive Summary 4 Campus
NC School District/430 Harnett County/Elementary School Coats Elementary Final Campus Assessment Report March 11, 2017
 NC School District/430 Harnett County/Elementary School Coats Elementary Final Campus Assessment Report March 11, 2017 PARSONS Campus Assessment Report Table of Contents Campus Executive Summary 5 Campus
Central Davie Academy
 NC School District/300 Davie County/High School Central Davie Academy Final Campus Assessment Report March 10, 2017 PARSONS Campus Assessment Report Table of Contents Campus Executive Summary 4 Campus
Harnett Central Middle
 NC School District/430 Harnett County/Middle School Harnett Central Middle Final Campus Assessment Report March 11, 2017 PARSONS Campus Assessment Report Table of Contents Campus Executive Summary 5 Campus
DeKalb County School District/Elementary Schools Dunwoody Elementary Final School Assessment Report May 19, 2016
 DeKalb County School District/Elementary Schools Dunwoody Elementary Final School Assessment Report May 19, 2016 PARSONS School Assessment Report Table of Contents School Executive Summary 4 School Condition
Lafayette Elementary
 NC School District/430 Harnett County/Elementary School Lafayette Elementary Final Campus Assessment Report March 11, 2017 PARSONS Campus Assessment Report Table of Contents Campus Executive Summary 5
Mountain Heritage High
 NC School District/995 Yancey County/High School Mountain Heritage High Final Campus Assessment Report March 12, 2017 PARSONS Campus Assessment Report Table of Contents Campus Executive Summary 7 Campus
Pleasantdale Elementary
 DeKalb County School District/Elementary Schools Pleasantdale Elementary Final School Assessment Report May 20, 2016 PARSONS School Assessment Report Table of Contents School Executive Summary 5 School
Lilesville Elementary
 NC School District/040 Anson County/Elementary School Lilesville Elementary Final Campus Assessment Report March 11, 2017 PARSONS Campus Assessment Report Table of Contents Campus Executive Summary 4 Campus
DeKalb County School District/High Schools Druid Hills High Final School Assessment Report May 19, 2016
 DeKalb County School District/High Schools Druid Hills High Final School Assessment Report May 19, 2016 PARSONS School Assessment Report Table of Contents School Executive Summary 5 School Condition Summary
Ronald E. McNair Discovery Learning Academy
 DeKalb County School District/Elementary Schools Ronald E. McNair Discovery Learning Academy Final School Assessment Report May 20, 2016 PARSONS School Assessment Report Table of Contents School Executive
Robert Shaw Theme Elementary
 DeKalb County School District/Elementary Schools Robert Shaw Theme Elementary Final School Assessment Report May 20, 2016 PARSONS School Assessment Report Table of Contents School Executive Summary 4 School
William Bradley Bryant Center
 DeKalb County School District/Education Other William Bradley Bryant Center Final School Assessment Report May 19, 2016 PARSONS School Assessment Report Table of Contents School Executive Summary 4 School
Stone Mountain Middle
 DeKalb County School District/Middle Schools Stone Mountain Middle Final School Assessment Report May 20, 2016 PARSONS School Assessment Report Table of Contents School Executive Summary 4 School Condition
DeKalb Elementary School of the Arts at Terry Mills
 DeKalb County School District/Elementary Schools DeKalb Elementary School of the Arts at Terry Mills Final School Assessment Report May 19, 2016 PARSONS School Assessment Report Table of Contents School
Sagamore Hills Elementary
 DeKalb County School District/Elementary Schools Sagamore Hills Elementary Final School Assessment Report May 20, 2016 PARSONS School Assessment Report Table of Contents School Executive Summary 4 School
DeKalb County School District/Middle Schools Chapel Hill Middle Final School Assessment Report May 20, 2016
 DeKalb County School District/Middle Schools Chapel Hill Middle Final School Assessment Report May 20, 2016 PARSONS School Assessment Report Table of Contents School Executive Summary 3 School Condition
Bob Mathis Elementary
 DeKalb County School District/Elementary Schools Bob Mathis Elementary Final School Assessment Report May 19, 2016 PARSONS School Assessment Report Table of Contents School Executive Summary 4 School Condition
NC School District/430 Harnett County/Elementary School Gentry Primary Final Campus Assessment Report March 11, 2017
 NC School District/430 Harnett County/Elementary School Gentry Primary Final Campus Assessment Report March 11, 2017 PARSONS Campus Assessment Report Table of Contents Campus Executive Summary 6 Campus
Martin Luther King Jr. High
 DeKalb County School District/High Schools Martin Luther King Jr. High Final School Assessment Report May 19, 2016 PARSONS School Assessment Report Table of Contents School Executive Summary 4 School Condition
DeKalb County School District/Middle Schools Peachtree Middle Final School Assessment Report May 20, 2016
 DeKalb County School District/Middle Schools Peachtree Middle Final School Assessment Report May 20, 2016 PARSONS School Assessment Report Table of Contents School Executive Summary 3 School Condition
Listing of Events Fort McMurray Roman Catholic Seperate School District Fr. M. Beauregard School
 Fort McMurray Roman Catholic Seperate School District Fr. M. Beauregard School Building Events 2004 2005 2006 2007 2008 Total Code Repair Add ventilation to storage room $ 1,000.00 $ - $ - $ - $ - $ 1,000.00
ORIGINAL YEAR OF CONSTRUCTION NUMBER OF BUILDING STORIES 2/15/2013 BUILDING SURVEY DATE
 0807 3502 SOUTH FIRST STREET CHAMPAIGN, ILLINOIS SYSTEM CONDITION INDEX.771 PRIMARY BUILDING USE BUILDING SURVEY TEAM BUILDING SYSTEM REPLACEMENT COST $ 347,400 LABORATORY BUILDING GROSS SQUARE FEET 16,986
Backlog Reduction Plan
 2003-2013 Executive Summary proposes to achieve reductions in our facilities maintenance backlog by documenting and completing backlog projects on a priority basis and by minimizing or eliminating future
Social Housing Administration Directive No
 Regional Municipality of Halton Social Housing Administration Directive No. 06-05 Date: August 30, 06 To: Federally-Funded Social Housing Providers subject to Operating Agreements under Section 95 of the
Subject: Capital Reserve Expenditure Guidelines. *incl. former OCHAP/CSHP Peel Access to Housing (PATH)
") HIP Housing In Peel Subject: Capital Reserve Expenditure Guidelines Date: August 1, 2012 Applicable To The information contained in this document applies to the following: Municipal & Private Non- Federal
HIP Housing In Peel Subject: Capital Reserve Expenditure Guidelines Date: August 1, 2012 Applicable To The information contained in this document applies to the following: Municipal & Private Non- Federal
Integrating Green Building Measures into Capital Planning for HUD Assisted and Public Housing Programs
 Building Bridges to Net Zero Integrating Green Building Measures into Capital Planning for HUD Assisted and Public Housing Programs Evolution of HUD's Green Capital Needs Assessment, and the new CNA etool
Howsyth Court Condominium Corporation No. CCN Avenue SW Calgary, Alberta
 Entuitive Corporation Calgary + Toronto Howsyth Court Condominium Corporation No. CCN9011190 305 25 Avenue SW Calgary, Alberta Submitted By: Entuitive Corporation 209 8 th Avenue SW, Suite 300 Calgary,
BUILDING CONDITION ASSESSMENT. A Comprehensive Approach in Energy and Facility Management
 BUILDING CONDITION ASSESSMENT A Comprehensive Approach in Energy and Facility Management Presentation Outline Page Nadine International Company Profile.. 3 FCI -Industry Preferred Formula.... 4 FCI -Other
Educational & Performing Arts Center: Downriver Campus
 Educational & Performing Arts Center: Total Estimated Project Construction Cost: $ 18.04 million Groundbreaking: September 2006 Percentage Completed: 100 percent Anticipated Completion Date: Completed
City School District of Albany Five Year Facilities Plan 3/14/2019
 Bold indicates change from 3/7/19 BOE meeting Available Local Share $ 3,300,000 1 SPA Air condition gymnasium $ 267,000 1 $ 41,385 $ 41,385 $ 267,000 2 DCS Air condition gymnasium $ 221,000 1 $ 34,255
CAPITAL RESERVE STUDY
 CAPITAL RESERVE STUDY FOR THE HIALEAH CONDOMINIUM WILDWOOD CREST, NEW JERSEY Project Number: 12-1066 W:\2012\12-1066\CORR\12-1066v1.doc Date: March 29, 2013 Table of Contents Section Page Executive Summary...
Urban Heights Condominium
 Condominium Capital 2011 2010, AssociationAnalysis, LLC Condominium Prepared For: Table of Contents Condominium Association, Inc. 1642 Maxwell Road Atlanta, GA 30012 October 19, 2010 INTRODUCTION INTRODUCTION
Marion County Marion Public County Works Public Building Works Inspection Division
 FEE SCHEDULE The final determination of valuation, occupancy, and/or construction type under any of the provisions of this order shall be made by the Building Official. A. Structural Permits: The valuation
Our Focus: Your Future
 Town of Fort Erie Infrastructure Services Our Focus: Your Future Prepared for Council-in-Committee Report No. IS-53-07 Agenda Date November 19, 2007 File No. 220102 Subject 5 YEAR FACILITY CONDITION STATUS
Northern Gateway Regional Division No.10 Listing of Events
 Building Events Maintenance Events D2020.01.03 Piping Specialties (Backflow Preventors)** David Ovans Elementary School B3989A Code Northern Gateway Regional Division No.10 Install vacuum breakers on non
VENDOR PREQUALIFICATION FORM
 VENDOR PREQUALIFICATION FORM Date: Please complete this form and return to Rockford Construction via e mail (prequal@rockfordconstruction.com) or fax (1 616 285 8423 must include the 1 616). Name of Company
Release Date: January 3, 2019 Due Date: January 17, 2019
 SAN JUAN SCHOOL DISTRICT REQUEST FOR BID CONSTRUCTION OF NEW BLUFF ELEMENTARY SCHOOL AND NEW MONTEZUMA CREEK ELEMENTARY GYM Release Date: January 3, 2019 Due Date: January 17, 2019 I. GENERAL A. Intent
PROFESSIONAL RESERVE STUDY
 PROFESSIONAL RESERVE STUDY Seavue Condominiums 130-5 th Avenue South, Edmonds, WA 98020 For: Seavue Homeowners Association c/o Jay Grant Board President (202) 351-9399 Prepared By: Jeff Samdal, PE, RS,
NCAHMA Spring Underwriting Forum April 7-8, 2010 Physical Needs Assessments
 NCAHMA Spring Underwriting Forum April 7-8, 2010 Physical Needs Assessments 1. What is a CNA? Presentation by: Thomas E. Fielder Phone: 859-276-0000 / tfielder@fieldergroup.com a) Comprehensive review
 RESERVE STUDY Component Analysis and Reserve Fund Plan Annual Review Study 2016/17 For Middlefield Meadows HOA Mountain View, CA Prepared By RESERVE ANALYSIS CONSULTING, LLC 1750 Bridgeway, Suite B106
ORIGINAL YEAR OF CONSTRUCTION NUMBER OF BUILDING STORIES 4/19/2013 BUILDING SURVEY DATE
 0134 614 EAST PENNSYLVANIA AVENUE CHAMPAIGN, ILLINOIS 61820 SYSTEM CONDITION INDEX.528 PRIMARY BUILDING USE BUILDING SURVEY TEAM BUILDING SYSTEM REPLACEMENT COST $ 495,100 LABORATORY BUILDING GROSS SQUARE
Washingtonville Central School District Building Condition Survey Five Year Plan
 Building Condition Survey Five Year Plan Project Cost Summary Building 2011 2012 2013 2014 2015 Totals 0001 Washingtonville Jr High School $38,759 $325,990 $1,882,653 $1,417,341 $1,025,559 $4,690,302 0002
Reserve Study Transmittal Letter
 Reserve Study Transmittal Letter Date: January 18, 2012 To: Michael Lee, Collins Management Co. From: Richard Avelar & Associates (RA&A) Re: Bridgewater Condominium Association Attached, please find the
REPLACEMENT RESERVE GUIDE
 CANADA MORTGAGE AND HOUSING CORPORATION REPLACEMENT RESERVE GUIDE What is the Replacement Reserve? The replacement reserve is a fund kept by each housing sponsor under the terms of its operating agreement
1. CALL TO ORDER AND RECOGNITION OF A QUORUM
 Mesa Union School District Agenda for the Special Board Meeting of the Board of Trustees to be held on Thursday, May 3, 2018, at 6:00 p.m. in the School Multi-Purpose Room located at 3901 North Mesa School
Desktop Facilities Assessment
 Desktop Facilities Assessment Town of Gravenhurst 3-5 Pineridge Gate Gravenhurst, Ontario PP Z3 R.J. Burnside & Associates Limited 28 Wellington Street West Suite 30 Barrie ON L4N 8J6 CANADA January 20,
THE VINEYARDS AT DUBLIN GREENE OWNERS ASSOCIATION
 THE VINEYARDS AT DUBLIN GREENE OWNERS ASSOCIATION Full Reserve Study With On-site Visual Inspection October 3, 2018 Reserve Study for Fiscal Year: 01/01/2019 through 12/31/2019 2059 Camden Ave. Suite 151
RESERVESTUDYUPDATE. The Villas at Blackberry Run Dallas, GA. Prepared for:
 RESERVESTUDYUPDATE Dallas, GA Prepared for: THE VILLAS AT BLACKBERRY RUN HOME OWNERS ASSOCIATION, INC. Carl Swanson-President Prepared by: CRITERIUM-CARUSO ENGINEERS 1065 POWERS PLACE, SUITE B ALPHARETTA,
ORIGINAL YEAR OF CONSTRUCTION NUMBER OF BUILDING STORIES 6/19/2013 BUILDING SURVEY DATE
 0154 52 EAST GREGORY DRIVE CHAMPAIGN, ILLINOIS 61820 SYSTEM CONDITION INDEX.646 PRIMARY BUILDING USE BUILDING SURVEY TEAM BUILDING SYSTEM REPLACEMENT COST $ 1,203,500 OFFICE BUILDING GROSS SQUARE FEET
ORIGINAL YEAR OF CONSTRUCTION NUMBER OF BUILDING STORIES 2/6/2013 BUILDING SURVEY DATE
 0133 608 EAST PENNSYLVANIA AVENUE CHAMPAIGN, ILLINOIS 61820 SYSTEM CONDITION INDEX.516 PRIMARY BUILDING USE BUILDING SURVEY TEAM BUILDING SYSTEM REPLACEMENT COST $ 646,900 PARKING STRUCTURE BUILDING GROSS
Agenda Item # 5b Page 1 of 43
 Page 1 of 43 Page 2 of 43 Page 3 of 43 Page 4 of 43 Page 5 of 43 Page 6 of 43 Page 7 of 43 Page 8 of 43 Page 9 of 43 Page 10 of 43 Page 11 of 43 Page 12 of 43 Page 13 of 43 Page 14 of 43 Page 15 of 43
Update With Site Visit
 Update With Site Visit Le Chateau Bellevue, WA 10/28/2011 Report #1002 Phone: 253-241-8151 Fax: 360-872-8073 E-mail: jeremy@reservesolutions.net www.reservesolutions.net Le Chateau Client Info: REPORT
Reserve Request Instructions: Documentation Requirements
 Reserve Request Instructions: Documentation Requirements These instructions specify documentation that must be submitted with requests for withdrawals from property reserve accounts held by IHDA. All requests
ORIGINAL YEAR OF CONSTRUCTION NUMBER OF BUILDING STORIES 6/18/2013 BUILDING SURVEY DATE
 0238 URBANA, ILLINOIS 61801 SYSTEM CONDITION INDEX.183 PRIMARY BUILDING USE BUILDING SURVEY TEAM BUILDING SYSTEM REPLACEMENT COST $ 1,237,600 OFFICE BUILDING GROSS SQUARE FEET 18,054 NUMBER OF BUILDING
Town of Windermere. Fee Directory
 Town of Windermere Fee Directory ADMINISTRATION Copy Fees Black & White One-sided $ 0.15 Double-sided $ 0.20 Color Media One-sided $ 0.25 Double-sided $ 0.50 Copy to CD $ 0.50 Certified Copy - Additional
ORIGINAL YEAR OF CONSTRUCTION NUMBER OF BUILDING STORIES 6/5/2013 BUILDING SURVEY DATE
 0062 1105 WEST NEVADA STREET URBANA, ILLINOIS 61801 SYSTEM CONDITION INDEX.850 PRIMARY BUILDING USE BUILDING SURVEY TEAM BUILDING SYSTEM REPLACEMENT COST $ 2,286,000 LABORATORY BUILDING GROSS SQUARE FEET
CITY OF FORT PIERCE BUILDING DEPARTMENT
 CITY OF FORT PIERCE BUILDING DEPARTMENT APPLICATION FOR DETERMINATION OF SUBSTANTIAL IMPROVEMENT This is a request for determination by the City s Floodplain Administrator as to whether or not the project
ORIGINAL YEAR OF CONSTRUCTION NUMBER OF BUILDING STORIES 6/4/2013 BUILDING SURVEY DATE
 0218 504 EAST ARMORY AVENUE CHAMPAIGN, ILLINOIS 61820 SYSTEM CONDITION INDEX.764 PRIMARY BUILDING USE BUILDING SURVEY TEAM BUILDING SYSTEM REPLACEMENT COST $ 1,714,300 OFFICE BUILDING GROSS SQUARE FEET
Reserve Studies Turnover Reports Insurance Appraisals
 Reserve Studies Turnover Reports Insurance Appraisals Dear Board Members, Managers and Unit Owners, For twenty years we having been serving community associations throughout Florida and the Southeast United
OVERSIGHT OF MEASURE C SPENDING THE CITIZENS OVERSIGHT COMMITTEE
 MEASURE C SCHOOL SAFETY AND MODERNIZATION On November 3, 2009 the voters residing in the Mill Valley School District (MVSD) approved the Measure C Safety and Modernization Bond of 2009 (Measure C). Measure
DEPRECIATION REPORT Strata VR 1591 The Leicester West 13th Avenue Vancouver BC V6J 2G5
 DEPRECIATION REPORT 2015 Strata VR 1591 The Leicester 1545 West 13th Avenue Vancouver BC V6J 2G5 Created by Strata Council Members Merry Meredith Tom Heise Antoine Issa The authors have compiled this report
WASHINGTON BROWN DEPRECIATION PTY LTD
 Wednesday, 4 July 2007 The Owners - Strata Plan Number C/- Strata Management Company Address PROPERTY ADDRESS SINKING FUND FORECAST REPORT For the attention of: Strata Manager Dear Strata Manager, In accordance
PROFESSIONAL RESERVE STUDY
 PROFESSIONAL RESERVE STUDY Cambridge Court 9512-1 st Avenue Northeast, Seattle, WA 98115 For: Cambridge Court Homeowners Association c/o Tim Kammer, Property Manager Condo Managements, Inc. 1661 Harbor
CH-UH Board of Education Meeting. June 27, 2017
 CH-UH Board of Education Meeting June 27, 2017 Tonight s Agenda Purpose of this work session Current status of the Master Facilities Plan Phase 1 Factors that led us to this point Current path for middle
Reserve Analysis Report
 Reserve Analysis Report Parkway Towers 1155 Ash St Denver, CO 80220 Level I Study with Site Inspection Fiscal Year End Date: 12/31/2014 8597 Via Mallorca Suite E La Jolla, CA 92037 Phone: 858-764-1895
Hyde Park Place Owners' Association, Inc.
 RESERVE STUDY Full Study Hyde Park Place Owners' Association, Inc. Published - February 10, 2016 Browning Reserve Group / Emmett, ID 83617 Office (208) 365-0977 Tony@BrowningRG.com / www.browningrg.com
Year Per Manor Per Month Assessment Total Contribution United Laguna Woods Mutual 2019 RESERVES PLAN Reserve 30-Year Funding Plan Interest Earnings Th
 Year Per Manor Per Month Assessment Total Contribution United Laguna Woods Mutual 2019 RESERVES PLAN Reserve 30-Year Funding Plan Interest Earnings Threshold (Min Balance): $ 10,400,000 Indexed for projected
Reference: The Bel-Harbour Condominium Association Reserve Study Update Kipcon Great Lakes Project No CRU
 August 18, 2016 Mr. Nicholas Burbulis 420 W. Belmont Ave. Chicago, IL 60657 Reference: The Kipcon Great Lakes Dear Mr. Burbulis: Attached, please find Kipcon Great Lakes, which has been prepared for the.
Hayfield Community Schools Bond Referendum. Vote Monday, September 11, Our Schools Our Communities Our Future
 Hayfield Community Schools 2017 Bond Referendum Vote Monday, September 11, 2017 Our Schools Our Communities Our Future 2017 Bond Referendum What s Already Been Done? Studies and Meetings and Meetings 2014-15
VILLAGE AT LAKE CHELAN
 VILLAGE AT LAKE CHELAN Manson, Washington STANDARD LEVEL 3 RESERVE STUDY UPDATE WITHOUT A SITE VISIT With funding recommendations for the 2019 fiscal year Issued October, 2018 Next Update: Level 3 by October,
THIS IS AN APPLICATION FOR A BUILDING PERMIT
 THIS IS AN APPLICATION FOR A BUILDING PERMIT 1. Read these instructions and carefully complete the application. 2. No building or structure shall be erected, added to or structurally altered or the use
- RS. D e sig n atio n
 ALEXANDER LIU CAI - RS Reserve D e sig n atio n Specialist Sample Table Of HOA Contents Project Table of Contents Page Preface i Executive Summary 1 Membership Disclosure Summary 2 Disclosure Statement
Welcome Home. The living is easy at Bayshore Dunes!
 Welcome Home www.bayshoredunes.com The living is easy at Bayshore Dunes! Welcome to your new backyard! Welcome Home to Bayshore Dunes www.bayshoredunes.com Areas of Interest Direct Private Beach Access
Reserve Study Transmittal Letter
 Reserve Study Transmittal Letter Date: November 13, 2013 To: Rob Ross, Gateview From: Richard Avelar & Associates (RA&A) Re: Gateview; Update w/ Site Visit Review Attached, please find the reserve study
Building Division Fees 2018
 Building Division Fees 2018 Permit Administration A permit administration fee of $45.00 shall be assessed for each permit. Staff Consultation Fee $75.00 Administration Determination $90.00 / hour; $23.00
Springfield High School
 5.1 Springfield High School Springfield School District Delaware County - Pennsylvania Master Plan Presentation Town Hall Meeting 5 Project Cost Estimates/ Project Financing Strategy / Tax Impact February
What did they tell me?
 LBS Insurance Commission Oct 25, 2018 What did they tell me? Handouts from the October 25, 2018 Insurance Town Hall C R. Reynolds 1 High Level Recap of Changes for 2018-19 Deductible $5,000 -> $25,000
Town of Middleton Salt Storage Building Pioneer Road Pioneer Lands Town of Middleton Dane County, WI 53562
 Town of Middleton Salt Storage Building Pioneer Road Pioneer Lands Town of Middleton Dane County, WI 53562 1 T100 PROJECT LOCATION MAP Scale: NTS N Revisions: No. Date: Description: Scale As Indicated
SOMERSET CREEK STANDARD LEVEL 3 RESERVE STUDY UPDATE WITHOUT A SITE VISIT. With funding recommendations for the 2019 fiscal year
 SOMERSET CREEK Bellevue, Washington STANDARD LEVEL 3 RESERVE STUDY UPDATE WITHOUT A SITE VISIT With funding recommendations for the 2019 fiscal year Issued April, 2018 Next Update: Level 2 by April, 2019
CITY OF TAMARAC BUILDING DEPARTMENT Schedule of Permit Fees
 CITY OF TAMARAC BUILDING DEPARTMENT Schedule of Permit Fees SECTION I: As set forth in Section 105 of the Broward County Amendments to the 5th Edition (2014) Florida Building Code, it is unlawful for any
Quality Built Custom Homes Now Pre-Selling New Homes from the $250's
 Quality Built Custom Homes Now Pre-Selling New Homes from the $250's On-Site Agent Dominic Bamford 678-408-0085 dominic@bamfordandcompany.com www.bamfordandcompany.com Dominic Bamford 678-753-6050 info@bamfordandcompany.com
Capital Projects Completed since 1988
 Projects Completed since 1988 Project Cost FY1988 ICCB Building Illinois Repair & Renovation - Replace Carpet in Classroom Buildings, Library and Lobby of Admin $ 51,901.00 $ 51,901.00 $ 51,901.00 FY1990
Building Permit Fees
 Permit Center 210 Lottie Street, Bellingham, WA 98225 Phone: (360) 778-8300 Fax: (360) 778-8301 TTY: (360) 778-8382 Email: permits@cob.org Web: www.cob.org/permits Building Permit Fees This handout includes
DRAFT CAPITAL RESERVE STUDY. The Piano Works Condominium Association. Deep River, Connecticut FOR THE. Project Number:
 CAPITAL RESERVE STUDY DRAFT FOR THE Management Company: Sound Real Estate Services, Contact Name: Josh Parsons Date: August 22, 2016 Table of Contents Section Name Section # Executive Summary... 1 Reserve
EXHIBIT A CITY OF OLDSMAR PERMIT, INSPECTION AND PLANS EXAMINATION FEE SCHEDULE
 1. Building Permit EXHIBIT A CITY OF OLDSMAR PERMIT, INSPECTION AND PLANS EXAMINATION FEE SCHEDULE a. This fee schedule is applicable to all building permits issued by the City of Oldsmar, Building Division
CAPITAL RESERVE STUDY. Meadow Wood Commons. City, State
 CAPITAL RESERVE STUDY FOR THE Meadow Wood Commons City, State Management Company: Any Management Company Contact Name: Mr. Bob Smith Date: July 28, 2014 Table of Contents Section Name Section # Executive
ORIGINAL YEAR OF CONSTRUCTION NUMBER OF BUILDING STORIES 4/11/2013 BUILDING SURVEY DATE
 0040 1402 WEST PENNSYLVANIA AVENUE URBANA, ILLINOIS 61801 SYSTEM CONDITION INDEX.685 PRIMARY BUILDING USE BUILDING SURVEY TEAM BUILDING SYSTEM REPLACEMENT COST $ 1,364,800 LECTURE HALL BUILDING GROSS SQUARE
THIS IS A PAYMENT CLAIM MADE UNDER THE CONSTRUCTION CONTRACTS ACT 2002 A PAYMENT CLAIM MADE IN RELATION TO THE FOLLOWING CONSTRUCTION CONTRACT:
 THIS IS A PAYMENT CLAIM MADE UNDER THE CONSTRUCTION CONTRACTS ACT 2002 FROM: Name (or/payee) Contact Person/Representative Address Ph Email TO: Name (Owner/Principal/PAYER) Contact Person/Representative
ALAMEDA ISLES PROPOSED BUDGET FACT SHEET
 ALAMEDA ISLES PROPOSED BUDGET FACT SHEET These sheets outline the proposed 2016/2017 budget in two parts. The first part is the operating budget which shows our income and anticipated expenses with a comparative
Action Item. Sid Albaugh, Assistant Superintendent Business Services. Consideration of Approval of 2018 Measure A - Facilities Project List
 Action Item TO: PRESENTED BY: BOARD AGENDA ITEM: Board of Trustees and Superintendent of Schools Sid Albaugh, Assistant Superintendent Business Services Consideration of Approval of 2018 Measure A Facilities
ORIGINAL YEAR OF CONSTRUCTION NUMBER OF BUILDING STORIES 6/6/2013 BUILDING SURVEY DATE
 0002 1301 SOUTH GOODWIN AVENUE URBANA, ILLINOIS 61801 SYSTEM CONDITION INDEX.862 PRIMARY BUILDING USE BUILDING SURVEY TEAM BUILDING SYSTEM REPLACEMENT COST $ 746,400 CLASSROOMS / LIBRARY BUILDING GROSS