Pinebrook Elementary
|
|
|
- Scarlett Harrison
- 5 years ago
- Views:
Transcription


1 NC School District/300 Davie County/Elementary School Pinebrook Elementary Final Campus Assessment Report March 10, 2017 PARSONS
2 Campus Assessment Report Table of Contents Campus Executive Summary 6 Campus Dashboard Summary 9 Campus Condition Summary Main Building 12 Executive Summary 12 Dashboard Summary 13 Condition Summary 14 Photo Album 15 Condition Detail 16 System Listing 17 System Notes 19 Renewal Schedule 30 Forecasted Sustainment Requirement 32 Deficiency Summary By System 33 Deficiency Summary By Priority 34 Deficiency By Priority Investment 35 Deficiency Summary By Category 36 Deficiency Details By Priority Storage 50 Executive Summary 50 Dashboard Summary 51 Condition Summary 52 Photo Album 53 Condition Detail 54 System Listing 55 System Notes 56 Renewal Schedule 58 Forecasted Sustainment Requirement 59 Deficiency Summary By System 60 Mar 10, 2017 Page 2 of 158
3 Campus Assessment Report Deficiency Summary By Priority 61 Deficiency By Priority Investment 62 Deficiency Summary By Category 63 Deficiency Details By Priority Addition 65 Executive Summary 65 Dashboard Summary 66 Condition Summary 67 Photo Album 68 Condition Detail 69 System Listing 70 System Notes 71 Renewal Schedule 81 Forecasted Sustainment Requirement 83 Deficiency Summary By System 84 Deficiency Summary By Priority 85 Deficiency By Priority Investment 86 Deficiency Summary By Category 87 Deficiency Details By Priority Addition 95 Executive Summary 95 Dashboard Summary 96 Condition Summary 97 Photo Album 98 Condition Detail 99 System Listing 100 System Notes 101 Renewal Schedule 110 Forecasted Sustainment Requirement 112 Deficiency Summary By System 113 Deficiency Summary By Priority 114 Mar 10, 2017 Page 3 of 158
4 Campus Assessment Report Deficiency By Priority Investment 115 Deficiency Summary By Category 116 Deficiency Details By Priority PreK Building 118 Executive Summary 118 Dashboard Summary 119 Condition Summary 120 Photo Album 121 Condition Detail 122 System Listing 123 System Notes 124 Renewal Schedule 132 Forecasted Sustainment Requirement 134 Deficiency Summary By System 135 Deficiency Summary By Priority 136 Deficiency By Priority Investment 137 Deficiency Summary By Category 138 Deficiency Details By Priority 139 Site 140 Executive Summary 140 Dashboard Summary 141 Condition Summary 142 Photo Album 143 Condition Detail 144 System Listing 145 System Notes 146 Renewal Schedule 151 Forecasted Sustainment Requirement 152 Deficiency Summary By System 153 Deficiency Summary By Priority 154 Deficiency By Priority Investment 155 Mar 10, 2017 Page 4 of 158
5 Campus Assessment Report Deficiency Summary By Category 156 Deficiency Details By Priority 157 Mar 10, 2017 Page 5 of 158
6 Campus Assessment Report - Pinebrook Elementary Campus Executive Summary Building condition is evaluated based on the functional systems and elements of a building and organized according to the UNIFORMAT II Elemental Classification. The grouping of these systems and elements and applying a current replacement value to them develops a representative building cost model. Cost Models are developed for similar building types and functions. Systems and their elements are evaluated based on their current replacement values, life cycles, installation dates and next renewal dates. Systems and their elements that are within their useful lives are further evaluated to identify current deficient conditions that may have a significant impact on a system's or element's remaining service life, and to determine if they are beyond their predicted expected life. The system's or element's current replacement value is based on RS Means Commercial Cost Data. Following are the cost model's system details for this facility. The Replacement Value is the amount needed to replace the property of the same present scope. The Repair Cost (the sum of the cost to repair/replace the Deficiencies) represents the budgeted contractor-installed costs plus owner's soft costs for the repair, replacement or renewal for a component or system level deficiency. It excludes contributing costs for other components or systems that might also be associated with the corrective actions due to packaging of the work. Facility Condition Index ( FCI) is an industry-standard measurement of facility condition calculated as the ratio of the costs to correct a facility's deficiencies (Condition Needs) to the facility's Current Replacement Value. It ranges from 0% (new) to 100% (very poor - beyond service life). The Remaining Service Life Index (RSLI) is calculated as the sum of a renewable system's Remaining Service Life (RSL) divided by the sum of a system's Replacement Value (both values exclude soft-cost to simplify calculation updates) expressed as a percentage ranging from 100% (new) to 0% (expired). The relationship between the key metrics FCI and RSLI is an important indicator, at either the facility, building, system, or component levels, of the condition trend and the imminent need for capital renewal. These indices exist in an inverse relationship wherein the FCI increases when systems reach their expected life-cycle age, whereas the RSLI decreases annually indicating the relative time remaining before reaching the life-cycle expiration age. For example, a facility or a system with a high RSLI and a low FCI indicates it is in the early portion of its useful life. However, a low RSLI indicates that expiration dates are approaching at which point the FCI would increase. The term FCA Score is the inverse of Total FCI and calculated as 100-Total FCI (without the %) where 100 is best and 0 is worst condition.. Gross Area (SF): Year Built: 78, Last Renovation: Replacement Value: Repair Cost: Total FCI: Total RSLI: $16,337,599 $8,189, % % FCA Score: Description: GENERAL: Pinebrook Elementary School is located at 477 Pinebrook School Road, Mocksville, NC. The campus consists of a total of 67,766 square foot of multiple one-story buildings constructed in 1970 and There have been two additions in 1997 and 2005 with no major renovations. In addition to the main building, the campus contains ancillary storage building. This report contains condition and adequacy data collected during the 2016 Facility Condition Assessment (FCA). Detailed condition and deficiency statements are contained in this report for the site and building elements. A. SUBSTRUCTURE The building rests on slab-on grade and is assumed to have standard cast-in-place concrete foundations. The building does not have a basement. Mar 10, 2017 Page 6 of 158
7 Campus Assessment Report - Pinebrook Elementary B. SUPERSTRUCTURE Roof construction is metal pan deck with lightweight fill. The exterior envelope is composed of walls of brick veneer over CMU. Exterior windows are aluminum frame with fixed panes. Exterior doors are hollow metal steel and aluminum mostly with glazing. Roofing is typically low slope single ply membrane and asphalt composition shingles over the Pre-K building. Roof openings include roof ventilators and a roof hatch with fixed ladder access. C. INTERIORS Interior partitions are typically CMU and glazing. Interior doors are generally solid core wood with hollow steel frames and mostly with glazing. Interior fittings include the following items: white boards, graphics and identifying devices, lockers, toilet accessories, storage shelving, fabricated toilet partitions. The interior wall finishes are typically painted CMU. Floor finishes in common and assigned areas are typically vinyl composition tile. Ceiling finishes in common and assigned areas are typically tectum panels. CONVEYING: Buildings do not include conveying system. D. SERVICES PLUMBING: Plumbing fixtures are typically low-flow water fixtures with manual control valves. Domestic water distribution is combination of copper and galvanized steel with electric hot water heating. Sanitary waste system is cast iron. Rain water drainage system is typically with internal roof drains. HVAC: Heating and cooling is provided by roof top units. The heating/cooling distribution system is a ductwork system. Fresh air is supplied by roof top units. Ceiling mounted exhaust fans are installed in bathrooms and other required areas. Controls and instrumentation are digital. FIRE PROTECTION: The buildings do not have a fire sprinkler system. The building does have additional fire suppression systems, which include dry chemical overhead protection. Standpipes are not provided. Fire extinguishers and cabinets are distributed near fire exits and corridors. ELECTRICAL: The main electrical service is fed from a pad mounted transformer to the main switchboard/distribution panel located in the building. Lighting is typically surface and recessed mounted type, fluorescent light fixtures. Branch circuit wiring is typically copper serving electrical switches and receptacles. Emergency and life safety egress lighting systems are installed and exit signs are present at exit doors and are typically illuminated. COMMUNICATIONS AND SECURITY: The fire alarm system consists of audible/visual strobe annunciators in common spaces, and interior corridors. The system is activated by manual pull stations and smoke detectors and the system is centrally monitored. The telephone and data systems are integrated and include dedicated equipment closets. This building does have a local area network (LAN). The building includes an internal security system that is actuated by the following items: contacts, infrared, optical or a combination of all devices. The building has controlled entry doors access provided by card readers; entry doors are secured with magnetic door locks. The security system has CCTV cameras and is centrally monitored; this building has a public address and paging system combined with the telephone system. OTHER ELECTRICAL SYSTEMS: This building does not have a separately derived emergency power system. E. EQUIPMENT & FURNISHINGS This building includes the following items and equipment: fixed food service, library equipment, athletic equipment, audio-visual, medical, fixed casework, window treatment, floor mats, and furnishings. G. SITE Campus site features include paved driveways and parking lots, pedestrian pavement, canopies, covered walkways, flag pole, landscaping, playing field, hard surface play area, and fencing. Site mechanical and electrical features include water, and sewer. Mar 10, 2017 Page 7 of 158
8 Campus Assessment Report - Pinebrook Elementary Attributes: General Attributes: Condition Assessor: Eduardo Lopez Assessment Date: Suitability Assessor: School Inofrmation: HS Attendance Area: Davie - Davie County HS LEA School No.: No. of Mobile Units: 0 No. of Bldgs.: 1 SF of Mobile Units: Status: School Grades: 26.5 Site Acreage: 26.5 Mar 10, 2017 Page 8 of 158
9 Campus Assessment Report - Pinebrook Elementary Campus Dashboard Summary Gross Area: Year Built: Repair Cost: FCI: 78, $8,189, % Last Renovation: Replacement Value: RSLI%: $16,337, % Deficiency By Category Deficiency By Priority Building Code Compliance - $413, Deferred Maintenance - $7,775, Currently Critical (Immediate) 2 - Potentially Critical (Year 1) 3 - Necessary/Not Yet Critical (Years 2-5) - $7,775, Recommended (Years 6-10) - $413, Codes or Standards Compliance $1,500,000 $1,000,000 $1M $1M Deficiency By System $500,000 $0 Electrical Interior Finishes Interior Construction $637K $631K $545K $427K $347K $320K $314K $279K $121K $55K Plumbing Roofing Exterior Enclosure Site Improvements Furnishings Fire Protection HVAC Equipment Site Electrical Utilities $2,000,000 $1,500,000 $1,000,000 $500,000 $0 10 Year Investment Forecast $2M $972K $744K $551K $350K $126K $0 $0 $0 $ Mar 10, 2017 Page 9 of 158
10 Campus Assessment Report - Pinebrook Elementary Campus Condition Summary The Table below shows the RSLI and FCI for each major system shown at the UNIFORMAT II classification Level 2. Note that Systems with lower FCIs require less investment than systems with higher FCIs. Current Investment Requirement and Condition by Uniformat Classification UNIFORMAT Classification RSLI% FCI % Current Repair A10 - Foundations % 0.00 % $0.00 B10 - Superstructure % 0.00 % $0.00 B20 - Exterior Enclosure % % $563, B30 - Roofing 5.74 % % $718, C10 - Interior Construction % % $841, C30 - Interior Finishes 8.17 % % $1,620, D20 - Plumbing % % $833, D30 - HVAC % % $367, D40 - Fire Protection 0.00 % % $413, D50 - Electrical % % $1,719, E10 - Equipment 4.53 % % $159, E20 - Furnishings 5.76 % % $422, G20 - Site Improvements % % $457, G30 - Site Mechanical Utilities % 0.00 % $0.00 G40 - Site Electrical Utilities % % $72, Totals: % % $8,189, Condition Deficiency Priority Facility Name Gross Area (S.F.) FCI % 1 - Currently Critical (Immediate) 2 - Potentially Critical (Year 1) 3 - Necessary/Not Yet Critical (Years 2-5) 4 - Recommended (Years 6-10) 5 - Codes or Standards Compliance 1970 Main Building 50, $0.00 $0.00 $6,261, $269, $ Storage $0.00 $0.00 $7, $0.00 $ Addition 16, $0.00 $0.00 $973, $91, $ Addition 9, $0.00 $0.00 $0.00 $53, $ PreK Building 1, $0.00 $0.00 $3, $0.00 $0.00 Site 78, $0.00 $0.00 $530, $0.00 $0.00 Deficiencies By Priority Total: $0.00 $0.00 $7,775, $413, $0.00 Mar 10, 2017 Page 10 of 158
11 Campus Assessment Report - Pinebrook Elementary 1 - Currently Critical (Immediate) 2 - Potentially Critical (Year 1) 3 - Necessary/Not Yet Critical (Years 2-5) - $7,775, Recommended (Years 6-10) - $413, Codes or Standards Compliance Budget Estimate Total: $8,189, Mar 10, 2017 Page 11 of 158
12 Campus Assessment Report Main Building Executive Summary Building condition is evaluated based on the functional systems and elements of a building and organized according to the UNIFORMAT II Elemental Classification. The grouping of these systems and elements and applying a current replacement value to them develops a representative building cost model. Cost Models are developed for similar building types and functions. Systems and their elements are evaluated based on their current replacement values, life cycles, installation dates and next renewal dates. Systems and their elements that are within their useful lives are further evaluated to identify current deficient conditions that may have a significant impact on a system's or element's remaining service life, and to determine if they are beyond their predicted expected life. The system's or element's current replacement value is based on RS Means Commercial Cost Data. Following are the cost model's system details for this facility. The Replacement Value is the amount needed to replace the property of the same present scope. The Repair Cost (the sum of the cost to repair/replace the Deficiencies) represents the budgeted contractor-installed costs plus owner's soft costs for the repair, replacement or renewal for a component or system level deficiency. It excludes contributing costs for other components or systems that might also be associated with the corrective actions due to packaging of the work. Facility Condition Index ( FCI) is an industry-standard measurement of facility condition calculated as the ratio of the costs to correct a facility's deficiencies (Condition Needs) to the facility's Current Replacement Value. It ranges from 0% (new) to 100% (very poor - beyond service life). The Remaining Service Life Index (RSLI) is calculated as the sum of a renewable system's Remaining Service Life (RSL) divided by the sum of a system's Replacement Value (both values exclude soft-cost to simplify calculation updates) expressed as a percentage ranging from 100% (new) to 0% (expired). The relationship between the key metrics FCI and RSLI is an important indicator, at either the facility, building, system, or component levels, of the condition trend and the imminent need for capital renewal. These indices exist in an inverse relationship wherein the FCI increases when systems reach their expected life-cycle age, whereas the RSLI decreases annually indicating the relative time remaining before reaching the life-cycle expiration age. For example, a facility or a system with a high RSLI and a low FCI indicates it is in the early portion of its useful life. However, a low RSLI indicates that expiration dates are approaching at which point the FCI would increase. The term FCA Score is the inverse of Total FCI and calculated as 100-Total FCI (without the %) where 100 is best and 0 is worst condition. Function: Gross Area (SF): Year Built: Last Renovation: Replacement Value: Repair Cost: Total FCI: Total RSLI: ES -Elementary School 50, $8,981,219 $6,531, % % FCA Score: Description: The narrative for this building is included in the Executive Summary Description at the front of this report. Attributes: This asset has no attributes. Mar 10, 2017 Page 12 of 158
13 Campus Assessment Report Main Building Dashboard Summary Function: Year Built: Repair Cost: FCI: ES -Elementary School 1970 $6,531, % Gross Area: Last Renovation: Replacement Value: RSLI%: 50,152 $8,981, % Deficiency By Category Deficiency By Priority Building Code Compliance - $269, Deferred Maintenance - $6,261, Currently Critical (Immediate) 2 - Potentially Critical (Year 1) 3 - Necessary/Not Yet Critical (Years 2-5) - $6,261, Recommended (Years 6-10) - $269, Codes or Standards Compliance $1,200,000 $1,000,000 $800,000 $600,000 $400,000 $200,000 $0 Electrical $1M $1M Interior Finishes $631K Plumbing $503K Interior Construction Deficiency By System Exterior Enclosure $427K $410K Roofing $252K $239K $204K $90K HVAC Furnishings Fire Protection Equipment $800,000 $600,000 $744K 10 Year Investment Forecast $400,000 $200,000 $0 $126K $0 $0 $0 $0 $0 $0 $0 $202K Mar 10, 2017 Page 13 of 158
14 Campus Assessment Report Main Building Condition Summary The Table below shows the RSLI and FCI for each major building system shown at the UNIFORMAT classification Level II. Note that Systems with lower FCIs require less investment than systems with higher FCIs. UNIFORMAT Classification RSLI % FCI % Current Repair Cost A10 - Foundations % 0.00 % $0.00 B10 - Superstructure % 0.00 % $0.00 B20 - Exterior Enclosure % % $563, B30 - Roofing 0.00 % % $541, C10 - Interior Construction % % $663, C30 - Interior Finishes 0.00 % % $1,358, D20 - Plumbing 0.00 % % $833, D30 - HVAC 6.88 % % $332, D40 - Fire Protection 0.00 % % $269, D50 - Electrical 0.00 % % $1,535, E10 - Equipment 0.00 % % $119, E20 - Furnishings 0.00 % % $315, Totals: % % $6,531, Mar 10, 2017 Page 14 of 158
.")
.")
15 Campus Assessment Report Main Building Photo Album The photo album consists of the various cardinal directions of the building.. 1). East Elevation - Feb 10, ). North Elevation - Feb 10, ). West Elevation - Feb 10, ). South Elevation - Feb 10, 2017 Mar 10, 2017 Page 15 of 158
16 Campus Assessment Report Main Building Condition Detail This section of the report contains results of the Facility Condition Assessment. The building is separated into system components based on UNIFORMAT II. The columns in the System Listing table represent the following: 1. System Code: A code that identifies the system. 2. System Description: A brief description of a system present in the building. 3. Unit Price $: The unit price of the system. 4. UoM: The unit of measure of the system. 5. Qty: The quantity for the system 6. Life: Building Owners and Managers Association (BOMA) recommended system design life. 7. Year Installed: The date of system installation. 8. Calc Next Renewal Year: The date of system expiration based on the life, NR stands for non renewable. 9. Next Renewal Year: The suggested system expiration date by the assessor based on visual inspection. 10. RSLI: The Remaining Service Life Index of the system. 11. FCI: The Facility Condition Index of the system. 12. RSL: Remaining Service Life in years. 13. ecr: ecomet Condition Rating (not used in this assessment). 14. Deficiency $: The financial investment to repair/replace system to address deficiency. 15. Replacement Value $: The replacement cost of the system. Mar 10, 2017 Page 16 of 158
17 Campus Assessment Report Main Building System Listing Mar 10, 2017 Page 17 of 158
18 Campus Assessment Report Main Building The System Listing table below lists each of the systems organized by their UNIFORMAT II classification. The assessment team was tasked with recording the most recent replacement year of each system, determining the remaining service life based on the theoretical life, and evaluating the condition to confirm the forecast next replacement year. The system listing is the basis for all data contained in the Building Assessment Report. System Code System Description Unit Price $ UoM Qty Life Year Installed Calc Next Renewal Year Next Renewal Year RSLI% FCI% RSL ecr Deficiency $ Replacement Value $ A1010 Standard Foundations $4.70 S.F. 50, % 0.00 % 53 $235,714 A1030 Slab on Grade $8.26 S.F. 50, % 0.00 % 53 $414,256 B1020 Roof Construction $15.44 S.F. 50, % 0.00 % 53 $774,347 B2010 Exterior Walls $9.24 S.F. 50, % 0.00 % 53 $463,404 B2020 Exterior Windows $9.20 S.F. 50, % % -17 $507, $461,398 B2030 Exterior Doors $1.02 S.F. 50, % % -17 $56, $51,155 B Single Ply Membrane $6.98 S.F. 50, % % -27 $525, $350,061 B3020 Roof Openings $0.29 S.F. 50, % % -22 $15, $14,544 C1010 Partitions $10.59 S.F. 50, % 0.00 % 28 $531,110 C1020 Interior Doors $2.48 S.F. 50, % % -17 $136, $124,377 C1030 Fittings $9.54 S.F. 50, % % -27 $526, $478,450 C3010 Wall Finishes $2.73 S.F. 50, % % -37 $150, $136,915 C3020 Floor Finishes $11.15 S.F. 50, % % -27 $615, $559,195 C3030 Ceiling Finishes $10.74 S.F. 50, % % -22 $592, $538,632 D2010 Plumbing Fixtures $11.26 S.F. 50, % % -17 $621, $564,712 D2020 Domestic Water Distribution $0.96 S.F. 50, % % -17 $52, $48,146 D2030 Sanitary Waste $1.52 S.F. 50, % % -17 $83, $76,231 D2040 Rain Water Drainage $1.36 S.F. 50, % % -17 $75, $68,207 D3040 Distribution Systems $6.02 S.F. 50, % % -17 $332, $301,915 D3050 Terminal & Package Units $13.09 S.F. 50, % 0.00 % 1 $656,490 D3060 Controls & Instrumentation $1.91 S.F. 50, % 0.00 % 6 $95,790 D4010 Sprinklers $4.22 S.F. 50, % % -1 $232, $211,641 D4020 Standpipes $0.66 S.F. 50, % % -1 $36, $33,100 D5010 Electrical Service/Distribution $1.65 S.F. 50, % % -7 $91, $82,751 D5020 Branch Wiring $4.99 S.F. 50, % % -17 $275, $250,258 D5020 Lighting $11.64 S.F. 50, % % -17 $642, $583,769 D Security & Detection Systems $1.83 S.F. 50, % % -32 $100, $91,778 D Fire Alarm Systems $3.31 S.F. 50, % % -32 $182, $166,003 D Data Communication $4.30 S.F. 50, % % -32 $237, $215,654 D5090 Other Electrical Systems $0.12 S.F. 50, % % -27 $6, $6,018 E1020 Institutional Equipment $0.30 S.F. 50, % % -27 $16, $15,046 E1090 Other Equipment $1.86 S.F. 50, % % -27 $102, $93,283 E2010 Fixed Furnishings $5.72 S.F. 50, % % -27 $315, $286,869 Total % % $6,531, $8,981,219 Mar 10, 2017 Page 18 of 158


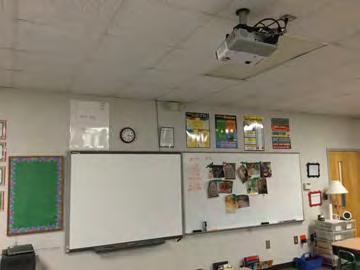
19 Campus Assessment Report Main Building System Notes The facility description in the executive summary contains an overview of each system. The photos of each system and any associated notes listed below provide additional information on select systems found within the facility: B Exterior Walls B Exterior Windows Mar 10, 2017 Page 19 of 158
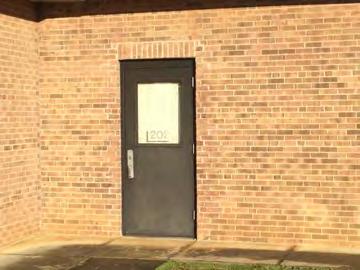
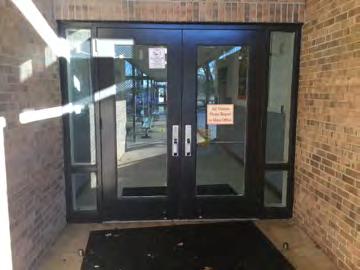
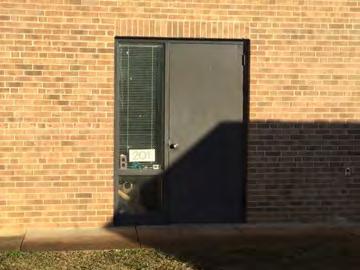
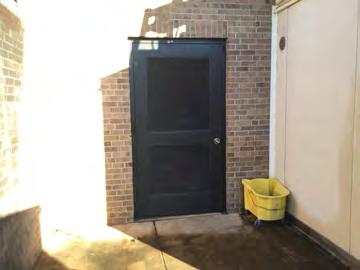
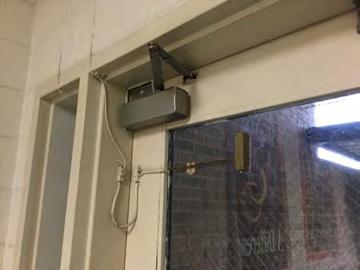
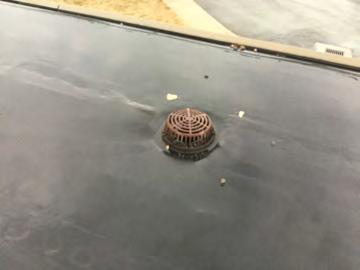
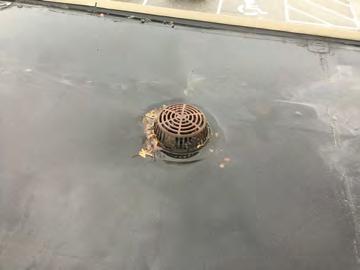
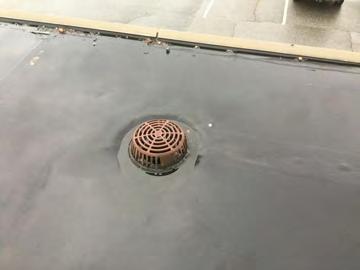
20 Campus Assessment Report Main Building B Exterior Doors B Single Ply Membrane B Roof Openings Mar 10, 2017 Page 20 of 158
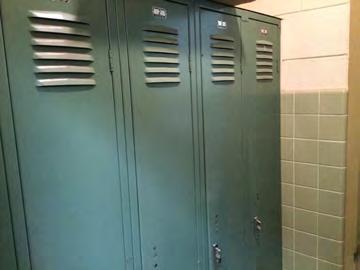
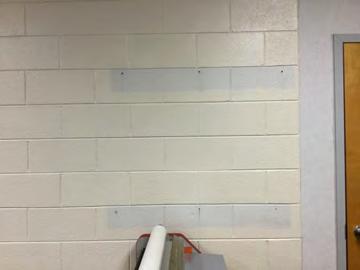
21 Campus Assessment Report Main Building C Partitions C Interior Doors C Fittings Mar 10, 2017 Page 21 of 158
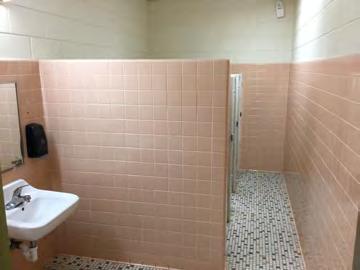
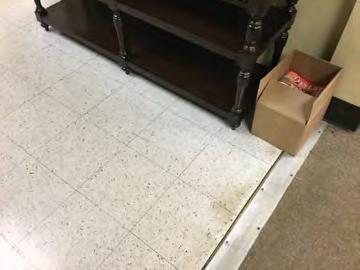
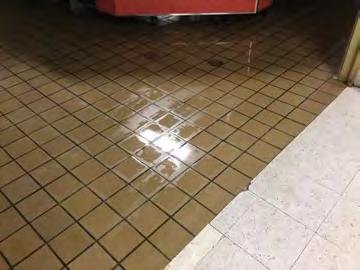
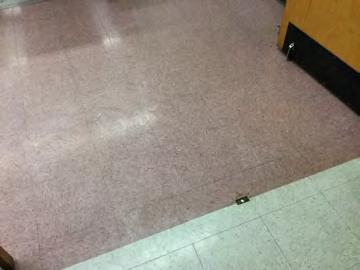

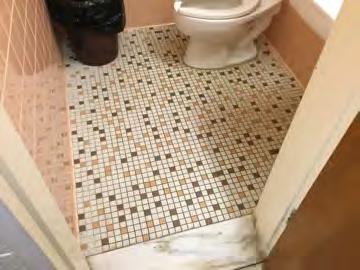
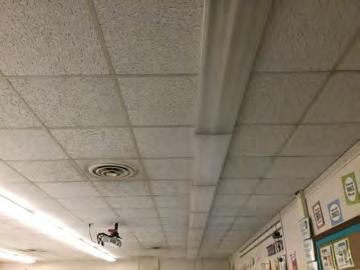
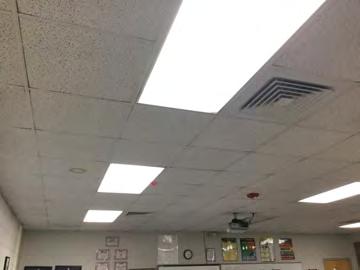
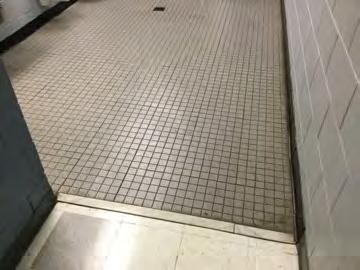
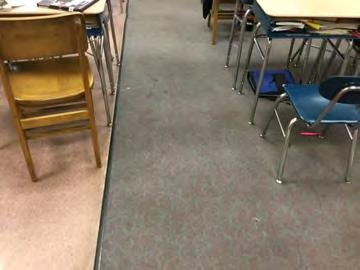
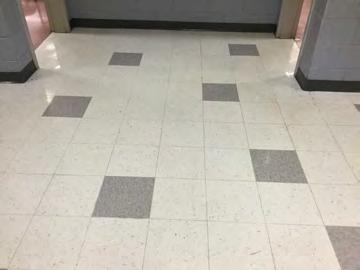
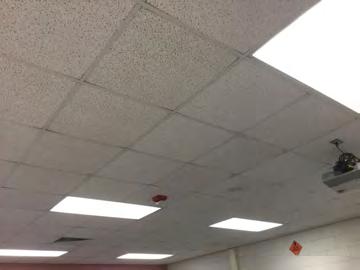
22 Campus Assessment Report Main Building C Wall Finishes C Floor Finishes C Ceiling Finishes Mar 10, 2017 Page 22 of 158
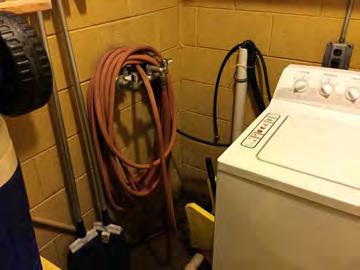
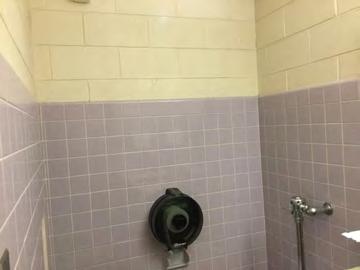
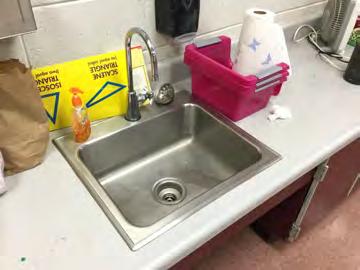
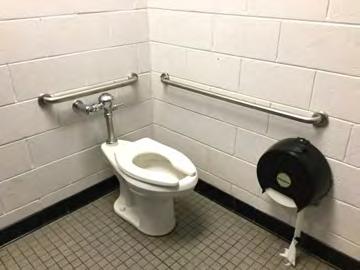
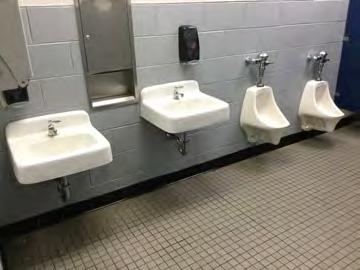
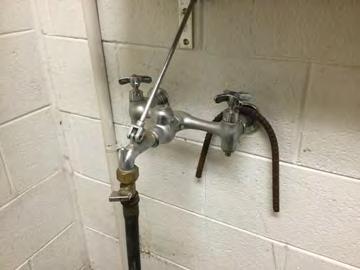
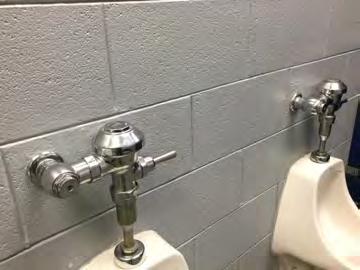
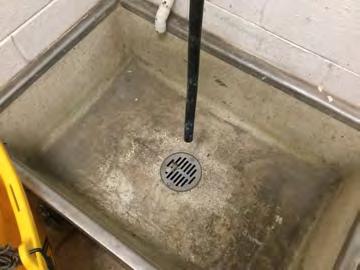
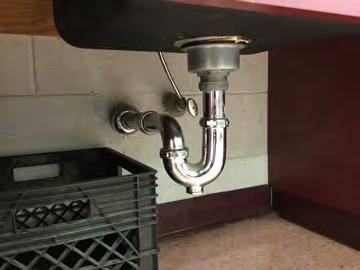
23 Campus Assessment Report Main Building D Plumbing Fixtures D Domestic Water Distribution D Sanitary Waste Mar 10, 2017 Page 23 of 158


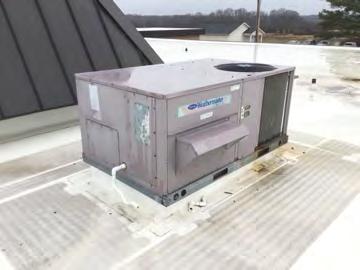
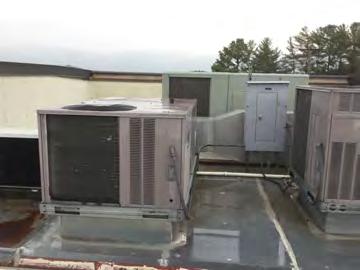
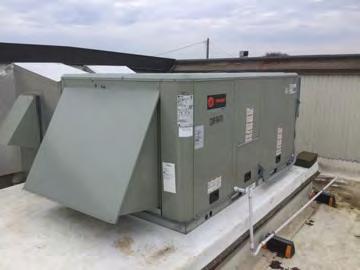
24 Campus Assessment Report Main Building D Rain Water Drainage D Distribution Systems D Terminal & Package Units Mar 10, 2017 Page 24 of 158


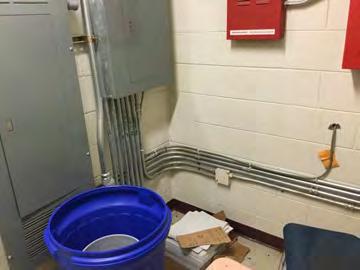
25 Campus Assessment Report Main Building D Controls & Instrumentation D Electrical Service/Distribution D Branch Wiring Mar 10, 2017 Page 25 of 158

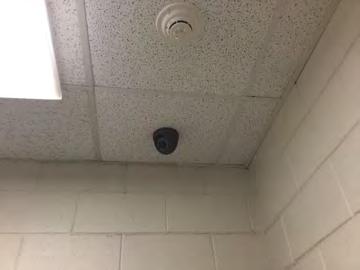
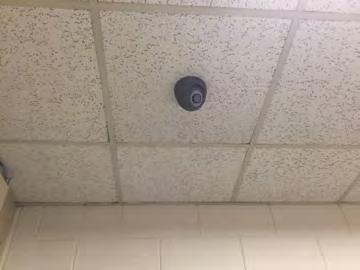
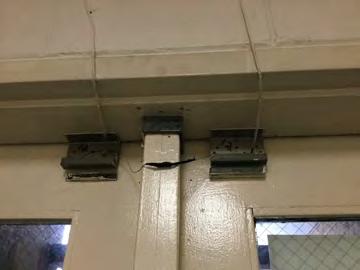
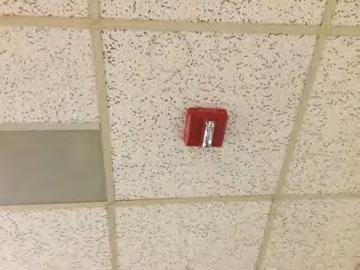
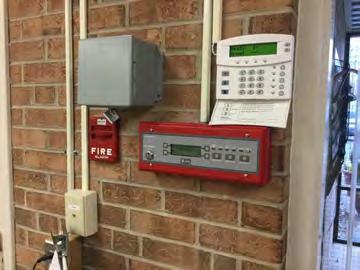
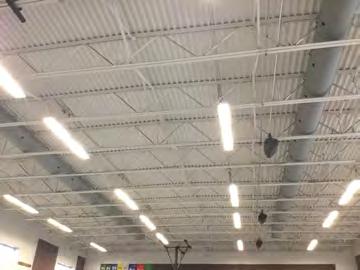
26 Campus Assessment Report Main Building D Lighting D Security & Detection Systems D Fire Alarm Systems Mar 10, 2017 Page 26 of 158


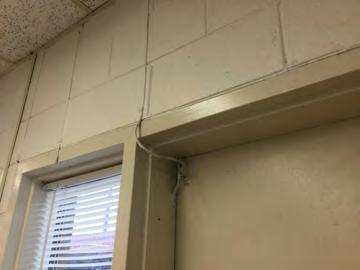
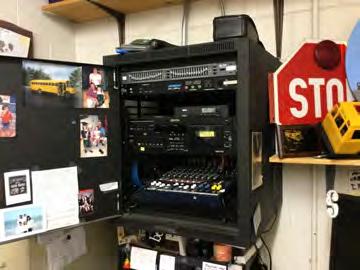
27 Campus Assessment Report Main Building D Data Communication D Other Electrical Systems Mar 10, 2017 Page 27 of 158

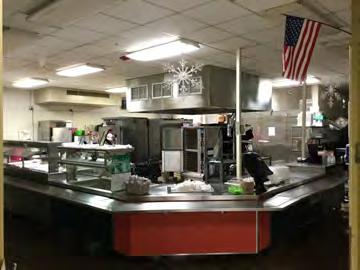
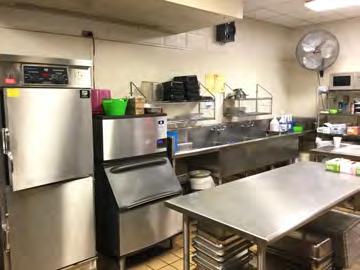
28 Campus Assessment Report Main Building E Institutional Equipment E Other Equipment Mar 10, 2017 Page 28 of 158


29 Campus Assessment Report Main Building E Fixed Furnishings Mar 10, 2017 Page 29 of 158
30 Campus Assessment Report Main Building Renewal Schedule ecomet forecasts future Capital Renewal projects for expiring systems based on the Calculated Next Renewal year found in the system listing. There is a 3% yearly inflation factor applied to the system costs expiring in the future. The table below reflects Capital Renewal projects over the next 10 years. Blank cells (or $0) indicate no systems are scheduled for renewal in that year. Inflation Rate: 3% System Current Deficiencies Total Total: $6,531,143 $743,803 $0 $0 $0 $0 $125,816 $0 $0 $0 $202,402 $7,603,164 * A - Substructure $0 $0 $0 $0 $0 $0 $0 $0 $0 $0 $0 $0 * A10 - Foundations $0 $0 $0 $0 $0 $0 $0 $0 $0 $0 $0 $0 * A Standard Foundations $0 $0 $0 $0 $0 $0 $0 $0 $0 $0 $0 $0 * A Slab on Grade $0 $0 $0 $0 $0 $0 $0 $0 $0 $0 $0 $0 B - Shell $0 $0 $0 $0 $0 $0 $0 $0 $0 $0 $0 $0 B10 - Superstructure $0 $0 $0 $0 $0 $0 $0 $0 $0 $0 $0 $0 * B Roof Construction $0 $0 $0 $0 $0 $0 $0 $0 $0 $0 $0 $0 B20 - Exterior Enclosure $0 $0 $0 $0 $0 $0 $0 $0 $0 $0 $0 $0 * B Exterior Walls $0 $0 $0 $0 $0 $0 $0 $0 $0 $0 $0 $0 B Exterior Windows $507,538 $0 $0 $0 $0 $0 $0 $0 $0 $0 $0 $507,538 B Exterior Doors $56,271 $0 $0 $0 $0 $0 $0 $0 $0 $0 $0 $56,271 B30 - Roofing $0 $0 $0 $0 $0 $0 $0 $0 $0 $0 $0 $0 B Roof Coverings $0 $0 $0 $0 $0 $0 $0 $0 $0 $0 $0 $0 B Single Ply Membrane $525,091 $0 $0 $0 $0 $0 $0 $0 $0 $0 $0 $525,091 B Roof Openings $15,998 $0 $0 $0 $0 $0 $0 $0 $0 $0 $0 $15,998 C - Interiors $0 $0 $0 $0 $0 $0 $0 $0 $0 $0 $0 $0 C10 - Interior Construction $0 $0 $0 $0 $0 $0 $0 $0 $0 $0 $0 $0 * C Partitions $0 $0 $0 $0 $0 $0 $0 $0 $0 $0 $0 $0 C Interior Doors $136,815 $0 $0 $0 $0 $0 $0 $0 $0 $0 $0 $136,815 C Fittings $526,295 $0 $0 $0 $0 $0 $0 $0 $0 $0 $0 $526,295 C30 - Interior Finishes $0 $0 $0 $0 $0 $0 $0 $0 $0 $0 $0 $0 C Wall Finishes $150,606 $0 $0 $0 $0 $0 $0 $0 $0 $0 $202,402 $353,008 C Floor Finishes $615,114 $0 $0 $0 $0 $0 $0 $0 $0 $0 $0 $615,114 C Ceiling Finishes $592,496 $0 $0 $0 $0 $0 $0 $0 $0 $0 $0 $592,496 D - Services $0 $0 $0 $0 $0 $0 $0 $0 $0 $0 $0 $0 Mar 10, 2017 Page 30 of 158
31 Campus Assessment Report Main Building D20 - Plumbing $0 $0 $0 $0 $0 $0 $0 $0 $0 $0 $0 $0 D Plumbing Fixtures $621,183 $0 $0 $0 $0 $0 $0 $0 $0 $0 $0 $621,183 D Domestic Water Distribution $52,961 $0 $0 $0 $0 $0 $0 $0 $0 $0 $0 $52,961 D Sanitary Waste $83,854 $0 $0 $0 $0 $0 $0 $0 $0 $0 $0 $83,854 D Rain Water Drainage $75,027 $0 $0 $0 $0 $0 $0 $0 $0 $0 $0 $75,027 D30 - HVAC $0 $0 $0 $0 $0 $0 $0 $0 $0 $0 $0 $0 D Distribution Systems $332,107 $0 $0 $0 $0 $0 $0 $0 $0 $0 $0 $332,107 D Terminal & Package Units $0 $743,803 $0 $0 $0 $0 $0 $0 $0 $0 $0 $743,803 D Controls & Instrumentation $0 $0 $0 $0 $0 $0 $125,816 $0 $0 $0 $0 $125,816 D40 - Fire Protection $0 $0 $0 $0 $0 $0 $0 $0 $0 $0 $0 $0 D Sprinklers $232,806 $0 $0 $0 $0 $0 $0 $0 $0 $0 $0 $232,806 D Standpipes $36,410 $0 $0 $0 $0 $0 $0 $0 $0 $0 $0 $36,410 D50 - Electrical $0 $0 $0 $0 $0 $0 $0 $0 $0 $0 $0 $0 D Electrical Service/Distribution $91,026 $0 $0 $0 $0 $0 $0 $0 $0 $0 $0 $91,026 D Branch Wiring $275,284 $0 $0 $0 $0 $0 $0 $0 $0 $0 $0 $275,284 D Lighting $642,146 $0 $0 $0 $0 $0 $0 $0 $0 $0 $0 $642,146 D Communications and Security $0 $0 $0 $0 $0 $0 $0 $0 $0 $0 $0 $0 D Security & Detection Systems $100,956 $0 $0 $0 $0 $0 $0 $0 $0 $0 $0 $100,956 D Fire Alarm Systems $182,603 $0 $0 $0 $0 $0 $0 $0 $0 $0 $0 $182,603 D Data Communication $237,219 $0 $0 $0 $0 $0 $0 $0 $0 $0 $0 $237,219 D Other Electrical Systems $6,620 $0 $0 $0 $0 $0 $0 $0 $0 $0 $0 $6,620 E - Equipment & Furnishings $0 $0 $0 $0 $0 $0 $0 $0 $0 $0 $0 $0 E10 - Equipment $0 $0 $0 $0 $0 $0 $0 $0 $0 $0 $0 $0 E Institutional Equipment $16,550 $0 $0 $0 $0 $0 $0 $0 $0 $0 $0 $16,550 E Other Equipment $102,611 $0 $0 $0 $0 $0 $0 $0 $0 $0 $0 $102,611 E20 - Furnishings $0 $0 $0 $0 $0 $0 $0 $0 $0 $0 $0 $0 E Fixed Furnishings $315,556 $0 $0 $0 $0 $0 $0 $0 $0 $0 $0 $315,556 * Indicates non-renewable system Mar 10, 2017 Page 31 of 158
32 Campus Assessment Report Main Building Forecasted Capital Renewal Requirement The following chart shows the current building deficiencies and forecasting capital renewal or sustainment requirements over the next ten years. $7,000,000 $6,531,143 $6,000,000 $5,000,000 $4,000,000 $3,000,000 $2,000,000 $1,000,000 $743,803 $0 $125,816 $202,402 Current Deficiencies Mar 10, 2017 Page 32 of 158
33 Campus Assessment Report Main Building Deficiency Summary by System Current deficiencies included assemblies that have reached or exceeded their design life or components of the assemblies that are in need of repair. Assemblies that have reached their design life are identified as current deficiencies and assigned the distress 'Beyond Useful Life'. The following chart lists all current deficiencies associated with this facility. B2020 Exterior Windows $507, B Single Ply Membrane $525, C1030 Fittings $526, C3020 Floor Finishes $615, C3030 Ceiling Finishes $592, D2010 Plumbing Fixtures $621, D3040 Distribution Systems $332, D5020 Branch Wiring $275, D5020 Lighting $642, E2010 Fixed Furnishings $315, Other $1,578, Budget Estimate Total: $6,531, Mar 10, 2017 Page 33 of 158
34 Campus Assessment Report Main Building Deficiency Summary by Priority The following chart shows the total repair costs broken down by priority. Assessors assigned deficiencies within ecomet to one of the following priority categories: 1 - Currently Critical (Immediate) 2 - Potentially Critical (Year 1) 3 - Necessary/Not Yet Critical (Years 2-5) - $6,261, Recommended (Years 6-10) - $269, Codes or Standards Compliance Budget Estimate Total: $6,531, Mar 10, 2017 Page 34 of 158
35 Campus Assessment Report Main Building Deficiency By Priority Investment Table The table below shows the current investment cost grouped by deficiency priority and building system. 1 - Currently Critical (Immediate) 2 - Potentially Critical (Year 1) 3 - Necessary/Not Yet Critical (Years 2-5) 4 - Recommended (Years 6-10) 5 - Codes or Standards Compliance System Code System Description Total B2020 Exterior Windows $0.00 $0.00 $507, $0.00 $0.00 $507, B2030 Exterior Doors $0.00 $0.00 $56, $0.00 $0.00 $56, B Single Ply Membrane $0.00 $0.00 $525, $0.00 $0.00 $525, B3020 Roof Openings $0.00 $0.00 $15, $0.00 $0.00 $15, C1020 Interior Doors $0.00 $0.00 $136, $0.00 $0.00 $136, C1030 Fittings $0.00 $0.00 $526, $0.00 $0.00 $526, C3010 Wall Finishes $0.00 $0.00 $150, $0.00 $0.00 $150, C3020 Floor Finishes $0.00 $0.00 $615, $0.00 $0.00 $615, C3030 Ceiling Finishes $0.00 $0.00 $592, $0.00 $0.00 $592, D2010 Plumbing Fixtures $0.00 $0.00 $621, $0.00 $0.00 $621, D2020 Domestic Water Distribution $0.00 $0.00 $52, $0.00 $0.00 $52, D2030 Sanitary Waste $0.00 $0.00 $83, $0.00 $0.00 $83, D2040 Rain Water Drainage $0.00 $0.00 $75, $0.00 $0.00 $75, D3040 Distribution Systems $0.00 $0.00 $332, $0.00 $0.00 $332, D4010 Sprinklers $0.00 $0.00 $0.00 $232, $0.00 $232, D4020 Standpipes $0.00 $0.00 $0.00 $36, $0.00 $36, D5010 Electrical Service/Distribution $0.00 $0.00 $91, $0.00 $0.00 $91, D5020 Branch Wiring $0.00 $0.00 $275, $0.00 $0.00 $275, D5020 Lighting $0.00 $0.00 $642, $0.00 $0.00 $642, D Security & Detection Systems $0.00 $0.00 $100, $0.00 $0.00 $100, D Fire Alarm Systems $0.00 $0.00 $182, $0.00 $0.00 $182, D Data Communication $0.00 $0.00 $237, $0.00 $0.00 $237, D5090 Other Electrical Systems $0.00 $0.00 $6, $0.00 $0.00 $6, E1020 Institutional Equipment $0.00 $0.00 $16, $0.00 $0.00 $16, E1090 Other Equipment $0.00 $0.00 $102, $0.00 $0.00 $102, E2010 Fixed Furnishings $0.00 $0.00 $315, $0.00 $0.00 $315, Total: $0.00 $0.00 $6,261, $269, $0.00 $6,531, Mar 10, 2017 Page 35 of 158
36 Campus Assessment Report Main Building Deficiency Summary by Category The following chart shows the total repair costs broken down by deficiency categories. Assessors assigned deficiencies to one of the following categories: Building Code Compliance - $269, Deferred Maintenance - $6,261, Budget Estimate Total: $6,531, Mar 10, 2017 Page 36 of 158
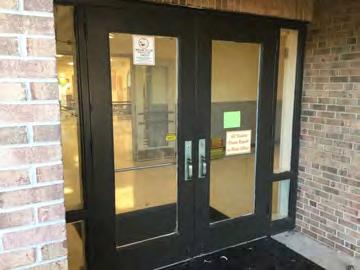
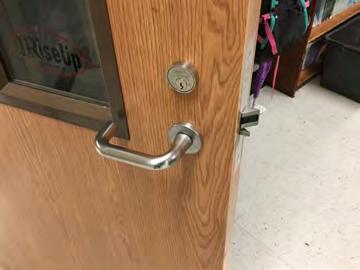
37 Campus Assessment Report Main Building Deficiency Details by Priority The deficiency detail notes listed below provide additional information on identified deficiencies found within the facility. Priority 3 - Necessary/Not Yet Critical (Years 2-5): B Exterior Windows Location: Distress: Category: Priority: Correction: Qty: Unit of Measure: Estimate: Assessor Name: Date Created: Exterior Walls Beyond Service Life Deferred Maintenance 3 - Necessary/Not Yet Critical (Years 2-5) Renew System 50, S.F. $507, Somnath Das 01/19/2017 Notes: The exterior windows are aged, rusted, not energy eficient and should be replaced. B Exterior Doors Location: Distress: Category: Priority: Correction: Qty: Unit of Measure: Estimate: Assessor Name: Date Created: Exterior Walls Beyond Service Life Deferred Maintenance 3 - Necessary/Not Yet Critical (Years 2-5) Renew System 50, S.F. $56, Somnath Das 01/19/2017 Notes: The exterior doors are aged, rusted and should be replaced. Mar 10, 2017 Page 37 of 158
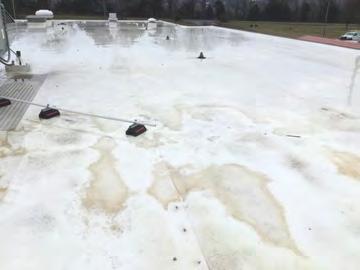
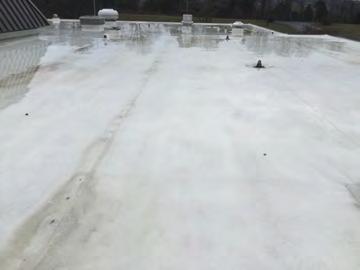
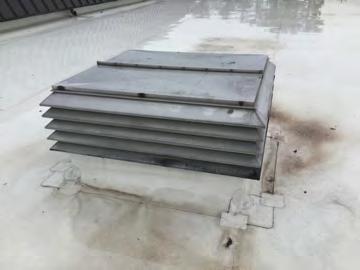
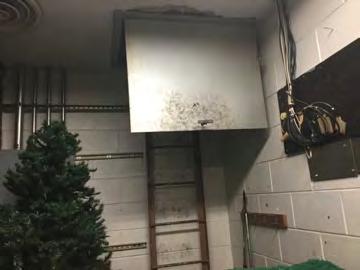
38 Campus Assessment Report Main Building B Single Ply Membrane Location: Distress: Category: Priority: Correction: Qty: Unit of Measure: Estimate: Assessor Name: Date Created: Roof Beyond Service Life Deferred Maintenance 3 - Necessary/Not Yet Critical (Years 2-5) Renew System 50, S.F. $525, Somnath Das 01/19/2017 Notes: The membrane roof covering is aged, showing signs of failure and should be replaced. B Roof Openings Location: Distress: Category: Priority: Correction: Qty: Unit of Measure: Estimate: Assessor Name: Date Created: Roof Beyond Service Life Deferred Maintenance 3 - Necessary/Not Yet Critical (Years 2-5) Renew System 50, S.F. $15, Somnath Das 01/19/2017 Notes: Roof hatch does not comply with OSHA standards; roof opening protection and proper extension of fixed ladder to platform is not provided. Mar 10, 2017 Page 38 of 158
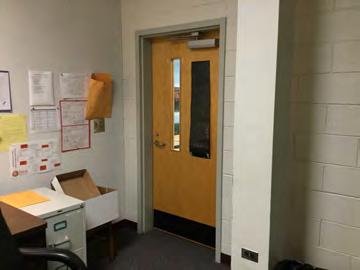
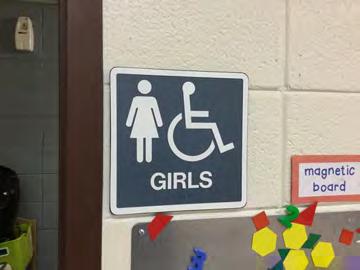
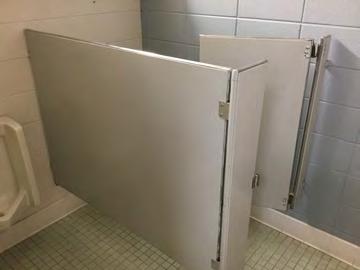
39 Campus Assessment Report Main Building C Interior Doors Location: Distress: Category: Priority: Correction: Qty: Unit of Measure: Estimate: Assessor Name: Date Created: Throughout the Building Beyond Service Life Deferred Maintenance 3 - Necessary/Not Yet Critical (Years 2-5) Renew System 50, S.F. $136, Somnath Das 01/19/2017 Notes: The interior doors are aged, failing, most hardware is not ADA or code compliant and should be replaced. C Fittings Location: Distress: Category: Priority: Correction: Qty: Unit of Measure: Estimate: Assessor Name: Date Created: Throughout the Building Beyond Service Life Deferred Maintenance 3 - Necessary/Not Yet Critical (Years 2-5) Renew System 50, S.F. $526, Somnath Das 01/19/2017 Notes: The fittings throughout the building are aged, in marginal condition, handrails and room signage are not ADA compliant and should be replaced. Mar 10, 2017 Page 39 of 158
 Renew System 50,152.00 S.F. $150,606.")
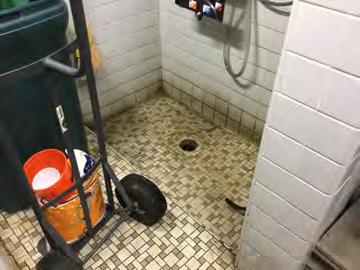
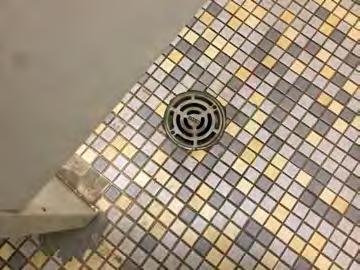
40 Campus Assessment Report Main Building C Wall Finishes Location: Distress: Category: Priority: Correction: Qty: Unit of Measure: Estimate: Assessor Name: Date Created: Throughout the Building Beyond Service Life Deferred Maintenance 3 - Necessary/Not Yet Critical (Years 2-5) Renew System 50, S.F. $150, Somnath Das 01/19/2017 Notes: The wall finishes are aged, scuffed, fading, stained and should be replaced. C Floor Finishes Location: Distress: Category: Priority: Correction: Qty: Unit of Measure: Estimate: Assessor Name: Date Created: Throughout the Building Beyond Service Life Deferred Maintenance 3 - Necessary/Not Yet Critical (Years 2-5) Renew System 50, S.F. $615, Somnath Das 01/19/2017 Notes: The original flooring is in poor conditions and should be replaced. Mar 10, 2017 Page 40 of 158
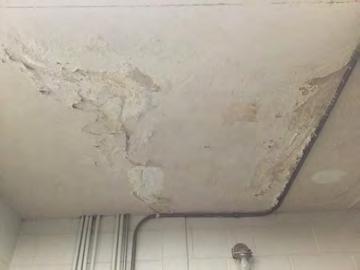
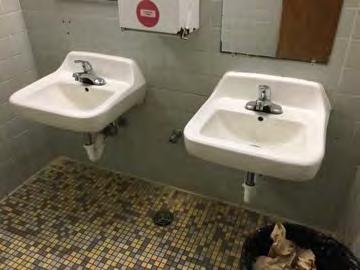
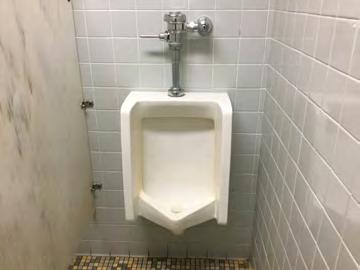
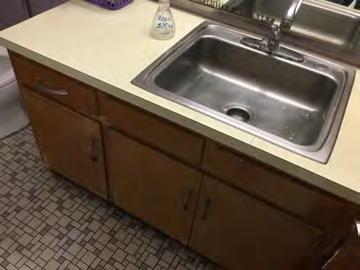
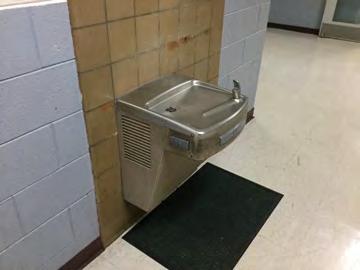
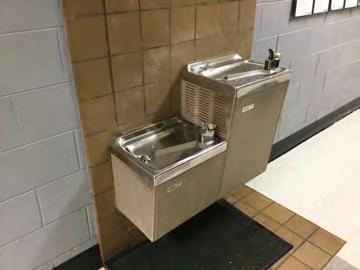
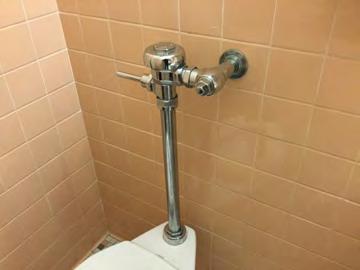
41 Campus Assessment Report Main Building C Ceiling Finishes Location: Distress: Category: Priority: Correction: Qty: Unit of Measure: Estimate: Assessor Name: Date Created: Throughout the Building Beyond Service Life Deferred Maintenance 3 - Necessary/Not Yet Critical (Years 2-5) Renew System 50, S.F. $592, Somnath Das 01/19/2017 Notes: The original ceiling finishes are aged, failing and should be replaced. D Plumbing Fixtures Location: Distress: Category: Priority: Correction: Qty: Unit of Measure: Estimate: Assessor Name: Date Created: Throughout the Building Beyond Service Life Deferred Maintenance 3 - Necessary/Not Yet Critical (Years 2-5) Renew System 50, S.F. $621, Somnath Das 01/19/2017 Notes: Plumbing fixtures are in operational conditions. However, they are aged, not ADA compliant, and should be scheduled for replacement. Mar 10, 2017 Page 41 of 158
42 Campus Assessment Report Main Building D Domestic Water Distribution Location: Distress: Category: Priority: Correction: Qty: Unit of Measure: Estimate: Assessor Name: Date Created: Throughout the Building Beyond Service Life Deferred Maintenance 3 - Necessary/Not Yet Critical (Years 2-5) Renew System 50, S.F. $52, Somnath Das 01/19/2017 Notes: The domestic water distribution system is aged and should be replaced. D Sanitary Waste Location: Distress: Category: Priority: Correction: Qty: Unit of Measure: Estimate: Assessor Name: Date Created: Throughout the Building Beyond Service Life Deferred Maintenance 3 - Necessary/Not Yet Critical (Years 2-5) Renew System 50, S.F. $83, Somnath Das 01/19/2017 Notes: The sanitary waste system is beyond its expected service life and should be replaced. Mar 10, 2017 Page 42 of 158
43 Campus Assessment Report Main Building D Rain Water Drainage Location: Distress: Category: Priority: Correction: Qty: Unit of Measure: Estimate: Assessor Name: Date Created: Throughout the Building Beyond Service Life Deferred Maintenance 3 - Necessary/Not Yet Critical (Years 2-5) Renew System 50, S.F. $75, Somnath Das 01/19/2017 Notes: The rain water drainage system is aged and should be replaced. D Distribution Systems Location: Distress: Category: Priority: Correction: Qty: Unit of Measure: Estimate: Assessor Name: Date Created: Throughout the Building Beyond Service Life Deferred Maintenance 3 - Necessary/Not Yet Critical (Years 2-5) Renew System 50, S.F. $332, Somnath Das 01/19/2017 Notes: Distribution systems are aged, becoming logistically unsupportable, and should be replaced. Mar 10, 2017 Page 43 of 158
44 Campus Assessment Report Main Building D Electrical Service/Distribution Location: Distress: Category: Priority: Correction: Qty: Unit of Measure: Estimate: Assessor Name: Date Created: Throughout the Building Beyond Service Life Deferred Maintenance 3 - Necessary/Not Yet Critical (Years 2-5) Renew System 50, S.F. $91, Somnath Das 01/19/2017 Notes: The original electrical service is operating but is in poor condition and should be replaced. D Branch Wiring Location: Distress: Category: Priority: Correction: Qty: Unit of Measure: Estimate: Assessor Name: Date Created: Throughout the Building Beyond Service Life Deferred Maintenance 3 - Necessary/Not Yet Critical (Years 2-5) Renew System 50, S.F. $275, Somnath Das 01/19/2017 Notes: The original branch wiring system is operating but is aged, in marginal condition, and should be replaced. Mar 10, 2017 Page 44 of 158
45 Campus Assessment Report Main Building D Lighting Location: Distress: Category: Priority: Correction: Qty: Unit of Measure: Estimate: Assessor Name: Date Created: Throughout the Building Beyond Service Life Deferred Maintenance 3 - Necessary/Not Yet Critical (Years 2-5) Renew System 50, S.F. $642, Somnath Das 01/19/2017 Notes: The original lighting system is operating but is aged, in marginal condition, and should be replaced. D Security & Detection Systems Location: Distress: Category: Priority: Correction: Qty: Unit of Measure: Estimate: Assessor Name: Date Created: Throughout the Building Beyond Service Life Deferred Maintenance 3 - Necessary/Not Yet Critical (Years 2-5) Renew System 50, S.F. $100, Somnath Das 01/19/2017 Notes: The security and detection system is beyond its expected service life and should be scheduled for replacement. Mar 10, 2017 Page 45 of 158
46 Campus Assessment Report Main Building D Fire Alarm Systems Location: Distress: Category: Priority: Correction: Qty: Unit of Measure: Estimate: Assessor Name: Date Created: Throughout the Building Beyond Service Life Deferred Maintenance 3 - Necessary/Not Yet Critical (Years 2-5) Renew System 50, S.F. $182, Somnath Das 01/19/2017 Notes: The fire alarm system is beyond its expected service life and should be scheduled for replacement. D Data Communication Location: Distress: Category: Priority: Correction: Qty: Unit of Measure: Estimate: Assessor Name: Date Created: Throughout the Building Beyond Service Life Deferred Maintenance 3 - Necessary/Not Yet Critical (Years 2-5) Renew System 50, S.F. $237, Somnath Das 01/19/2017 Notes: The data communication system is beyond its expected service life and should be scheduled for replacement. Mar 10, 2017 Page 46 of 158
47 Campus Assessment Report Main Building D Other Electrical Systems Location: Distress: Category: Priority: Correction: Qty: Unit of Measure: Estimate: Assessor Name: Date Created: 1970 Main Building Beyond Service Life Deferred Maintenance 3 - Necessary/Not Yet Critical (Years 2-5) Renew System 50, S.F. $6, Somnath Das 02/27/2017 Notes: E Institutional Equipment Location: Distress: Category: Priority: Correction: Qty: Unit of Measure: Estimate: Assessor Name: Date Created: Throughout the Building Beyond Service Life Deferred Maintenance 3 - Necessary/Not Yet Critical (Years 2-5) Renew System 50, S.F. $16, Somnath Das 01/19/2017 Notes: The institutional equipment is in deteriorating conditions and should be replaced. Mar 10, 2017 Page 47 of 158
48 Campus Assessment Report Main Building E Other Equipment Location: Distress: Category: Priority: Correction: Qty: Unit of Measure: Estimate: Assessor Name: Date Created: Throughout the Building Beyond Service Life Deferred Maintenance 3 - Necessary/Not Yet Critical (Years 2-5) Renew System 50, S.F. $102, Somnath Das 01/19/2017 Notes: The other equipment system is beyond its expected service life and should be scheduled for replacement. E Fixed Furnishings Location: Distress: Category: Priority: Correction: Qty: Unit of Measure: Estimate: Assessor Name: Date Created: Throughout the Building Beyond Service Life Deferred Maintenance 3 - Necessary/Not Yet Critical (Years 2-5) Renew System 50, S.F. $315, Somnath Das 01/19/2017 Notes: The fixed furnishings are aged, in marginal condition, and should be replaced. Mar 10, 2017 Page 48 of 158
49 Campus Assessment Report Main Building Priority 4 - Recommended (Years 6-10): D Sprinklers This deficiency has no image. Location: Distress: Category: Priority: Correction: Qty: Unit of Measure: Estimate: Assessor Name: Date Created: Throughout the building Missing Building Code Compliance 4 - Recommended (Years 6-10) Renew System 50, S.F. $232, Somnath Das 02/11/2017 Notes: A sprinkler system is missing and is recommended to be provided to comply with current codes. D Standpipes This deficiency has no image. Location: Distress: Category: Priority: Correction: Qty: Unit of Measure: Estimate: Assessor Name: Date Created: Throughout the building Missing Building Code Compliance 4 - Recommended (Years 6-10) Renew System 50, S.F. $36, Somnath Das 02/11/2017 Notes: A standpipe system is missing and is recommended to be provided to comply with current codes. Mar 10, 2017 Page 49 of 158
50 Campus Assessment Report Storage Executive Summary Building condition is evaluated based on the functional systems and elements of a building and organized according to the UNIFORMAT II Elemental Classification. The grouping of these systems and elements and applying a current replacement value to them develops a representative building cost model. Cost Models are developed for similar building types and functions. Systems and their elements are evaluated based on their current replacement values, life cycles, installation dates and next renewal dates. Systems and their elements that are within their useful lives are further evaluated to identify current deficient conditions that may have a significant impact on a system's or element's remaining service life, and to determine if they are beyond their predicted expected life. The system's or element's current replacement value is based on RS Means Commercial Cost Data. Following are the cost model's system details for this facility. The Replacement Value is the amount needed to replace the property of the same present scope. The Repair Cost (the sum of the cost to repair/replace the Deficiencies) represents the budgeted contractor-installed costs plus owner's soft costs for the repair, replacement or renewal for a component or system level deficiency. It excludes contributing costs for other components or systems that might also be associated with the corrective actions due to packaging of the work. Facility Condition Index ( FCI) is an industry-standard measurement of facility condition calculated as the ratio of the costs to correct a facility's deficiencies (Condition Needs) to the facility's Current Replacement Value. It ranges from 0% (new) to 100% (very poor - beyond service life). The Remaining Service Life Index (RSLI) is calculated as the sum of a renewable system's Remaining Service Life (RSL) divided by the sum of a system's Replacement Value (both values exclude soft-cost to simplify calculation updates) expressed as a percentage ranging from 100% (new) to 0% (expired). The relationship between the key metrics FCI and RSLI is an important indicator, at either the facility, building, system, or component levels, of the condition trend and the imminent need for capital renewal. These indices exist in an inverse relationship wherein the FCI increases when systems reach their expected life-cycle age, whereas the RSLI decreases annually indicating the relative time remaining before reaching the life-cycle expiration age. For example, a facility or a system with a high RSLI and a low FCI indicates it is in the early portion of its useful life. However, a low RSLI indicates that expiration dates are approaching at which point the FCI would increase. The term FCA Score is the inverse of Total FCI and calculated as 100-Total FCI (without the %) where 100 is best and 0 is worst condition. Function: Gross Area (SF): Year Built: Last Renovation: Replacement Value: Repair Cost: Total FCI: Total RSLI: ES -Elementary School $62,111 $7, % % FCA Score: Description: The narrative for this building is included in the Executive Summary Description at the front of this report. Attributes: This asset has no attributes. Mar 10, 2017 Page 50 of 158
51 Campus Assessment Report Storage Dashboard Summary Function: Year Built: Repair Cost: FCI: ES -Elementary School 1970 $7, % Gross Area: Last Renovation: Replacement Value: RSLI%: 529 $62, % Deficiency By Category Deficiency By Priority Deferred Maintenance - $7, Currently Critical (Immediate) 2 - Potentially Critical (Year 1) 3 - Necessary/Not Yet Critical (Years 2-5) - $7, Recommended (Years 6-10) 5 - Codes or Standards Compliance $6,000 $5,000 $4,000 $3,000 $2,000 $1,000 $0 Deficiency By System $6K Electrical $1 $1 $1 $0 $0 $0 10 Year Investment Forecast $0 $0 $0 $0 $0 $0 $0 $0 $0 $ Mar 10, 2017 Page 51 of 158
52 Campus Assessment Report Storage Condition Summary The Table below shows the RSLI and FCI for each major building system shown at the UNIFORMAT classification Level II. Note that Systems with lower FCIs require less investment than systems with higher FCIs. UNIFORMAT Classification RSLI % FCI % Current Repair Cost A10 - Foundations % 0.00 % $0.00 B10 - Superstructure % 0.00 % $0.00 B20 - Exterior Enclosure % 0.00 % $0.00 B30 - Roofing % 0.00 % $0.00 D50 - Electrical 0.00 % % $7, Totals: % % $7, Mar 10, 2017 Page 52 of 158

.")
.")
53 Campus Assessment Report Storage Photo Album The photo album consists of the various cardinal directions of the building.. 1). Southeast Elevation - Feb 10, ). East Elevation - Feb 10, ). North Elevation - Feb 10, ). West Elevation - Feb 10, 2017 Mar 10, 2017 Page 53 of 158
54 Campus Assessment Report Storage Condition Detail This section of the report contains results of the Facility Condition Assessment. The building is separated into system components based on UNIFORMAT II. The columns in the System Listing table represent the following: 1. System Code: A code that identifies the system. 2. System Description: A brief description of a system present in the building. 3. Unit Price $: The unit price of the system. 4. UoM: The unit of measure of the system. 5. Qty: The quantity for the system 6. Life: Building Owners and Managers Association (BOMA) recommended system design life. 7. Year Installed: The date of system installation. 8. Calc Next Renewal Year: The date of system expiration based on the life, NR stands for non renewable. 9. Next Renewal Year: The suggested system expiration date by the assessor based on visual inspection. 10. RSLI: The Remaining Service Life Index of the system. 11. FCI: The Facility Condition Index of the system. 12. RSL: Remaining Service Life in years. 13. ecr: ecomet Condition Rating (not used in this assessment). 14. Deficiency $: The financial investment to repair/replace system to address deficiency. 15. Replacement Value $: The replacement cost of the system. Mar 10, 2017 Page 54 of 158
55 Campus Assessment Report Storage System Listing The System Listing table below lists each of the systems organized by their UNIFORMAT II classification. The assessment team was tasked with recording the most recent replacement year of each system, determining the remaining service life based on the theoretical life, and evaluating the condition to confirm the forecast next replacement year. The system listing is the basis for all data contained in the Building Assessment Report. System Code System Description Unit Price $ UoM Qty Life Year Installed Calc Next Renewal Year Next Renewal Year RSLI% FCI% RSL ecr Deficiency $ Replacement Value $ A1010 Standard Foundations $20.13 S.F % 0.00 % 53 $10,649 A1030 Slab on Grade $19.75 S.F % 0.00 % 53 $10,448 B1020 Roof Construction $16.26 S.F % 0.00 % 53 $8,602 B2010 Exterior Walls $29.79 S.F % 0.00 % 53 $15,759 B2030 Exterior Doors $8.66 S.F % 0.00 % 13 $4,581 B Preformed Metal Roofing $9.66 S.F % 0.00 % 13 $5,110 D5020 Branch Wiring $3.58 S.F % % -17 $2, $1,894 D5020 Lighting $9.58 S.F % % -17 $5, $5,068 Total % % $7, $62,111 Mar 10, 2017 Page 55 of 158


56 Campus Assessment Report Storage System Notes The facility description in the executive summary contains an overview of each system. The photos of each system and any associated notes listed below provide additional information on select systems found within the facility: B Roof Construction B Exterior Walls B Exterior Doors Mar 10, 2017 Page 56 of 158

57 Campus Assessment Report Storage B Preformed Metal Roofing D Branch Wiring D Lighting Mar 10, 2017 Page 57 of 158
58 Campus Assessment Report Storage Renewal Schedule ecomet forecasts future Capital Renewal projects for expiring systems based on the Calculated Next Renewal year found in the system listing. There is a 3% yearly inflation factor applied to the system costs expiring in the future. The table below reflects Capital Renewal projects over the next 10 years. Blank cells (or $0) indicate no systems are scheduled for renewal in that year. Inflation Rate: 3% System Current Deficiencies Total Total: $7,658 $0 $0 $0 $0 $0 $0 $0 $0 $0 $0 $7,658 * A - Substructure $0 $0 $0 $0 $0 $0 $0 $0 $0 $0 $0 $0 * A10 - Foundations $0 $0 $0 $0 $0 $0 $0 $0 $0 $0 $0 $0 * A Standard Foundations $0 $0 $0 $0 $0 $0 $0 $0 $0 $0 $0 $0 * A Slab on Grade $0 $0 $0 $0 $0 $0 $0 $0 $0 $0 $0 $0 B - Shell $0 $0 $0 $0 $0 $0 $0 $0 $0 $0 $0 $0 B10 - Superstructure $0 $0 $0 $0 $0 $0 $0 $0 $0 $0 $0 $0 * B Roof Construction $0 $0 $0 $0 $0 $0 $0 $0 $0 $0 $0 $0 B20 - Exterior Enclosure $0 $0 $0 $0 $0 $0 $0 $0 $0 $0 $0 $0 * B Exterior Walls $0 $0 $0 $0 $0 $0 $0 $0 $0 $0 $0 $0 B Exterior Doors $0 $0 $0 $0 $0 $0 $0 $0 $0 $0 $0 $0 B30 - Roofing $0 $0 $0 $0 $0 $0 $0 $0 $0 $0 $0 $0 B Roof Coverings $0 $0 $0 $0 $0 $0 $0 $0 $0 $0 $0 $0 B Preformed Metal Roofing $0 $0 $0 $0 $0 $0 $0 $0 $0 $0 $0 $0 D - Services $0 $0 $0 $0 $0 $0 $0 $0 $0 $0 $0 $0 D50 - Electrical $0 $0 $0 $0 $0 $0 $0 $0 $0 $0 $0 $0 D Branch Wiring $2,083 $0 $0 $0 $0 $0 $0 $0 $0 $0 $0 $2,083 D Lighting $5,575 $0 $0 $0 $0 $0 $0 $0 $0 $0 $0 $5,575 * Indicates non-renewable system Mar 10, 2017 Page 58 of 158
59 Campus Assessment Report Storage Forecasted Capital Renewal Requirement The following chart shows the current building deficiencies and forecasting capital renewal or sustainment requirements over the next ten years. $8,000 $7,658 $6,000 $4,000 $2,000 $0 Current Deficiencies Mar 10, 2017 Page 59 of 158
60 Campus Assessment Report Storage Deficiency Summary by System Current deficiencies included assemblies that have reached or exceeded their design life or components of the assemblies that are in need of repair. Assemblies that have reached their design life are identified as current deficiencies and assigned the distress 'Beyond Useful Life'. The following chart lists all current deficiencies associated with this facility. D5020 Branch Wiring $2, D5020 Lighting $5, Budget Estimate Total: $7, Mar 10, 2017 Page 60 of 158
61 Campus Assessment Report Storage Deficiency Summary by Priority The following chart shows the total repair costs broken down by priority. Assessors assigned deficiencies within ecomet to one of the following priority categories: 1 - Currently Critical (Immediate) 2 - Potentially Critical (Year 1) 3 - Necessary/Not Yet Critical (Years 2-5) - $7, Recommended (Years 6-10) 5 - Codes or Standards Compliance Budget Estimate Total: $7, Mar 10, 2017 Page 61 of 158
62 Campus Assessment Report Storage Deficiency By Priority Investment Table The table below shows the current investment cost grouped by deficiency priority and building system. 1 - Currently Critical (Immediate) 2 - Potentially Critical (Year 1) 3 - Necessary/Not Yet Critical (Years 2-5) 4 - Recommended (Years 6-10) 5 - Codes or Standards Compliance System Code System Description Total D5020 Branch Wiring $0.00 $0.00 $2, $0.00 $0.00 $2, D5020 Lighting $0.00 $0.00 $5, $0.00 $0.00 $5, Total: $0.00 $0.00 $7, $0.00 $0.00 $7, Mar 10, 2017 Page 62 of 158
63 Campus Assessment Report Storage Deficiency Summary by Category The following chart shows the total repair costs broken down by deficiency categories. Assessors assigned deficiencies to one of the following categories: Deferred Maintenance - $7, Budget Estimate Total: $7, Mar 10, 2017 Page 63 of 158
64 Campus Assessment Report Storage Deficiency Details by Priority The deficiency detail notes listed below provide additional information on identified deficiencies found within the facility. Priority 3 - Necessary/Not Yet Critical (Years 2-5): D Branch Wiring Location: Distress: Category: Priority: Correction: Qty: Unit of Measure: Estimate: Assessor Name: Date Created: Throughout the Building Beyond Service Life Deferred Maintenance 3 - Necessary/Not Yet Critical (Years 2-5) Renew System S.F. $2, Eduardo Lopez 02/11/2017 Notes: The original branch wiring system is operating but is aged, in marginal condition, and should be replaced. D Lighting Location: Distress: Category: Priority: Correction: Qty: Unit of Measure: Estimate: Assessor Name: Date Created: Throughout the Building Beyond Service Life Deferred Maintenance 3 - Necessary/Not Yet Critical (Years 2-5) Renew System S.F. $5, Eduardo Lopez 02/11/2017 Notes: The original lighting system is operating but is aged, in marginal condition, and should be replaced. Mar 10, 2017 Page 64 of 158
65 Campus Assessment Report Addition Executive Summary Building condition is evaluated based on the functional systems and elements of a building and organized according to the UNIFORMAT II Elemental Classification. The grouping of these systems and elements and applying a current replacement value to them develops a representative building cost model. Cost Models are developed for similar building types and functions. Systems and their elements are evaluated based on their current replacement values, life cycles, installation dates and next renewal dates. Systems and their elements that are within their useful lives are further evaluated to identify current deficient conditions that may have a significant impact on a system's or element's remaining service life, and to determine if they are beyond their predicted expected life. The system's or element's current replacement value is based on RS Means Commercial Cost Data. Following are the cost model's system details for this facility. The Replacement Value is the amount needed to replace the property of the same present scope. The Repair Cost (the sum of the cost to repair/replace the Deficiencies) represents the budgeted contractor-installed costs plus owner's soft costs for the repair, replacement or renewal for a component or system level deficiency. It excludes contributing costs for other components or systems that might also be associated with the corrective actions due to packaging of the work. Facility Condition Index ( FCI) is an industry-standard measurement of facility condition calculated as the ratio of the costs to correct a facility's deficiencies (Condition Needs) to the facility's Current Replacement Value. It ranges from 0% (new) to 100% (very poor - beyond service life). The Remaining Service Life Index (RSLI) is calculated as the sum of a renewable system's Remaining Service Life (RSL) divided by the sum of a system's Replacement Value (both values exclude soft-cost to simplify calculation updates) expressed as a percentage ranging from 100% (new) to 0% (expired). The relationship between the key metrics FCI and RSLI is an important indicator, at either the facility, building, system, or component levels, of the condition trend and the imminent need for capital renewal. These indices exist in an inverse relationship wherein the FCI increases when systems reach their expected life-cycle age, whereas the RSLI decreases annually indicating the relative time remaining before reaching the life-cycle expiration age. For example, a facility or a system with a high RSLI and a low FCI indicates it is in the early portion of its useful life. However, a low RSLI indicates that expiration dates are approaching at which point the FCI would increase. The term FCA Score is the inverse of Total FCI and calculated as 100-Total FCI (without the %) where 100 is best and 0 is worst condition. Function: Gross Area (SF): Year Built: Last Renovation: Replacement Value: Repair Cost: Total FCI: Total RSLI: ES -Elementary School 16, $3,031,561 $1,064, % % FCA Score: Description: The narrative for this building is included in the Executive Summary Description at the front of this report. Attributes: This asset has no attributes. Mar 10, 2017 Page 65 of 158
66 Campus Assessment Report Addition Dashboard Summary Function: Year Built: Repair Cost: FCI: ES -Elementary School 1997 $1,064, % Gross Area: Last Renovation: Replacement Value: RSLI%: 16,956 $3,031, % Deficiency By Category Deficiency By Priority Building Code Compliance - $91, Deferred Maintenance - $973, Currently Critical (Immediate) 2 - Potentially Critical (Year 1) 3 - Necessary/Not Yet Critical (Years 2-5) - $973, Recommended (Years 6-10) - $91, Codes or Standards Compliance $200,000 $150,000 $100,000 $50,000 $0 Interior Finishes Deficiency By System $196K $135K $135K $134K $81K $69K Interior Construction Roofing Electrical Furnishings Fire Protection Equipment $31K $27K HVAC $1,500,000 $1,000, Year Investment Forecast $1M $500,000 $0 $232K $0 $0 $0 $0 $0 $0 $3K $ Mar 10, 2017 Page 66 of 158
67 Campus Assessment Report Addition Condition Summary The Table below shows the RSLI and FCI for each major building system shown at the UNIFORMAT classification Level II. Note that Systems with lower FCIs require less investment than systems with higher FCIs. UNIFORMAT Classification RSLI % FCI % Current Repair Cost A10 - Foundations % 0.00 % $0.00 B10 - Superstructure % 0.00 % $0.00 B20 - Exterior Enclosure % 0.00 % $0.00 B30 - Roofing 0.00 % % $177, C10 - Interior Construction % % $177, C30 - Interior Finishes 8.72 % % $258, D20 - Plumbing % 0.00 % $0.00 D30 - HVAC % % $35, D40 - Fire Protection 0.00 % % $91, D50 - Electrical % % $176, E10 - Equipment 0.00 % % $40, E20 - Furnishings 0.00 % % $106, Totals: % % $1,064, Mar 10, 2017 Page 67 of 158

.")
68 Campus Assessment Report Addition Photo Album The photo album consists of the various cardinal directions of the building.. 1). Southwest Elevation - Feb 10, ). South Elevation - Feb 10, ). East Elevation - Feb 10, 2017 Mar 10, 2017 Page 68 of 158
69 Campus Assessment Report Addition Condition Detail This section of the report contains results of the Facility Condition Assessment. The building is separated into system components based on UNIFORMAT II. The columns in the System Listing table represent the following: 1. System Code: A code that identifies the system. 2. System Description: A brief description of a system present in the building. 3. Unit Price $: The unit price of the system. 4. UoM: The unit of measure of the system. 5. Qty: The quantity for the system 6. Life: Building Owners and Managers Association (BOMA) recommended system design life. 7. Year Installed: The date of system installation. 8. Calc Next Renewal Year: The date of system expiration based on the life, NR stands for non renewable. 9. Next Renewal Year: The suggested system expiration date by the assessor based on visual inspection. 10. RSLI: The Remaining Service Life Index of the system. 11. FCI: The Facility Condition Index of the system. 12. RSL: Remaining Service Life in years. 13. ecr: ecomet Condition Rating (not used in this assessment). 14. Deficiency $: The financial investment to repair/replace system to address deficiency. 15. Replacement Value $: The replacement cost of the system. Mar 10, 2017 Page 69 of 158
70 Campus Assessment Report Addition System Listing The System Listing table below lists each of the systems organized by their UNIFORMAT II classification. The assessment team was tasked with recording the most recent replacement year of each system, determining the remaining service life based on the theoretical life, and evaluating the condition to confirm the forecast next replacement year. The system listing is the basis for all data contained in the Building Assessment Report. System Code System Description Unit Price $ UoM Qty Life Year Installed Calc Next Renewal Year Next Renewal Year RSLI% FCI% RSL ecr Deficiency $ Replacement Value $ A1010 Standard Foundations $4.70 S.F. 16, % 0.00 % 80 $79,693 A1030 Slab on Grade $8.26 S.F. 16, % 0.00 % 80 $140,057 B1020 Roof Construction $15.44 S.F. 16, % 0.00 % 80 $261,801 B2010 Exterior Walls $9.24 S.F. 16, % 0.00 % 80 $156,673 B2020 Exterior Windows $9.20 S.F. 16, % 0.00 % 10 $155,995 B2030 Exterior Doors $1.02 S.F. 16, % 0.00 % 10 $17,295 B Single Ply Membrane $6.98 S.F. 16, % % 0 $177, $118,353 C1010 Partitions $10.59 S.F. 16, % 0.00 % 55 $179,564 C1020 Interior Doors $2.48 S.F. 16, % 0.00 % 10 $42,051 C1030 Fittings $9.54 S.F. 16, % % 0 $177, $161,760 C3010 Wall Finishes $2.73 S.F. 16, % % -10 $50, $46,290 C3020 Floor Finishes $11.15 S.F. 16, % % 0 $207, $189,059 C3030 Ceiling Finishes $10.74 S.F. 16, % 0.00 % 5 $182,107 D2010 Plumbing Fixtures $11.26 S.F. 16, % 0.00 % 10 $190,925 D2020 Domestic Water Distribution $0.96 S.F. 16, % 0.00 % 10 $16,278 D2030 Sanitary Waste $1.52 S.F. 16, % 0.00 % 10 $25,773 D2040 Rain Water Drainage $1.36 S.F. 16, % 0.00 % 10 $23,060 D3040 Distribution Systems $6.02 S.F. 16, % 0.00 % 10 $102,075 D3050 Terminal & Package Units $13.09 S.F. 16, % 0.00 % 14 $221,954 D3060 Controls & Instrumentation $1.91 S.F. 16, % % 0 $35, $32,386 D4010 Sprinklers $4.22 S.F. 16, % % -1 $78, $71,554 D4020 Standpipes $0.66 S.F. 16, % % -1 $12, $11,191 D5010 Electrical Service/Distribution $1.65 S.F. 16, % 0.00 % 20 $27,977 D5020 Branch Wiring $4.99 S.F. 16, % 0.00 % 10 $84,610 D5020 Lighting $11.64 S.F. 16, % 0.00 % 10 $197,368 D Security & Detection Systems $1.83 S.F. 16, % % -5 $34, $31,029 D Fire Alarm Systems $3.31 S.F. 16, % % -5 $61, $56,124 D Data Communication $4.30 S.F. 16, % % -5 $80, $72,911 D5090 Other Electrical Systems $0.12 S.F. 16, % 0.00 % 8 $2,035 E1020 Institutional Equipment $0.30 S.F. 16, % % 0 $5, $5,087 E1090 Other Equipment $1.86 S.F. 16, % % 0 $34, $31,538 E2010 Fixed Furnishings $5.72 S.F. 16, % % 0 $106, $96,988 Total % % $1,064, $3,031,561 Mar 10, 2017 Page 70 of 158


71 Campus Assessment Report Addition System Notes The facility description in the executive summary contains an overview of each system. The photos of each system and any associated notes listed below provide additional information on select systems found within the facility: B Roof Construction B Exterior Walls B Exterior Windows Mar 10, 2017 Page 71 of 158


72 Campus Assessment Report Addition B Exterior Doors B Single Ply Membrane C Partitions Mar 10, 2017 Page 72 of 158


73 Campus Assessment Report Addition C Interior Doors C Fittings C Wall Finishes Mar 10, 2017 Page 73 of 158


74 Campus Assessment Report Addition C Floor Finishes C Ceiling Finishes D Plumbing Fixtures Mar 10, 2017 Page 74 of 158


75 Campus Assessment Report Addition D Domestic Water Distribution D Sanitary Waste D Rain Water Drainage Mar 10, 2017 Page 75 of 158


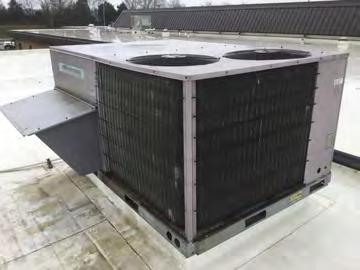
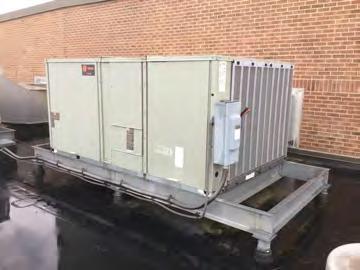
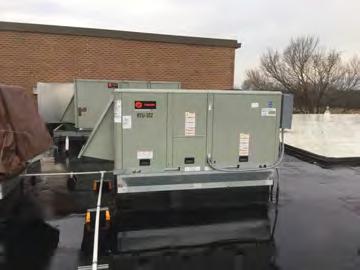
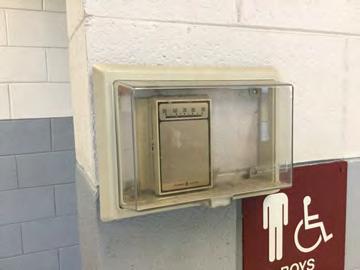
76 Campus Assessment Report Addition D Distribution Systems D Terminal & Package Units D Controls & Instrumentation Mar 10, 2017 Page 76 of 158


77 Campus Assessment Report Addition D Electrical Service/Distribution D Branch Wiring D Lighting Mar 10, 2017 Page 77 of 158


78 Campus Assessment Report Addition D Security & Detection Systems D Fire Alarm Systems D Data Communication Mar 10, 2017 Page 78 of 158


79 Campus Assessment Report Addition D Other Electrical Systems E Institutional Equipment E Other Equipment Mar 10, 2017 Page 79 of 158


80 Campus Assessment Report Addition E Fixed Furnishings Mar 10, 2017 Page 80 of 158
81 Campus Assessment Report Addition Renewal Schedule ecomet forecasts future Capital Renewal projects for expiring systems based on the Calculated Next Renewal year found in the system listing. There is a 3% yearly inflation factor applied to the system costs expiring in the future. The table below reflects Capital Renewal projects over the next 10 years. Blank cells (or $0) indicate no systems are scheduled for renewal in that year. Inflation Rate: 3% System Current Deficiencies Total Total: $1,064,039 $0 $0 $0 $0 $232,223 $0 $0 $2,835 $0 $1,333,021 $2,632,119 * A - Substructure $0 $0 $0 $0 $0 $0 $0 $0 $0 $0 $0 $0 * A10 - Foundations $0 $0 $0 $0 $0 $0 $0 $0 $0 $0 $0 $0 * A Standard Foundations $0 $0 $0 $0 $0 $0 $0 $0 $0 $0 $0 $0 * A Slab on Grade $0 $0 $0 $0 $0 $0 $0 $0 $0 $0 $0 $0 B - Shell $0 $0 $0 $0 $0 $0 $0 $0 $0 $0 $0 $0 B10 - Superstructure $0 $0 $0 $0 $0 $0 $0 $0 $0 $0 $0 $0 B Roof Construction $0 $0 $0 $0 $0 $0 $0 $0 $0 $0 $0 $0 B20 - Exterior Enclosure $0 $0 $0 $0 $0 $0 $0 $0 $0 $0 $0 $0 * B Exterior Walls $0 $0 $0 $0 $0 $0 $0 $0 $0 $0 $0 $0 B Exterior Windows $0 $0 $0 $0 $0 $0 $0 $0 $0 $0 $230,609 $230,609 B Exterior Doors $0 $0 $0 $0 $0 $0 $0 $0 $0 $0 $25,568 $25,568 B30 - Roofing $0 $0 $0 $0 $0 $0 $0 $0 $0 $0 $0 $0 B Roof Coverings $0 $0 $0 $0 $0 $0 $0 $0 $0 $0 $0 $0 B Single Ply Membrane $177,529 $0 $0 $0 $0 $0 $0 $0 $0 $0 $0 $177,529 C - Interiors $0 $0 $0 $0 $0 $0 $0 $0 $0 $0 $0 $0 C10 - Interior Construction $0 $0 $0 $0 $0 $0 $0 $0 $0 $0 $0 $0 * C Partitions $0 $0 $0 $0 $0 $0 $0 $0 $0 $0 $0 $0 C Interior Doors $0 $0 $0 $0 $0 $0 $0 $0 $0 $0 $62,164 $62,164 C Fittings $177,936 $0 $0 $0 $0 $0 $0 $0 $0 $0 $0 $177,936 C30 - Interior Finishes $0 $0 $0 $0 $0 $0 $0 $0 $0 $0 $0 $0 C Wall Finishes $50,919 $0 $0 $0 $0 $0 $0 $0 $0 $0 $68,431 $119,350 C Floor Finishes $207,965 $0 $0 $0 $0 $0 $0 $0 $0 $0 $0 $207,965 C Ceiling Finishes $0 $0 $0 $0 $0 $232,223 $0 $0 $0 $0 $0 $232,223 D - Services $0 $0 $0 $0 $0 $0 $0 $0 $0 $0 $0 $0 D20 - Plumbing $0 $0 $0 $0 $0 $0 $0 $0 $0 $0 $0 $0 Mar 10, 2017 Page 81 of 158
82 Campus Assessment Report Addition D Plumbing Fixtures $0 $0 $0 $0 $0 $0 $0 $0 $0 $0 $282,245 $282,245 D Domestic Water Distribution $0 $0 $0 $0 $0 $0 $0 $0 $0 $0 $24,064 $24,064 D Sanitary Waste $0 $0 $0 $0 $0 $0 $0 $0 $0 $0 $38,100 $38,100 D Rain Water Drainage $0 $0 $0 $0 $0 $0 $0 $0 $0 $0 $34,090 $34,090 D30 - HVAC $0 $0 $0 $0 $0 $0 $0 $0 $0 $0 $0 $0 D Distribution Systems $0 $0 $0 $0 $0 $0 $0 $0 $0 $0 $150,899 $150,899 D Terminal & Package Units $0 $0 $0 $0 $0 $0 $0 $0 $0 $0 $0 $0 D Controls & Instrumentation $35,625 $0 $0 $0 $0 $0 $0 $0 $0 $0 $0 $35,625 D40 - Fire Protection $0 $0 $0 $0 $0 $0 $0 $0 $0 $0 $0 $0 D Sprinklers $78,710 $0 $0 $0 $0 $0 $0 $0 $0 $0 $0 $78,710 D Standpipes $12,310 $0 $0 $0 $0 $0 $0 $0 $0 $0 $0 $12,310 D50 - Electrical $0 $0 $0 $0 $0 $0 $0 $0 $0 $0 $0 $0 D Electrical Service/Distribution $0 $0 $0 $0 $0 $0 $0 $0 $0 $0 $0 $0 D Branch Wiring $0 $0 $0 $0 $0 $0 $0 $0 $0 $0 $125,080 $125,080 D Lighting $0 $0 $0 $0 $0 $0 $0 $0 $0 $0 $291,771 $291,771 D Communications and Security $0 $0 $0 $0 $0 $0 $0 $0 $0 $0 $0 $0 D Security & Detection Systems $34,132 $0 $0 $0 $0 $0 $0 $0 $0 $0 $0 $34,132 D Fire Alarm Systems $61,737 $0 $0 $0 $0 $0 $0 $0 $0 $0 $0 $61,737 D Data Communication $80,202 $0 $0 $0 $0 $0 $0 $0 $0 $0 $0 $80,202 D Other Electrical Systems $0 $0 $0 $0 $0 $0 $0 $0 $2,835 $0 $0 $2,835 E - Equipment & Furnishings $0 $0 $0 $0 $0 $0 $0 $0 $0 $0 $0 $0 E10 - Equipment $0 $0 $0 $0 $0 $0 $0 $0 $0 $0 $0 $0 E Institutional Equipment $5,595 $0 $0 $0 $0 $0 $0 $0 $0 $0 $0 $5,595 E Other Equipment $34,692 $0 $0 $0 $0 $0 $0 $0 $0 $0 $0 $34,692 E20 - Furnishings $0 $0 $0 $0 $0 $0 $0 $0 $0 $0 $0 $0 E Fixed Furnishings $106,687 $0 $0 $0 $0 $0 $0 $0 $0 $0 $0 $106,687 * Indicates non-renewable system Mar 10, 2017 Page 82 of 158
83 Campus Assessment Report Addition Forecasted Capital Renewal Requirement The following chart shows the current building deficiencies and forecasting capital renewal or sustainment requirements over the next ten years. $1,500,000 $1,333,021 $1,000,000 $1,064,039 $500,000 $232,223 $0 $2,835 Current Deficiencies Mar 10, 2017 Page 83 of 158
84 Campus Assessment Report Addition Deficiency Summary by System Current deficiencies included assemblies that have reached or exceeded their design life or components of the assemblies that are in need of repair. Assemblies that have reached their design life are identified as current deficiencies and assigned the distress 'Beyond Useful Life'. The following chart lists all current deficiencies associated with this facility. B Single Ply Membrane $177, C1030 Fittings $177, C3010 Wall Finishes $50, C3020 Floor Finishes $207, D3060 Controls & Instrumentation $35, D4010 Sprinklers $78, D Fire Alarm Systems $61, D Data Communication $80, E1090 Other Equipment $34, E2010 Fixed Furnishings $106, Other $52, Budget Estimate Total: $1,064, Mar 10, 2017 Page 84 of 158
85 Campus Assessment Report Addition Deficiency Summary by Priority The following chart shows the total repair costs broken down by priority. Assessors assigned deficiencies within ecomet to one of the following priority categories: 1 - Currently Critical (Immediate) 2 - Potentially Critical (Year 1) 3 - Necessary/Not Yet Critical (Years 2-5) - $973, Recommended (Years 6-10) - $91, Codes or Standards Compliance Budget Estimate Total: $1,064, Mar 10, 2017 Page 85 of 158
86 Campus Assessment Report Addition Deficiency By Priority Investment Table The table below shows the current investment cost grouped by deficiency priority and building system. 1 - Currently Critical (Immediate) 2 - Potentially Critical (Year 1) 3 - Necessary/Not Yet Critical (Years 2-5) 4 - Recommended (Years 6-10) 5 - Codes or Standards Compliance System Code System Description Total B Single Ply Membrane $0.00 $0.00 $177, $0.00 $0.00 $177, C1030 Fittings $0.00 $0.00 $177, $0.00 $0.00 $177, C3010 Wall Finishes $0.00 $0.00 $50, $0.00 $0.00 $50, C3020 Floor Finishes $0.00 $0.00 $207, $0.00 $0.00 $207, D3060 Controls & Instrumentation $0.00 $0.00 $35, $0.00 $0.00 $35, D4010 Sprinklers $0.00 $0.00 $0.00 $78, $0.00 $78, D4020 Standpipes $0.00 $0.00 $0.00 $12, $0.00 $12, D Security & Detection Systems $0.00 $0.00 $34, $0.00 $0.00 $34, D Fire Alarm Systems $0.00 $0.00 $61, $0.00 $0.00 $61, D Data Communication $0.00 $0.00 $80, $0.00 $0.00 $80, E1020 Institutional Equipment $0.00 $0.00 $5, $0.00 $0.00 $5, E1090 Other Equipment $0.00 $0.00 $34, $0.00 $0.00 $34, E2010 Fixed Furnishings $0.00 $0.00 $106, $0.00 $0.00 $106, Total: $0.00 $0.00 $973, $91, $0.00 $1,064, Mar 10, 2017 Page 86 of 158
87 Campus Assessment Report Addition Deficiency Summary by Category The following chart shows the total repair costs broken down by deficiency categories. Assessors assigned deficiencies to one of the following categories: Building Code Compliance - $91, Deferred Maintenance - $973, Budget Estimate Total: $1,064, Mar 10, 2017 Page 87 of 158
88 Campus Assessment Report Addition Deficiency Details by Priority The deficiency detail notes listed below provide additional information on identified deficiencies found within the facility. Priority 3 - Necessary/Not Yet Critical (Years 2-5): B Single Ply Membrane Location: Distress: Category: Priority: Correction: Qty: Unit of Measure: Estimate: Assessor Name: Date Created: Roof Beyond Service Life Deferred Maintenance 3 - Necessary/Not Yet Critical (Years 2-5) Renew System 16, S.F. $177, Eduardo Lopez 01/19/2017 Notes: The membrane roof covering is aged, showing signs of failure and should be replaced. C Fittings Location: Distress: Category: Priority: Correction: Qty: Unit of Measure: Estimate: Assessor Name: Date Created: Throughout the Building Beyond Service Life Deferred Maintenance 3 - Necessary/Not Yet Critical (Years 2-5) Renew System 16, S.F. $177, Eduardo Lopez 01/19/2017 Notes: The fittings throughout the building are aged, in marginal condition, handrails and room signage are not ADA compliant and should be replaced. Mar 10, 2017 Page 88 of 158
89 Campus Assessment Report Addition C Wall Finishes Location: Distress: Category: Priority: Correction: Qty: Unit of Measure: Estimate: Assessor Name: Date Created: Throughout the Building Beyond Service Life Deferred Maintenance 3 - Necessary/Not Yet Critical (Years 2-5) Renew System 16, S.F. $50, Eduardo Lopez 01/19/2017 Notes: The wall finishes are aged, scuffed, fading, stained and should be replaced. C Floor Finishes Location: Distress: Category: Priority: Correction: Qty: Unit of Measure: Estimate: Assessor Name: Date Created: Throughout the Building Beyond Service Life Deferred Maintenance 3 - Necessary/Not Yet Critical (Years 2-5) Renew System 16, S.F. $207, Eduardo Lopez 01/19/2017 Notes: The original flooring is in poor conditions and should be replaced. Mar 10, 2017 Page 89 of 158
90 Campus Assessment Report Addition D Controls & Instrumentation Location: Distress: Category: Priority: Correction: Qty: Unit of Measure: Estimate: Assessor Name: Date Created: Throughout the Building Beyond Service Life Deferred Maintenance 3 - Necessary/Not Yet Critical (Years 2-5) Renew System 16, S.F. $35, Eduardo Lopez 01/19/2017 Notes: The controls and instrumentation system is in marginal condition and should be schedule for replacement. D Security & Detection Systems Location: Distress: Category: Priority: Correction: Qty: Unit of Measure: Estimate: Assessor Name: Date Created: Throughout the Building Beyond Service Life Deferred Maintenance 3 - Necessary/Not Yet Critical (Years 2-5) Renew System 16, S.F. $34, Eduardo Lopez 01/19/2017 Notes: The security and detection system is beyond its expected service life and should be scheduled for replacement. Mar 10, 2017 Page 90 of 158
 Renew System 16,956.00 S.F. $61,737.")
91 Campus Assessment Report Addition D Fire Alarm Systems Location: Distress: Category: Priority: Correction: Qty: Unit of Measure: Estimate: Assessor Name: Date Created: Throughout the Building Beyond Service Life Deferred Maintenance 3 - Necessary/Not Yet Critical (Years 2-5) Renew System 16, S.F. $61, Eduardo Lopez 01/19/2017 Notes: The fire alarm system is beyond its expected service life and should be scheduled for replacement. D Data Communication Location: Distress: Category: Priority: Correction: Qty: Unit of Measure: Estimate: Assessor Name: Date Created: Throughout the Building Beyond Service Life Deferred Maintenance 3 - Necessary/Not Yet Critical (Years 2-5) Renew System 16, S.F. $80, Eduardo Lopez 01/19/2017 Notes: The data communication system is beyond its expected service life and should be scheduled for replacement. Mar 10, 2017 Page 91 of 158
92 Campus Assessment Report Addition E Institutional Equipment Location: Distress: Category: Priority: Correction: Qty: Unit of Measure: Estimate: Assessor Name: Date Created: Throughout the Building Beyond Service Life Deferred Maintenance 3 - Necessary/Not Yet Critical (Years 2-5) Renew System 16, S.F. $5, Eduardo Lopez 01/19/2017 Notes: The institutional equipment is in deteriorating conditions and should be replaced. E Other Equipment Location: Distress: Category: Priority: Correction: Qty: Unit of Measure: Estimate: Assessor Name: Date Created: Throughout the Building Beyond Service Life Deferred Maintenance 3 - Necessary/Not Yet Critical (Years 2-5) Renew System 16, S.F. $34, Eduardo Lopez 01/19/2017 Notes: The other equipment is in deteriorating conditions and should be replaced. Mar 10, 2017 Page 92 of 158
93 Campus Assessment Report Addition E Fixed Furnishings Location: Distress: Category: Priority: Correction: Qty: Unit of Measure: Estimate: Assessor Name: Date Created: Throughout the Building Beyond Service Life Deferred Maintenance 3 - Necessary/Not Yet Critical (Years 2-5) Renew System 16, S.F. $106, Eduardo Lopez 01/19/2017 Notes: The fixed furnishings are aged, in marginal condition, and should be replaced. Mar 10, 2017 Page 93 of 158
94 Campus Assessment Report Addition Priority 4 - Recommended (Years 6-10): D Sprinklers This deficiency has no image. Location: Distress: Category: Priority: Correction: Qty: Unit of Measure: Estimate: Assessor Name: Date Created: Throughout the building Missing Building Code Compliance 4 - Recommended (Years 6-10) Renew System 16, S.F. $78, Eduardo Lopez 02/11/2017 Notes: A sprinkler system is missing and is recommended to be provided to comply with current codes. D Standpipes This deficiency has no image. Location: Distress: Category: Priority: Correction: Qty: Unit of Measure: Estimate: Assessor Name: Date Created: Throughout the building Missing Building Code Compliance 4 - Recommended (Years 6-10) Renew System 16, S.F. $12, Eduardo Lopez 02/11/2017 Notes: A standpipe system is missing and is recommended to be provided to comply with current codes. Mar 10, 2017 Page 94 of 158
95 Campus Assessment Report Addition Executive Summary Building condition is evaluated based on the functional systems and elements of a building and organized according to the UNIFORMAT II Elemental Classification. The grouping of these systems and elements and applying a current replacement value to them develops a representative building cost model. Cost Models are developed for similar building types and functions. Systems and their elements are evaluated based on their current replacement values, life cycles, installation dates and next renewal dates. Systems and their elements that are within their useful lives are further evaluated to identify current deficient conditions that may have a significant impact on a system's or element's remaining service life, and to determine if they are beyond their predicted expected life. The system's or element's current replacement value is based on RS Means Commercial Cost Data. Following are the cost model's system details for this facility. The Replacement Value is the amount needed to replace the property of the same present scope. The Repair Cost (the sum of the cost to repair/replace the Deficiencies) represents the budgeted contractor-installed costs plus owner's soft costs for the repair, replacement or renewal for a component or system level deficiency. It excludes contributing costs for other components or systems that might also be associated with the corrective actions due to packaging of the work. Facility Condition Index ( FCI) is an industry-standard measurement of facility condition calculated as the ratio of the costs to correct a facility's deficiencies (Condition Needs) to the facility's Current Replacement Value. It ranges from 0% (new) to 100% (very poor - beyond service life). The Remaining Service Life Index (RSLI) is calculated as the sum of a renewable system's Remaining Service Life (RSL) divided by the sum of a system's Replacement Value (both values exclude soft-cost to simplify calculation updates) expressed as a percentage ranging from 100% (new) to 0% (expired). The relationship between the key metrics FCI and RSLI is an important indicator, at either the facility, building, system, or component levels, of the condition trend and the imminent need for capital renewal. These indices exist in an inverse relationship wherein the FCI increases when systems reach their expected life-cycle age, whereas the RSLI decreases annually indicating the relative time remaining before reaching the life-cycle expiration age. For example, a facility or a system with a high RSLI and a low FCI indicates it is in the early portion of its useful life. However, a low RSLI indicates that expiration dates are approaching at which point the FCI would increase. The term FCA Score is the inverse of Total FCI and calculated as 100-Total FCI (without the %) where 100 is best and 0 is worst condition. Function: Gross Area (SF): Year Built: Last Renovation: Replacement Value: Repair Cost: Total FCI: Total RSLI: ES -Elementary School 9, $1,772,338 $53, % % FCA Score: Description: The narrative for this building is included in the Executive Summary Description at the front of this report. Attributes: This asset has no attributes. Mar 10, 2017 Page 95 of 158
96 Campus Assessment Report Addition Dashboard Summary Function: Year Built: Repair Cost: FCI: ES -Elementary School 2005 $53, % Gross Area: Last Renovation: Replacement Value: RSLI%: 9,943 $1,772, % Deficiency By Category Deficiency By Priority Building Code Compliance - $53, Currently Critical (Immediate) 2 - Potentially Critical (Year 1) 3 - Necessary/Not Yet Critical (Years 2-5) 4 - Recommended (Years 6-10) - $53, Codes or Standards Compliance $50,000 $40,000 $30,000 $20,000 $10,000 $0 Deficiency By System $40K Fire Protection $600,000 $500,000 $400,000 $300,000 $200,000 $100,000 $0 10 Year Investment Forecast $548K $302K $0 $0 $0 $0 $0 $0 $0 $ Mar 10, 2017 Page 96 of 158
97 Campus Assessment Report Addition Condition Summary The Table below shows the RSLI and FCI for each major building system shown at the UNIFORMAT classification Level II. Note that Systems with lower FCIs require less investment than systems with higher FCIs. UNIFORMAT Classification RSLI % FCI % Current Repair Cost A10 - Foundations % 0.00 % $0.00 B10 - Superstructure % 0.00 % $0.00 B20 - Exterior Enclosure % 0.00 % $0.00 B30 - Roofing % 0.00 % $0.00 C10 - Interior Construction % 0.00 % $0.00 C30 - Interior Finishes % 0.00 % $0.00 D20 - Plumbing % 0.00 % $0.00 D30 - HVAC % 0.00 % $0.00 D40 - Fire Protection 0.00 % % $53, D50 - Electrical % 0.00 % $0.00 E10 - Equipment % 0.00 % $0.00 E20 - Furnishings % 0.00 % $0.00 Totals: % 3.01 % $53, Mar 10, 2017 Page 97 of 158
.")
.")
98 Campus Assessment Report Addition Photo Album The photo album consists of the various cardinal directions of the building.. 1). Northeast Elevation - Feb 10, ). Northwest Elevation - Feb 10, ). Southwest Elevation - Feb 10, 2017 Mar 10, 2017 Page 98 of 158
99 Campus Assessment Report Addition Condition Detail This section of the report contains results of the Facility Condition Assessment. The building is separated into system components based on UNIFORMAT II. The columns in the System Listing table represent the following: 1. System Code: A code that identifies the system. 2. System Description: A brief description of a system present in the building. 3. Unit Price $: The unit price of the system. 4. UoM: The unit of measure of the system. 5. Qty: The quantity for the system 6. Life: Building Owners and Managers Association (BOMA) recommended system design life. 7. Year Installed: The date of system installation. 8. Calc Next Renewal Year: The date of system expiration based on the life, NR stands for non renewable. 9. Next Renewal Year: The suggested system expiration date by the assessor based on visual inspection. 10. RSLI: The Remaining Service Life Index of the system. 11. FCI: The Facility Condition Index of the system. 12. RSL: Remaining Service Life in years. 13. ecr: ecomet Condition Rating (not used in this assessment). 14. Deficiency $: The financial investment to repair/replace system to address deficiency. 15. Replacement Value $: The replacement cost of the system. Mar 10, 2017 Page 99 of 158
100 Campus Assessment Report Addition System Listing The System Listing table below lists each of the systems organized by their UNIFORMAT II classification. The assessment team was tasked with recording the most recent replacement year of each system, determining the remaining service life based on the theoretical life, and evaluating the condition to confirm the forecast next replacement year. The system listing is the basis for all data contained in the Building Assessment Report. System Code System Description Unit Price $ UoM Qty Life Year Installed Calc Next Renewal Year Next Renewal Year RSLI% FCI% RSL ecr Deficiency $ Replacement Value $ A1010 Standard Foundations $4.70 S.F. 9, % 0.00 % 88 $46,732 A1030 Slab on Grade $8.26 S.F. 9, % 0.00 % 88 $82,129 B1020 Roof Construction $15.44 S.F. 9, % 0.00 % 88 $153,520 B2010 Exterior Walls $9.24 S.F. 9, % 0.00 % 88 $91,873 B2020 Exterior Windows $9.20 S.F. 9, % 0.00 % 18 $91,476 B2030 Exterior Doors $1.02 S.F. 9, % 0.00 % 18 $10,142 B Single Ply Membrane $6.98 S.F. 9, % 0.00 % 8 $69,402 C1010 Partitions $10.59 S.F. 9, % 0.00 % 63 $105,296 C1020 Interior Doors $2.48 S.F. 9, % 0.00 % 18 $24,659 C1030 Fittings $9.54 S.F. 9, % 0.00 % 8 $94,856 C3010 Wall Finishes $2.73 S.F. 9, % 0.00 % 3 $27,144 C3020 Floor Finishes $11.15 S.F. 9, % 0.00 % 8 $110,864 C3030 Ceiling Finishes $10.74 S.F. 9, % 0.00 % 13 $106,788 D2010 Plumbing Fixtures $11.26 S.F. 9, % 0.00 % 18 $111,958 D2020 Domestic Water Distribution $0.96 S.F. 9, % 0.00 % 18 $9,545 D2030 Sanitary Waste $1.52 S.F. 9, % 0.00 % 18 $15,113 D2040 Rain Water Drainage $1.36 S.F. 9, % 0.00 % 18 $13,522 D3040 Distribution Systems $6.02 S.F. 9, % 0.00 % 18 $59,857 D3050 Terminal & Package Units $13.09 S.F. 9, % 0.00 % 3 $130,154 D3060 Controls & Instrumentation $1.91 S.F. 9, % 0.00 % 8 $18,991 D4010 Sprinklers $4.22 S.F. 9, % % -1 $46, $41,959 D4020 Standpipes $0.66 S.F. 9, % % -1 $7, $6,562 D5010 Electrical Service/Distribution $1.65 S.F. 9, % 0.00 % 28 $16,406 D5020 Branch Wiring $4.99 S.F. 9, % 0.00 % 18 $49,616 D5020 Lighting $11.64 S.F. 9, % 0.00 % 18 $115,737 D Security & Detection Systems $1.83 S.F. 9, % 0.00 % 3 $18,196 D Fire Alarm Systems $3.31 S.F. 9, % 0.00 % 3 $32,911 D Data Communication $4.30 S.F. 9, % 0.00 % 3 $42,755 D5090 Other Electrical Systems $0.12 S.F. 9, % 0.00 % 8 $1,193 E1020 Institutional Equipment $1.62 S.F. 9, % 0.00 % 8 $16,108 E2010 Fixed Furnishings $5.72 S.F. 9, % 0.00 % 8 $56,874 Total % 3.01 % $53, $1,772,338 Mar 10, 2017 Page 100 of 158


101 Campus Assessment Report Addition System Notes The facility description in the executive summary contains an overview of each system. The photos of each system and any associated notes listed below provide additional information on select systems found within the facility: B Exterior Walls B Exterior Windows B Exterior Doors Mar 10, 2017 Page 101 of 158
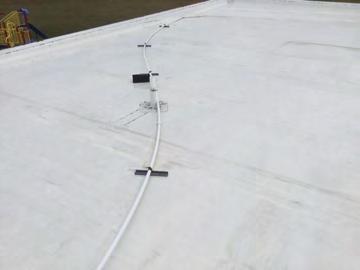

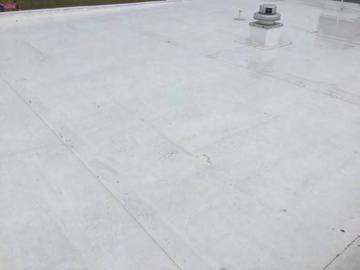
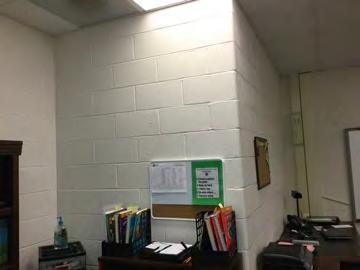
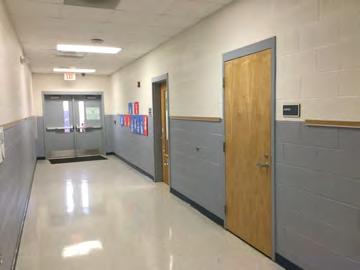
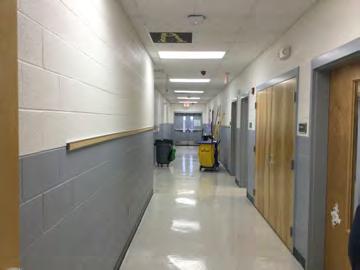
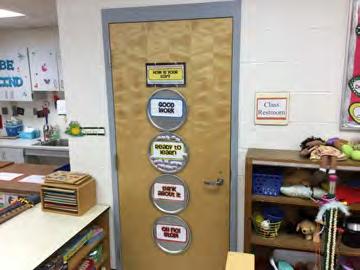
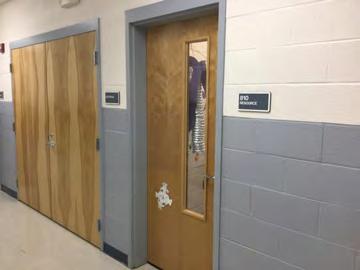
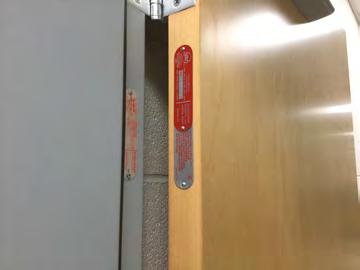
102 Campus Assessment Report Addition B Single Ply Membrane C Partitions C Interior Doors Mar 10, 2017 Page 102 of 158

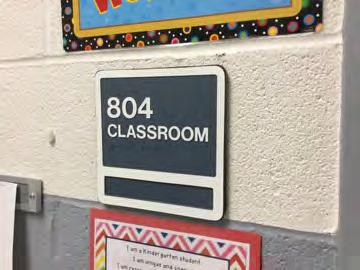
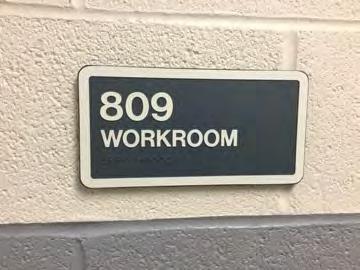
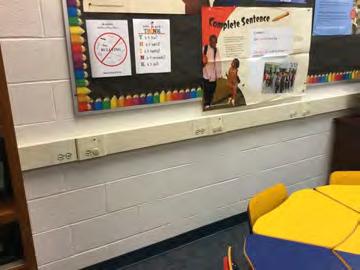
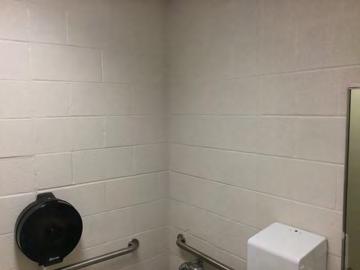
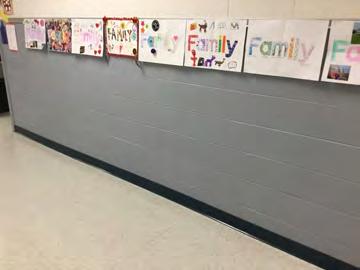
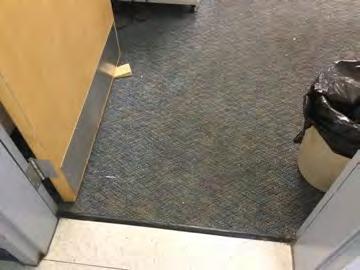
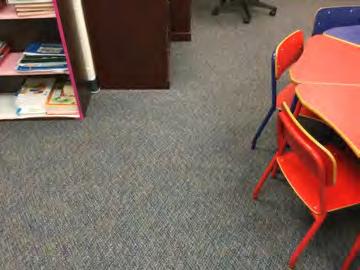
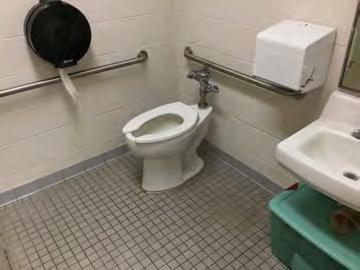
103 Campus Assessment Report Addition C Fittings C Wall Finishes C Floor Finishes Mar 10, 2017 Page 103 of 158


104 Campus Assessment Report Addition C Ceiling Finishes D Plumbing Fixtures D Domestic Water Distribution Mar 10, 2017 Page 104 of 158


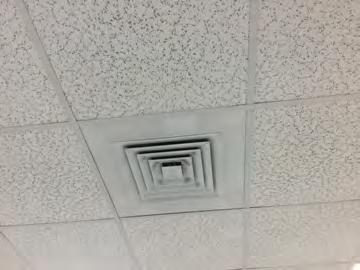
105 Campus Assessment Report Addition D Sanitary Waste D Rain Water Drainage D Distribution Systems Mar 10, 2017 Page 105 of 158


106 Campus Assessment Report Addition D Terminal & Package Units D Controls & Instrumentation D Electrical Service/Distribution Mar 10, 2017 Page 106 of 158


107 Campus Assessment Report Addition D Branch Wiring D Lighting D Security & Detection Systems Mar 10, 2017 Page 107 of 158


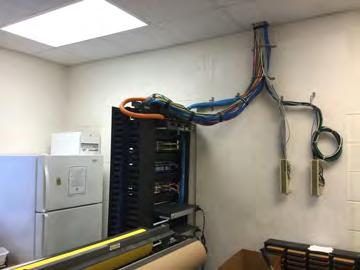
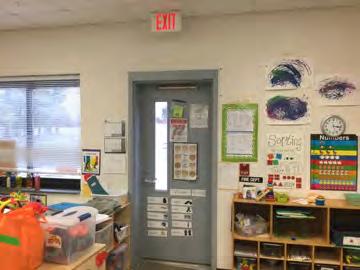
108 Campus Assessment Report Addition D Fire Alarm Systems D Data Communication D Other Electrical Systems Mar 10, 2017 Page 108 of 158


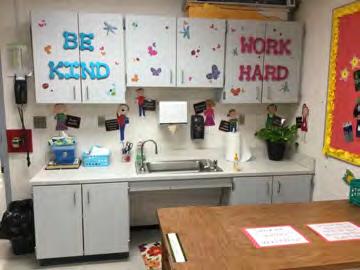
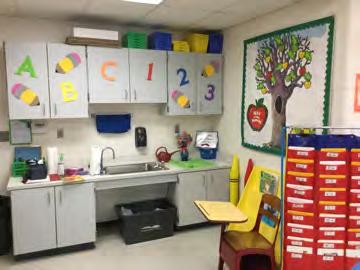
109 Campus Assessment Report Addition E Institutional Equipment E Fixed Furnishings Mar 10, 2017 Page 109 of 158
110 Campus Assessment Report Addition Renewal Schedule ecomet forecasts future Capital Renewal projects for expiring systems based on the Calculated Next Renewal year found in the system listing. There is a 3% yearly inflation factor applied to the system costs expiring in the future. The table below reflects Capital Renewal projects over the next 10 years. Blank cells (or $0) indicate no systems are scheduled for renewal in that year. Inflation Rate: 3% System Current Deficiencies Total Total: $53,374 $0 $0 $301,893 $0 $0 $0 $0 $548,356 $0 $0 $903,623 * A - Substructure $0 $0 $0 $0 $0 $0 $0 $0 $0 $0 $0 $0 * A10 - Foundations $0 $0 $0 $0 $0 $0 $0 $0 $0 $0 $0 $0 * A Standard Foundations $0 $0 $0 $0 $0 $0 $0 $0 $0 $0 $0 $0 * A Slab on Grade $0 $0 $0 $0 $0 $0 $0 $0 $0 $0 $0 $0 B - Shell $0 $0 $0 $0 $0 $0 $0 $0 $0 $0 $0 $0 B10 - Superstructure $0 $0 $0 $0 $0 $0 $0 $0 $0 $0 $0 $0 * B Roof Construction $0 $0 $0 $0 $0 $0 $0 $0 $0 $0 $0 $0 B20 - Exterior Enclosure $0 $0 $0 $0 $0 $0 $0 $0 $0 $0 $0 $0 * B Exterior Walls $0 $0 $0 $0 $0 $0 $0 $0 $0 $0 $0 $0 B Exterior Windows $0 $0 $0 $0 $0 $0 $0 $0 $0 $0 $0 $0 B Exterior Doors $0 $0 $0 $0 $0 $0 $0 $0 $0 $0 $0 $0 B30 - Roofing $0 $0 $0 $0 $0 $0 $0 $0 $0 $0 $0 $0 B Roof Coverings $0 $0 $0 $0 $0 $0 $0 $0 $0 $0 $0 $0 B Single Ply Membrane $0 $0 $0 $0 $0 $0 $0 $0 $131,875 $0 $0 $131,875 C - Interiors $0 $0 $0 $0 $0 $0 $0 $0 $0 $0 $0 $0 C10 - Interior Construction $0 $0 $0 $0 $0 $0 $0 $0 $0 $0 $0 $0 * C Partitions $0 $0 $0 $0 $0 $0 $0 $0 $0 $0 $0 $0 C Interior Doors $0 $0 $0 $0 $0 $0 $0 $0 $0 $0 $0 $0 C Fittings $0 $0 $0 $0 $0 $0 $0 $0 $132,177 $0 $0 $132,177 C30 - Interior Finishes $0 $0 $0 $0 $0 $0 $0 $0 $0 $0 $0 $0 C Wall Finishes $0 $0 $0 $32,628 $0 $0 $0 $0 $0 $0 $0 $32,628 C Floor Finishes $0 $0 $0 $0 $0 $0 $0 $0 $154,484 $0 $0 $154,484 C Ceiling Finishes $0 $0 $0 $0 $0 $0 $0 $0 $0 $0 $0 $0 D - Services $0 $0 $0 $0 $0 $0 $0 $0 $0 $0 $0 $0 D20 - Plumbing $0 $0 $0 $0 $0 $0 $0 $0 $0 $0 $0 $0 Mar 10, 2017 Page 110 of 158
111 Campus Assessment Report Addition D Plumbing Fixtures $0 $0 $0 $0 $0 $0 $0 $0 $0 $0 $0 $0 D Domestic Water Distribution $0 $0 $0 $0 $0 $0 $0 $0 $0 $0 $0 $0 D Sanitary Waste $0 $0 $0 $0 $0 $0 $0 $0 $0 $0 $0 $0 D Rain Water Drainage $0 $0 $0 $0 $0 $0 $0 $0 $0 $0 $0 $0 D30 - HVAC $0 $0 $0 $0 $0 $0 $0 $0 $0 $0 $0 $0 D Distribution Systems $0 $0 $0 $0 $0 $0 $0 $0 $0 $0 $0 $0 D Terminal & Package Units $0 $0 $0 $156,445 $0 $0 $0 $0 $0 $0 $0 $156,445 D Controls & Instrumentation $0 $0 $0 $0 $0 $0 $0 $0 $26,463 $0 $0 $26,463 D40 - Fire Protection $0 $0 $0 $0 $0 $0 $0 $0 $0 $0 $0 $0 D Sprinklers $46,155 $0 $0 $0 $0 $0 $0 $0 $0 $0 $0 $46,155 D Standpipes $7,219 $0 $0 $0 $0 $0 $0 $0 $0 $0 $0 $7,219 D50 - Electrical $0 $0 $0 $0 $0 $0 $0 $0 $0 $0 $0 $0 D Electrical Service/Distribution $0 $0 $0 $0 $0 $0 $0 $0 $0 $0 $0 $0 D Branch Wiring $0 $0 $0 $0 $0 $0 $0 $0 $0 $0 $0 $0 D Lighting $0 $0 $0 $0 $0 $0 $0 $0 $0 $0 $0 $0 D Communications and Security $0 $0 $0 $0 $0 $0 $0 $0 $0 $0 $0 $0 D Security & Detection Systems $0 $0 $0 $21,871 $0 $0 $0 $0 $0 $0 $0 $21,871 D Fire Alarm Systems $0 $0 $0 $39,559 $0 $0 $0 $0 $0 $0 $0 $39,559 D Data Communication $0 $0 $0 $51,391 $0 $0 $0 $0 $0 $0 $0 $51,391 D Other Electrical Systems $0 $0 $0 $0 $0 $0 $0 $0 $1,662 $0 $0 $1,662 E - Equipment & Furnishings $0 $0 $0 $0 $0 $0 $0 $0 $0 $0 $0 $0 E10 - Equipment $0 $0 $0 $0 $0 $0 $0 $0 $0 $0 $0 $0 E Institutional Equipment $0 $0 $0 $0 $0 $0 $0 $0 $22,445 $0 $0 $22,445 E20 - Furnishings $0 $0 $0 $0 $0 $0 $0 $0 $0 $0 $0 $0 E Fixed Furnishings $0 $0 $0 $0 $0 $0 $0 $0 $79,250 $0 $0 $79,250 * Indicates non-renewable system Mar 10, 2017 Page 111 of 158
112 Campus Assessment Report Addition Forecasted Capital Renewal Requirement The following chart shows the current building deficiencies and forecasting capital renewal or sustainment requirements over the next ten years. $600,000 $548,356 $500,000 $400,000 $300,000 $301,893 $200,000 $100,000 $53,374 $0 Current Deficiencies Mar 10, 2017 Page 112 of 158
113 Campus Assessment Report Addition Deficiency Summary by System Current deficiencies included assemblies that have reached or exceeded their design life or components of the assemblies that are in need of repair. Assemblies that have reached their design life are identified as current deficiencies and assigned the distress 'Beyond Useful Life'. The following chart lists all current deficiencies associated with this facility. D4010 Sprinklers $46, D4020 Standpipes $7, Budget Estimate Total: $53, Mar 10, 2017 Page 113 of 158
114 Campus Assessment Report Addition Deficiency Summary by Priority The following chart shows the total repair costs broken down by priority. Assessors assigned deficiencies within ecomet to one of the following priority categories: 1 - Currently Critical (Immediate) 2 - Potentially Critical (Year 1) 3 - Necessary/Not Yet Critical (Years 2-5) 4 - Recommended (Years 6-10) - $53, Codes or Standards Compliance Budget Estimate Total: $53, Mar 10, 2017 Page 114 of 158
115 Campus Assessment Report Addition Deficiency By Priority Investment Table The table below shows the current investment cost grouped by deficiency priority and building system. 1 - Currently Critical (Immediate) 2 - Potentially Critical (Year 1) 3 - Necessary/Not Yet Critical (Years 2-5) 4 - Recommended (Years 6-10) 5 - Codes or Standards Compliance System Code System Description Total D4010 Sprinklers $0.00 $0.00 $0.00 $46, $0.00 $46, D4020 Standpipes $0.00 $0.00 $0.00 $7, $0.00 $7, Total: $0.00 $0.00 $0.00 $53, $0.00 $53, Mar 10, 2017 Page 115 of 158
116 Campus Assessment Report Addition Deficiency Summary by Category The following chart shows the total repair costs broken down by deficiency categories. Assessors assigned deficiencies to one of the following categories: Building Code Compliance - $53, Budget Estimate Total: $53, Mar 10, 2017 Page 116 of 158
117 Campus Assessment Report Addition Deficiency Details by Priority The deficiency detail notes listed below provide additional information on identified deficiencies found within the facility. Priority 4 - Recommended (Years 6-10): D Sprinklers This deficiency has no image. Location: Distress: Category: Priority: Correction: Qty: Unit of Measure: Estimate: Assessor Name: Date Created: Throughout the building Missing Building Code Compliance 4 - Recommended (Years 6-10) Renew System 9, S.F. $46, Eduardo Lopez 02/11/2017 Notes: A sprinklers system is missing and is recommended to be provided to comply with current codes. D Standpipes This deficiency has no image. Location: Distress: Category: Priority: Correction: Qty: Unit of Measure: Estimate: Assessor Name: Date Created: Throughout the building Missing Building Code Compliance 4 - Recommended (Years 6-10) Renew System 9, S.F. $7, Eduardo Lopez 02/11/2017 Notes: A standpipe system is missing and is recommended to be provided to comply with current codes. Mar 10, 2017 Page 117 of 158
118 Campus Assessment Report PreK Building Executive Summary Building condition is evaluated based on the functional systems and elements of a building and organized according to the UNIFORMAT II Elemental Classification. The grouping of these systems and elements and applying a current replacement value to them develops a representative building cost model. Cost Models are developed for similar building types and functions. Systems and their elements are evaluated based on their current replacement values, life cycles, installation dates and next renewal dates. Systems and their elements that are within their useful lives are further evaluated to identify current deficient conditions that may have a significant impact on a system's or element's remaining service life, and to determine if they are beyond their predicted expected life. The system's or element's current replacement value is based on RS Means Commercial Cost Data. Following are the cost model's system details for this facility. The Replacement Value is the amount needed to replace the property of the same present scope. The Repair Cost (the sum of the cost to repair/replace the Deficiencies) represents the budgeted contractor-installed costs plus owner's soft costs for the repair, replacement or renewal for a component or system level deficiency. It excludes contributing costs for other components or systems that might also be associated with the corrective actions due to packaging of the work. Facility Condition Index ( FCI) is an industry-standard measurement of facility condition calculated as the ratio of the costs to correct a facility's deficiencies (Condition Needs) to the facility's Current Replacement Value. It ranges from 0% (new) to 100% (very poor - beyond service life). The Remaining Service Life Index (RSLI) is calculated as the sum of a renewable system's Remaining Service Life (RSL) divided by the sum of a system's Replacement Value (both values exclude soft-cost to simplify calculation updates) expressed as a percentage ranging from 100% (new) to 0% (expired). The relationship between the key metrics FCI and RSLI is an important indicator, at either the facility, building, system, or component levels, of the condition trend and the imminent need for capital renewal. These indices exist in an inverse relationship wherein the FCI increases when systems reach their expected life-cycle age, whereas the RSLI decreases annually indicating the relative time remaining before reaching the life-cycle expiration age. For example, a facility or a system with a high RSLI and a low FCI indicates it is in the early portion of its useful life. However, a low RSLI indicates that expiration dates are approaching at which point the FCI would increase. The term FCA Score is the inverse of Total FCI and calculated as 100-Total FCI (without the %) where 100 is best and 0 is worst condition. Function: Gross Area (SF): Year Built: Last Renovation: Replacement Value: Repair Cost: Total FCI: Total RSLI: ES -Elementary School 1, $176,289 $3, % % FCA Score: Description: The narrative for this building is included in the Executive Summary Description at the front of this report. Attributes: This asset has no attributes. Mar 10, 2017 Page 118 of 158
119 Campus Assessment Report PreK Building Dashboard Summary Function: Year Built: Repair Cost: FCI: ES -Elementary School 2007 $3, % Gross Area: Last Renovation: Replacement Value: RSLI%: 1,050 $176, % Deficiency By Category Deficiency By Priority Deferred Maintenance - $3, Currently Critical (Immediate) 2 - Potentially Critical (Year 1) 3 - Necessary/Not Yet Critical (Years 2-5) - $3, Recommended (Years 6-10) 5 - Codes or Standards Compliance $2,500 $2,000 $1,500 $1,000 $500 $0 Deficiency By System $2K Interior Finishes $70,000 $60,000 $50,000 $40,000 $30,000 $20,000 $10,000 $0 10 Year Investment Forecast $60K $28K $0 $0 $0 $0 $0 $0 $0 $ Mar 10, 2017 Page 119 of 158
120 Campus Assessment Report PreK Building Condition Summary The Table below shows the RSLI and FCI for each major building system shown at the UNIFORMAT classification Level II. Note that Systems with lower FCIs require less investment than systems with higher FCIs. UNIFORMAT Classification RSLI % FCI % Current Repair Cost A10 - Foundations % 0.00 % $0.00 B10 - Superstructure % 0.00 % $0.00 B20 - Exterior Enclosure % 0.00 % $0.00 B30 - Roofing % 0.00 % $0.00 C10 - Interior Construction % 0.00 % $0.00 C30 - Interior Finishes % % $3, D20 - Plumbing % 0.00 % $0.00 D30 - HVAC % 0.00 % $0.00 D50 - Electrical % 0.00 % $0.00 E10 - Equipment % 0.00 % $0.00 E20 - Furnishings % 0.00 % $0.00 Totals: % 1.79 % $3, Mar 10, 2017 Page 120 of 158

.")
.")
121 Campus Assessment Report PreK Building Photo Album The photo album consists of the various cardinal directions of the building.. 1). East Elevation - Feb 10, ). North Elevation - Feb 10, ). West Elevation - Feb 10, ). South Elevation - Feb 10, 2017 Mar 10, 2017 Page 121 of 158
122 Campus Assessment Report PreK Building Condition Detail This section of the report contains results of the Facility Condition Assessment. The building is separated into system components based on UNIFORMAT II. The columns in the System Listing table represent the following: 1. System Code: A code that identifies the system. 2. System Description: A brief description of a system present in the building. 3. Unit Price $: The unit price of the system. 4. UoM: The unit of measure of the system. 5. Qty: The quantity for the system 6. Life: Building Owners and Managers Association (BOMA) recommended system design life. 7. Year Installed: The date of system installation. 8. Calc Next Renewal Year: The date of system expiration based on the life, NR stands for non renewable. 9. Next Renewal Year: The suggested system expiration date by the assessor based on visual inspection. 10. RSLI: The Remaining Service Life Index of the system. 11. FCI: The Facility Condition Index of the system. 12. RSL: Remaining Service Life in years. 13. ecr: ecomet Condition Rating (not used in this assessment). 14. Deficiency $: The financial investment to repair/replace system to address deficiency. 15. Replacement Value $: The replacement cost of the system. Mar 10, 2017 Page 122 of 158
123 Campus Assessment Report PreK Building System Listing The System Listing table below lists each of the systems organized by their UNIFORMAT II classification. The assessment team was tasked with recording the most recent replacement year of each system, determining the remaining service life based on the theoretical life, and evaluating the condition to confirm the forecast next replacement year. The system listing is the basis for all data contained in the Building Assessment Report. System Code System Description Unit Price $ UoM Qty Life Year Installed Calc Next Renewal Year Next Renewal Year RSLI% FCI% RSL ecr Deficiency $ Replacement Value $ A1010 Standard Foundations $4.70 S.F. 1, % 0.00 % 90 $4,935 A1030 Slab on Grade $8.26 S.F. 1, % 0.00 % 90 $8,673 B1020 Roof Construction $15.44 S.F. 1, % 0.00 % 90 $16,212 B2010 Exterior Walls $9.24 S.F. 1, % 0.00 % 90 $9,702 B2020 Exterior Windows $9.20 S.F. 1, % 0.00 % 20 $9,660 B2030 Exterior Doors $1.02 S.F. 1, % 0.00 % 20 $1,071 B Asphalt Shingles $4.32 S.F. 1, % 0.00 % 10 $4,536 C1010 Partitions $10.59 S.F. 1, % 0.00 % 65 $11,120 C1020 Interior Doors $2.48 S.F. 1, % 0.00 % 20 $2,604 C1030 Fittings $9.54 S.F. 1, % 0.00 % 10 $10,017 C3010 Wall Finishes $2.73 S.F. 1, % % 0 $3, $2,867 C3020 Floor Finishes $11.15 S.F. 1, % 0.00 % 10 $11,708 C3030 Ceiling Finishes $10.74 S.F. 1, % 0.00 % 15 $11,277 D2010 Plumbing Fixtures $11.26 S.F. 1, % 0.00 % 20 $11,823 D2020 Domestic Water Distribution $0.96 S.F. 1, % 0.00 % 20 $1,008 D2030 Sanitary Waste $1.52 S.F. 1, % 0.00 % 20 $1,596 D3040 Distribution Systems $6.02 S.F. 1, % 0.00 % 20 $6,321 D3050 Terminal & Package Units $13.09 S.F. 1, % 0.00 % 5 $13,745 D3060 Controls & Instrumentation $1.91 S.F. 1, % 0.00 % 10 $2,006 D5010 Electrical Service/Distribution $1.65 S.F. 1, % 0.00 % 30 $1,733 D5020 Branch Wiring $4.99 S.F. 1, % 0.00 % 20 $5,240 D5020 Lighting $11.64 S.F. 1, % 0.00 % 20 $12,222 D Fire Alarm Systems $3.31 S.F. 1, % 0.00 % 5 $3,476 D Data Communication $4.30 S.F. 1, % 0.00 % 5 $4,515 D5090 Other Electrical Systems $0.33 S.F. 1, % 0.00 % 10 $347 E1020 Institutional Equipment $1.78 S.F. 1, % 0.00 % 10 $1,869 E2010 Fixed Furnishings $5.72 S.F. 1, % 0.00 % 10 $6,006 Total % 1.79 % $3, $176,289 Mar 10, 2017 Page 123 of 158


124 Campus Assessment Report PreK Building System Notes The facility description in the executive summary contains an overview of each system. The photos of each system and any associated notes listed below provide additional information on select systems found within the facility: B Exterior Walls B Exterior Windows B Exterior Doors Mar 10, 2017 Page 124 of 158


125 Campus Assessment Report PreK Building B Asphalt Shingles C Partitions C Interior Doors Mar 10, 2017 Page 125 of 158


126 Campus Assessment Report PreK Building C Fittings C Wall Finishes C Floor Finishes Mar 10, 2017 Page 126 of 158


127 Campus Assessment Report PreK Building C Ceiling Finishes D Plumbing Fixtures D Domestic Water Distribution Mar 10, 2017 Page 127 of 158


128 Campus Assessment Report PreK Building D Sanitary Waste D Distribution Systems D Terminal & Package Units Mar 10, 2017 Page 128 of 158


129 Campus Assessment Report PreK Building D Controls & Instrumentation D Electrical Service/Distribution D Branch Wiring Mar 10, 2017 Page 129 of 158


130 Campus Assessment Report PreK Building D Lighting D Fire Alarm Systems D Data Communication Mar 10, 2017 Page 130 of 158


131 Campus Assessment Report PreK Building D Other Electrical Systems E Institutional Equipment E Fixed Furnishings Mar 10, 2017 Page 131 of 158
132 Campus Assessment Report PreK Building Renewal Schedule ecomet forecasts future Capital Renewal projects for expiring systems based on the Calculated Next Renewal year found in the system listing. There is a 3% yearly inflation factor applied to the system costs expiring in the future. The table below reflects Capital Renewal projects over the next 10 years. Blank cells (or $0) indicate no systems are scheduled for renewal in that year. Inflation Rate: 3% System Current Deficiencies Total Total: $3,153 $0 $0 $0 $0 $27,717 $0 $0 $0 $0 $60,373 $91,243 * A - Substructure $0 $0 $0 $0 $0 $0 $0 $0 $0 $0 $0 $0 * A10 - Foundations $0 $0 $0 $0 $0 $0 $0 $0 $0 $0 $0 $0 * A Standard Foundations $0 $0 $0 $0 $0 $0 $0 $0 $0 $0 $0 $0 * A Slab on Grade $0 $0 $0 $0 $0 $0 $0 $0 $0 $0 $0 $0 B - Shell $0 $0 $0 $0 $0 $0 $0 $0 $0 $0 $0 $0 B10 - Superstructure $0 $0 $0 $0 $0 $0 $0 $0 $0 $0 $0 $0 * B Roof Construction $0 $0 $0 $0 $0 $0 $0 $0 $0 $0 $0 $0 B20 - Exterior Enclosure $0 $0 $0 $0 $0 $0 $0 $0 $0 $0 $0 $0 * B Exterior Walls $0 $0 $0 $0 $0 $0 $0 $0 $0 $0 $0 $0 B Exterior Windows $0 $0 $0 $0 $0 $0 $0 $0 $0 $0 $0 $0 B Exterior Doors $0 $0 $0 $0 $0 $0 $0 $0 $0 $0 $0 $0 B30 - Roofing $0 $0 $0 $0 $0 $0 $0 $0 $0 $0 $0 $0 B Roof Coverings $0 $0 $0 $0 $0 $0 $0 $0 $0 $0 $0 $0 B Asphalt Shingles $0 $0 $0 $0 $0 $0 $0 $0 $0 $0 $8,901 $8,901 C - Interiors $0 $0 $0 $0 $0 $0 $0 $0 $0 $0 $0 $0 C10 - Interior Construction $0 $0 $0 $0 $0 $0 $0 $0 $0 $0 $0 $0 * C Partitions $0 $0 $0 $0 $0 $0 $0 $0 $0 $0 $0 $0 C Interior Doors $0 $0 $0 $0 $0 $0 $0 $0 $0 $0 $0 $0 C Fittings $0 $0 $0 $0 $0 $0 $0 $0 $0 $0 $14,809 $14,809 C30 - Interior Finishes $0 $0 $0 $0 $0 $0 $0 $0 $0 $0 $0 $0 C Wall Finishes $3,153 $0 $0 $0 $0 $0 $0 $0 $0 $0 $4,237 $7,390 C Floor Finishes $0 $0 $0 $0 $0 $0 $0 $0 $0 $0 $17,307 $17,307 C Ceiling Finishes $0 $0 $0 $0 $0 $0 $0 $0 $0 $0 $0 $0 D - Services $0 $0 $0 $0 $0 $0 $0 $0 $0 $0 $0 $0 D20 - Plumbing $0 $0 $0 $0 $0 $0 $0 $0 $0 $0 $0 $0 Mar 10, 2017 Page 132 of 158
133 Campus Assessment Report PreK Building D Plumbing Fixtures $0 $0 $0 $0 $0 $0 $0 $0 $0 $0 $0 $0 D Domestic Water Distribution $0 $0 $0 $0 $0 $0 $0 $0 $0 $0 $0 $0 D Sanitary Waste $0 $0 $0 $0 $0 $0 $0 $0 $0 $0 $0 $0 D30 - HVAC $0 $0 $0 $0 $0 $0 $0 $0 $0 $0 $0 $0 D Distribution Systems $0 $0 $0 $0 $0 $0 $0 $0 $0 $0 $0 $0 D Terminal & Package Units $0 $0 $0 $0 $0 $17,527 $0 $0 $0 $0 $0 $17,527 D Controls & Instrumentation $0 $0 $0 $0 $0 $0 $0 $0 $0 $0 $2,965 $2,965 D50 - Electrical $0 $0 $0 $0 $0 $0 $0 $0 $0 $0 $0 $0 D Electrical Service/Distribution $0 $0 $0 $0 $0 $0 $0 $0 $0 $0 $0 $0 D Branch Wiring $0 $0 $0 $0 $0 $0 $0 $0 $0 $0 $0 $0 D Lighting $0 $0 $0 $0 $0 $0 $0 $0 $0 $0 $0 $0 D Communications and Security $0 $0 $0 $0 $0 $0 $0 $0 $0 $0 $0 $0 D Fire Alarm Systems $0 $0 $0 $0 $0 $4,432 $0 $0 $0 $0 $0 $4,432 D Data Communication $0 $0 $0 $0 $0 $5,758 $0 $0 $0 $0 $0 $5,758 D Other Electrical Systems $0 $0 $0 $0 $0 $0 $0 $0 $0 $0 $512 $512 E - Equipment & Furnishings $0 $0 $0 $0 $0 $0 $0 $0 $0 $0 $0 $0 E10 - Equipment $0 $0 $0 $0 $0 $0 $0 $0 $0 $0 $0 $0 E Institutional Equipment $0 $0 $0 $0 $0 $0 $0 $0 $0 $0 $2,763 $2,763 E20 - Furnishings $0 $0 $0 $0 $0 $0 $0 $0 $0 $0 $0 $0 E Fixed Furnishings $0 $0 $0 $0 $0 $0 $0 $0 $0 $0 $8,879 $8,879 * Indicates non-renewable system Mar 10, 2017 Page 133 of 158
134 Campus Assessment Report PreK Building Forecasted Capital Renewal Requirement The following chart shows the current building deficiencies and forecasting capital renewal or sustainment requirements over the next ten years. $70,000 $60,000 $60,373 $50,000 $40,000 $30,000 $27,717 $20,000 $10,000 $3,153 $0 Current Deficiencies Mar 10, 2017 Page 134 of 158
135 Campus Assessment Report PreK Building Deficiency Summary by System Current deficiencies included assemblies that have reached or exceeded their design life or components of the assemblies that are in need of repair. Assemblies that have reached their design life are identified as current deficiencies and assigned the distress 'Beyond Useful Life'. The following chart lists all current deficiencies associated with this facility. C3010 Wall Finishes $3, Budget Estimate Total: $3, Mar 10, 2017 Page 135 of 158
136 Campus Assessment Report PreK Building Deficiency Summary by Priority The following chart shows the total repair costs broken down by priority. Assessors assigned deficiencies within ecomet to one of the following priority categories: 1 - Currently Critical (Immediate) 2 - Potentially Critical (Year 1) 3 - Necessary/Not Yet Critical (Years 2-5) - $3, Recommended (Years 6-10) 5 - Codes or Standards Compliance Budget Estimate Total: $3, Mar 10, 2017 Page 136 of 158
137 Campus Assessment Report PreK Building Deficiency By Priority Investment Table The table below shows the current investment cost grouped by deficiency priority and building system. 1 - Currently Critical (Immediate) 2 - Potentially Critical (Year 1) 3 - Necessary/Not Yet Critical (Years 2-5) 4 - Recommended (Years 6-10) 5 - Codes or Standards Compliance System Code System Description Total C3010 Wall Finishes $0.00 $0.00 $3, $0.00 $0.00 $3, Total: $0.00 $0.00 $3, $0.00 $0.00 $3, Mar 10, 2017 Page 137 of 158
138 Campus Assessment Report PreK Building Deficiency Summary by Category The following chart shows the total repair costs broken down by deficiency categories. Assessors assigned deficiencies to one of the following categories: Deferred Maintenance - $3, Budget Estimate Total: $3, Mar 10, 2017 Page 138 of 158
139 Campus Assessment Report PreK Building Deficiency Details by Priority The deficiency detail notes listed below provide additional information on identified deficiencies found within the facility. Priority 3 - Necessary/Not Yet Critical (Years 2-5): C Wall Finishes Location: Distress: Category: Priority: Correction: Qty: Unit of Measure: Estimate: Assessor Name: Date Created: Throughout the Building Beyond Service Life Deferred Maintenance 3 - Necessary/Not Yet Critical (Years 2-5) Renew System 1, S.F. $3, Terence Davis 01/19/2017 Notes: The wall finishes are aged, scuffed, fading, stained and should be replaced. Mar 10, 2017 Page 139 of 158
140 Campus Assessment Report - Site Executive Summary Building condition is evaluated based on the functional systems and elements of a building and organized according to the UNIFORMAT II Elemental Classification. The grouping of these systems and elements and applying a current replacement value to them develops a representative building cost model. Cost Models are developed for similar building types and functions. Systems and their elements are evaluated based on their current replacement values, life cycles, installation dates and next renewal dates. Systems and their elements that are within their useful lives are further evaluated to identify current deficient conditions that may have a significant impact on a system's or element's remaining service life, and to determine if they are beyond their predicted expected life. The system's or element's current replacement value is based on RS Means Commercial Cost Data. Following are the cost model's system details for this facility. The Replacement Value is the amount needed to replace the property of the same present scope. The Repair Cost (the sum of the cost to repair/replace the Deficiencies) represents the budgeted contractor-installed costs plus owner's soft costs for the repair, replacement or renewal for a component or system level deficiency. It excludes contributing costs for other components or systems that might also be associated with the corrective actions due to packaging of the work. Facility Condition Index ( FCI) is an industry-standard measurement of facility condition calculated as the ratio of the costs to correct a facility's deficiencies (Condition Needs) to the facility's Current Replacement Value. It ranges from 0% (new) to 100% (very poor - beyond service life). The Remaining Service Life Index (RSLI) is calculated as the sum of a renewable system's Remaining Service Life (RSL) divided by the sum of a system's Replacement Value (both values exclude soft-cost to simplify calculation updates) expressed as a percentage ranging from 100% (new) to 0% (expired). The relationship between the key metrics FCI and RSLI is an important indicator, at either the facility, building, system, or component levels, of the condition trend and the imminent need for capital renewal. These indices exist in an inverse relationship wherein the FCI increases when systems reach their expected life-cycle age, whereas the RSLI decreases annually indicating the relative time remaining before reaching the life-cycle expiration age. For example, a facility or a system with a high RSLI and a low FCI indicates it is in the early portion of its useful life. However, a low RSLI indicates that expiration dates are approaching at which point the FCI would increase. The term FCA Score is the inverse of Total FCI and calculated as 100-Total FCI (without the %) where 100 is best and 0 is worst condition. Function: Gross Area (SF): Year Built: Last Renovation: Replacement Value: Repair Cost: Total FCI: Total RSLI: ES -Elementary School 78, $2,314,081 $530, % % FCA Score: Description: The narrative for this site is included in the Executive Summary Description at the front of this report. Attributes: This asset has no attributes. Mar 10, 2017 Page 140 of 158
141 Campus Assessment Report - Site Dashboard Summary Function: Year Built: Repair Cost: FCI: ES -Elementary School 1970 $530, % Gross Area: Last Renovation: Replacement Value: RSLI%: 78, $2,314, % Deficiency By Category Deficiency By Priority Deferred Maintenance - $530, Currently Critical (Immediate) 2 - Potentially Critical (Year 1) 3 - Necessary/Not Yet Critical (Years 2-5) - $530, Recommended (Years 6-10) 5 - Codes or Standards Compliance $400,000 $300,000 $347K Deficiency By System $200,000 $100,000 $0 Site Improvements $55K Site Electrical Utilities $800,000 $600,000 $400, Year Investment Forecast $712K $365K $200,000 $0 $0 $0 $48K $0 $0 $0 $0 $ Mar 10, 2017 Page 141 of 158
142 Campus Assessment Report - Site Condition Summary The Table below shows the RSLI and FCI for each major building system shown at the UNIFORMAT classification Level II. Note that Systems with lower FCIs require less investment than systems with higher FCIs. UNIFORMAT Classification RSLI % FCI % Current Repair Cost G20 - Site Improvements % % $457, G30 - Site Mechanical Utilities % 0.00 % $0.00 G40 - Site Electrical Utilities % % $72, Totals: % % $530, Mar 10, 2017 Page 142 of 158
143 Campus Assessment Report - Site Photo Album The photo album consists of the various cardinal directions of the building.. 1). Aerial Image of Pinebrook Elementary School - Feb 24, 2017 Mar 10, 2017 Page 143 of 158
144 Campus Assessment Report - Site Condition Detail This section of the report contains results of the Facility Condition Assessment. The building is separated into system components based on UNIFORMAT II. The columns in the System Listing table represent the following: 1. System Code: A code that identifies the system. 2. System Description: A brief description of a system present in the building. 3. Unit Price $: The unit price of the system. 4. UoM: The unit of measure of the system. 5. Qty: The quantity for the system 6. Life: Building Owners and Managers Association (BOMA) recommended system design life. 7. Year Installed: The date of system installation. 8. Calc Next Renewal Year: The date of system expiration based on the life, NR stands for non renewable. 9. Next Renewal Year: The suggested system expiration date by the assessor based on visual inspection. 10. RSLI: The Remaining Service Life Index of the system. 11. FCI: The Facility Condition Index of the system. 12. RSL: Remaining Service Life in years. 13. ecr: ecomet Condition Rating (not used in this assessment). 14. Deficiency $: The financial investment to repair/replace system to address deficiency. 15. Replacement Value $: The replacement cost of the system. Mar 10, 2017 Page 144 of 158
145 Campus Assessment Report - Site System Listing The System Listing table below lists each of the systems organized by their UNIFORMAT II classification. The assessment team was tasked with recording the most recent replacement year of each system, determining the remaining service life based on the theoretical life, and evaluating the condition to confirm the forecast next replacement year. The system listing is the basis for all data contained in the Building Assessment Report. System Code System Description Unit Price $ UoM Qty Life Year Installed Calc Next Renewal Year Next Renewal Year RSLI% FCI% RSL ecr Deficiency $ Replacement Value $ G2010 Roadways $3.81 S.F. 78, % 0.00 % 5 $299,580 G2020 Parking Lots $1.33 S.F. 78, % 0.00 % 5 $104,578 G2030 Pedestrian Paving $1.91 S.F. 78, % 0.00 % 10 $150,183 G Fence & Guardrails $1.23 S.F. 78, % 0.00 % 10 $96,715 G Canopies $0.44 S.F. 78, % 0.00 % 5 $34,597 G Covered Walkways $1.52 S.F. 78, % 0.00 % 5 $119,518 G Hard Surface Play Area $0.75 S.F. 78, % % 0 $64, $58,973 G Playing Field $4.54 S.F. 78, % % 0 $392, $356,980 G2050 Landscaping $1.87 S.F. 78, % 0.00 % -32 $147,038 G3010 Water Supply $2.34 S.F. 78, % 0.00 % 30 $183,994 G3020 Sanitary Sewer $1.45 S.F. 78, % 0.00 % 30 $114,014 G3030 Storm Sewer $4.54 S.F. 78, % 0.00 % 30 $356,980 G4010 Electrical Distribution $2.35 S.F. 78, % 0.00 % 30 $184,781 G4030 Site Communications & Security $0.84 S.F. 78, % % -5 $72, $66,049 G4090 Other Site Electrical Utilities $0.51 S.F. 78, % 0.00 % 3 $40,101 Total % % $530, $2,314,081 Mar 10, 2017 Page 145 of 158


146 Campus Assessment Report - Site System Notes The facility description in the executive summary contains an overview of each system. The photos of each system and any associated notes listed below provide additional information on select systems found within the facility: G Roadways G Parking Lots G Pedestrian Paving Mar 10, 2017 Page 146 of 158


147 Campus Assessment Report - Site G Fence & Guardrails G Canopies G Covered Walkways Mar 10, 2017 Page 147 of 158


148 Campus Assessment Report - Site G Hard Surface Play Area G Playing Field G Landscaping Mar 10, 2017 Page 148 of 158
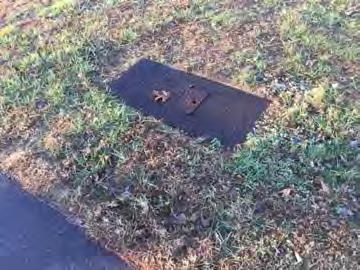
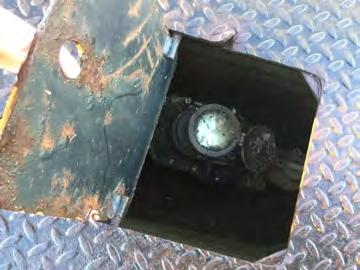
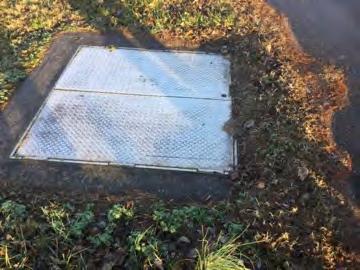
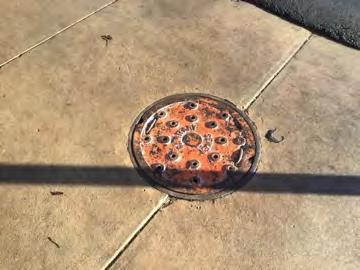
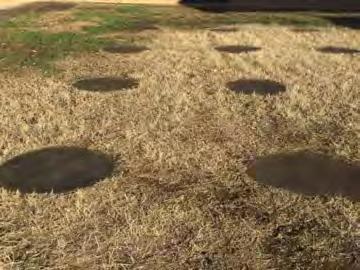
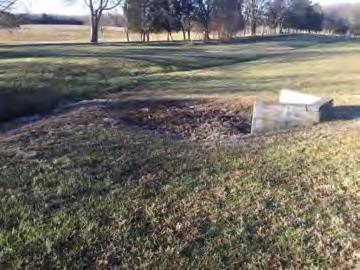
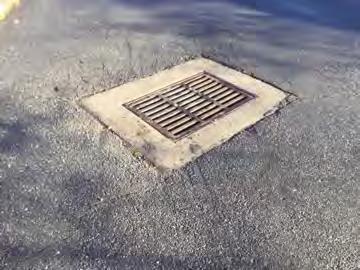
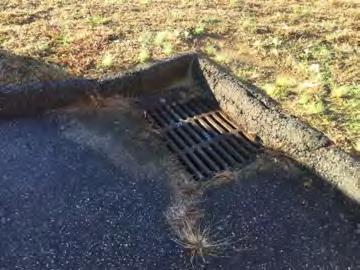
149 Campus Assessment Report - Site G Water Supply G Sanitary Sewer G Storm Sewer Mar 10, 2017 Page 149 of 158


150 Campus Assessment Report - Site G Electrical Distribution G Site Communications & Security G Other Site Electrical Utilities Mar 10, 2017 Page 150 of 158
Anson County Early College High
 NC School District/040 Anson County/High School Anson County Early College High Final Campus Assessment Report March 11, 2017 PARSONS Campus Assessment Report Table of Contents Campus Executive Summary
NC School District/430 Harnett County/Middle School Highland Middle Final Campus Assessment Report March 11, 2017
 NC School District/430 Harnett County/Middle School Highland Middle Final Campus Assessment Report March 11, 2017 PARSONS Campus Assessment Report Table of Contents Campus Executive Summary 5 Campus Dashboard
Laurel Hill Elementary
 NC School District/830 Scotland County/Elementary School Laurel Hill Elementary Final Campus Assessment Report March 11, 2017 PARSONS Campus Assessment Report Table of Contents Campus Executive Summary
Anderson Creek Primary
 NC School District/430 Harnett County/Elementary School Anderson Creek Primary Final Campus Assessment Report March 11, 2017 PARSONS Campus Assessment Report Table of Contents Campus Executive Summary
Davie County Early College High
 NC School District/300 Davie County/High School Davie County Early College High Final Campus Assessment Report March 10, 2017 PARSONS Campus Assessment Report Table of Contents Campus Executive Summary
Harnett Central High
 NC School District/430 Harnett County/High School Harnett Central High Final Campus Assessment Report March 11, 2017 PARSONS Campus Assessment Report Table of Contents Campus Executive Summary 6 Campus
Mountain Heritage High
 NC School District/995 Yancey County/High School Mountain Heritage High Final Campus Assessment Report March 12, 2017 PARSONS Campus Assessment Report Table of Contents Campus Executive Summary 7 Campus
Harnett Central Middle
 NC School District/430 Harnett County/Middle School Harnett Central Middle Final Campus Assessment Report March 11, 2017 PARSONS Campus Assessment Report Table of Contents Campus Executive Summary 5 Campus
NC School District/520 Jones County/Elementary School Trenton Elementary Final Campus Assessment Report March 11, 2017
 NC School District/520 Jones County/Elementary School Trenton Elementary Final Campus Assessment Report March 11, 2017 PARSONS Campus Assessment Report Table of Contents Campus Executive Summary 4 Campus
Central Davie Academy
 NC School District/300 Davie County/High School Central Davie Academy Final Campus Assessment Report March 10, 2017 PARSONS Campus Assessment Report Table of Contents Campus Executive Summary 4 Campus
Lafayette Elementary
 NC School District/430 Harnett County/Elementary School Lafayette Elementary Final Campus Assessment Report March 11, 2017 PARSONS Campus Assessment Report Table of Contents Campus Executive Summary 5
DeKalb County School District/Elementary Schools Dunwoody Elementary Final School Assessment Report May 19, 2016
 DeKalb County School District/Elementary Schools Dunwoody Elementary Final School Assessment Report May 19, 2016 PARSONS School Assessment Report Table of Contents School Executive Summary 4 School Condition
Pleasantdale Elementary
 DeKalb County School District/Elementary Schools Pleasantdale Elementary Final School Assessment Report May 20, 2016 PARSONS School Assessment Report Table of Contents School Executive Summary 5 School
Ronald E. McNair Discovery Learning Academy
 DeKalb County School District/Elementary Schools Ronald E. McNair Discovery Learning Academy Final School Assessment Report May 20, 2016 PARSONS School Assessment Report Table of Contents School Executive
NC School District/430 Harnett County/Elementary School Gentry Primary Final Campus Assessment Report March 11, 2017
 NC School District/430 Harnett County/Elementary School Gentry Primary Final Campus Assessment Report March 11, 2017 PARSONS Campus Assessment Report Table of Contents Campus Executive Summary 6 Campus
Stone Mountain Middle
 DeKalb County School District/Middle Schools Stone Mountain Middle Final School Assessment Report May 20, 2016 PARSONS School Assessment Report Table of Contents School Executive Summary 4 School Condition
William Bradley Bryant Center
 DeKalb County School District/Education Other William Bradley Bryant Center Final School Assessment Report May 19, 2016 PARSONS School Assessment Report Table of Contents School Executive Summary 4 School
Robert Shaw Theme Elementary
 DeKalb County School District/Elementary Schools Robert Shaw Theme Elementary Final School Assessment Report May 20, 2016 PARSONS School Assessment Report Table of Contents School Executive Summary 4 School
DeKalb Elementary School of the Arts at Terry Mills
 DeKalb County School District/Elementary Schools DeKalb Elementary School of the Arts at Terry Mills Final School Assessment Report May 19, 2016 PARSONS School Assessment Report Table of Contents School
William Ellis Middle
 NC School District/300 Davie County/Middle School William Ellis Middle Final Campus Assessment Report March 10, 2017 PARSONS Campus Assessment Report Table of Contents Campus Executive Summary 5 Campus
Bob Mathis Elementary
 DeKalb County School District/Elementary Schools Bob Mathis Elementary Final School Assessment Report May 19, 2016 PARSONS School Assessment Report Table of Contents School Executive Summary 4 School Condition
DeKalb County School District/High Schools Druid Hills High Final School Assessment Report May 19, 2016
 DeKalb County School District/High Schools Druid Hills High Final School Assessment Report May 19, 2016 PARSONS School Assessment Report Table of Contents School Executive Summary 5 School Condition Summary
Mocksville Elementary
 NC School District/300 Davie County/Elementary School Mocksville Elementary Final Campus Assessment Report March 10, 2017 PARSONS Campus Assessment Report Table of Contents Campus Executive Summary 5 Campus
Sagamore Hills Elementary
 DeKalb County School District/Elementary Schools Sagamore Hills Elementary Final School Assessment Report May 20, 2016 PARSONS School Assessment Report Table of Contents School Executive Summary 4 School
DeKalb County School District/Middle Schools Chapel Hill Middle Final School Assessment Report May 20, 2016
 DeKalb County School District/Middle Schools Chapel Hill Middle Final School Assessment Report May 20, 2016 PARSONS School Assessment Report Table of Contents School Executive Summary 3 School Condition
NC School District/430 Harnett County/Elementary School Coats Elementary Final Campus Assessment Report March 11, 2017
 NC School District/430 Harnett County/Elementary School Coats Elementary Final Campus Assessment Report March 11, 2017 PARSONS Campus Assessment Report Table of Contents Campus Executive Summary 5 Campus
DeKalb County School District/Middle Schools Peachtree Middle Final School Assessment Report May 20, 2016
 DeKalb County School District/Middle Schools Peachtree Middle Final School Assessment Report May 20, 2016 PARSONS School Assessment Report Table of Contents School Executive Summary 3 School Condition
Martin Luther King Jr. High
 DeKalb County School District/High Schools Martin Luther King Jr. High Final School Assessment Report May 19, 2016 PARSONS School Assessment Report Table of Contents School Executive Summary 4 School Condition
Lilesville Elementary
 NC School District/040 Anson County/Elementary School Lilesville Elementary Final Campus Assessment Report March 11, 2017 PARSONS Campus Assessment Report Table of Contents Campus Executive Summary 4 Campus
BUILDING CONDITION ASSESSMENT. A Comprehensive Approach in Energy and Facility Management
 BUILDING CONDITION ASSESSMENT A Comprehensive Approach in Energy and Facility Management Presentation Outline Page Nadine International Company Profile.. 3 FCI -Industry Preferred Formula.... 4 FCI -Other
Backlog Reduction Plan
 2003-2013 Executive Summary proposes to achieve reductions in our facilities maintenance backlog by documenting and completing backlog projects on a priority basis and by minimizing or eliminating future
Listing of Events Fort McMurray Roman Catholic Seperate School District Fr. M. Beauregard School
 Fort McMurray Roman Catholic Seperate School District Fr. M. Beauregard School Building Events 2004 2005 2006 2007 2008 Total Code Repair Add ventilation to storage room $ 1,000.00 $ - $ - $ - $ - $ 1,000.00
Subject: Capital Reserve Expenditure Guidelines. *incl. former OCHAP/CSHP Peel Access to Housing (PATH)
") HIP Housing In Peel Subject: Capital Reserve Expenditure Guidelines Date: August 1, 2012 Applicable To The information contained in this document applies to the following: Municipal & Private Non- Federal
HIP Housing In Peel Subject: Capital Reserve Expenditure Guidelines Date: August 1, 2012 Applicable To The information contained in this document applies to the following: Municipal & Private Non- Federal
Howsyth Court Condominium Corporation No. CCN Avenue SW Calgary, Alberta
 Entuitive Corporation Calgary + Toronto Howsyth Court Condominium Corporation No. CCN9011190 305 25 Avenue SW Calgary, Alberta Submitted By: Entuitive Corporation 209 8 th Avenue SW, Suite 300 Calgary,
ORIGINAL YEAR OF CONSTRUCTION NUMBER OF BUILDING STORIES 2/15/2013 BUILDING SURVEY DATE
 0807 3502 SOUTH FIRST STREET CHAMPAIGN, ILLINOIS SYSTEM CONDITION INDEX.771 PRIMARY BUILDING USE BUILDING SURVEY TEAM BUILDING SYSTEM REPLACEMENT COST $ 347,400 LABORATORY BUILDING GROSS SQUARE FEET 16,986
Social Housing Administration Directive No
 Regional Municipality of Halton Social Housing Administration Directive No. 06-05 Date: August 30, 06 To: Federally-Funded Social Housing Providers subject to Operating Agreements under Section 95 of the
Integrating Green Building Measures into Capital Planning for HUD Assisted and Public Housing Programs
 Building Bridges to Net Zero Integrating Green Building Measures into Capital Planning for HUD Assisted and Public Housing Programs Evolution of HUD's Green Capital Needs Assessment, and the new CNA etool
CAPITAL RESERVE STUDY
 CAPITAL RESERVE STUDY FOR THE HIALEAH CONDOMINIUM WILDWOOD CREST, NEW JERSEY Project Number: 12-1066 W:\2012\12-1066\CORR\12-1066v1.doc Date: March 29, 2013 Table of Contents Section Page Executive Summary...
Educational & Performing Arts Center: Downriver Campus
 Educational & Performing Arts Center: Total Estimated Project Construction Cost: $ 18.04 million Groundbreaking: September 2006 Percentage Completed: 100 percent Anticipated Completion Date: Completed
PROFESSIONAL RESERVE STUDY
 PROFESSIONAL RESERVE STUDY Seavue Condominiums 130-5 th Avenue South, Edmonds, WA 98020 For: Seavue Homeowners Association c/o Jay Grant Board President (202) 351-9399 Prepared By: Jeff Samdal, PE, RS,
ORIGINAL YEAR OF CONSTRUCTION NUMBER OF BUILDING STORIES 4/19/2013 BUILDING SURVEY DATE
 0134 614 EAST PENNSYLVANIA AVENUE CHAMPAIGN, ILLINOIS 61820 SYSTEM CONDITION INDEX.528 PRIMARY BUILDING USE BUILDING SURVEY TEAM BUILDING SYSTEM REPLACEMENT COST $ 495,100 LABORATORY BUILDING GROSS SQUARE
Reserve Fund Study My Condominium Plan
 Reserve Fund Study My Condominium Plan 12 3456 Number of Units 36 Number of Buildings 1 Building Construction 21 Contact Ima Happy Position(s) President Contact Phone 43.555.4321 Report Date August 8,
City School District of Albany Five Year Facilities Plan 3/14/2019
 Bold indicates change from 3/7/19 BOE meeting Available Local Share $ 3,300,000 1 SPA Air condition gymnasium $ 267,000 1 $ 41,385 $ 41,385 $ 267,000 2 DCS Air condition gymnasium $ 221,000 1 $ 34,255
Update With Site Visit
 Update With Site Visit Le Chateau Bellevue, WA 10/28/2011 Report #1002 Phone: 253-241-8151 Fax: 360-872-8073 E-mail: jeremy@reservesolutions.net www.reservesolutions.net Le Chateau Client Info: REPORT
Agenda Item # 5b Page 1 of 43
 Page 1 of 43 Page 2 of 43 Page 3 of 43 Page 4 of 43 Page 5 of 43 Page 6 of 43 Page 7 of 43 Page 8 of 43 Page 9 of 43 Page 10 of 43 Page 11 of 43 Page 12 of 43 Page 13 of 43 Page 14 of 43 Page 15 of 43
 RESERVE STUDY Component Analysis and Reserve Fund Plan Annual Review Study 2016/17 For Middlefield Meadows HOA Mountain View, CA Prepared By RESERVE ANALYSIS CONSULTING, LLC 1750 Bridgeway, Suite B106
Urban Heights Condominium
 Condominium Capital 2011 2010, AssociationAnalysis, LLC Condominium Prepared For: Table of Contents Condominium Association, Inc. 1642 Maxwell Road Atlanta, GA 30012 October 19, 2010 INTRODUCTION INTRODUCTION
Release Date: January 3, 2019 Due Date: January 17, 2019
 SAN JUAN SCHOOL DISTRICT REQUEST FOR BID CONSTRUCTION OF NEW BLUFF ELEMENTARY SCHOOL AND NEW MONTEZUMA CREEK ELEMENTARY GYM Release Date: January 3, 2019 Due Date: January 17, 2019 I. GENERAL A. Intent
Town of Middleton Salt Storage Building Pioneer Road Pioneer Lands Town of Middleton Dane County, WI 53562
 Town of Middleton Salt Storage Building Pioneer Road Pioneer Lands Town of Middleton Dane County, WI 53562 1 T100 PROJECT LOCATION MAP Scale: NTS N Revisions: No. Date: Description: Scale As Indicated
WASHINGTON BROWN DEPRECIATION PTY LTD
 Wednesday, 4 July 2007 The Owners - Strata Plan Number C/- Strata Management Company Address PROPERTY ADDRESS SINKING FUND FORECAST REPORT For the attention of: Strata Manager Dear Strata Manager, In accordance
Reserve Study Transmittal Letter
 Reserve Study Transmittal Letter Date: January 18, 2012 To: Michael Lee, Collins Management Co. From: Richard Avelar & Associates (RA&A) Re: Bridgewater Condominium Association Attached, please find the
REPLACEMENT RESERVE GUIDE
 CANADA MORTGAGE AND HOUSING CORPORATION REPLACEMENT RESERVE GUIDE What is the Replacement Reserve? The replacement reserve is a fund kept by each housing sponsor under the terms of its operating agreement
ORIGINAL YEAR OF CONSTRUCTION NUMBER OF BUILDING STORIES 6/18/2013 BUILDING SURVEY DATE
 0238 URBANA, ILLINOIS 61801 SYSTEM CONDITION INDEX.183 PRIMARY BUILDING USE BUILDING SURVEY TEAM BUILDING SYSTEM REPLACEMENT COST $ 1,237,600 OFFICE BUILDING GROSS SQUARE FEET 18,054 NUMBER OF BUILDING
Washingtonville Central School District Building Condition Survey Five Year Plan
 Building Condition Survey Five Year Plan Project Cost Summary Building 2011 2012 2013 2014 2015 Totals 0001 Washingtonville Jr High School $38,759 $325,990 $1,882,653 $1,417,341 $1,025,559 $4,690,302 0002
Our Focus: Your Future
 Town of Fort Erie Infrastructure Services Our Focus: Your Future Prepared for Council-in-Committee Report No. IS-53-07 Agenda Date November 19, 2007 File No. 220102 Subject 5 YEAR FACILITY CONDITION STATUS
ORIGINAL YEAR OF CONSTRUCTION NUMBER OF BUILDING STORIES 6/19/2013 BUILDING SURVEY DATE
 0154 52 EAST GREGORY DRIVE CHAMPAIGN, ILLINOIS 61820 SYSTEM CONDITION INDEX.646 PRIMARY BUILDING USE BUILDING SURVEY TEAM BUILDING SYSTEM REPLACEMENT COST $ 1,203,500 OFFICE BUILDING GROSS SQUARE FEET
PROFESSIONAL RESERVE STUDY
 PROFESSIONAL RESERVE STUDY Cambridge Court 9512-1 st Avenue Northeast, Seattle, WA 98115 For: Cambridge Court Homeowners Association c/o Tim Kammer, Property Manager Condo Managements, Inc. 1661 Harbor
VENDOR PREQUALIFICATION FORM
 VENDOR PREQUALIFICATION FORM Date: Please complete this form and return to Rockford Construction via e mail (prequal@rockfordconstruction.com) or fax (1 616 285 8423 must include the 1 616). Name of Company
ORIGINAL YEAR OF CONSTRUCTION NUMBER OF BUILDING STORIES 2/6/2013 BUILDING SURVEY DATE
 0133 608 EAST PENNSYLVANIA AVENUE CHAMPAIGN, ILLINOIS 61820 SYSTEM CONDITION INDEX.516 PRIMARY BUILDING USE BUILDING SURVEY TEAM BUILDING SYSTEM REPLACEMENT COST $ 646,900 PARKING STRUCTURE BUILDING GROSS
Reserve Study Project No Prepared for Nelson Farm Homeowner Association 1771 Norwood Lane Fort Collins, Colorado
 Reserve Study Project No. 09069 Prepared for 1771 Norwood Lane Fort Collins, Colorado Prepared by Bornengineering 1130 West 124 th Avenue, Suite 100 Westminster, Colorado 80234 January 28, 2010 1130 WEST
ORIGINAL YEAR OF CONSTRUCTION NUMBER OF BUILDING STORIES 6/5/2013 BUILDING SURVEY DATE
 0062 1105 WEST NEVADA STREET URBANA, ILLINOIS 61801 SYSTEM CONDITION INDEX.850 PRIMARY BUILDING USE BUILDING SURVEY TEAM BUILDING SYSTEM REPLACEMENT COST $ 2,286,000 LABORATORY BUILDING GROSS SQUARE FEET
Reference: The Bel-Harbour Condominium Association Reserve Study Update Kipcon Great Lakes Project No CRU
 August 18, 2016 Mr. Nicholas Burbulis 420 W. Belmont Ave. Chicago, IL 60657 Reference: The Kipcon Great Lakes Dear Mr. Burbulis: Attached, please find Kipcon Great Lakes, which has been prepared for the.
1. CALL TO ORDER AND RECOGNITION OF A QUORUM
 Mesa Union School District Agenda for the Special Board Meeting of the Board of Trustees to be held on Thursday, May 3, 2018, at 6:00 p.m. in the School Multi-Purpose Room located at 3901 North Mesa School
Reserve Analysis Report
 Reserve Analysis Report Parkway Towers 1155 Ash St Denver, CO 80220 Level I Study with Site Inspection Fiscal Year End Date: 12/31/2014 8597 Via Mallorca Suite E La Jolla, CA 92037 Phone: 858-764-1895
RESERVESTUDYUPDATE. The Villas at Blackberry Run Dallas, GA. Prepared for:
 RESERVESTUDYUPDATE Dallas, GA Prepared for: THE VILLAS AT BLACKBERRY RUN HOME OWNERS ASSOCIATION, INC. Carl Swanson-President Prepared by: CRITERIUM-CARUSO ENGINEERS 1065 POWERS PLACE, SUITE B ALPHARETTA,
Reserve Studies Turnover Reports Insurance Appraisals
 Reserve Studies Turnover Reports Insurance Appraisals Dear Board Members, Managers and Unit Owners, For twenty years we having been serving community associations throughout Florida and the Southeast United
Springfield High School
 5.1 Springfield High School Springfield School District Delaware County - Pennsylvania Master Plan Presentation Town Hall Meeting 5 Project Cost Estimates/ Project Financing Strategy / Tax Impact February
Property Assessment Form Property Data. Servicer and Loan Data
 Property Data Property Name: Holmead Apartments Property Address: 3435 Holmead Place NW Change from previously reported City: Washington State: DC Zip: 20010 # Units: 101 # Buildings: 1 Year Built: 1951
Reserve Analysis Report
 Reserve Analysis Report Sample Condominium Association Laguna Hills, California Version 1 March 31, 2004 23201 Mill Creek Drive, Suite 100 Laguna Hills, California 92653 Phone (949) 474-9800 Facsimile
ORIGINAL YEAR OF CONSTRUCTION NUMBER OF BUILDING STORIES 4/11/2013 BUILDING SURVEY DATE
 0040 1402 WEST PENNSYLVANIA AVENUE URBANA, ILLINOIS 61801 SYSTEM CONDITION INDEX.685 PRIMARY BUILDING USE BUILDING SURVEY TEAM BUILDING SYSTEM REPLACEMENT COST $ 1,364,800 LECTURE HALL BUILDING GROSS SQUARE
THE VINEYARDS AT DUBLIN GREENE OWNERS ASSOCIATION
 THE VINEYARDS AT DUBLIN GREENE OWNERS ASSOCIATION Full Reserve Study With On-site Visual Inspection October 3, 2018 Reserve Study for Fiscal Year: 01/01/2019 through 12/31/2019 2059 Camden Ave. Suite 151
CITY OF FORT PIERCE BUILDING DEPARTMENT
 CITY OF FORT PIERCE BUILDING DEPARTMENT APPLICATION FOR DETERMINATION OF SUBSTANTIAL IMPROVEMENT This is a request for determination by the City s Floodplain Administrator as to whether or not the project
NCAHMA Spring Underwriting Forum April 7-8, 2010 Physical Needs Assessments
 NCAHMA Spring Underwriting Forum April 7-8, 2010 Physical Needs Assessments 1. What is a CNA? Presentation by: Thomas E. Fielder Phone: 859-276-0000 / tfielder@fieldergroup.com a) Comprehensive review
ORIGINAL YEAR OF CONSTRUCTION NUMBER OF BUILDING STORIES 6/4/2013 BUILDING SURVEY DATE
 0218 504 EAST ARMORY AVENUE CHAMPAIGN, ILLINOIS 61820 SYSTEM CONDITION INDEX.764 PRIMARY BUILDING USE BUILDING SURVEY TEAM BUILDING SYSTEM REPLACEMENT COST $ 1,714,300 OFFICE BUILDING GROSS SQUARE FEET
CITY OF JENKS COMMERCIAL BUILDING PERMIT P.O. Box N. Elm Jenks, OK 74037(918)
") CITY OF JENKS COMMERCIAL BUILDING PERMIT P.O. Box 2007 211 N. Elm Jenks, OK 74037(918) 299-5883 CERTIFICATE OF OCCUPANCY: DATE RECEIVED: BUILDING ADDRESS: LOT: BLOCK: ADDITION: SECTION: TOWNSHIP: RANGE:
CITY OF JENKS COMMERCIAL BUILDING PERMIT P.O. Box 2007 211 N. Elm Jenks, OK 74037(918) 299-5883 CERTIFICATE OF OCCUPANCY: DATE RECEIVED: BUILDING ADDRESS: LOT: BLOCK: ADDITION: SECTION: TOWNSHIP: RANGE:
DRAFT CAPITAL RESERVE STUDY. The Piano Works Condominium Association. Deep River, Connecticut FOR THE. Project Number:
 CAPITAL RESERVE STUDY DRAFT FOR THE Management Company: Sound Real Estate Services, Contact Name: Josh Parsons Date: August 22, 2016 Table of Contents Section Name Section # Executive Summary... 1 Reserve
Physical Plant. Five-Year Capital Budget Plan. State College Area School District November Page 1 of 15
 Physical Plant Five-Year Capital Budget Plan State College Area School District November 2011 Page 1 of 15 Table of Contents Background and 2013 Projects Pages 3-5 Funding Level Pages 6-7 Existing Buildings
DEPRECIATION REPORT Strata VR 1591 The Leicester West 13th Avenue Vancouver BC V6J 2G5
 DEPRECIATION REPORT 2015 Strata VR 1591 The Leicester 1545 West 13th Avenue Vancouver BC V6J 2G5 Created by Strata Council Members Merry Meredith Tom Heise Antoine Issa The authors have compiled this report
Depreciation Report Level I
 Depreciation Report Level I Prepared for Strata VIS 2720 s 2013 Fiscal Year Prepared by RBC STRATA CONSULTING LTD. Version 3.1 2014 RBC STRATA CONSULTING LTD. Have questions about this Depreciation Report.
CAPITAL RESERVE STUDY. Meadow Wood Commons. City, State
 CAPITAL RESERVE STUDY FOR THE Meadow Wood Commons City, State Management Company: Any Management Company Contact Name: Mr. Bob Smith Date: July 28, 2014 Table of Contents Section Name Section # Executive
PROFESSIONAL RESERVE STUDY
 PROFESSIONAL RESERVE STUDY Tamarack Village 10701 to 10798-221 st Lane NE, Redmond, WA 98053 For: Tamrack Village Homeowners Association c/o Jason Kozleski Board President 10790-221 st Lane NE Redmond,
BUDGET APPROVED. GENERAL EXPENSES (158 Units)
") TANGLEWOOD HILLS CONDOMINIUM Association name: Tanglewood Hills Condom Association number: 1457 General - Total # of Units 158 Fiscal year end: 12/31 Budget year: 2017 Budget type: M BUDGET APPROVED ACCT.
TANGLEWOOD HILLS CONDOMINIUM Association name: Tanglewood Hills Condom Association number: 1457 General - Total # of Units 158 Fiscal year end: 12/31 Budget year: 2017 Budget type: M BUDGET APPROVED ACCT.
TANGLEWOOD HILLS CONDOMINIUM
 TANGLEWOOD HILLS CONDOMINIUM Association name: Tanglewood Hills Condom Association number: 1547 General - Total # of Units 158 Fiscal year end: 12/31 Budget year: 2018 Budget type: M BUDGET APPROVED ACCT.
THIS IS AN APPLICATION FOR A BUILDING PERMIT
 THIS IS AN APPLICATION FOR A BUILDING PERMIT 1. Read these instructions and carefully complete the application. 2. No building or structure shall be erected, added to or structurally altered or the use
CAPITAL FUNDING SUMMARY
 CAPITAL SUMMARY SCC (School Consolidation Capital ) CAPITAL : B19 -December 1, Specifically to address a school board s excess capacity : B11 -May 26, Opportunity to identify most urgent & pressing accommodations
Reserve Study. Epworth United Methodist Church
 Reserve Study For Epworth United Methodist Church July 21, 2015 Reserve Study Prepared By The Whayland Group,LLC 30613 Sussex Highway Laurel, Delaware 19956 TABLE OF CONTENTS Epworth United Methodist Church
Desktop Facilities Assessment
 Desktop Facilities Assessment Town of Gravenhurst 3-5 Pineridge Gate Gravenhurst, Ontario PP Z3 R.J. Burnside & Associates Limited 28 Wellington Street West Suite 30 Barrie ON L4N 8J6 CANADA January 20,
BERKELEY UNIFIED SCHOOL DISTRICT
 BERKELEY UNIFIED SCHOOL DISTRICT TO: Javetta Cleveland and Neil Smith, Co-Superintendents FROM: Lew Jones, Director of Facilities DATE: June 26, 2013 SUBJECT: Approval of the 2013/14 Measure H Annual Plan
Hyde Park Place Owners' Association, Inc.
 RESERVE STUDY Full Study Hyde Park Place Owners' Association, Inc. Published - February 10, 2016 Browning Reserve Group / Emmett, ID 83617 Office (208) 365-0977 Tony@BrowningRG.com / www.browningrg.com
Reserve Study Transmittal Letter
 Reserve Study Transmittal Letter Date: November 13, 2013 To: Rob Ross, Gateview From: Richard Avelar & Associates (RA&A) Re: Gateview; Update w/ Site Visit Review Attached, please find the reserve study
LEVEL 3 RESERVE STUDY UPDATE WOOLSEY CORNER CONDOMINIUM
 LEVEL 3 RESERVE STUDY UPDATE FOR WOOLSEY CORNER CONDOMINIUM Portland, OR January 1, 2014 December 31, 2014 Prepared By: Carson M. Horton, RS Quality Check By: L. Law Broili Date: January 1, 2014 Copyright
Kansas Home Inspectors Registration Board
 Agency 130 Kansas Home Inspectors Registration Board Articles 130-1. REGISTRATION, RENEWAL, AND EXAMINATION. 130-2. FEES. 130-3. EDUCATION PROGRAMS. 130-4. CODE OF ETHICS AND STANDARDS OF PRACTICE. 130-5.
LEVEL 3 RESERVE STUDY UPDATE WOOLSEY CORNER CONDOMINIUM
 LEVEL 3 RESERVE STUDY UPDATE FOR WOOLSEY CORNER CONDOMINIUM Portland, OR January 1, 2017 December 31, 2017 Prepared By: Carson M. Horton, RS Quality Check By: L. Law Broili Date: April 6, 2017 Copyright
Prepared for: VILLAGE AT HIGHLANDS OWNERS ASSOCIATION CROZET, VA. Prepared by:
 RESERVE FUND STUDY THE VILLAGE AT HIGHLANDS CROZET, VA 22932 Prepared for: VILLAGE AT HIGHLANDS OWNERS ASSOCIATION CROZET, VA C/O ASSOCIA COMMUNITY GROUP 1828 PAVILION CIRCLE CHARLOTTESVILLE, VA 22911
Final Report. Capital Plan Building Condition and Energy Assessments Khyber Building 1588 Barrington Street Halifax, Nova Scotia
 Capital Management Engineering Limited EMPOWERING OUR CLIENTS WITH KNOWLEDGE 5531 Cornwallis Street, Halifax, NS, Canada B3K 1B3 Phone: 902 429 4412 Fax: 902 423 4945 Final Report Capital Plan Building
2015 Reserve Study Report LOCATED AT: FOR: AS OF: BY:
 2015 Reserve Study Report LOCATED AT: 101 Oasis Drive Pompano Beach, FL 33069 FOR: Oasis at Palm Aire Association, Inc. 101 Oasis Dr., # Office Pompano Beach, FL 33069 AS OF: January 1st, 2015 - December
Parkwood HOA. Level 1 Reserve Study. Report Period 1/1/ /31/2012. Date of Property Inspection. Report prepared on Saturday, August 11, 2012
 Parkwood HOA Level 1 Reserve Study Report Period 1/1/2012 12/31/2012 Client Reference Number Property Type Number of Units Fiscal Year End 12784 Townhouse 8 12/31 Date of Property Inspection Prepared By
ORIGINAL YEAR OF CONSTRUCTION NUMBER OF BUILDING STORIES 6/18/2013 BUILDING SURVEY DATE
 0358 1004 SOUTH FOURTH STREET CHAMPAIGN, ILLINOIS 61820 SYSTEM CONDITION INDEX.508 PRIMARY BUILDING USE BUILDING SURVEY TEAM BUILDING SYSTEM REPLACEMENT COST $ 2,281,700 CLASSROOMS / LIBRARY BUILDING GROSS
RESERVE FUND STUDY. Hill & Associates Ltd. Member APEGNB July 2014
 2014 RESERVE FUND STUDY Hill & Associates Ltd. Member APEGNB July 2014 Reserve Fund Study Prepared for Bobak Place Townhome Condominiums Prepared by Hill & Associates Ltd. Consulting Professional Engineers
RESERVE FUND STUDY VILLAS OF HUDSON HOMEOWNERS ASSOCIATION HUDSON, OHIO
 RESERVE FUND STUDY VILLAS OF HUDSON HOMEOWNERS ASSOCIATION HUDSON, OHIO Criterium Liszkay Engineers 110 N. High St. Gahanna, OH 43230 614-418-7200 www.clengineers.com AUGUST, 2009 1.0 INTRODUCTION... 1