Harnett Central High
|
|
|
- Deirdre Baldwin
- 5 years ago
- Views:
Transcription

1 NC School District/430 Harnett County/High School Harnett Central High Final Campus Assessment Report March 11, 2017 PARSONS
2 Campus Assessment Report Table of Contents Campus Executive Summary 6 Campus Dashboard Summary 9 Campus Condition Summary Field House 12 Executive Summary 12 Dashboard Summary 13 Condition Summary 14 Photo Album 15 Condition Detail 16 System Listing 17 System Notes 18 Renewal Schedule 24 Forecasted Sustainment Requirement 26 Deficiency Summary By System 27 Deficiency Summary By Priority 28 Deficiency By Priority Investment 29 Deficiency Summary By Category 30 Deficiency Details By Priority Main Building 36 Executive Summary 36 Dashboard Summary 37 Condition Summary 38 Photo Album 39 Condition Detail 40 System Listing 41 System Notes 44 Renewal Schedule 56 Forecasted Sustainment Requirement 59 Deficiency Summary By System 60 Mar 11, 2017 Page 2 of 161
3 Campus Assessment Report Deficiency Summary By Priority 61 Deficiency By Priority Investment 62 Deficiency Summary By Category 63 Deficiency Details By Priority Baseball Concession/Restroom 74 Executive Summary 74 Dashboard Summary 75 Condition Summary 76 Photo Album 77 Condition Detail 78 System Listing 79 System Notes 80 Renewal Schedule 87 Forecasted Sustainment Requirement 89 Deficiency Summary By System 90 Deficiency Summary By Priority 91 Deficiency By Priority Investment 92 Deficiency Summary By Category 93 Deficiency Details By Priority Field House 95 Executive Summary 95 Dashboard Summary 96 Condition Summary 97 Photo Album 98 Condition Detail 99 System Listing 100 System Notes 101 Renewal Schedule 108 Forecasted Sustainment Requirement 110 Deficiency Summary By System 111 Deficiency Summary By Priority 112 Mar 11, 2017 Page 3 of 161
4 Campus Assessment Report Deficiency By Priority Investment 113 Deficiency Summary By Category 114 Deficiency Details By Priority Gym/9th Grade Wing 116 Executive Summary 116 Dashboard Summary 117 Condition Summary 118 Photo Album 119 Condition Detail 120 System Listing 121 System Notes 123 Renewal Schedule 134 Forecasted Sustainment Requirement 137 Deficiency Summary By System 138 Deficiency Summary By Priority 139 Deficiency By Priority Investment 140 Deficiency Summary By Category 141 Deficiency Details By Priority 142 Site 143 Executive Summary 143 Dashboard Summary 144 Condition Summary 145 Photo Album 146 Condition Detail 147 System Listing 148 System Notes 149 Renewal Schedule 155 Forecasted Sustainment Requirement 156 Deficiency Summary By System 157 Deficiency Summary By Priority 158 Deficiency By Priority Investment 159 Mar 11, 2017 Page 4 of 161
5 Campus Assessment Report Deficiency Summary By Category 160 Deficiency Details By Priority 161 Mar 11, 2017 Page 5 of 161

6 Campus Assessment Report - Harnett Central High Campus Executive Summary Building condition is evaluated based on the functional systems and elements of a building and organized according to the UNIFORMAT II Elemental Classification. The grouping of these systems and elements and applying a current replacement value to them develops a representative building cost model. Cost Models are developed for similar building types and functions. Systems and their elements are evaluated based on their current replacement values, life cycles, installation dates and next renewal dates. Systems and their elements that are within their useful lives are further evaluated to identify current deficient conditions that may have a significant impact on a system's or element's remaining service life, and to determine if they are beyond their predicted expected life. The system's or element's current replacement value is based on RS Means Commercial Cost Data. Following are the cost model's system details for this facility. The Replacement Value is the amount needed to replace the property of the same present scope. The Repair Cost (the sum of the cost to repair/replace the Deficiencies) represents the budgeted contractor-installed costs plus owner's soft costs for the repair, replacement or renewal for a component or system level deficiency. It excludes contributing costs for other components or systems that might also be associated with the corrective actions due to packaging of the work. Facility Condition Index ( FCI) is an industry-standard measurement of facility condition calculated as the ratio of the costs to correct a facility's deficiencies (Condition Needs) to the facility's Current Replacement Value. It ranges from 0% (new) to 100% (very poor - beyond service life). The Remaining Service Life Index (RSLI) is calculated as the sum of a renewable system's Remaining Service Life (RSL) divided by the sum of a system's Replacement Value (both values exclude soft-cost to simplify calculation updates) expressed as a percentage ranging from 100% (new) to 0% (expired). The relationship between the key metrics FCI and RSLI is an important indicator, at either the facility, building, system, or component levels, of the condition trend and the imminent need for capital renewal. These indices exist in an inverse relationship wherein the FCI increases when systems reach their expected life-cycle age, whereas the RSLI decreases annually indicating the relative time remaining before reaching the life-cycle expiration age. For example, a facility or a system with a high RSLI and a low FCI indicates it is in the early portion of its useful life. However, a low RSLI indicates that expiration dates are approaching at which point the FCI would increase. The term FCA Score is the inverse of Total FCI and calculated as 100-Total FCI (without the %) where 100 is best and 0 is worst condition.. Gross Area (SF): Year Built: 208, Last Renovation: Replacement Value: Repair Cost: Total FCI: Total RSLI: $47,055,750 $13,726, % % FCA Score: Description: General: The Harnett Central High School is located on 2911 Harnett Central Road, in Angier, North Carolina. The 152,718-square foot building contains a school with an addition of a classroom and gym at 49,063, two field houses, baseball concession stand, greenhouse, storage building and 6 portable buildings. This report contains condition and adequacy data collected during the 2016 Facility Condition Assessment (FCA). Detailed condition and deficiency statements are contained in this report for the site features. A. SUBSTRUCTURE: Mar 11, 2017 Page 6 of 161
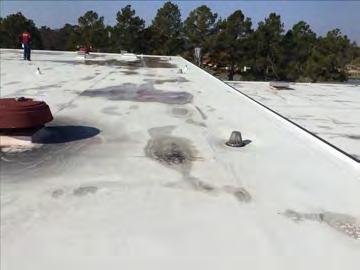
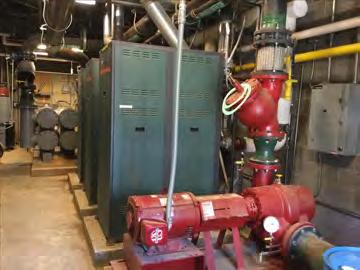
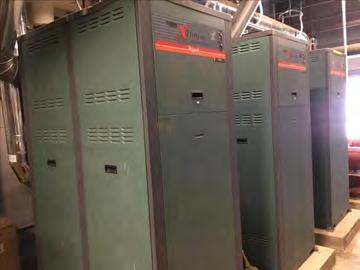
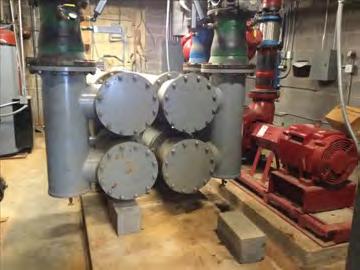
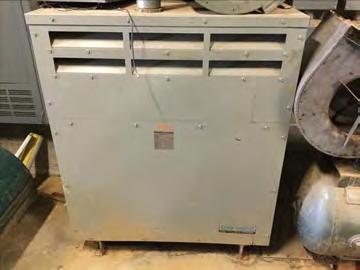
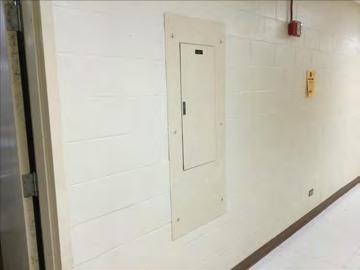
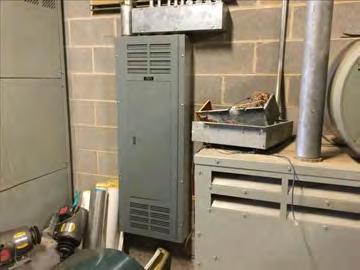
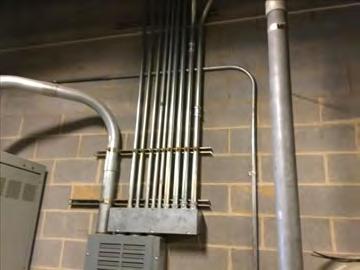
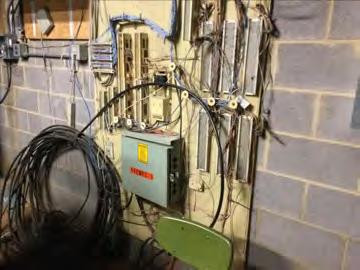
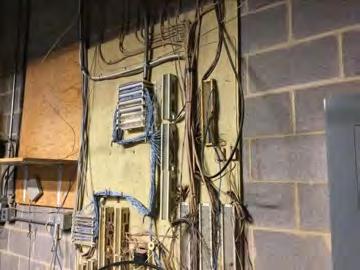
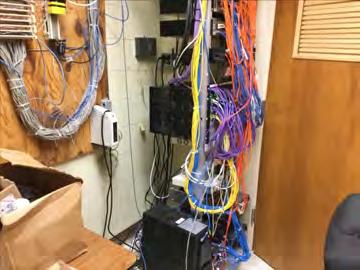
7 Campus Assessment Report - Harnett Central High The building rests on slab-on grade and is assumed to have standard cast-in-place concrete foundations. The building does not have a basement. B. SUPERSTRUCTURE The buildings typically rest on footings and foundation walls. The main structure is metal frame with brick façade. The roof is performed metal roof for the main building and storage and EPDM for the gym. Exterior doors are typically hollow metal glazed doors and the windows are typically metal double pane windows. C. INTERIORS Partition wall types include painted CMU blocks, ceramic tile and drywalls. Most ceiling finishes are typically acoustical ceiling tiles. Floor finishes in high use areas are typically vinyl tiles and terrazzo. Most other flooring finishes are ceramic tiles, carpet, and exposed concrete. Interior doors are generally wooden doors. CONVEYING: This main building has no elevators. D. SERVICES PLUMBING: Plumbing fixtures are typically on-low-flow water fixtures with manual control valves. Domestic water distribution is combination of copper and galvanized steel with electric hot water heating. Sanitary waste system is cast iron. Rain water drainage system is internal with roof drains. Other plumbing systems is supplied by natural gas. HVAC: Cooling for this building is provided by two air cooled chillers. Heating is provided by two boilers. Supplemental cooling is provided by terminal and package units. Conditioned air is distributed through ducts. The restrooms have roof exhausts. FIRE PROTECTION: The building does not have a fire sprinkler system. The building does have additional fire suppression systems, which include dry chemical system for the kitchen exhaust hood. Fire extinguishers and cabinets are distributed near fire exits and corridors. ELECTRICAL: The electrical system is fed from a pad mounted transformer. Lighting are a combination of T8 fluorescent, LED s. The building has emergency lighting and illuminated exit signs. This building has a propane powered emergency generator. COMMUNICATIONS AND SECURITY: The fire alarm system consists of audible/visual strobe annunciators in common spaces, balconies and interior corridors. The system is activated by manual pull stations and smoke detectors and the system is centrally monitored. The telephone and data systems are segregated and include dedicated equipment closets. This building does have a local area network (LAN). The building includes an internal security system that is actuated by the following items: contacts, infrared, optical or a combination of all devices. The security system has CCTV cameras and is centrally monitored; this building has a public address and paging system separate from the telephone system. OTHER ELECTRICAL SYSTEMS: This building does not have a separately derived emergency power system. E. EQUIPMENT & FURNISHINGS: This building includes the following items and equipment: fixed food service, library equipment, athletic equipment, theater and stage, audio-visual, laboratory, casework, window treatment, floor grilles and mats, and multiple seating furnishings. G. SITE: Campus site features include paved driveways and parking lots, pedestrian pavement, flag pole, landscaping, softball field, baseball field, football/track stadium, and fencing. Site mechanical and electrical features include water, sewer, propane gas, and site lighting. Mar 11, 2017 Page 7 of 161
8 Campus Assessment Report - Harnett Central High Attributes: General Attributes: Condition Assessor: Terence Davis Assessment Date: 11/7/2016 Suitability Assessor: School Inofrmation: HS Attendance Area: Harnett - Harnett Central HS LEA School No.: No. of Mobile Units: 7 No. of Bldgs.: 5 SF of Mobile Units: 5856 Status: Active School Grades: 9-12 Site Acreage: 57.7 Mar 11, 2017 Page 8 of 161
9 Campus Assessment Report - Harnett Central High Campus Dashboard Summary Gross Area: Year Built: Repair Cost: FCI: 208, $13,726, % Last Renovation: Replacement Value: RSLI%: $47,055, % Deficiency By Category Deficiency By Priority Building Code Compliance - $718, Deferred Maintenance - $11,983, Deferred Maintenance / Building Code Compliance - $611, Safety - $412, Currently Critical (Immediate) - $412, Potentially Critical (Year 1) - $644, Necessary/Not Yet Critical (Years 2-5) - $11,950, Recommended (Years 6-10) - $718, Codes or Standards Compliance $2,000,000 $2M $2M $2M $1,500,000 $1,000,000 $500,000 $0 Interior Finishes Exterior Enclosure Plumbing Deficiency By System $1M $969K $670K $647K $544K $518K $311K $126K $31K HVAC Equipment Electrical Furnishings Fire Protection Interior Construction Site Improvements Conveying Roofing $10,000,000 $8,000,000 $6,000,000 $4,000,000 $2,000,000 $0 10 Year Investment Forecast $8M $4M $3M $3M $2M $17K $0 $0 $45K $ Mar 11, 2017 Page 9 of 161
10 Campus Assessment Report - Harnett Central High Campus Condition Summary The Table below shows the RSLI and FCI for each major system shown at the UNIFORMAT II classification Level 2. Note that Systems with lower FCIs require less investment than systems with higher FCIs. Current Investment Requirement and Condition by Uniformat Classification UNIFORMAT Classification RSLI% FCI % Current Repair A10 - Foundations % 0.00 % $0.00 A20 - Basement Construction % 0.00 % $0.00 B10 - Superstructure % 0.00 % $0.00 B20 - Exterior Enclosure % % $2,332, B30 - Roofing % 2.69 % $41, C10 - Interior Construction % % $681, C20 - Stairs % 0.00 % $0.00 C30 - Interior Finishes % % $2,345, D10 - Conveying 0.00 % % $166, D20 - Plumbing % % $2,269, D30 - HVAC % % $1,741, D40 - Fire Protection % % $718, D50 - Electrical % % $883, E10 - Equipment % % $1,280, E20 - Furnishings % % $853, G20 - Site Improvements % 8.20 % $412, G30 - Site Mechanical Utilities % 0.00 % $0.00 G40 - Site Electrical Utilities % 0.00 % $0.00 Totals: % % $13,726, Condition Deficiency Priority Facility Name Gross Area (S.F.) FCI % 1 - Currently Critical (Immediate) 2 - Potentially Critical (Year 1) 3 - Necessary/Not Yet Critical (Years 2-5) 4 - Recommended (Years 6-10) 5 - Codes or Standards Compliance 1977 Field House 3, $0.00 $33, $115, $0.00 $ Main Building 152, $0.00 $611, $11,826, $718, $ Baseball Concession/Restroom 1, $0.00 $0.00 $7, $0.00 $ Field House 2, $0.00 $0.00 $0.00 $0.00 $ Gym/9th Grade Wing 49, $0.00 $0.00 $0.00 $0.00 $0.00 Site 208, $412, $0.00 $0.00 $0.00 $0.00 Deficiencies By Priority Total: $412, $644, $11,950, $718, $0.00 Mar 11, 2017 Page 10 of 161
11 Campus Assessment Report - Harnett Central High 1 - Currently Critical (Immediate) - $412, Potentially Critical (Year 1) - $644, Necessary/Not Yet Critical (Years 2-5) - $11,950, Recommended (Years 6-10) - $718, Codes or Standards Compliance Budget Estimate Total: $13,726, Mar 11, 2017 Page 11 of 161
12 Campus Assessment Report Field House Executive Summary Building condition is evaluated based on the functional systems and elements of a building and organized according to the UNIFORMAT II Elemental Classification. The grouping of these systems and elements and applying a current replacement value to them develops a representative building cost model. Cost Models are developed for similar building types and functions. Systems and their elements are evaluated based on their current replacement values, life cycles, installation dates and next renewal dates. Systems and their elements that are within their useful lives are further evaluated to identify current deficient conditions that may have a significant impact on a system's or element's remaining service life, and to determine if they are beyond their predicted expected life. The system's or element's current replacement value is based on RS Means Commercial Cost Data. Following are the cost model's system details for this facility. The Replacement Value is the amount needed to replace the property of the same present scope. The Repair Cost (the sum of the cost to repair/replace the Deficiencies) represents the budgeted contractor-installed costs plus owner's soft costs for the repair, replacement or renewal for a component or system level deficiency. It excludes contributing costs for other components or systems that might also be associated with the corrective actions due to packaging of the work. Facility Condition Index ( FCI) is an industry-standard measurement of facility condition calculated as the ratio of the costs to correct a facility's deficiencies (Condition Needs) to the facility's Current Replacement Value. It ranges from 0% (new) to 100% (very poor - beyond service life). The Remaining Service Life Index (RSLI) is calculated as the sum of a renewable system's Remaining Service Life (RSL) divided by the sum of a system's Replacement Value (both values exclude soft-cost to simplify calculation updates) expressed as a percentage ranging from 100% (new) to 0% (expired). The relationship between the key metrics FCI and RSLI is an important indicator, at either the facility, building, system, or component levels, of the condition trend and the imminent need for capital renewal. These indices exist in an inverse relationship wherein the FCI increases when systems reach their expected life-cycle age, whereas the RSLI decreases annually indicating the relative time remaining before reaching the life-cycle expiration age. For example, a facility or a system with a high RSLI and a low FCI indicates it is in the early portion of its useful life. However, a low RSLI indicates that expiration dates are approaching at which point the FCI would increase. The term FCA Score is the inverse of Total FCI and calculated as 100-Total FCI (without the %) where 100 is best and 0 is worst condition. Function: Gross Area (SF): Year Built: Last Renovation: Replacement Value: Repair Cost: Total FCI: Total RSLI: HS -High School 3, $334,752 $149, % % FCA Score: Description: The narrative for this building is included in the Executive Summary Description at the front of this report. Attributes: This asset has no attributes. Mar 11, 2017 Page 12 of 161
13 Campus Assessment Report Field House Dashboard Summary Function: Year Built: Repair Cost: FCI: HS -High School 1977 $149, % Gross Area: Last Renovation: Replacement Value: RSLI%: 3,200 $334, % Deficiency By Category Deficiency By Priority Deferred Maintenance - $149, Currently Critical (Immediate) 2 - Potentially Critical (Year 1) - $33, Necessary/Not Yet Critical (Years 2-5) - $115, Recommended (Years 6-10) 5 - Codes or Standards Compliance $30,000 $20,000 $10,000 $0 $25K $23K Roofing Interior Finishes Plumbing Deficiency By System $22K $16K $15K $9K $3K HVAC Equipment Interior Construction Exterior Enclosure $50,000 $40,000 $30,000 $20,000 $10,000 $0 10 Year Investment Forecast $43K $24K $15K $8K $0 $0 $0 $0 $0 $ Mar 11, 2017 Page 13 of 161
14 Campus Assessment Report Field House Condition Summary The Table below shows the RSLI and FCI for each major building system shown at the UNIFORMAT classification Level II. Note that Systems with lower FCIs require less investment than systems with higher FCIs. UNIFORMAT Classification RSLI % FCI % Current Repair Cost A10 - Foundations % 0.00 % $0.00 B10 - Superstructure % 0.00 % $0.00 B20 - Exterior Enclosure % 6.11 % $4, B30 - Roofing 0.00 % % $33, C10 - Interior Construction % % $11, C30 - Interior Finishes 5.48 % % $30, D20 - Plumbing 1.52 % % $28, D30 - HVAC 6.27 % % $21, D50 - Electrical % 0.00 % $0.00 E10 - Equipment 0.00 % % $20, Totals: % % $149, Mar 11, 2017 Page 14 of 161

.")
.")
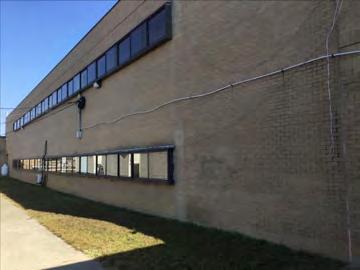
15 Campus Assessment Report Field House Photo Album The photo album consists of the various cardinal directions of the building.. 1). South Elevation - Nov 18, ). West Elevation - Nov 18, ). North Elevation - Nov 18, ). East Elevation - Nov 18, 2016 Mar 11, 2017 Page 15 of 161
16 Campus Assessment Report Field House Condition Detail This section of the report contains results of the Facility Condition Assessment. The building is separated into system components based on UNIFORMAT II. The columns in the System Listing table represent the following: 1. System Code: A code that identifies the system. 2. System Description: A brief description of a system present in the building. 3. Unit Price $: The unit price of the system. 4. UoM: The unit of measure of the system. 5. Qty: The quantity for the system 6. Life: Building Owners and Managers Association (BOMA) recommended system design life. 7. Year Installed: The date of system installation. 8. Calc Next Renewal Year: The date of system expiration based on the life, NR stands for non renewable. 9. Next Renewal Year: The suggested system expiration date by the assessor based on visual inspection. 10. RSLI: The Remaining Service Life Index of the system. 11. FCI: The Facility Condition Index of the system. 12. RSL: Remaining Service Life in years. 13. ecr: ecomet Condition Rating (not used in this assessment). 14. Deficiency $: The financial investment to repair/replace system to address deficiency. 15. Replacement Value $: The replacement cost of the system. Mar 11, 2017 Page 16 of 161
17 Campus Assessment Report Field House System Listing The System Listing table below lists each of the systems organized by their UNIFORMAT II classification. The assessment team was tasked with recording the most recent replacement year of each system, determining the remaining service life based on the theoretical life, and evaluating the condition to confirm the forecast next replacement year. The system listing is the basis for all data contained in the Building Assessment Report. System Code System Description Unit Price $ UoM Qty Life Year Installed Calc Next Renewal Year Next Renewal Year RSLI% FCI% RSL ecr Deficiency $ Replacement Value $ A1010 Standard Foundations $4.26 S.F. 3, % 0.00 % 60 $13,632 A1030 Slab on Grade $7.37 S.F. 3, % 0.00 % 60 $23,584 B1020 Roof Construction $5.98 S.F. 3, % 0.00 % 60 $19,136 B2010 Exterior Walls $18.04 S.F. 3, % 0.00 % 60 $57,728 B2020 Exterior Windows $1.19 S.F. 3, % % -10 $4, $3,808 B2030 Exterior Doors $2.18 S.F. 3, % 0.00 % 4 $6,976 B Single Ply Membrane $6.98 S.F. 3, % % -20 $33, $22,336 C1010 Partitions $10.34 S.F. 3, % 0.00 % 35 $33,088 C1020 Interior Doors $2.20 S.F. 3, % 0.00 % 4 $7,040 C1030 Fittings $3.19 S.F. 3, % % -20 $11, $10,208 C3010 Wall Finishes $3.14 S.F. 3, % % -7 $11, $10,048 C3020 Floor Finishes $5.58 S.F. 3, % % -20 $19, $17,856 C3030 Ceiling Finishes $1.80 S.F. 3, % 0.00 % 8 $5,760 D2010 Plumbing Fixtures $6.02 S.F. 3, % % -10 $21, $19,264 D2020 Domestic Water Distribution $2.06 S.F. 3, % % -10 $7, $6,592 D2030 Sanitary Waste $1.04 S.F. 3, % 0.00 % 4 $3,328 D3020 Heat Generating Systems $6.02 S.F. 3, % % -10 $21, $19,264 D3040 Distribution Systems $5.35 S.F. 3, % 0.00 % 4 $17,120 D5020 Branch Wiring $2.55 S.F. 3, % 0.00 % 3 $8,160 D5020 Lighting $3.58 S.F. 3, % 0.00 % 3 $11,456 E1020 Institutional Equipment $5.74 S.F. 3, % % -7 $20, $18,368 Total % % $149, $334,752 Mar 11, 2017 Page 17 of 161


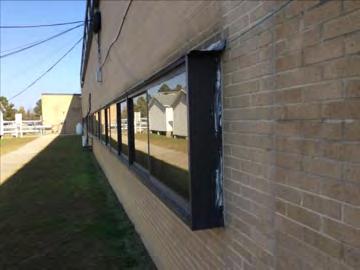
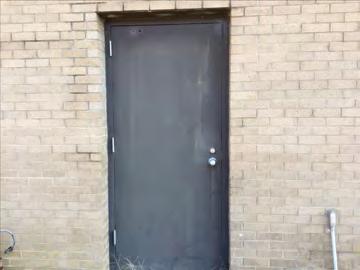
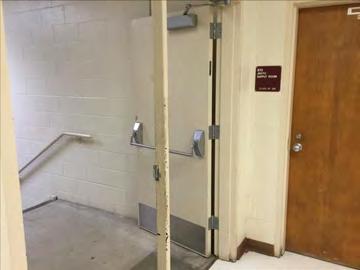
18 Campus Assessment Report Field House System Notes The facility description in the executive summary contains an overview of each system. The photos of each system and any associated notes listed below provide additional information on select systems found within the facility: B Exterior Walls B Exterior Windows B Exterior Doors Mar 11, 2017 Page 18 of 161


19 Campus Assessment Report Field House B Single Ply Membrane C Partitions C Interior Doors Mar 11, 2017 Page 19 of 161


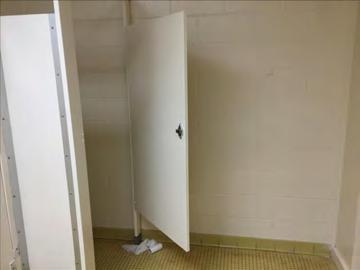
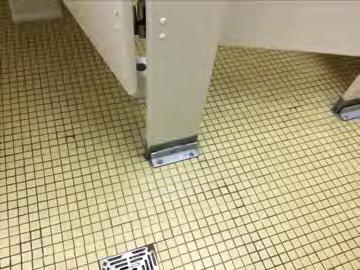
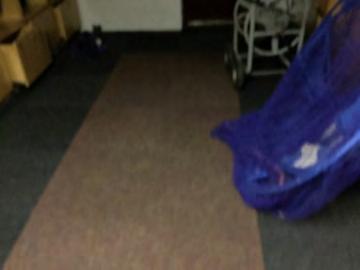
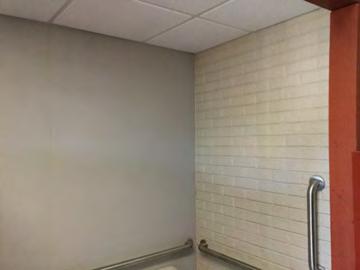
20 Campus Assessment Report Field House C Fittings C Wall Finishes C Floor Finishes Mar 11, 2017 Page 20 of 161


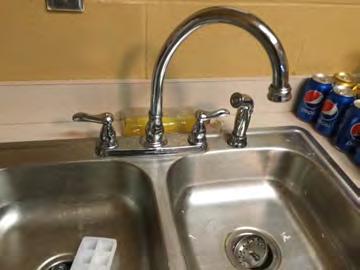
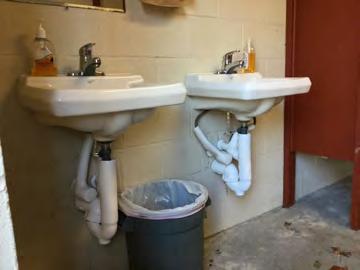
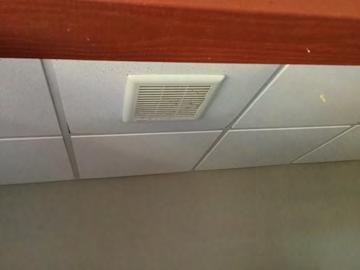
21 Campus Assessment Report Field House C Ceiling Finishes D Plumbing Fixtures D Domestic Water Distribution Mar 11, 2017 Page 21 of 161


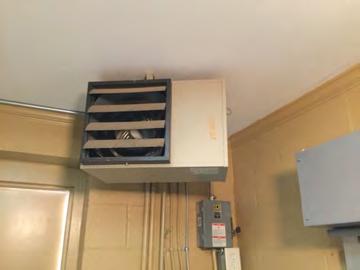
22 Campus Assessment Report Field House D Sanitary Waste D Heat Generating Systems D Distribution Systems Mar 11, 2017 Page 22 of 161


23 Campus Assessment Report Field House D Branch Wiring D Lighting E Institutional Equipment Mar 11, 2017 Page 23 of 161
24 Campus Assessment Report Field House Renewal Schedule ecomet forecasts future Capital Renewal projects for expiring systems based on the Calculated Next Renewal year found in the system listing. There is a 3% yearly inflation factor applied to the system costs expiring in the future. The table below reflects Capital Renewal projects over the next 10 years. Blank cells (or $0) indicate no systems are scheduled for renewal in that year. Inflation Rate: 3% System Current Deficiencies Total Total: $149,453 $0 $0 $23,579 $42,669 $0 $0 $0 $8,026 $0 $14,854 $238,582 * A - Substructure $0 $0 $0 $0 $0 $0 $0 $0 $0 $0 $0 $0 * A10 - Foundations $0 $0 $0 $0 $0 $0 $0 $0 $0 $0 $0 $0 * A Standard Foundations $0 $0 $0 $0 $0 $0 $0 $0 $0 $0 $0 $0 * A Slab on Grade $0 $0 $0 $0 $0 $0 $0 $0 $0 $0 $0 $0 B - Shell $0 $0 $0 $0 $0 $0 $0 $0 $0 $0 $0 $0 B10 - Superstructure $0 $0 $0 $0 $0 $0 $0 $0 $0 $0 $0 $0 * B Roof Construction $0 $0 $0 $0 $0 $0 $0 $0 $0 $0 $0 $0 B20 - Exterior Enclosure $0 $0 $0 $0 $0 $0 $0 $0 $0 $0 $0 $0 * B Exterior Walls $0 $0 $0 $0 $0 $0 $0 $0 $0 $0 $0 $0 B Exterior Windows $4,189 $0 $0 $0 $0 $0 $0 $0 $0 $0 $0 $4,189 B Exterior Doors $0 $0 $0 $0 $8,637 $0 $0 $0 $0 $0 $0 $8,637 B30 - Roofing $0 $0 $0 $0 $0 $0 $0 $0 $0 $0 $0 $0 B Roof Coverings $0 $0 $0 $0 $0 $0 $0 $0 $0 $0 $0 $0 B Single Ply Membrane $33,504 $0 $0 $0 $0 $0 $0 $0 $0 $0 $0 $33,504 C - Interiors $0 $0 $0 $0 $0 $0 $0 $0 $0 $0 $0 $0 C10 - Interior Construction $0 $0 $0 $0 $0 $0 $0 $0 $0 $0 $0 $0 * C Partitions $0 $0 $0 $0 $0 $0 $0 $0 $0 $0 $0 $0 C Interior Doors $0 $0 $0 $0 $8,716 $0 $0 $0 $0 $0 $0 $8,716 C Fittings $11,229 $0 $0 $0 $0 $0 $0 $0 $0 $0 $0 $11,229 C30 - Interior Finishes $0 $0 $0 $0 $0 $0 $0 $0 $0 $0 $0 $0 C Wall Finishes $11,053 $0 $0 $0 $0 $0 $0 $0 $0 $0 $14,854 $25,907 C Floor Finishes $19,642 $0 $0 $0 $0 $0 $0 $0 $0 $0 $0 $19,642 C Ceiling Finishes $0 $0 $0 $0 $0 $0 $0 $0 $8,026 $0 $0 $8,026 D - Services $0 $0 $0 $0 $0 $0 $0 $0 $0 $0 $0 $0 D20 - Plumbing $0 $0 $0 $0 $0 $0 $0 $0 $0 $0 $0 $0 Mar 11, 2017 Page 24 of 161
25 Campus Assessment Report Field House D Plumbing Fixtures $21,190 $0 $0 $0 $0 $0 $0 $0 $0 $0 $0 $21,190 D Domestic Water Distribution $7,251 $0 $0 $0 $0 $0 $0 $0 $0 $0 $0 $7,251 D Sanitary Waste $0 $0 $0 $0 $4,120 $0 $0 $0 $0 $0 $0 $4,120 D30 - HVAC $0 $0 $0 $0 $0 $0 $0 $0 $0 $0 $0 $0 D Heat Generating Systems $21,190 $0 $0 $0 $0 $0 $0 $0 $0 $0 $0 $21,190 D Distribution Systems $0 $0 $0 $0 $21,196 $0 $0 $0 $0 $0 $0 $21,196 D50 - Electrical $0 $0 $0 $0 $0 $0 $0 $0 $0 $0 $0 $0 D Branch Wiring $0 $0 $0 $9,808 $0 $0 $0 $0 $0 $0 $0 $9,808 D Lighting $0 $0 $0 $13,771 $0 $0 $0 $0 $0 $0 $0 $13,771 E - Equipment & Furnishings $0 $0 $0 $0 $0 $0 $0 $0 $0 $0 $0 $0 E10 - Equipment $0 $0 $0 $0 $0 $0 $0 $0 $0 $0 $0 $0 E Institutional Equipment $20,205 $0 $0 $0 $0 $0 $0 $0 $0 $0 $0 $20,205 * Indicates non-renewable system Mar 11, 2017 Page 25 of 161
26 Campus Assessment Report Field House Forecasted Capital Renewal Requirement The following chart shows the current building deficiencies and forecasting capital renewal or sustainment requirements over the next ten years. $150,000 $149,453 $100,000 $50,000 $42,669 $23,579 $14,854 $8,026 $0 Current Deficiencies Mar 11, 2017 Page 26 of 161
27 Campus Assessment Report Field House Deficiency Summary by System Current deficiencies included assemblies that have reached or exceeded their design life or components of the assemblies that are in need of repair. Assemblies that have reached their design life are identified as current deficiencies and assigned the distress 'Beyond Useful Life'. The following chart lists all current deficiencies associated with this facility. B2020 Exterior Windows $4, B Single Ply Membrane $33, C1030 Fittings $11, C3010 Wall Finishes $11, C3020 Floor Finishes $19, D2010 Plumbing Fixtures $21, D2020 Domestic Water Distribution $7, D3020 Heat Generating Systems $21, E1020 Institutional Equipment $20, Budget Estimate Total: $149, Mar 11, 2017 Page 27 of 161
28 Campus Assessment Report Field House Deficiency Summary by Priority The following chart shows the total repair costs broken down by priority. Assessors assigned deficiencies within ecomet to one of the following priority categories: 1 - Currently Critical (Immediate) 2 - Potentially Critical (Year 1) - $33, Necessary/Not Yet Critical (Years 2-5) - $115, Recommended (Years 6-10) 5 - Codes or Standards Compliance Budget Estimate Total: $149, Mar 11, 2017 Page 28 of 161
29 Campus Assessment Report Field House Deficiency By Priority Investment Table The table below shows the current investment cost grouped by deficiency priority and building system. 1 - Currently Critical (Immediate) 2 - Potentially Critical (Year 1) 3 - Necessary/Not Yet Critical (Years 2-5) 4 - Recommended (Years 6-10) 5 - Codes or Standards Compliance System Code System Description Total B2020 Exterior Windows $0.00 $0.00 $4, $0.00 $0.00 $4, B Single Ply Membrane $0.00 $33, $0.00 $0.00 $0.00 $33, C1030 Fittings $0.00 $0.00 $11, $0.00 $0.00 $11, C3010 Wall Finishes $0.00 $0.00 $11, $0.00 $0.00 $11, C3020 Floor Finishes $0.00 $0.00 $19, $0.00 $0.00 $19, D2010 Plumbing Fixtures $0.00 $0.00 $21, $0.00 $0.00 $21, D2020 Domestic Water Distribution $0.00 $0.00 $7, $0.00 $0.00 $7, D3020 Heat Generating Systems $0.00 $0.00 $21, $0.00 $0.00 $21, E1020 Institutional Equipment $0.00 $0.00 $20, $0.00 $0.00 $20, Total: $0.00 $33, $115, $0.00 $0.00 $149, Mar 11, 2017 Page 29 of 161
30 Campus Assessment Report Field House Deficiency Summary by Category The following chart shows the total repair costs broken down by deficiency categories. Assessors assigned deficiencies to one of the following categories: Deferred Maintenance - $149, Budget Estimate Total: $149, Mar 11, 2017 Page 30 of 161
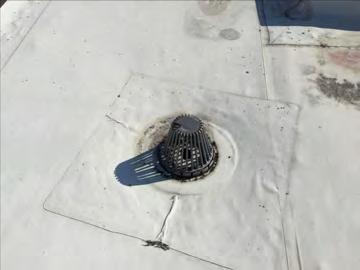
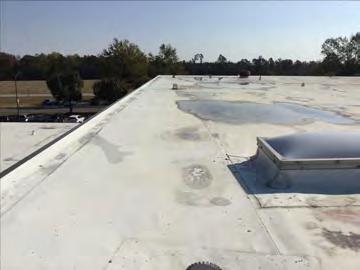
31 Campus Assessment Report Field House Deficiency Details by Priority The deficiency detail notes listed below provide additional information on identified deficiencies found within the facility. Priority 2 - Potentially Critical (Year 1): B Single Ply Membrane Location: Distress: Category: Priority: Correction: Qty: Unit of Measure: Estimate: Assessor Name: Date Created: Roof Beyond Service Life Deferred Maintenance 2 - Potentially Critical (Year 1) Renew System 3, S.F. $33, Terence Davis 11/22/2016 Notes: The roof coverings are aging, showing signs of failure and should be replaced. Mar 11, 2017 Page 31 of 161
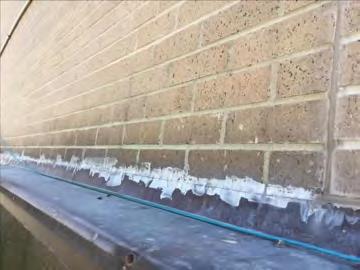
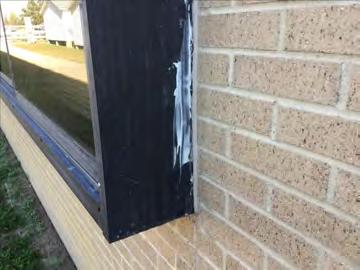
32 Campus Assessment Report Field House Priority 3 - Necessary/Not Yet Critical (Years 2-5): B Exterior Windows Location: Distress: Category: Priority: Correction: Qty: Unit of Measure: Estimate: Assessor Name: Date Created: Exterior Beyond Service Life Deferred Maintenance 3 - Necessary/Not Yet Critical (Years 2-5) Renew System 3, S.F. $4, Terence Davis 11/22/2016 Notes: The single pane windows are aged, not energy efficient, and should be replaced. C Fittings Location: Distress: Category: Priority: Correction: Qty: Unit of Measure: Estimate: Assessor Name: Date Created: Throughout the building Beyond Service Life Deferred Maintenance 3 - Necessary/Not Yet Critical (Years 2-5) Renew System 3, S.F. $11, Terence Davis 11/22/2016 Notes: The fittings throughout the building are aged, in marginal condition, and should be replaced. Mar 11, 2017 Page 32 of 161
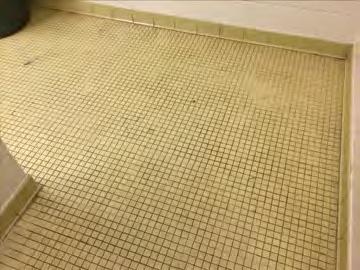
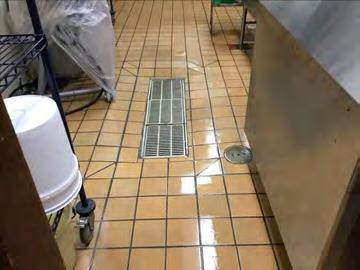
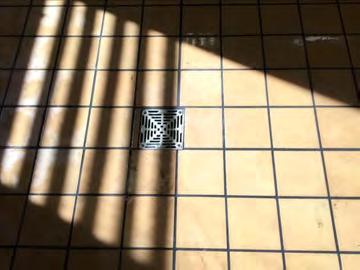
33 Campus Assessment Report Field House C Wall Finishes Location: Distress: Category: Priority: Correction: Qty: Unit of Measure: Estimate: Assessor Name: Date Created: Throughout the building Damaged Deferred Maintenance 3 - Necessary/Not Yet Critical (Years 2-5) Renew System 3, S.F. $11, Terence Davis 11/22/2016 Notes: The wall finishes are aged, scuffed, fading, stained, and should be repainted. C Floor Finishes Location: Distress: Category: Priority: Correction: Qty: Unit of Measure: Estimate: Assessor Name: Date Created: Restroom Beyond Service Life Deferred Maintenance 3 - Necessary/Not Yet Critical (Years 2-5) Renew System 3, S.F. $19, Terence Davis 11/22/2016 Notes: The ceramic tile in the is aged, chipped, cracked, patched, worn and should be replaced. Mar 11, 2017 Page 33 of 161
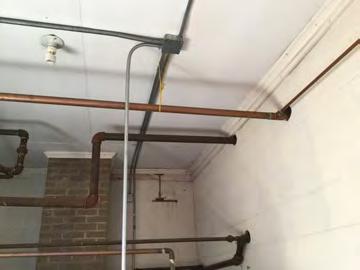
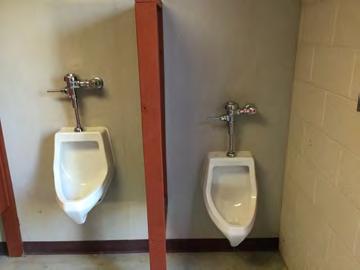
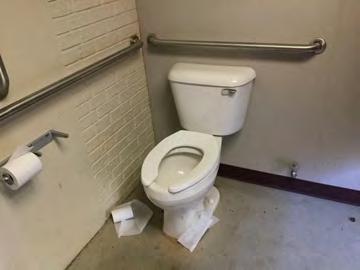
34 Campus Assessment Report Field House D Plumbing Fixtures Location: Distress: Category: Priority: Correction: Qty: Unit of Measure: Estimate: Assessor Name: Date Created: Restroom Beyond Service Life Deferred Maintenance 3 - Necessary/Not Yet Critical (Years 2-5) Renew System 3, S.F. $21, Terence Davis 11/22/2016 Notes: Plumbing fixtures are in operational conditions. However, they are aged, not ADA compliant and should be replaced with a low-flow water fixtures. D Domestic Water Distribution Location: Distress: Category: Priority: Correction: Qty: Unit of Measure: Estimate: Assessor Name: Date Created: Throughout the building Beyond Service Life Deferred Maintenance 3 - Necessary/Not Yet Critical (Years 2-5) Renew System 3, S.F. $7, Terence Davis 11/22/2016 Notes: There are no reported issues or observed deficiencies with the domestic water piping. Due to the age of the pipe there can be internal pitting corrosion that may be a costly problem that leads to the formation of pinhole leaks and possible water contamination. Mar 11, 2017 Page 34 of 161
35 Campus Assessment Report Field House D Heat Generating Systems Location: Distress: Category: Priority: Correction: Qty: Unit of Measure: Estimate: Assessor Name: Date Created: Mechanical Room Beyond Service Life Deferred Maintenance 3 - Necessary/Not Yet Critical (Years 2-5) Renew System 3, S.F. $21, Terence Davis 11/22/2016 Notes: The gas-fired boilers are operating properly and are in fair condition but; are aging, inefficient, becoming logistically unsupportable, and should be replaced with energy efficient models. E Institutional Equipment Location: Distress: Category: Priority: Correction: Qty: Unit of Measure: Estimate: Assessor Name: Date Created: 1977 Field House Beyond Service Life Deferred Maintenance 3 - Necessary/Not Yet Critical (Years 2-5) Renew System 3, S.F. $20, Terence Davis 03/01/2017 Notes: Mar 11, 2017 Page 35 of 161
36 Campus Assessment Report Main Building Executive Summary Building condition is evaluated based on the functional systems and elements of a building and organized according to the UNIFORMAT II Elemental Classification. The grouping of these systems and elements and applying a current replacement value to them develops a representative building cost model. Cost Models are developed for similar building types and functions. Systems and their elements are evaluated based on their current replacement values, life cycles, installation dates and next renewal dates. Systems and their elements that are within their useful lives are further evaluated to identify current deficient conditions that may have a significant impact on a system's or element's remaining service life, and to determine if they are beyond their predicted expected life. The system's or element's current replacement value is based on RS Means Commercial Cost Data. Following are the cost model's system details for this facility. The Replacement Value is the amount needed to replace the property of the same present scope. The Repair Cost (the sum of the cost to repair/replace the Deficiencies) represents the budgeted contractor-installed costs plus owner's soft costs for the repair, replacement or renewal for a component or system level deficiency. It excludes contributing costs for other components or systems that might also be associated with the corrective actions due to packaging of the work. Facility Condition Index ( FCI) is an industry-standard measurement of facility condition calculated as the ratio of the costs to correct a facility's deficiencies (Condition Needs) to the facility's Current Replacement Value. It ranges from 0% (new) to 100% (very poor - beyond service life). The Remaining Service Life Index (RSLI) is calculated as the sum of a renewable system's Remaining Service Life (RSL) divided by the sum of a system's Replacement Value (both values exclude soft-cost to simplify calculation updates) expressed as a percentage ranging from 100% (new) to 0% (expired). The relationship between the key metrics FCI and RSLI is an important indicator, at either the facility, building, system, or component levels, of the condition trend and the imminent need for capital renewal. These indices exist in an inverse relationship wherein the FCI increases when systems reach their expected life-cycle age, whereas the RSLI decreases annually indicating the relative time remaining before reaching the life-cycle expiration age. For example, a facility or a system with a high RSLI and a low FCI indicates it is in the early portion of its useful life. However, a low RSLI indicates that expiration dates are approaching at which point the FCI would increase. The term FCA Score is the inverse of Total FCI and calculated as 100-Total FCI (without the %) where 100 is best and 0 is worst condition. Function: Gross Area (SF): Year Built: Last Renovation: Replacement Value: Repair Cost: Total FCI: Total RSLI: HS -High School 152, $29,411,199 $13,156, % % FCA Score: Description: The narrative for this building is included in the Executive Summary Description at the front of this report. Attributes: This asset has no attributes. Mar 11, 2017 Page 36 of 161
37 Campus Assessment Report Main Building Dashboard Summary Function: Year Built: Repair Cost: FCI: HS -High School 1977 $13,156, % Gross Area: Last Renovation: Replacement Value: RSLI%: 152,718 $29,411, % Deficiency By Category Deficiency By Priority Building Code Compliance - $718, Deferred Maintenance - $11,826, Deferred Maintenance / Building Code Compliance - $611, Currently Critical (Immediate) 2 - Potentially Critical (Year 1) - $611, Necessary/Not Yet Critical (Years 2-5) - $11,826, Recommended (Years 6-10) - $718, Codes or Standards Compliance $2,000,000 $2M $2M $2M $1,500,000 $1,000,000 $500,000 $0 Exterior Enclosure Interior Finishes Plumbing Deficiency By System $1M $954K $670K $647K $544K $509K $126K HVAC Equipment Electrical Furnishings Fire Protection Interior Construction Conveying $5,000,000 $4,000,000 $3,000,000 $2,000,000 $1,000,000 $0 10 Year Investment Forecast $5M $2M $2M $2M $589K $0 $0 $0 $0 $ Mar 11, 2017 Page 37 of 161
38 Campus Assessment Report Main Building Condition Summary The Table below shows the RSLI and FCI for each major building system shown at the UNIFORMAT classification Level II. Note that Systems with lower FCIs require less investment than systems with higher FCIs. UNIFORMAT Classification RSLI % FCI % Current Repair Cost A10 - Foundations % 0.00 % $0.00 A20 - Basement Construction % 0.00 % $0.00 B10 - Superstructure % 0.00 % $0.00 B20 - Exterior Enclosure % % $2,328, B30 - Roofing % 0.00 % $0.00 C10 - Interior Construction % % $670, C20 - Stairs % 0.00 % $0.00 C30 - Interior Finishes % % $2,314, D10 - Conveying 0.00 % % $166, D20 - Plumbing 2.94 % % $2,240, D30 - HVAC % % $1,720, D40 - Fire Protection 0.00 % % $718, D50 - Electrical % % $883, E10 - Equipment 6.73 % % $1,259, E20 - Furnishings 0.00 % % $853, Totals: % % $13,156, Mar 11, 2017 Page 38 of 161

.")
.")
.")
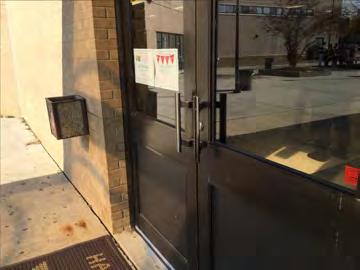
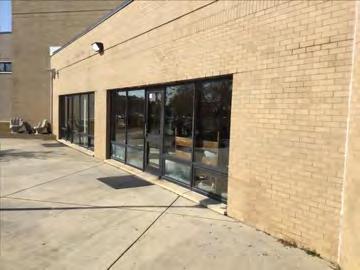
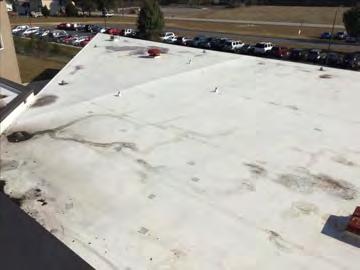
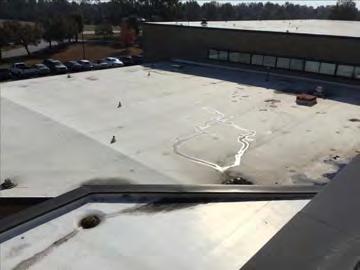
39 Campus Assessment Report Main Building Photo Album The photo album consists of the various cardinal directions of the building.. 1). East Elevation - Nov 17, ). East Elevation - Nov 17, ). North Elevation - Nov 17, ). West Elevation - Nov 17, ). South Elevation - Nov 17, 2016 Mar 11, 2017 Page 39 of 161
40 Campus Assessment Report Main Building Condition Detail This section of the report contains results of the Facility Condition Assessment. The building is separated into system components based on UNIFORMAT II. The columns in the System Listing table represent the following: 1. System Code: A code that identifies the system. 2. System Description: A brief description of a system present in the building. 3. Unit Price $: The unit price of the system. 4. UoM: The unit of measure of the system. 5. Qty: The quantity for the system 6. Life: Building Owners and Managers Association (BOMA) recommended system design life. 7. Year Installed: The date of system installation. 8. Calc Next Renewal Year: The date of system expiration based on the life, NR stands for non renewable. 9. Next Renewal Year: The suggested system expiration date by the assessor based on visual inspection. 10. RSLI: The Remaining Service Life Index of the system. 11. FCI: The Facility Condition Index of the system. 12. RSL: Remaining Service Life in years. 13. ecr: ecomet Condition Rating (not used in this assessment). 14. Deficiency $: The financial investment to repair/replace system to address deficiency. 15. Replacement Value $: The replacement cost of the system. Mar 11, 2017 Page 40 of 161
41 Campus Assessment Report Main Building System Listing The System Listing table below lists each of the systems organized by their UNIFORMAT II classification. The assessment team was tasked with recording the most recent replacement year of each system, determining the remaining service life based on the theoretical life, and evaluating the condition to confirm the forecast next replacement year. The system listing is the basis for all data contained in the Building Assessment Report. Mar 11, 2017 Page 41 of 161
42 Campus Assessment Report Main Building System Code System Description Unit Price $ UoM Qty Life Year Installed Calc Next Renewal Year Next Renewal Year RSLI% FCI% RSL ecr Deficiency $ Replacement Value $ A1010 Standard Foundations $2.22 S.F. 152, % 0.00 % 60 $339,034 A1030 Slab on Grade $4.16 S.F. 152, % 0.00 % 60 $635,307 A2010 Basement Excavation $0.84 S.F. 152, % 0.00 % 60 $128,283 A2020 Basement Walls $5.86 S.F. 152, % 0.00 % 60 $894,927 B1010 Floor Construction $11.66 S.F. 152, % 0.00 % 60 $1,780,692 B1020 Roof Construction $7.76 S.F. 152, % 0.00 % 60 $1,185,092 B2010 Exterior Walls $9.03 S.F. 152, % 0.00 % 60 $1,379,044 B2020 Exterior Windows $13.04 S.F. 152, % % -10 $2,190, $1,991,443 B2030 Exterior Doors $0.82 S.F. 152, % % -10 $137, $125,229 B Single Ply Membrane $6.98 S.F. 156, % 0.00 % 9 $1,092,698 B3020 Roof Openings $0.21 S.F. 152, % 0.00 % 14 $32,071 C1010 Partitions $4.79 S.F. 152, % 0.00 % 35 $731,519 C1020 Interior Doors $2.49 S.F. 152, % % -10 $418, $380,268 C1030 Fittings $1.50 S.F. 152, % % -20 $251, $229,077 C2010 Stair Construction $1.32 S.F. 152, % 0.00 % 60 $201,588 C3010 Wall Finishes $2.61 S.F. 152, % % -7 $438, $398,594 C3020 Floor Finishes $11.17 S.F. 152, % % -20 $1,876, $1,705,860 C3030 Ceiling Finishes $10.77 S.F. 152, % 0.00 % 18 $1,644,773 D1010 Elevators and Lifts $0.99 S.F. 152, % % -10 $166, $151,191 D2010 Plumbing Fixtures $9.02 S.F. 152, % % -10 $1,515, $1,377,516 D2020 Domestic Water Distribution $1.68 S.F. 152, % % -10 $282, $256,566 D2030 Sanitary Waste $2.64 S.F. 152, % % -10 $443, $403,176 D2040 Rain Water Drainage $0.65 S.F. 152, % 0.00 % 19 $99,267 D3020 Heat Generating Systems $7.08 S.F. 152, % 0.00 % 8 $1,081,243 D3030 Cooling Generating Systems $9.74 S.F. 152, % 0.00 % 3 $1,487,473 D3040 Distribution Systems $8.54 S.F. 152, % % -10 $1,434, $1,304,212 D3050 Terminal & Package Units $1.70 S.F. 152, % % -25 $285, $259,621 D3060 Controls & Instrumentation $2.71 S.F. 152, % 0.00 % 11 $413,866 D4010 Sprinklers $3.71 S.F. 152, % % -1 $623, $566,584 D4020 Standpipes $0.57 S.F. 152, % % -1 $95, $87,049 D5010 Electrical Service/Distribution $1.62 S.F. 152, % % 0 $272, $247,403 D5020 Branch Wiring $4.65 S.F. 152, % 0.00 % 4 $710,139 D5020 Lighting $10.85 S.F. 152, % 0.00 % 3 $1,656,990 D Security & Detection Systems $2.01 S.F. 152, % 0.00 % 4 $306,963 D Fire & Alarm Systems $3.64 S.F. 152, % % -2 $611, $555,894 D Data Communication $4.70 S.F. 152, % 0.00 % 4 $717,775 E1020 Institutional Equipment $6.10 S.F. 152, % 0.00 % 3 $931,580 E1090 Other Equipment $7.50 S.F. 152, % % -20 $1,259, $1,145,385 E2010 Fixed Furnishings $5.08 S.F. 152, % % -20 $853, $775,807 Total % % $13,156, $29,411,199 Mar 11, 2017 Page 42 of 161
43 Campus Assessment Report Main Building Mar 11, 2017 Page 43 of 161


44 Campus Assessment Report Main Building System Notes The facility description in the executive summary contains an overview of each system. The photos of each system and any associated notes listed below provide additional information on select systems found within the facility: B Floor Construction B Exterior Walls Mar 11, 2017 Page 44 of 161
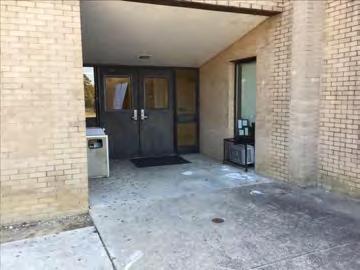
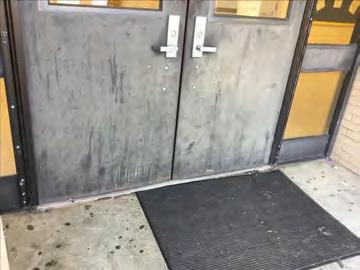
45 Campus Assessment Report Main Building B Exterior Windows B Exterior Doors Mar 11, 2017 Page 45 of 161
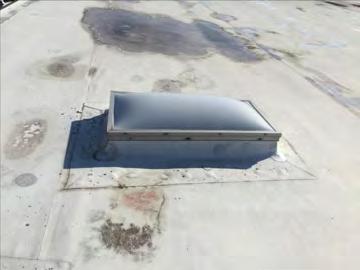
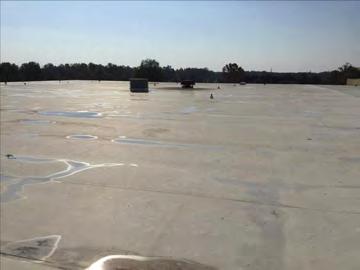
46 Campus Assessment Report Main Building B Single Ply Membrane B Roof Openings C Partitions Mar 11, 2017 Page 46 of 161
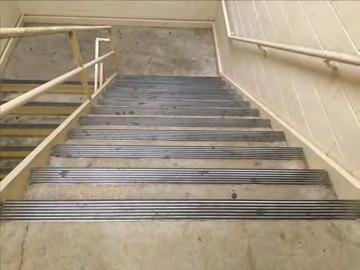
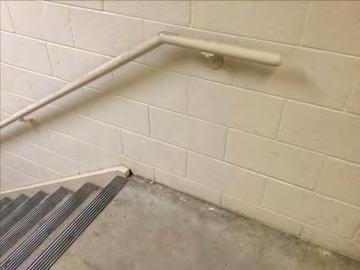
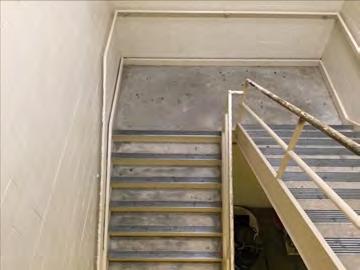
47 Campus Assessment Report Main Building C Interior Doors C Fittings C Stair Construction Mar 11, 2017 Page 47 of 161

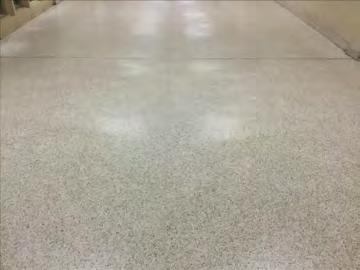

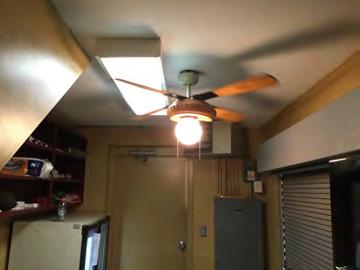
48 Campus Assessment Report Main Building C Wall Finishes C Floor Finishes C Ceiling Finishes Mar 11, 2017 Page 48 of 161


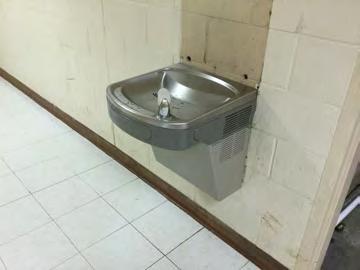
49 Campus Assessment Report Main Building D Elevators and Lifts D Plumbing Fixtures D Domestic Water Distribution Mar 11, 2017 Page 49 of 161
50 Campus Assessment Report Main Building D Sanitary Waste D Rain Water Drainage D Heat Generating Systems Mar 11, 2017 Page 50 of 161


51 Campus Assessment Report Main Building D Cooling Generating Systems D Distribution Systems D Terminal & Package Units Mar 11, 2017 Page 51 of 161


52 Campus Assessment Report Main Building D Controls & Instrumentation D Electrical Service/Distribution D Branch Wiring Mar 11, 2017 Page 52 of 161


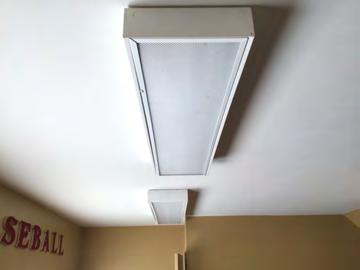
53 Campus Assessment Report Main Building D Lighting D Security & Detection Systems D Fire & Alarm Systems Mar 11, 2017 Page 53 of 161
54 Campus Assessment Report Main Building D Data Communication E Institutional Equipment E Other Equipment Mar 11, 2017 Page 54 of 161


55 Campus Assessment Report Main Building E Fixed Furnishings Mar 11, 2017 Page 55 of 161
56 Campus Assessment Report Main Building Renewal Schedule ecomet forecasts future Capital Renewal projects for expiring systems based on the Calculated Next Renewal year found in the system listing. There is a 3% yearly inflation factor applied to the system costs expiring in the future. The table below reflects Capital Renewal projects over the next 10 years. Blank cells (or $0) indicate no systems are scheduled for renewal in that year. Inflation Rate: 3% System Current Deficiencies Total Total: $13,156,962 $0 $0 $4,899,403 $2,147,880 $0 $0 $0 $1,506,656 $2,138,585 $589,244 $24,438,730 * A - Substructure $0 $0 $0 $0 $0 $0 $0 $0 $0 $0 $0 $0 * A10 - Foundations $0 $0 $0 $0 $0 $0 $0 $0 $0 $0 $0 $0 * A Standard Foundations $0 $0 $0 $0 $0 $0 $0 $0 $0 $0 $0 $0 * A Slab on Grade $0 $0 $0 $0 $0 $0 $0 $0 $0 $0 $0 $0 * A20 - Basement Construction $0 $0 $0 $0 $0 $0 $0 $0 $0 $0 $0 $0 * A Basement Excavation $0 $0 $0 $0 $0 $0 $0 $0 $0 $0 $0 $0 * A Basement Walls $0 $0 $0 $0 $0 $0 $0 $0 $0 $0 $0 $0 B - Shell $0 $0 $0 $0 $0 $0 $0 $0 $0 $0 $0 $0 B10 - Superstructure $0 $0 $0 $0 $0 $0 $0 $0 $0 $0 $0 $0 * B Floor Construction $0 $0 $0 $0 $0 $0 $0 $0 $0 $0 $0 $0 * B Roof Construction $0 $0 $0 $0 $0 $0 $0 $0 $0 $0 $0 $0 B20 - Exterior Enclosure $0 $0 $0 $0 $0 $0 $0 $0 $0 $0 $0 $0 * B Exterior Walls $0 $0 $0 $0 $0 $0 $0 $0 $0 $0 $0 $0 B Exterior Windows $2,190,587 $0 $0 $0 $0 $0 $0 $0 $0 $0 $0 $2,190,587 B Exterior Doors $137,752 $0 $0 $0 $0 $0 $0 $0 $0 $0 $0 $137,752 B30 - Roofing $0 $0 $0 $0 $0 $0 $0 $0 $0 $0 $0 $0 B Roof Coverings $0 $0 $0 $0 $0 $0 $0 $0 $0 $0 $0 $0 B Single Ply Membrane $0 $0 $0 $0 $0 $0 $0 $0 $0 $2,138,585 $0 $2,138,585 B Roof Openings $0 $0 $0 $0 $0 $0 $0 $0 $0 $0 $0 $0 C - Interiors $0 $0 $0 $0 $0 $0 $0 $0 $0 $0 $0 $0 C10 - Interior Construction $0 $0 $0 $0 $0 $0 $0 $0 $0 $0 $0 $0 * C Partitions $0 $0 $0 $0 $0 $0 $0 $0 $0 $0 $0 $0 C Interior Doors $418,295 $0 $0 $0 $0 $0 $0 $0 $0 $0 $0 $418,295 C Fittings $251,985 $0 $0 $0 $0 $0 $0 $0 $0 $0 $0 $251,985 C20 - Stairs $0 $0 $0 $0 $0 $0 $0 $0 $0 $0 $0 $0 Mar 11, 2017 Page 56 of 161
57 Campus Assessment Report Main Building * C Stair Construction $0 $0 $0 $0 $0 $0 $0 $0 $0 $0 $0 $0 C30 - Interior Finishes $0 $0 $0 $0 $0 $0 $0 $0 $0 $0 $0 $0 C Wall Finishes $438,453 $0 $0 $0 $0 $0 $0 $0 $0 $0 $589,244 $1,027,697 C Floor Finishes $1,876,446 $0 $0 $0 $0 $0 $0 $0 $0 $0 $0 $1,876,446 C Ceiling Finishes $0 $0 $0 $0 $0 $0 $0 $0 $0 $0 $0 $0 D - Services $0 $0 $0 $0 $0 $0 $0 $0 $0 $0 $0 $0 D10 - Conveying $0 $0 $0 $0 $0 $0 $0 $0 $0 $0 $0 $0 D Elevators and Lifts $166,310 $0 $0 $0 $0 $0 $0 $0 $0 $0 $0 $166,310 D20 - Plumbing $0 $0 $0 $0 $0 $0 $0 $0 $0 $0 $0 $0 D Plumbing Fixtures $1,515,268 $0 $0 $0 $0 $0 $0 $0 $0 $0 $0 $1,515,268 D Domestic Water Distribution $282,223 $0 $0 $0 $0 $0 $0 $0 $0 $0 $0 $282,223 D Sanitary Waste $443,493 $0 $0 $0 $0 $0 $0 $0 $0 $0 $0 $443,493 D Rain Water Drainage $0 $0 $0 $0 $0 $0 $0 $0 $0 $0 $0 $0 D30 - HVAC $0 $0 $0 $0 $0 $0 $0 $0 $0 $0 $0 $0 D Heat Generating Systems $0 $0 $0 $0 $0 $0 $0 $0 $1,506,656 $0 $0 $1,506,656 D Cooling Generating Systems $0 $0 $0 $1,787,943 $0 $0 $0 $0 $0 $0 $0 $1,787,943 D Distribution Systems $1,434,633 $0 $0 $0 $0 $0 $0 $0 $0 $0 $0 $1,434,633 D Terminal & Package Units $285,583 $0 $0 $0 $0 $0 $0 $0 $0 $0 $0 $285,583 D Controls & Instrumentation $0 $0 $0 $0 $0 $0 $0 $0 $0 $0 $0 $0 D40 - Fire Protection $0 $0 $0 $0 $0 $0 $0 $0 $0 $0 $0 $0 D Sprinklers $623,242 $0 $0 $0 $0 $0 $0 $0 $0 $0 $0 $623,242 D Standpipes $95,754 $0 $0 $0 $0 $0 $0 $0 $0 $0 $0 $95,754 D50 - Electrical $0 $0 $0 $0 $0 $0 $0 $0 $0 $0 $0 $0 D Electrical Service/Distribution $272,143 $0 $0 $0 $0 $0 $0 $0 $0 $0 $0 $272,143 D Branch Wiring $0 $0 $0 $0 $879,195 $0 $0 $0 $0 $0 $0 $879,195 D Lighting $0 $0 $0 $1,991,701 $0 $0 $0 $0 $0 $0 $0 $1,991,701 D Communications and Security $0 $0 $0 $0 $0 $0 $0 $0 $0 $0 $0 $0 D Security & Detection Systems $0 $0 $0 $0 $380,038 $0 $0 $0 $0 $0 $0 $380,038 D Fire & Alarm Systems $611,483 $0 $0 $0 $0 $0 $0 $0 $0 $0 $0 $611,483 D Data Communication $0 $0 $0 $0 $888,648 $0 $0 $0 $0 $0 $0 $888,648 E - Equipment & Furnishings $0 $0 $0 $0 $0 $0 $0 $0 $0 $0 $0 $0 E10 - Equipment $0 $0 $0 $0 $0 $0 $0 $0 $0 $0 $0 $0 E Institutional Equipment $0 $0 $0 $1,119,759 $0 $0 $0 $0 $0 $0 $0 $1,119,759 Mar 11, 2017 Page 57 of 161
58 Campus Assessment Report Main Building E Other Equipment $1,259,924 $0 $0 $0 $0 $0 $0 $0 $0 $0 $0 $1,259,924 E20 - Furnishings $0 $0 $0 $0 $0 $0 $0 $0 $0 $0 $0 $0 E Fixed Furnishings $853,388 $0 $0 $0 $0 $0 $0 $0 $0 $0 $0 $853,388 * Indicates non-renewable system Mar 11, 2017 Page 58 of 161
59 Campus Assessment Report Main Building Forecasted Capital Renewal Requirement The following chart shows the current building deficiencies and forecasting capital renewal or sustainment requirements over the next ten years. $15,000,000 $13,156,962 $10,000,000 $5,000,000 $4,899,403 $2,147,880 $2,138,585 $1,506,656 $589,244 $0 Current Deficiencies Mar 11, 2017 Page 59 of 161
60 Campus Assessment Report Main Building Deficiency Summary by System Current deficiencies included assemblies that have reached or exceeded their design life or components of the assemblies that are in need of repair. Assemblies that have reached their design life are identified as current deficiencies and assigned the distress 'Beyond Useful Life'. The following chart lists all current deficiencies associated with this facility. B2020 Exterior Windows $2,190, C3010 Wall Finishes $438, C3020 Floor Finishes $1,876, D2010 Plumbing Fixtures $1,515, D2030 Sanitary Waste $443, D3040 Distribution Systems $1,434, D4010 Sprinklers $623, D Fire & Alarm Systems $611, E1090 Other Equipment $1,259, E2010 Fixed Furnishings $853, Other $1,910, Budget Estimate Total: $13,156, Mar 11, 2017 Page 60 of 161
61 Campus Assessment Report Main Building Deficiency Summary by Priority The following chart shows the total repair costs broken down by priority. Assessors assigned deficiencies within ecomet to one of the following priority categories: 1 - Currently Critical (Immediate) 2 - Potentially Critical (Year 1) - $611, Necessary/Not Yet Critical (Years 2-5) - $11,826, Recommended (Years 6-10) - $718, Codes or Standards Compliance Budget Estimate Total: $13,156, Mar 11, 2017 Page 61 of 161
62 Campus Assessment Report Main Building Deficiency By Priority Investment Table The table below shows the current investment cost grouped by deficiency priority and building system. 1 - Currently Critical (Immediate) 2 - Potentially Critical (Year 1) 3 - Necessary/Not Yet Critical (Years 2-5) 4 - Recommended (Years 6-10) 5 - Codes or Standards Compliance System Code System Description Total B2020 Exterior Windows $0.00 $0.00 $2,190, $0.00 $0.00 $2,190, B2030 Exterior Doors $0.00 $0.00 $137, $0.00 $0.00 $137, C1020 Interior Doors $0.00 $0.00 $418, $0.00 $0.00 $418, C1030 Fittings $0.00 $0.00 $251, $0.00 $0.00 $251, C3010 Wall Finishes $0.00 $0.00 $438, $0.00 $0.00 $438, C3020 Floor Finishes $0.00 $0.00 $1,876, $0.00 $0.00 $1,876, D1010 Elevators and Lifts $0.00 $0.00 $166, $0.00 $0.00 $166, D2010 Plumbing Fixtures $0.00 $0.00 $1,515, $0.00 $0.00 $1,515, D2020 Domestic Water Distribution $0.00 $0.00 $282, $0.00 $0.00 $282, D2030 Sanitary Waste $0.00 $0.00 $443, $0.00 $0.00 $443, D3040 Distribution Systems $0.00 $0.00 $1,434, $0.00 $0.00 $1,434, D3050 Terminal & Package Units $0.00 $0.00 $285, $0.00 $0.00 $285, D4010 Sprinklers $0.00 $0.00 $0.00 $623, $0.00 $623, D4020 Standpipes $0.00 $0.00 $0.00 $95, $0.00 $95, D5010 Electrical Service/Distribution $0.00 $0.00 $272, $0.00 $0.00 $272, D Fire & Alarm Systems $0.00 $611, $0.00 $0.00 $0.00 $611, E1090 Other Equipment $0.00 $0.00 $1,259, $0.00 $0.00 $1,259, E2010 Fixed Furnishings $0.00 $0.00 $853, $0.00 $0.00 $853, Total: $0.00 $611, $11,826, $718, $0.00 $13,156, Mar 11, 2017 Page 62 of 161
63 Campus Assessment Report Main Building Deficiency Summary by Category The following chart shows the total repair costs broken down by deficiency categories. Assessors assigned deficiencies to one of the following categories: Building Code Compliance - $718, Deferred Maintenance - $11,826, Deferred Maintenance / Building Code Compliance - $611, Budget Estimate Total: $13,156, Mar 11, 2017 Page 63 of 161
64 Campus Assessment Report Main Building Deficiency Details by Priority The deficiency detail notes listed below provide additional information on identified deficiencies found within the facility. Priority 2 - Potentially Critical (Year 1): D Fire & Alarm Systems Location: Distress: Category: Priority: Correction: Qty: Unit of Measure: Estimate: Assessor Name: Date Created: Throughout the building Beyond Service Life Deferred Maintenance / Building Code Compliance 2 - Potentially Critical (Year 1) Renew System 152, S.F. $611, Eduardo Lopez 12/05/2016 Notes: The original fire alarm system is aged, and should be replaced. Mar 11, 2017 Page 64 of 161
65 Campus Assessment Report Main Building Priority 3 - Necessary/Not Yet Critical (Years 2-5): B Exterior Windows Location: Distress: Category: Priority: Correction: Qty: Unit of Measure: Estimate: Assessor Name: Date Created: Exterior Beyond Service Life Deferred Maintenance 3 - Necessary/Not Yet Critical (Years 2-5) Renew System 152, S.F. $2,190, Eduardo Lopez 12/05/2016 Notes: The original windows are aged, seals damaged, and should be replaced. B Exterior Doors Location: Distress: Category: Priority: Correction: Qty: Unit of Measure: Estimate: Assessor Name: Date Created: Exterior Exits Beyond Service Life Deferred Maintenance 3 - Necessary/Not Yet Critical (Years 2-5) Renew System 152, S.F. $137, Eduardo Lopez 12/05/2016 Notes: The original exterior doors are aged, and should be replaced. Mar 11, 2017 Page 65 of 161
66 Campus Assessment Report Main Building C Interior Doors Location: Distress: Category: Priority: Correction: Qty: Unit of Measure: Estimate: Assessor Name: Date Created: Throughout the building Beyond Service Life Deferred Maintenance 3 - Necessary/Not Yet Critical (Years 2-5) Renew System 152, S.F. $418, Eduardo Lopez 12/05/2016 Notes: The interior doors are aged, failing, most hardware is not ADA or code compliant and should be replaced. C Fittings Location: Distress: Category: Priority: Correction: Qty: Unit of Measure: Estimate: Assessor Name: Date Created: Throughout the building Beyond Service Life Deferred Maintenance 3 - Necessary/Not Yet Critical (Years 2-5) Renew System 152, S.F. $251, Eduardo Lopez 12/05/2016 Notes: The fittings throughout the building are aged, in marginal condition, and should be replaced. Mar 11, 2017 Page 66 of 161
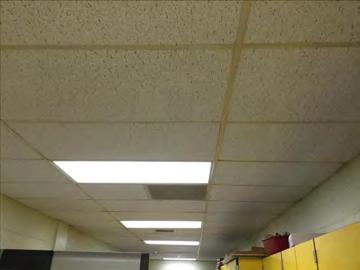
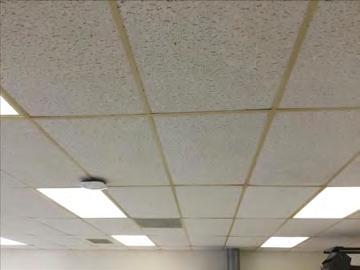
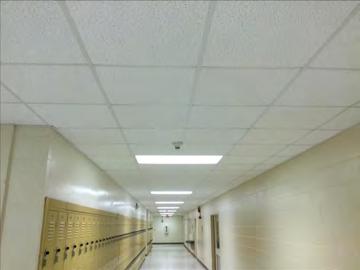
67 Campus Assessment Report Main Building C Wall Finishes Location: Distress: Category: Priority: Correction: Qty: Unit of Measure: Estimate: Assessor Name: Date Created: Throughout the building Damaged Deferred Maintenance 3 - Necessary/Not Yet Critical (Years 2-5) Renew System 152, S.F. $438, Eduardo Lopez 12/05/2016 Notes: The wall finishes are aged, scuffed, fading, stained, and should be re-painted. C Floor Finishes Location: Distress: Category: Priority: Correction: Qty: Unit of Measure: Estimate: Assessor Name: Date Created: Throughout the building Damaged Deferred Maintenance 3 - Necessary/Not Yet Critical (Years 2-5) Renew System 152, S.F. $1,876, Eduardo Lopez 12/05/2016 Notes: The original flooring is in poor conditions, with different areas bubbling or separating from the substrate, and should be replaced. Mar 11, 2017 Page 67 of 161
68 Campus Assessment Report Main Building D Elevators and Lifts Location: Distress: Category: Priority: Correction: Qty: Unit of Measure: Estimate: Assessor Name: Date Created: Corridor Beyond Service Life Deferred Maintenance 3 - Necessary/Not Yet Critical (Years 2-5) Renew System 152, S.F. $166, Eduardo Lopez 12/05/2016 Notes: The elevator is aged, and will becoming logistically unsupportable. The elevator should be upgraded to meet all applicable codes. D Plumbing Fixtures Location: Distress: Category: Priority: Correction: Qty: Unit of Measure: Estimate: Assessor Name: Date Created: Restroom Beyond Service Life Deferred Maintenance 3 - Necessary/Not Yet Critical (Years 2-5) Renew System 152, S.F. $1,515, Eduardo Lopez 12/05/2016 Notes: Some of the plumbling has been replaced. As a system they are in operational conditions. However, they are aged, not ADA compliant and should be replaced with a low-flow water fixtures. Mar 11, 2017 Page 68 of 161
69 Campus Assessment Report Main Building D Domestic Water Distribution Location: Distress: Category: Priority: Correction: Qty: Unit of Measure: Estimate: Assessor Name: Date Created: Throughout the building Beyond Service Life Deferred Maintenance 3 - Necessary/Not Yet Critical (Years 2-5) Renew System 152, S.F. $282, Eduardo Lopez 12/05/2016 Notes: There are no reported issues or observed deficiencies with the domestic water piping. Due to the age of the pipe there can be internal pitting corrosion that may be a costly problem that leads to the formation of pinhole leaks and possible water contamination. The water heaters and piping should be replaced. D Sanitary Waste Location: Distress: Category: Priority: Correction: Qty: Unit of Measure: Estimate: Assessor Name: Date Created: Throughout the building Beyond Service Life Deferred Maintenance 3 - Necessary/Not Yet Critical (Years 2-5) Renew System 152, S.F. $443, Eduardo Lopez 12/05/2016 Notes: The sanitary waste system is aged, has reported periodic failures, and should be replaced. Mar 11, 2017 Page 69 of 161
70 Campus Assessment Report Main Building D Distribution Systems Location: Distress: Category: Priority: Correction: Qty: Unit of Measure: Estimate: Assessor Name: Date Created: Throughout the building Beyond Service Life Deferred Maintenance 3 - Necessary/Not Yet Critical (Years 2-5) Renew System 152, S.F. $1,434, Eduardo Lopez 12/05/2016 Notes: The HVAC distribution piping and air handlers are aged, worn, becoming logistically unsupportable and should be replaced with an energy efficient model. D Terminal & Package Units Location: Distress: Category: Priority: Correction: Qty: Unit of Measure: Estimate: Assessor Name: Date Created: Exterior Beyond Service Life Deferred Maintenance 3 - Necessary/Not Yet Critical (Years 2-5) Renew System 152, S.F. $285, Eduardo Lopez 12/05/2016 Notes: The coolant and refrigerant condensing unit are aged and should be scheduled for replacement. Mar 11, 2017 Page 70 of 161
71 Campus Assessment Report Main Building D Electrical Service/Distribution Location: Distress: Category: Priority: Correction: Qty: Unit of Measure: Estimate: Assessor Name: Date Created: Throughout the building Beyond Service Life Deferred Maintenance 3 - Necessary/Not Yet Critical (Years 2-5) Renew System 152, S.F. $272, Eduardo Lopez 12/05/2016 Notes: The electrical distribution system is aged, becoming logistically unsupportable, and should be replaced. E Other Equipment Location: Distress: Category: Priority: Correction: Qty: Unit of Measure: Estimate: Assessor Name: Date Created: Gym-Kitchen Beyond Service Life Deferred Maintenance 3 - Necessary/Not Yet Critical (Years 2-5) Renew System 152, S.F. $1,259, Eduardo Lopez 12/05/2016 Notes: The original kitchen equipment, gym equipment is operating but is aged, becoming logistically un-supportable, and should be replaced. Mar 11, 2017 Page 71 of 161
72 Campus Assessment Report Main Building E Fixed Furnishings Location: Distress: Category: Priority: Correction: Qty: Unit of Measure: Estimate: Assessor Name: Date Created: Throughout the building Damaged Deferred Maintenance 3 - Necessary/Not Yet Critical (Years 2-5) Renew System 152, S.F. $853, Eduardo Lopez 12/05/2016 Notes: The fixed furnishings are aged, in marginal condition, and should be replaced. Mar 11, 2017 Page 72 of 161
73 Campus Assessment Report Main Building Priority 4 - Recommended (Years 6-10): D Sprinklers This deficiency has no image. Location: Distress: Category: Priority: Correction: Qty: Unit of Measure: Estimate: Assessor Name: Date Created: Throughout the building Missing Building Code Compliance 4 - Recommended (Years 6-10) Renew System 152, S.F. $623, Eduardo Lopez 12/05/2016 Notes: There is no fire sprinkler system. D Standpipes This deficiency has no image. Location: Distress: Category: Priority: Correction: Qty: Unit of Measure: Estimate: Assessor Name: Date Created: Throughout the building Missing Building Code Compliance 4 - Recommended (Years 6-10) Renew System 152, S.F. $95, Eduardo Lopez 12/05/2016 Notes: There is no fire sprinkler system. Mar 11, 2017 Page 73 of 161
74 Campus Assessment Report Baseball Concession/Restroom Executive Summary Building condition is evaluated based on the functional systems and elements of a building and organized according to the UNIFORMAT II Elemental Classification. The grouping of these systems and elements and applying a current replacement value to them develops a representative building cost model. Cost Models are developed for similar building types and functions. Systems and their elements are evaluated based on their current replacement values, life cycles, installation dates and next renewal dates. Systems and their elements that are within their useful lives are further evaluated to identify current deficient conditions that may have a significant impact on a system's or element's remaining service life, and to determine if they are beyond their predicted expected life. The system's or element's current replacement value is based on RS Means Commercial Cost Data. Following are the cost model's system details for this facility. The Replacement Value is the amount needed to replace the property of the same present scope. The Repair Cost (the sum of the cost to repair/replace the Deficiencies) represents the budgeted contractor-installed costs plus owner's soft costs for the repair, replacement or renewal for a component or system level deficiency. It excludes contributing costs for other components or systems that might also be associated with the corrective actions due to packaging of the work. Facility Condition Index ( FCI) is an industry-standard measurement of facility condition calculated as the ratio of the costs to correct a facility's deficiencies (Condition Needs) to the facility's Current Replacement Value. It ranges from 0% (new) to 100% (very poor - beyond service life). The Remaining Service Life Index (RSLI) is calculated as the sum of a renewable system's Remaining Service Life (RSL) divided by the sum of a system's Replacement Value (both values exclude soft-cost to simplify calculation updates) expressed as a percentage ranging from 100% (new) to 0% (expired). The relationship between the key metrics FCI and RSLI is an important indicator, at either the facility, building, system, or component levels, of the condition trend and the imminent need for capital renewal. These indices exist in an inverse relationship wherein the FCI increases when systems reach their expected life-cycle age, whereas the RSLI decreases annually indicating the relative time remaining before reaching the life-cycle expiration age. For example, a facility or a system with a high RSLI and a low FCI indicates it is in the early portion of its useful life. However, a low RSLI indicates that expiration dates are approaching at which point the FCI would increase. The term FCA Score is the inverse of Total FCI and calculated as 100-Total FCI (without the %) where 100 is best and 0 is worst condition. Function: Gross Area (SF): Year Built: Last Renovation: Replacement Value: Repair Cost: Total FCI: Total RSLI: HS -High School 1, $152,472 $7, % % FCA Score: Description: The narrative for this building is included in the Executive Summary Description at the front of this report. Attributes: This asset has no attributes. Mar 11, 2017 Page 74 of 161
75 Campus Assessment Report Baseball Concession/Restroom Dashboard Summary Function: Year Built: Repair Cost: FCI: HS -High School 1990 $7, % Gross Area: Last Renovation: Replacement Value: RSLI%: 1,200 $152, % Deficiency By Category Deficiency By Priority Deferred Maintenance - $7, Currently Critical (Immediate) 2 - Potentially Critical (Year 1) 3 - Necessary/Not Yet Critical (Years 2-5) - $7, Recommended (Years 6-10) 5 - Codes or Standards Compliance $6,000 $5,000 $4,000 $3,000 $2,000 $1,000 $0 Deficiency By System $6K Roofing $60,000 $50,000 $40,000 $30,000 $20,000 $10,000 $0 10 Year Investment Forecast $60K $35K $13K $0 $0 $0 $0 $0 $0 $ Mar 11, 2017 Page 75 of 161
76 Campus Assessment Report Baseball Concession/Restroom Condition Summary The Table below shows the RSLI and FCI for each major building system shown at the UNIFORMAT classification Level II. Note that Systems with lower FCIs require less investment than systems with higher FCIs. UNIFORMAT Classification RSLI % FCI % Current Repair Cost A10 - Foundations % 0.00 % $0.00 B10 - Superstructure % 0.00 % $0.00 B20 - Exterior Enclosure % 0.00 % $0.00 B30 - Roofing 0.00 % % $7, C10 - Interior Construction % 0.00 % $0.00 C30 - Interior Finishes % 0.00 % $0.00 D20 - Plumbing % 0.00 % $0.00 D30 - HVAC % 0.00 % $0.00 D50 - Electrical % 0.00 % $0.00 E20 - Furnishings % 0.00 % $0.00 Totals: % 4.96 % $7, Mar 11, 2017 Page 76 of 161
.")
.")
77 Campus Assessment Report Baseball Concession/Restroom Photo Album The photo album consists of the various cardinal directions of the building.. 1). South Elevation - Nov 21, ). East Elevation - Nov 21, ). West Elevation - Nov 21, ). North Elevation - Nov 21, 2016 Mar 11, 2017 Page 77 of 161
78 Campus Assessment Report Baseball Concession/Restroom Condition Detail This section of the report contains results of the Facility Condition Assessment. The building is separated into system components based on UNIFORMAT II. The columns in the System Listing table represent the following: 1. System Code: A code that identifies the system. 2. System Description: A brief description of a system present in the building. 3. Unit Price $: The unit price of the system. 4. UoM: The unit of measure of the system. 5. Qty: The quantity for the system 6. Life: Building Owners and Managers Association (BOMA) recommended system design life. 7. Year Installed: The date of system installation. 8. Calc Next Renewal Year: The date of system expiration based on the life, NR stands for non renewable. 9. Next Renewal Year: The suggested system expiration date by the assessor based on visual inspection. 10. RSLI: The Remaining Service Life Index of the system. 11. FCI: The Facility Condition Index of the system. 12. RSL: Remaining Service Life in years. 13. ecr: ecomet Condition Rating (not used in this assessment). 14. Deficiency $: The financial investment to repair/replace system to address deficiency. 15. Replacement Value $: The replacement cost of the system. Mar 11, 2017 Page 78 of 161
79 Campus Assessment Report Baseball Concession/Restroom System Listing The System Listing table below lists each of the systems organized by their UNIFORMAT II classification. The assessment team was tasked with recording the most recent replacement year of each system, determining the remaining service life based on the theoretical life, and evaluating the condition to confirm the forecast next replacement year. The system listing is the basis for all data contained in the Building Assessment Report. System Code System Description Unit Price $ UoM Qty Life Year Installed Calc Next Renewal Year Next Renewal Year RSLI% FCI% RSL ecr Deficiency $ Replacement Value $ A1010 Standard Foundations $6.93 S.F. 1, % 0.00 % 73 $8,316 A1030 Slab on Grade $7.37 S.F. 1, % 0.00 % 73 $8,844 B1020 Roof Construction $5.98 S.F. 1, % 0.00 % 73 $7,176 B2010 Exterior Walls $18.04 S.F. 1, % 0.00 % 73 $21,648 B2020 Exterior Windows $6.47 S.F. 1, % 0.00 % 3 $7,764 B2030 Exterior Doors $0.91 S.F. 1, % 0.00 % 3 $1,092 B Asphalt Shingles $4.32 S.F. 1, % % -7 $7, $5,184 C1010 Partitions $10.34 S.F. 1, % 0.00 % 48 $12,408 C1020 Interior Doors $2.20 S.F. 1, % 0.00 % 3 $2,640 C1030 Fittings $8.47 S.F. 1, % 0.00 % 4 $10,164 C3010 Wall Finishes $7.46 S.F. 1, % 0.00 % 4 $8,952 C3020 Floor Finishes $3.50 S.F. 1, % 0.00 % 3 $4,200 C3030 Ceiling Finishes $7.96 S.F. 1, % 0.00 % 8 $9,552 D2010 Plumbing Fixtures $9.98 S.F. 1, % 0.00 % 3 $11,976 D2020 Domestic Water Distribution $0.84 S.F. 1, % 0.00 % 3 $1,008 D2030 Sanitary Waste $5.94 S.F. 1, % 0.00 % 3 $7,128 D3040 Distribution Systems $5.35 S.F. 1, % 0.00 % 3 $6,420 D3050 Terminal & Package Units $1.62 S.F. 1, % 0.00 % 4 $1,944 D5010 Electrical Service/Distribution $1.47 S.F. 1, % 0.00 % 13 $1,764 D5020 Branch Wiring $2.55 S.F. 1, % 0.00 % 3 $3,060 D5020 Lighting $3.58 S.F. 1, % 0.00 % 3 $4,296 E2010 Fixed Furnishings $5.78 S.F. 1, % 0.00 % 4 $6,936 Total % 4.96 % $7, $152,472 Mar 11, 2017 Page 79 of 161


80 Campus Assessment Report Baseball Concession/Restroom System Notes The facility description in the executive summary contains an overview of each system. The photos of each system and any associated notes listed below provide additional information on select systems found within the facility: B Exterior Walls B Exterior Windows B Exterior Doors Mar 11, 2017 Page 80 of 161


81 Campus Assessment Report Baseball Concession/Restroom B Asphalt Shingles C Partitions C Interior Doors Mar 11, 2017 Page 81 of 161


82 Campus Assessment Report Baseball Concession/Restroom C Fittings C Wall Finishes C Floor Finishes Mar 11, 2017 Page 82 of 161


83 Campus Assessment Report Baseball Concession/Restroom C Ceiling Finishes D Plumbing Fixtures D Domestic Water Distribution Mar 11, 2017 Page 83 of 161


84 Campus Assessment Report Baseball Concession/Restroom D Sanitary Waste D Distribution Systems D Terminal & Package Units Mar 11, 2017 Page 84 of 161


85 Campus Assessment Report Baseball Concession/Restroom D Electrical Service/Distribution D Branch Wiring D Lighting Mar 11, 2017 Page 85 of 161


86 Campus Assessment Report Baseball Concession/Restroom E Fixed Furnishings Mar 11, 2017 Page 86 of 161
87 Campus Assessment Report Baseball Concession/Restroom Renewal Schedule ecomet forecasts future Capital Renewal projects for expiring systems based on the Calculated Next Renewal year found in the system listing. There is a 3% yearly inflation factor applied to the system costs expiring in the future. The table below reflects Capital Renewal projects over the next 10 years. Blank cells (or $0) indicate no systems are scheduled for renewal in that year. Inflation Rate: 3% System Current Deficiencies Total Total: $7,569 $0 $0 $59,601 $34,660 $0 $0 $0 $13,310 $0 $0 $115,140 * A - Substructure $0 $0 $0 $0 $0 $0 $0 $0 $0 $0 $0 $0 * A10 - Foundations $0 $0 $0 $0 $0 $0 $0 $0 $0 $0 $0 $0 * A Standard Foundations $0 $0 $0 $0 $0 $0 $0 $0 $0 $0 $0 $0 * A Slab on Grade $0 $0 $0 $0 $0 $0 $0 $0 $0 $0 $0 $0 B - Shell $0 $0 $0 $0 $0 $0 $0 $0 $0 $0 $0 $0 B10 - Superstructure $0 $0 $0 $0 $0 $0 $0 $0 $0 $0 $0 $0 * B Roof Construction $0 $0 $0 $0 $0 $0 $0 $0 $0 $0 $0 $0 B20 - Exterior Enclosure $0 $0 $0 $0 $0 $0 $0 $0 $0 $0 $0 $0 * B Exterior Walls $0 $0 $0 $0 $0 $0 $0 $0 $0 $0 $0 $0 B Exterior Windows $0 $0 $0 $9,332 $0 $0 $0 $0 $0 $0 $0 $9,332 B Exterior Doors $0 $0 $0 $1,312 $0 $0 $0 $0 $0 $0 $0 $1,312 B30 - Roofing $0 $0 $0 $0 $0 $0 $0 $0 $0 $0 $0 $0 B Roof Coverings $0 $0 $0 $0 $0 $0 $0 $0 $0 $0 $0 $0 B Asphalt Shingles $7,569 $0 $0 $0 $0 $0 $0 $0 $0 $0 $0 $7,569 C - Interiors $0 $0 $0 $0 $0 $0 $0 $0 $0 $0 $0 $0 C10 - Interior Construction $0 $0 $0 $0 $0 $0 $0 $0 $0 $0 $0 $0 * C Partitions $0 $0 $0 $0 $0 $0 $0 $0 $0 $0 $0 $0 C Interior Doors $0 $0 $0 $3,173 $0 $0 $0 $0 $0 $0 $0 $3,173 C Fittings $0 $0 $0 $0 $12,583 $0 $0 $0 $0 $0 $0 $12,583 C30 - Interior Finishes $0 $0 $0 $0 $0 $0 $0 $0 $0 $0 $0 $0 C Wall Finishes $0 $0 $0 $0 $11,083 $0 $0 $0 $0 $0 $0 $11,083 C Floor Finishes $0 $0 $0 $5,048 $0 $0 $0 $0 $0 $0 $0 $5,048 C Ceiling Finishes $0 $0 $0 $0 $0 $0 $0 $0 $13,310 $0 $0 $13,310 D - Services $0 $0 $0 $0 $0 $0 $0 $0 $0 $0 $0 $0 D20 - Plumbing $0 $0 $0 $0 $0 $0 $0 $0 $0 $0 $0 $0 Mar 11, 2017 Page 87 of 161
88 Campus Assessment Report Baseball Concession/Restroom D Plumbing Fixtures $0 $0 $0 $14,396 $0 $0 $0 $0 $0 $0 $0 $14,396 D Domestic Water Distribution $0 $0 $0 $1,212 $0 $0 $0 $0 $0 $0 $0 $1,212 D Sanitary Waste $0 $0 $0 $8,568 $0 $0 $0 $0 $0 $0 $0 $8,568 D30 - HVAC $0 $0 $0 $0 $0 $0 $0 $0 $0 $0 $0 $0 D Distribution Systems $0 $0 $0 $7,717 $0 $0 $0 $0 $0 $0 $0 $7,717 D Terminal & Package Units $0 $0 $0 $0 $2,406 $0 $0 $0 $0 $0 $0 $2,406 D50 - Electrical $0 $0 $0 $0 $0 $0 $0 $0 $0 $0 $0 $0 D Electrical Service/Distribution $0 $0 $0 $0 $0 $0 $0 $0 $0 $0 $0 $0 D Branch Wiring $0 $0 $0 $3,678 $0 $0 $0 $0 $0 $0 $0 $3,678 D Lighting $0 $0 $0 $5,164 $0 $0 $0 $0 $0 $0 $0 $5,164 E - Equipment & Furnishings $0 $0 $0 $0 $0 $0 $0 $0 $0 $0 $0 $0 E20 - Furnishings $0 $0 $0 $0 $0 $0 $0 $0 $0 $0 $0 $0 E Fixed Furnishings $0 $0 $0 $0 $8,588 $0 $0 $0 $0 $0 $0 $8,588 * Indicates non-renewable system Mar 11, 2017 Page 88 of 161
89 Campus Assessment Report Baseball Concession/Restroom Forecasted Capital Renewal Requirement The following chart shows the current building deficiencies and forecasting capital renewal or sustainment requirements over the next ten years. $60,000 $59,601 $50,000 $40,000 $34,660 $30,000 $20,000 $13,310 $10,000 $7,569 $0 Current Deficiencies Mar 11, 2017 Page 89 of 161
90 Campus Assessment Report Baseball Concession/Restroom Deficiency Summary by System Current deficiencies included assemblies that have reached or exceeded their design life or components of the assemblies that are in need of repair. Assemblies that have reached their design life are identified as current deficiencies and assigned the distress 'Beyond Useful Life'. The following chart lists all current deficiencies associated with this facility. B Asphalt Shingles $7, Budget Estimate Total: $7, Mar 11, 2017 Page 90 of 161
91 Campus Assessment Report Baseball Concession/Restroom Deficiency Summary by Priority The following chart shows the total repair costs broken down by priority. Assessors assigned deficiencies within ecomet to one of the following priority categories: 1 - Currently Critical (Immediate) 2 - Potentially Critical (Year 1) 3 - Necessary/Not Yet Critical (Years 2-5) - $7, Recommended (Years 6-10) 5 - Codes or Standards Compliance Budget Estimate Total: $7, Mar 11, 2017 Page 91 of 161
92 Campus Assessment Report Baseball Concession/Restroom Deficiency By Priority Investment Table The table below shows the current investment cost grouped by deficiency priority and building system. 1 - Currently Critical (Immediate) 2 - Potentially Critical (Year 1) 3 - Necessary/Not Yet Critical (Years 2-5) 4 - Recommended (Years 6-10) 5 - Codes or Standards Compliance System Code System Description Total B Asphalt Shingles $0.00 $0.00 $7, $0.00 $0.00 $7, Total: $0.00 $0.00 $7, $0.00 $0.00 $7, Mar 11, 2017 Page 92 of 161
93 Campus Assessment Report Baseball Concession/Restroom Deficiency Summary by Category The following chart shows the total repair costs broken down by deficiency categories. Assessors assigned deficiencies to one of the following categories: Deferred Maintenance - $7, Budget Estimate Total: $7, Mar 11, 2017 Page 93 of 161
94 Campus Assessment Report Baseball Concession/Restroom Deficiency Details by Priority The deficiency detail notes listed below provide additional information on identified deficiencies found within the facility. Priority 3 - Necessary/Not Yet Critical (Years 2-5): B Asphalt Shingles Location: Distress: Category: Priority: Correction: Qty: Unit of Measure: Estimate: Assessor Name: Date Created: Roof Damaged Deferred Maintenance 3 - Necessary/Not Yet Critical (Years 2-5) Renew System 1, S.F. $7, Terence Davis 11/18/2016 Notes: The asphalt shingle roofing is aged, damaged and should be replaced. Mar 11, 2017 Page 94 of 161
95 Campus Assessment Report Field House Executive Summary Building condition is evaluated based on the functional systems and elements of a building and organized according to the UNIFORMAT II Elemental Classification. The grouping of these systems and elements and applying a current replacement value to them develops a representative building cost model. Cost Models are developed for similar building types and functions. Systems and their elements are evaluated based on their current replacement values, life cycles, installation dates and next renewal dates. Systems and their elements that are within their useful lives are further evaluated to identify current deficient conditions that may have a significant impact on a system's or element's remaining service life, and to determine if they are beyond their predicted expected life. The system's or element's current replacement value is based on RS Means Commercial Cost Data. Following are the cost model's system details for this facility. The Replacement Value is the amount needed to replace the property of the same present scope. The Repair Cost (the sum of the cost to repair/replace the Deficiencies) represents the budgeted contractor-installed costs plus owner's soft costs for the repair, replacement or renewal for a component or system level deficiency. It excludes contributing costs for other components or systems that might also be associated with the corrective actions due to packaging of the work. Facility Condition Index ( FCI) is an industry-standard measurement of facility condition calculated as the ratio of the costs to correct a facility's deficiencies (Condition Needs) to the facility's Current Replacement Value. It ranges from 0% (new) to 100% (very poor - beyond service life). The Remaining Service Life Index (RSLI) is calculated as the sum of a renewable system's Remaining Service Life (RSL) divided by the sum of a system's Replacement Value (both values exclude soft-cost to simplify calculation updates) expressed as a percentage ranging from 100% (new) to 0% (expired). The relationship between the key metrics FCI and RSLI is an important indicator, at either the facility, building, system, or component levels, of the condition trend and the imminent need for capital renewal. These indices exist in an inverse relationship wherein the FCI increases when systems reach their expected life-cycle age, whereas the RSLI decreases annually indicating the relative time remaining before reaching the life-cycle expiration age. For example, a facility or a system with a high RSLI and a low FCI indicates it is in the early portion of its useful life. However, a low RSLI indicates that expiration dates are approaching at which point the FCI would increase. The term FCA Score is the inverse of Total FCI and calculated as 100-Total FCI (without the %) where 100 is best and 0 is worst condition. Function: Gross Area (SF): Year Built: Last Renovation: Replacement Value: Repair Cost: Total FCI: Total RSLI: HS -High School 2, $332,300 $ % % FCA Score: Description: The narrative for this building is included in the Executive Summary Description at the front of this report. Attributes: This asset has no attributes. Mar 11, 2017 Page 95 of 161
96 Campus Assessment Report Field House Dashboard Summary Function: Year Built: Repair Cost: FCI: HS -High School 2008 $ % Gross Area: Last Renovation: Replacement Value: RSLI%: 2,000 $332, % No data found for this asset No data found for this asset No data found for this asset $50,000 $40,000 $30,000 $20,000 $10,000 $0 10 Year Investment Forecast $45K $17K $0 $0 $0 $0 $0 $0 $0 $ Mar 11, 2017 Page 96 of 161
97 Campus Assessment Report Field House Condition Summary The Table below shows the RSLI and FCI for each major building system shown at the UNIFORMAT classification Level II. Note that Systems with lower FCIs require less investment than systems with higher FCIs. UNIFORMAT Classification RSLI % FCI % Current Repair Cost A10 - Foundations % 0.00 % $0.00 B10 - Superstructure % 0.00 % $0.00 B20 - Exterior Enclosure % 0.00 % $0.00 B30 - Roofing % 0.00 % $0.00 C10 - Interior Construction % 0.00 % $0.00 C30 - Interior Finishes % 0.00 % $0.00 D20 - Plumbing % 0.00 % $0.00 D30 - HVAC % 0.00 % $0.00 D50 - Electrical % 0.00 % $0.00 E10 - Equipment % 0.00 % $0.00 E20 - Furnishings % 0.00 % $0.00 Totals: % 0.00 % $0.00 Mar 11, 2017 Page 97 of 161
.")
.")
98 Campus Assessment Report Field House Photo Album The photo album consists of the various cardinal directions of the building.. 1). West Elevation - Nov 21, ). North Elevation - Nov 21, ). East Elevation - Nov 21, ). South Elevation - Nov 21, 2016 Mar 11, 2017 Page 98 of 161
99 Campus Assessment Report Field House Condition Detail This section of the report contains results of the Facility Condition Assessment. The building is separated into system components based on UNIFORMAT II. The columns in the System Listing table represent the following: 1. System Code: A code that identifies the system. 2. System Description: A brief description of a system present in the building. 3. Unit Price $: The unit price of the system. 4. UoM: The unit of measure of the system. 5. Qty: The quantity for the system 6. Life: Building Owners and Managers Association (BOMA) recommended system design life. 7. Year Installed: The date of system installation. 8. Calc Next Renewal Year: The date of system expiration based on the life, NR stands for non renewable. 9. Next Renewal Year: The suggested system expiration date by the assessor based on visual inspection. 10. RSLI: The Remaining Service Life Index of the system. 11. FCI: The Facility Condition Index of the system. 12. RSL: Remaining Service Life in years. 13. ecr: ecomet Condition Rating (not used in this assessment). 14. Deficiency $: The financial investment to repair/replace system to address deficiency. 15. Replacement Value $: The replacement cost of the system. Mar 11, 2017 Page 99 of 161
100 Campus Assessment Report Field House System Listing The System Listing table below lists each of the systems organized by their UNIFORMAT II classification. The assessment team was tasked with recording the most recent replacement year of each system, determining the remaining service life based on the theoretical life, and evaluating the condition to confirm the forecast next replacement year. The system listing is the basis for all data contained in the Building Assessment Report. System Code System Description Unit Price $ UoM Qty Life Year Installed Calc Next Renewal Year Next Renewal Year RSLI% FCI% RSL ecr Deficiency $ Replacement Value $ A1010 Standard Foundations $6.93 S.F. 2, % 0.00 % 91 $13,860 A1030 Slab on Grade $7.37 S.F. 2, % 0.00 % 91 $14,740 B1020 Roof Construction $5.98 S.F. 2, % 0.00 % 91 $11,960 B2010 Exterior Walls $18.04 S.F. 2, % 0.00 % 91 $36,080 B2020 Exterior Windows $6.47 S.F. 2, % 0.00 % 21 $12,940 B2030 Exterior Doors $0.91 S.F. 2, % 0.00 % 21 $1,820 B Preformed Metal Roofing $9.66 S.F. 2, % 0.00 % 21 $19,320 C1010 Partitions $10.34 S.F. 2, % 0.00 % 66 $20,680 C1020 Interior Doors $2.20 S.F. 2, % 0.00 % 21 $4,400 C1030 Fittings $8.47 S.F. 2, % 0.00 % 11 $16,940 C3010 Wall Finishes $7.46 S.F. 2, % 0.00 % 1 $14,920 C3020 Floor Finishes $12.74 S.F. 2, % 0.00 % 11 $25,480 C3030 Ceiling Finishes $9.53 S.F. 2, % 0.00 % 16 $19,060 D2010 Plumbing Fixtures $9.98 S.F. 2, % 0.00 % 21 $19,960 D2020 Domestic Water Distribution $0.84 S.F. 2, % 0.00 % 21 $1,680 D2030 Sanitary Waste $5.94 S.F. 2, % 0.00 % 21 $11,880 D3040 Distribution Systems $5.35 S.F. 2, % 0.00 % 21 $10,700 D3050 Terminal & Package Units $16.96 S.F. 2, % 0.00 % 6 $33,920 D3060 Controls & Instrumentation $3.48 S.F. 2, % 0.00 % 11 $6,960 D5010 Electrical Service/Distribution $1.47 S.F. 2, % 0.00 % 31 $2,940 D5020 Branch Wiring $2.55 S.F. 2, % 0.00 % 21 $5,100 D5020 Lighting $3.58 S.F. 2, % 0.00 % 21 $7,160 E1020 Institutional Equipment $4.82 S.F. 2, % 0.00 % 11 $9,640 E2010 Fixed Furnishings $5.08 S.F. 2, % 0.00 % 11 $10,160 Total % $332,300 Mar 11, 2017 Page 100 of 161


101 Campus Assessment Report Field House System Notes The facility description in the executive summary contains an overview of each system. The photos of each system and any associated notes listed below provide additional information on select systems found within the facility: B Exterior Walls B Exterior Windows B Exterior Doors Mar 11, 2017 Page 101 of 161


102 Campus Assessment Report Field House B Preformed Metal Roofing C Partitions C Interior Doors Mar 11, 2017 Page 102 of 161
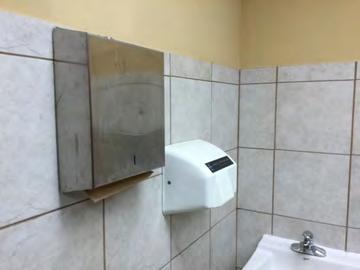
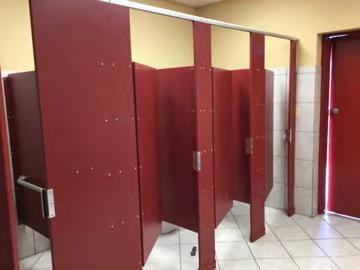
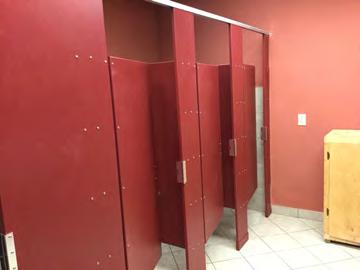
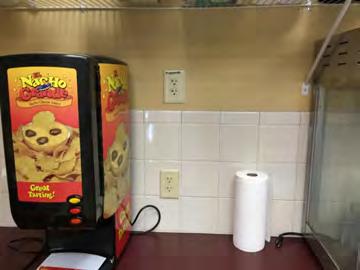
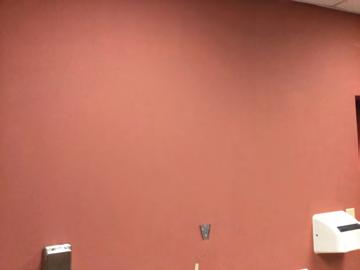
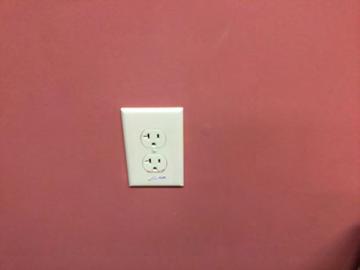
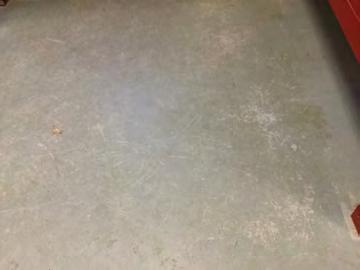
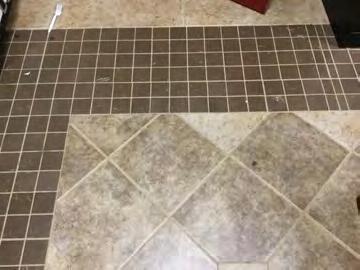
103 Campus Assessment Report Field House C Fittings C Wall Finishes C Floor Finishes Mar 11, 2017 Page 103 of 161


104 Campus Assessment Report Field House C Ceiling Finishes D Plumbing Fixtures D Domestic Water Distribution Mar 11, 2017 Page 104 of 161


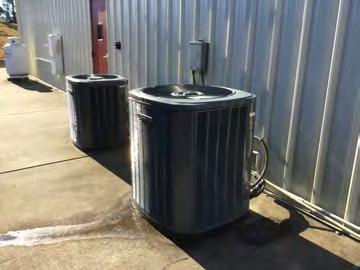
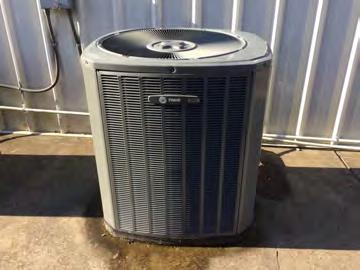
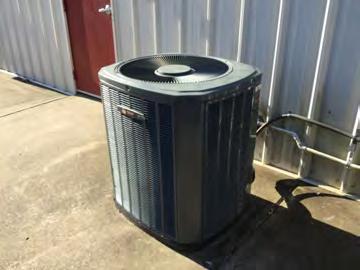
105 Campus Assessment Report Field House D Sanitary Waste D Distribution Systems D Terminal & Package Units Mar 11, 2017 Page 105 of 161


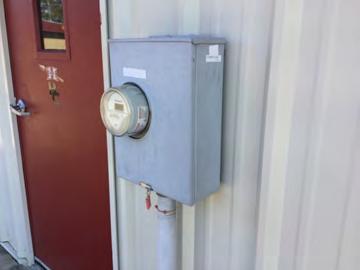
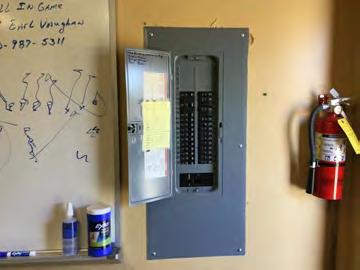
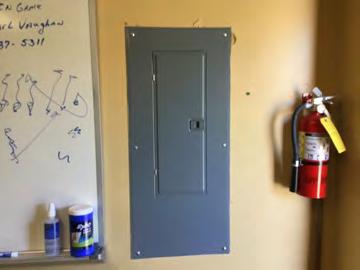
106 Campus Assessment Report Field House D Controls & Instrumentation D Electrical Service/Distribution D Branch Wiring Mar 11, 2017 Page 106 of 161


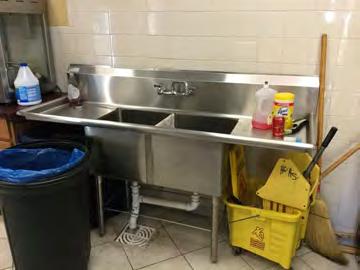
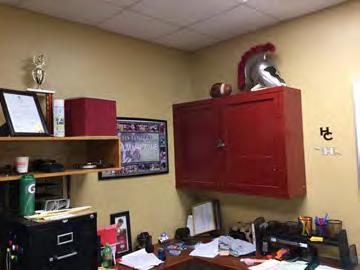
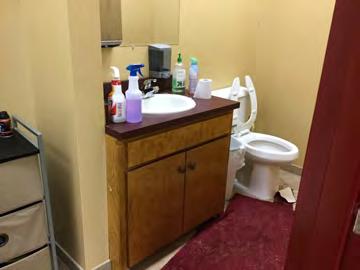
107 Campus Assessment Report Field House D Lighting E Institutional Equipment E Fixed Furnishings Mar 11, 2017 Page 107 of 161
108 Campus Assessment Report Field House Renewal Schedule ecomet forecasts future Capital Renewal projects for expiring systems based on the Calculated Next Renewal year found in the system listing. There is a 3% yearly inflation factor applied to the system costs expiring in the future. The table below reflects Capital Renewal projects over the next 10 years. Blank cells (or $0) indicate no systems are scheduled for renewal in that year. Inflation Rate: 3% System Current Deficiencies Total Total: $0 $16,904 $0 $0 $0 $0 $44,552 $0 $0 $0 $0 $61,457 * A - Substructure $0 $0 $0 $0 $0 $0 $0 $0 $0 $0 $0 $0 * A10 - Foundations $0 $0 $0 $0 $0 $0 $0 $0 $0 $0 $0 $0 * A Standard Foundations $0 $0 $0 $0 $0 $0 $0 $0 $0 $0 $0 $0 * A Slab on Grade $0 $0 $0 $0 $0 $0 $0 $0 $0 $0 $0 $0 B - Shell $0 $0 $0 $0 $0 $0 $0 $0 $0 $0 $0 $0 B10 - Superstructure $0 $0 $0 $0 $0 $0 $0 $0 $0 $0 $0 $0 * B Roof Construction $0 $0 $0 $0 $0 $0 $0 $0 $0 $0 $0 $0 B20 - Exterior Enclosure $0 $0 $0 $0 $0 $0 $0 $0 $0 $0 $0 $0 * B Exterior Walls $0 $0 $0 $0 $0 $0 $0 $0 $0 $0 $0 $0 B Exterior Windows $0 $0 $0 $0 $0 $0 $0 $0 $0 $0 $0 $0 B Exterior Doors $0 $0 $0 $0 $0 $0 $0 $0 $0 $0 $0 $0 B30 - Roofing $0 $0 $0 $0 $0 $0 $0 $0 $0 $0 $0 $0 B Roof Coverings $0 $0 $0 $0 $0 $0 $0 $0 $0 $0 $0 $0 B Preformed Metal Roofing $0 $0 $0 $0 $0 $0 $0 $0 $0 $0 $0 $0 C - Interiors $0 $0 $0 $0 $0 $0 $0 $0 $0 $0 $0 $0 C10 - Interior Construction $0 $0 $0 $0 $0 $0 $0 $0 $0 $0 $0 $0 * C Partitions $0 $0 $0 $0 $0 $0 $0 $0 $0 $0 $0 $0 C Interior Doors $0 $0 $0 $0 $0 $0 $0 $0 $0 $0 $0 $0 C Fittings $0 $0 $0 $0 $0 $0 $0 $0 $0 $0 $0 $0 C30 - Interior Finishes $0 $0 $0 $0 $0 $0 $0 $0 $0 $0 $0 $0 C Wall Finishes $0 $16,904 $0 $0 $0 $0 $0 $0 $0 $0 $0 $16,904 C Floor Finishes $0 $0 $0 $0 $0 $0 $0 $0 $0 $0 $0 $0 C Ceiling Finishes $0 $0 $0 $0 $0 $0 $0 $0 $0 $0 $0 $0 D - Services $0 $0 $0 $0 $0 $0 $0 $0 $0 $0 $0 $0 D20 - Plumbing $0 $0 $0 $0 $0 $0 $0 $0 $0 $0 $0 $0 Mar 11, 2017 Page 108 of 161
109 Campus Assessment Report Field House D Plumbing Fixtures $0 $0 $0 $0 $0 $0 $0 $0 $0 $0 $0 $0 D Domestic Water Distribution $0 $0 $0 $0 $0 $0 $0 $0 $0 $0 $0 $0 D Sanitary Waste $0 $0 $0 $0 $0 $0 $0 $0 $0 $0 $0 $0 D30 - HVAC $0 $0 $0 $0 $0 $0 $0 $0 $0 $0 $0 $0 D Distribution Systems $0 $0 $0 $0 $0 $0 $0 $0 $0 $0 $0 $0 D Terminal & Package Units $0 $0 $0 $0 $0 $0 $44,552 $0 $0 $0 $0 $44,552 D Controls & Instrumentation $0 $0 $0 $0 $0 $0 $0 $0 $0 $0 $0 $0 D50 - Electrical $0 $0 $0 $0 $0 $0 $0 $0 $0 $0 $0 $0 D Electrical Service/Distribution $0 $0 $0 $0 $0 $0 $0 $0 $0 $0 $0 $0 D Branch Wiring $0 $0 $0 $0 $0 $0 $0 $0 $0 $0 $0 $0 D Lighting $0 $0 $0 $0 $0 $0 $0 $0 $0 $0 $0 $0 E - Equipment & Furnishings $0 $0 $0 $0 $0 $0 $0 $0 $0 $0 $0 $0 E10 - Equipment $0 $0 $0 $0 $0 $0 $0 $0 $0 $0 $0 $0 E Institutional Equipment $0 $0 $0 $0 $0 $0 $0 $0 $0 $0 $0 $0 E20 - Furnishings $0 $0 $0 $0 $0 $0 $0 $0 $0 $0 $0 $0 E Fixed Furnishings $0 $0 $0 $0 $0 $0 $0 $0 $0 $0 $0 $0 * Indicates non-renewable system Mar 11, 2017 Page 109 of 161
110 Campus Assessment Report Field House Forecasted Capital Renewal Requirement The following chart shows the current building deficiencies and forecasting capital renewal or sustainment requirements over the next ten years. $50,000 $44,552 $40,000 $30,000 $20,000 $16,904 $10,000 $0 Current Deficiencies Mar 11, 2017 Page 110 of 161
111 Campus Assessment Report Field House Deficiency Summary by System Current deficiencies included assemblies that have reached or exceeded their design life or components of the assemblies that are in need of repair. Assemblies that have reached their design life are identified as current deficiencies and assigned the distress 'Beyond Useful Life'. The following chart lists all current deficiencies associated with this facility. No data found for this asset Mar 11, 2017 Page 111 of 161
112 Campus Assessment Report Field House Deficiency Summary by Priority The following chart shows the total repair costs broken down by priority. Assessors assigned deficiencies within ecomet to one of the following priority categories: No data found for this asset Mar 11, 2017 Page 112 of 161
113 Campus Assessment Report Field House Deficiency By Priority Investment Table The table below shows the current investment cost grouped by deficiency priority and building system. No data found for this asset Mar 11, 2017 Page 113 of 161
114 Campus Assessment Report Field House Deficiency Summary by Category The following chart shows the total repair costs broken down by deficiency categories. Assessors assigned deficiencies to one of the following categories: No data found for this asset Mar 11, 2017 Page 114 of 161
115 Campus Assessment Report Field House Deficiency Details by Priority The deficiency detail notes listed below provide additional information on identified deficiencies found within the facility. No data found for this asset Mar 11, 2017 Page 115 of 161
116 Campus Assessment Report Gym/9th Grade Wing Executive Summary Building condition is evaluated based on the functional systems and elements of a building and organized according to the UNIFORMAT II Elemental Classification. The grouping of these systems and elements and applying a current replacement value to them develops a representative building cost model. Cost Models are developed for similar building types and functions. Systems and their elements are evaluated based on their current replacement values, life cycles, installation dates and next renewal dates. Systems and their elements that are within their useful lives are further evaluated to identify current deficient conditions that may have a significant impact on a system's or element's remaining service life, and to determine if they are beyond their predicted expected life. The system's or element's current replacement value is based on RS Means Commercial Cost Data. Following are the cost model's system details for this facility. The Replacement Value is the amount needed to replace the property of the same present scope. The Repair Cost (the sum of the cost to repair/replace the Deficiencies) represents the budgeted contractor-installed costs plus owner's soft costs for the repair, replacement or renewal for a component or system level deficiency. It excludes contributing costs for other components or systems that might also be associated with the corrective actions due to packaging of the work. Facility Condition Index ( FCI) is an industry-standard measurement of facility condition calculated as the ratio of the costs to correct a facility's deficiencies (Condition Needs) to the facility's Current Replacement Value. It ranges from 0% (new) to 100% (very poor - beyond service life). The Remaining Service Life Index (RSLI) is calculated as the sum of a renewable system's Remaining Service Life (RSL) divided by the sum of a system's Replacement Value (both values exclude soft-cost to simplify calculation updates) expressed as a percentage ranging from 100% (new) to 0% (expired). The relationship between the key metrics FCI and RSLI is an important indicator, at either the facility, building, system, or component levels, of the condition trend and the imminent need for capital renewal. These indices exist in an inverse relationship wherein the FCI increases when systems reach their expected life-cycle age, whereas the RSLI decreases annually indicating the relative time remaining before reaching the life-cycle expiration age. For example, a facility or a system with a high RSLI and a low FCI indicates it is in the early portion of its useful life. However, a low RSLI indicates that expiration dates are approaching at which point the FCI would increase. The term FCA Score is the inverse of Total FCI and calculated as 100-Total FCI (without the %) where 100 is best and 0 is worst condition. Function: Gross Area (SF): Year Built: Last Renovation: Replacement Value: Repair Cost: Total FCI: Total RSLI: HS -High School 49, $8,770,505 $ % % FCA Score: Description: The narrative for this building is included in the Executive Summary Description at the front of this report. Attributes: This asset has no attributes. Mar 11, 2017 Page 116 of 161
117 Campus Assessment Report Gym/9th Grade Wing Dashboard Summary Function: Year Built: Repair Cost: FCI: HS -High School 2010 $ % Gross Area: Last Renovation: Replacement Value: RSLI%: 49,063 $8,770, % No data found for this asset No data found for this asset No data found for this asset $800,000 $600,000 $400, Year Investment Forecast $708K $200,000 $0 $154K $0 $0 $0 $0 $0 $0 $0 $ Mar 11, 2017 Page 117 of 161
118 Campus Assessment Report Gym/9th Grade Wing Condition Summary The Table below shows the RSLI and FCI for each major building system shown at the UNIFORMAT classification Level II. Note that Systems with lower FCIs require less investment than systems with higher FCIs. UNIFORMAT Classification RSLI % FCI % Current Repair Cost A10 - Foundations % 0.00 % $0.00 A20 - Basement Construction % 0.00 % $0.00 B10 - Superstructure % 0.00 % $0.00 B20 - Exterior Enclosure % 0.00 % $0.00 B30 - Roofing % 0.00 % $0.00 C10 - Interior Construction % 0.00 % $0.00 C20 - Stairs % 0.00 % $0.00 C30 - Interior Finishes % 0.00 % $0.00 D20 - Plumbing % 0.00 % $0.00 D30 - HVAC % 0.00 % $0.00 D40 - Fire Protection % 0.00 % $0.00 D50 - Electrical % 0.00 % $0.00 E10 - Equipment % 0.00 % $0.00 E20 - Furnishings % 0.00 % $0.00 Totals: % 0.00 % $0.00 Mar 11, 2017 Page 118 of 161

.")
.")
119 Campus Assessment Report Gym/9th Grade Wing Photo Album The photo album consists of the various cardinal directions of the building.. 1). North Elevation - Nov 21, ). South Elevation - Nov 16, ). East Elevation - Nov 16, ). East Elevation - Nov 16, 2016 Mar 11, 2017 Page 119 of 161
120 Campus Assessment Report Gym/9th Grade Wing Condition Detail This section of the report contains results of the Facility Condition Assessment. The building is separated into system components based on UNIFORMAT II. The columns in the System Listing table represent the following: 1. System Code: A code that identifies the system. 2. System Description: A brief description of a system present in the building. 3. Unit Price $: The unit price of the system. 4. UoM: The unit of measure of the system. 5. Qty: The quantity for the system 6. Life: Building Owners and Managers Association (BOMA) recommended system design life. 7. Year Installed: The date of system installation. 8. Calc Next Renewal Year: The date of system expiration based on the life, NR stands for non renewable. 9. Next Renewal Year: The suggested system expiration date by the assessor based on visual inspection. 10. RSLI: The Remaining Service Life Index of the system. 11. FCI: The Facility Condition Index of the system. 12. RSL: Remaining Service Life in years. 13. ecr: ecomet Condition Rating (not used in this assessment). 14. Deficiency $: The financial investment to repair/replace system to address deficiency. 15. Replacement Value $: The replacement cost of the system. Mar 11, 2017 Page 120 of 161
121 Campus Assessment Report Gym/9th Grade Wing System Listing The System Listing table below lists each of the systems organized by their UNIFORMAT II classification. The assessment team was tasked with recording the most recent replacement year of each system, determining the remaining service life based on the theoretical life, and evaluating the condition to confirm the forecast next replacement year. The system listing is the basis for all data contained in the Building Assessment Report. Mar 11, 2017 Page 121 of 161
122 Campus Assessment Report Gym/9th Grade Wing System Code System Description Unit Price $ UoM Qty Life Year Installed Calc Next Renewal Year Next Renewal Year RSLI% FCI% RSL ecr Deficiency $ Replacement Value $ A1010 Standard Foundations $2.22 S.F. 49, % 0.00 % 93 $108,920 A1030 Slab on Grade $4.16 S.F. 49, % 0.00 % 93 $204,102 A2010 Basement Excavation $0.84 S.F. 49, % 0.00 % 93 $41,213 A2020 Basement Walls $5.86 S.F. 49, % 0.00 % 93 $287,509 B1010 Floor Construction $11.66 S.F. 49, % 0.00 % 93 $572,075 B1020 Roof Construction $7.76 S.F. 49, % 0.00 % 93 $380,729 B2010 Exterior Walls $9.03 S.F. 49, % 0.00 % 93 $443,039 B2020 Exterior Windows $13.04 S.F. 49, % 0.00 % 23 $639,782 B2030 Exterior Doors $0.82 S.F. 49, % 0.00 % 23 $40,232 B Single Ply Membrane $6.98 S.F. 49, % 0.00 % 13 $342,460 B3020 Roof Openings $0.21 S.F. 49, % 0.00 % 18 $10,303 C1010 Partitions $4.79 S.F. 49, % 0.00 % 68 $235,012 C1020 Interior Doors $2.49 S.F. 49, % 0.00 % 23 $122,167 C1030 Fittings $1.50 S.F. 49, % 0.00 % 13 $73,595 C2010 Stair Construction $1.32 S.F. 49, % 0.00 % 93 $64,763 C3010 Wall Finishes $2.61 S.F. 49, % 0.00 % 3 $128,054 C3020 Floor Finishes $11.17 S.F. 49, % 0.00 % 13 $548,034 C3030 Ceiling Finishes $10.77 S.F. 49, % 0.00 % 18 $528,409 D2010 Plumbing Fixtures $9.02 S.F. 49, % 0.00 % 23 $442,548 D2020 Domestic Water Distribution $1.68 S.F. 49, % 0.00 % 23 $82,426 D2030 Sanitary Waste $2.64 S.F. 49, % 0.00 % 23 $129,526 D2040 Rain Water Drainage $0.65 S.F. 49, % 0.00 % 23 $31,891 D3040 Distribution Systems $8.54 S.F. 49, % 0.00 % 23 $418,998 D3060 Controls & Instrumentation $2.71 S.F. 49, % 0.00 % 13 $132,961 D4010 Sprinklers $3.71 S.F. 49, % 0.00 % 23 $182,024 D4020 Standpipes $0.57 S.F. 49, % 0.00 % 23 $27,966 D5010 Electrical Service/Distribution $1.62 S.F. 49, % 0.00 % 33 $79,482 D5020 Branch Wiring $4.65 S.F. 49, % 0.00 % 23 $228,143 D5020 Lighting $10.85 S.F. 49, % 0.00 % 23 $532,334 D Security & Detection Systems $2.01 S.F. 49, % 0.00 % 8 $98,617 D Fire & Alarm Systems $3.64 S.F. 49, % 0.00 % 8 $178,589 D Data Communication $4.70 S.F. 49, % 0.00 % 8 $230,596 D5090 Other Electrical Systems $0.69 S.F. 49, % 0.00 % 13 $33,853 E1020 Institutional Equipment $13.31 S.F. 49, % 0.00 % 13 $653,029 E1090 Other Equipment $5.46 S.F. 49, % 0.00 % 13 $267,884 E2010 Fixed Furnishings $5.08 S.F. 49, % 0.00 % 13 $249,240 Total % $8,770,505 Mar 11, 2017 Page 122 of 161


123 Campus Assessment Report Gym/9th Grade Wing System Notes The facility description in the executive summary contains an overview of each system. The photos of each system and any associated notes listed below provide additional information on select systems found within the facility: B Floor Construction B Roof Construction B Exterior Walls Mar 11, 2017 Page 123 of 161


124 Campus Assessment Report Gym/9th Grade Wing B Exterior Windows B Exterior Doors B Single Ply Membrane Mar 11, 2017 Page 124 of 161
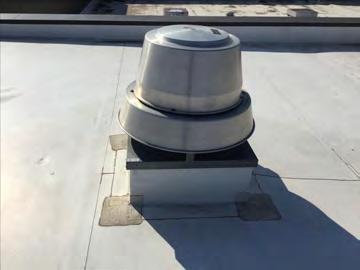
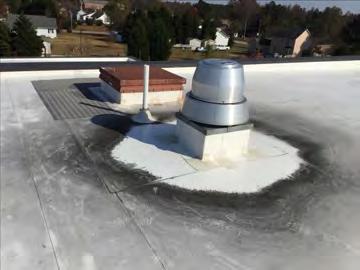
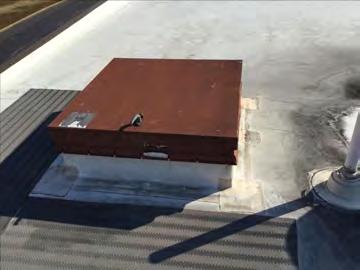
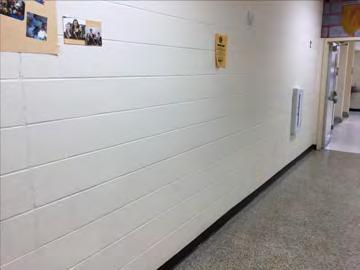
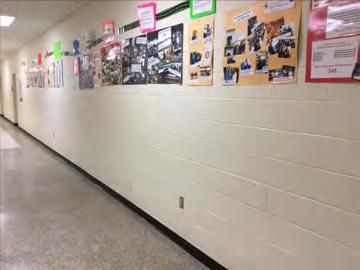
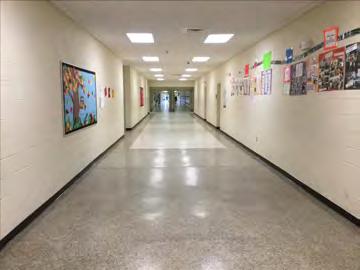
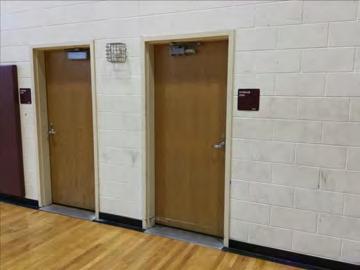
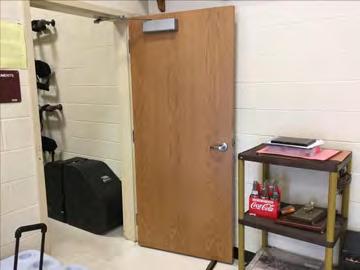
125 Campus Assessment Report Gym/9th Grade Wing B Roof Openings C Partitions C Interior Doors Mar 11, 2017 Page 125 of 161
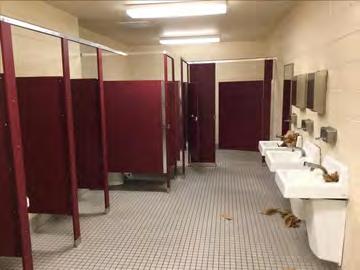
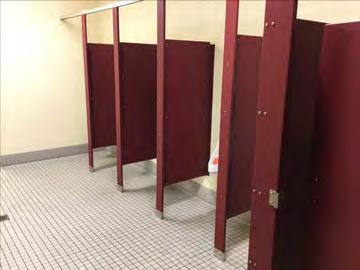
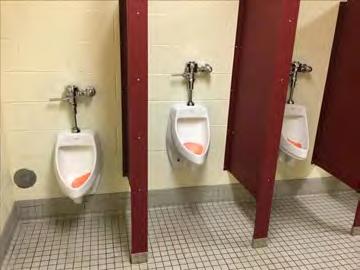
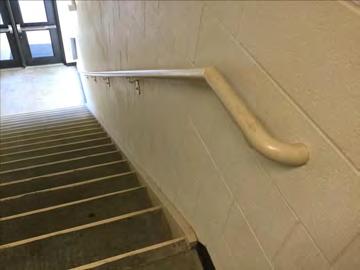
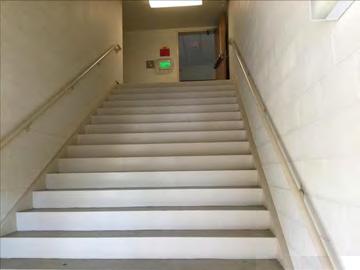
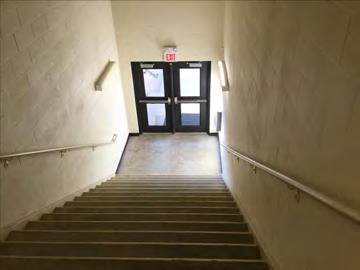
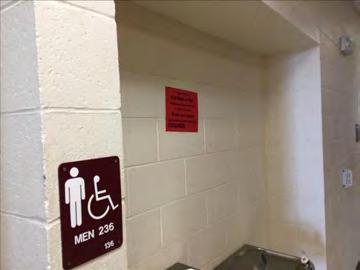
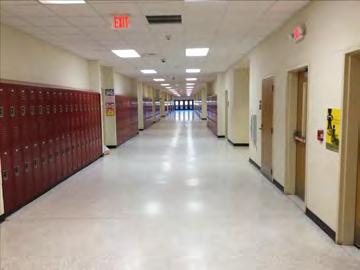
126 Campus Assessment Report Gym/9th Grade Wing C Fittings C Stair Construction C Wall Finishes Mar 11, 2017 Page 126 of 161


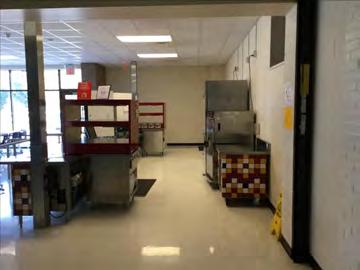

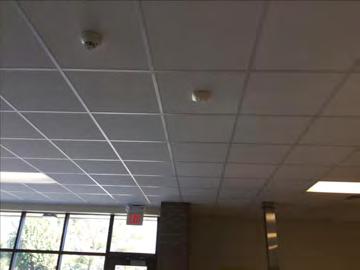
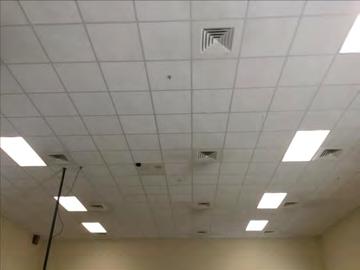
127 Campus Assessment Report Gym/9th Grade Wing C Floor Finishes C Ceiling Finishes Mar 11, 2017 Page 127 of 161
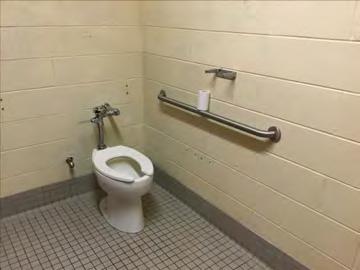
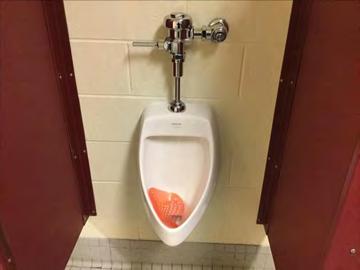
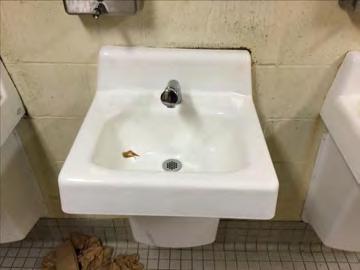
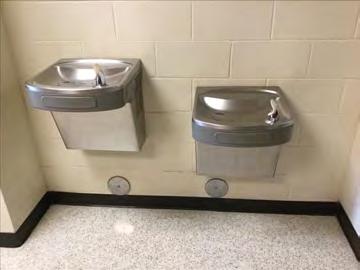
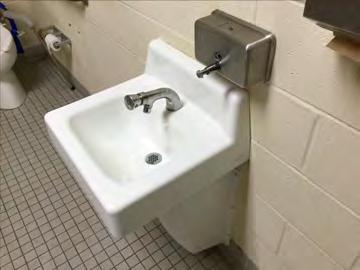
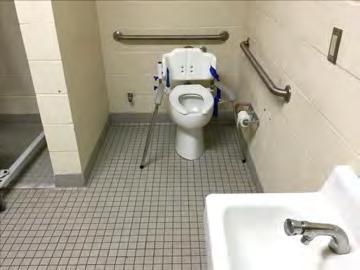
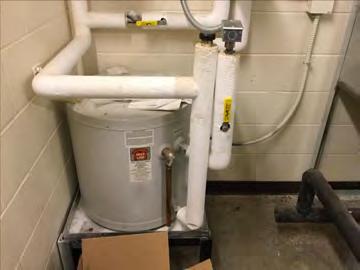
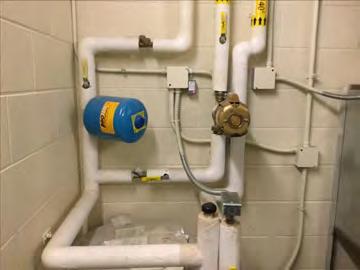
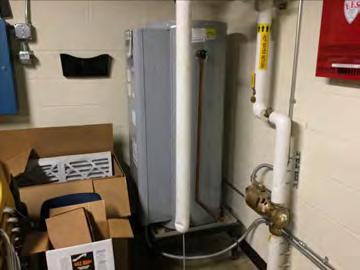
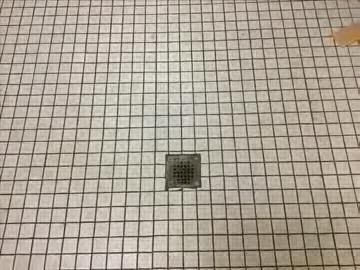
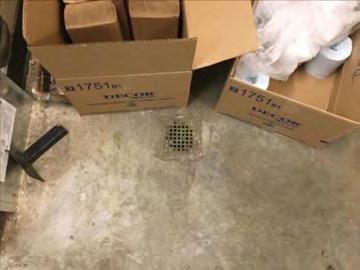
128 Campus Assessment Report Gym/9th Grade Wing D Plumbing Fixtures D Domestic Water Distribution D Sanitary Waste Mar 11, 2017 Page 128 of 161


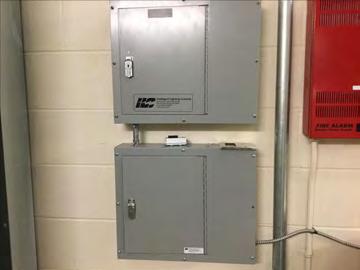
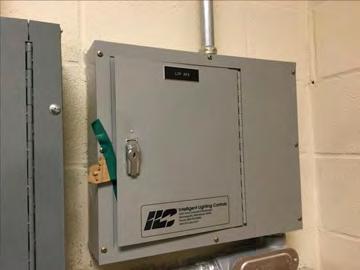
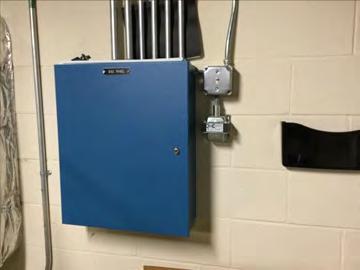
129 Campus Assessment Report Gym/9th Grade Wing D Rain Water Drainage D Distribution Systems D Controls & Instrumentation Mar 11, 2017 Page 129 of 161


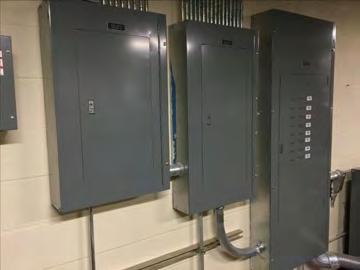
130 Campus Assessment Report Gym/9th Grade Wing D Sprinklers D Standpipes D Electrical Service/Distribution Mar 11, 2017 Page 130 of 161


131 Campus Assessment Report Gym/9th Grade Wing D Branch Wiring D Lighting D Security & Detection Systems Mar 11, 2017 Page 131 of 161


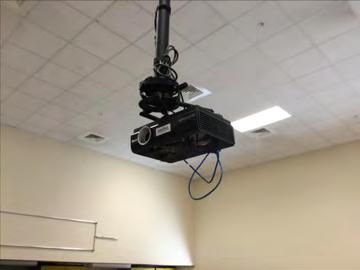
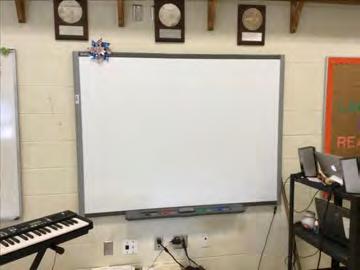
132 Campus Assessment Report Gym/9th Grade Wing D Fire & Alarm Systems D Data Communication E Institutional Equipment Mar 11, 2017 Page 132 of 161


133 Campus Assessment Report Gym/9th Grade Wing E Other Equipment E Fixed Furnishings Mar 11, 2017 Page 133 of 161
134 Campus Assessment Report Gym/9th Grade Wing Renewal Schedule ecomet forecasts future Capital Renewal projects for expiring systems based on the Calculated Next Renewal year found in the system listing. There is a 3% yearly inflation factor applied to the system costs expiring in the future. The table below reflects Capital Renewal projects over the next 10 years. Blank cells (or $0) indicate no systems are scheduled for renewal in that year. Inflation Rate: 3% System Current Deficiencies Total Total: $0 $0 $0 $153,922 $0 $0 $0 $0 $707,595 $0 $0 $861,516 * A - Substructure $0 $0 $0 $0 $0 $0 $0 $0 $0 $0 $0 $0 * A10 - Foundations $0 $0 $0 $0 $0 $0 $0 $0 $0 $0 $0 $0 * A Standard Foundations $0 $0 $0 $0 $0 $0 $0 $0 $0 $0 $0 $0 * A Slab on Grade $0 $0 $0 $0 $0 $0 $0 $0 $0 $0 $0 $0 * A20 - Basement Construction $0 $0 $0 $0 $0 $0 $0 $0 $0 $0 $0 $0 * A Basement Excavation $0 $0 $0 $0 $0 $0 $0 $0 $0 $0 $0 $0 * A Basement Walls $0 $0 $0 $0 $0 $0 $0 $0 $0 $0 $0 $0 B - Shell $0 $0 $0 $0 $0 $0 $0 $0 $0 $0 $0 $0 B10 - Superstructure $0 $0 $0 $0 $0 $0 $0 $0 $0 $0 $0 $0 * B Floor Construction $0 $0 $0 $0 $0 $0 $0 $0 $0 $0 $0 $0 * B Roof Construction $0 $0 $0 $0 $0 $0 $0 $0 $0 $0 $0 $0 B20 - Exterior Enclosure $0 $0 $0 $0 $0 $0 $0 $0 $0 $0 $0 $0 * B Exterior Walls $0 $0 $0 $0 $0 $0 $0 $0 $0 $0 $0 $0 B Exterior Windows $0 $0 $0 $0 $0 $0 $0 $0 $0 $0 $0 $0 B Exterior Doors $0 $0 $0 $0 $0 $0 $0 $0 $0 $0 $0 $0 B30 - Roofing $0 $0 $0 $0 $0 $0 $0 $0 $0 $0 $0 $0 B Roof Coverings $0 $0 $0 $0 $0 $0 $0 $0 $0 $0 $0 $0 B Single Ply Membrane $0 $0 $0 $0 $0 $0 $0 $0 $0 $0 $0 $0 B Roof Openings $0 $0 $0 $0 $0 $0 $0 $0 $0 $0 $0 $0 C - Interiors $0 $0 $0 $0 $0 $0 $0 $0 $0 $0 $0 $0 C10 - Interior Construction $0 $0 $0 $0 $0 $0 $0 $0 $0 $0 $0 $0 * C Partitions $0 $0 $0 $0 $0 $0 $0 $0 $0 $0 $0 $0 C Interior Doors $0 $0 $0 $0 $0 $0 $0 $0 $0 $0 $0 $0 C Fittings $0 $0 $0 $0 $0 $0 $0 $0 $0 $0 $0 $0 C20 - Stairs $0 $0 $0 $0 $0 $0 $0 $0 $0 $0 $0 $0 Mar 11, 2017 Page 134 of 161
135 Campus Assessment Report Gym/9th Grade Wing * C Stair Construction $0 $0 $0 $0 $0 $0 $0 $0 $0 $0 $0 $0 C30 - Interior Finishes $0 $0 $0 $0 $0 $0 $0 $0 $0 $0 $0 $0 C Wall Finishes $0 $0 $0 $153,922 $0 $0 $0 $0 $0 $0 $0 $153,922 C Floor Finishes $0 $0 $0 $0 $0 $0 $0 $0 $0 $0 $0 $0 C Ceiling Finishes $0 $0 $0 $0 $0 $0 $0 $0 $0 $0 $0 $0 D - Services $0 $0 $0 $0 $0 $0 $0 $0 $0 $0 $0 $0 D20 - Plumbing $0 $0 $0 $0 $0 $0 $0 $0 $0 $0 $0 $0 D Plumbing Fixtures $0 $0 $0 $0 $0 $0 $0 $0 $0 $0 $0 $0 D Domestic Water Distribution $0 $0 $0 $0 $0 $0 $0 $0 $0 $0 $0 $0 D Sanitary Waste $0 $0 $0 $0 $0 $0 $0 $0 $0 $0 $0 $0 D Rain Water Drainage $0 $0 $0 $0 $0 $0 $0 $0 $0 $0 $0 $0 D30 - HVAC $0 $0 $0 $0 $0 $0 $0 $0 $0 $0 $0 $0 D Distribution Systems $0 $0 $0 $0 $0 $0 $0 $0 $0 $0 $0 $0 D Controls & Instrumentation $0 $0 $0 $0 $0 $0 $0 $0 $0 $0 $0 $0 D40 - Fire Protection $0 $0 $0 $0 $0 $0 $0 $0 $0 $0 $0 $0 D Sprinklers $0 $0 $0 $0 $0 $0 $0 $0 $0 $0 $0 $0 D Standpipes $0 $0 $0 $0 $0 $0 $0 $0 $0 $0 $0 $0 D50 - Electrical $0 $0 $0 $0 $0 $0 $0 $0 $0 $0 $0 $0 D Electrical Service/Distribution $0 $0 $0 $0 $0 $0 $0 $0 $0 $0 $0 $0 D Branch Wiring $0 $0 $0 $0 $0 $0 $0 $0 $0 $0 $0 $0 D Lighting $0 $0 $0 $0 $0 $0 $0 $0 $0 $0 $0 $0 D Communications and Security $0 $0 $0 $0 $0 $0 $0 $0 $0 $0 $0 $0 D Security & Detection Systems $0 $0 $0 $0 $0 $0 $0 $0 $137,417 $0 $0 $137,417 D Fire & Alarm Systems $0 $0 $0 $0 $0 $0 $0 $0 $248,854 $0 $0 $248,854 D Data Communication $0 $0 $0 $0 $0 $0 $0 $0 $321,324 $0 $0 $321,324 D Other Electrical Systems $0 $0 $0 $0 $0 $0 $0 $0 $0 $0 $0 $0 E - Equipment & Furnishings $0 $0 $0 $0 $0 $0 $0 $0 $0 $0 $0 $0 E10 - Equipment $0 $0 $0 $0 $0 $0 $0 $0 $0 $0 $0 $0 E Institutional Equipment $0 $0 $0 $0 $0 $0 $0 $0 $0 $0 $0 $0 E Other Equipment $0 $0 $0 $0 $0 $0 $0 $0 $0 $0 $0 $0 E20 - Furnishings $0 $0 $0 $0 $0 $0 $0 $0 $0 $0 $0 $0 E Fixed Furnishings $0 $0 $0 $0 $0 $0 $0 $0 $0 $0 $0 $0 Mar 11, 2017 Page 135 of 161
136 Campus Assessment Report Gym/9th Grade Wing * Indicates non-renewable system Mar 11, 2017 Page 136 of 161
137 Campus Assessment Report Gym/9th Grade Wing Forecasted Capital Renewal Requirement The following chart shows the current building deficiencies and forecasting capital renewal or sustainment requirements over the next ten years. $800,000 $707,595 $600,000 $400,000 $200,000 $153,922 $0 Current Deficiencies Mar 11, 2017 Page 137 of 161
138 Campus Assessment Report Gym/9th Grade Wing Deficiency Summary by System Current deficiencies included assemblies that have reached or exceeded their design life or components of the assemblies that are in need of repair. Assemblies that have reached their design life are identified as current deficiencies and assigned the distress 'Beyond Useful Life'. The following chart lists all current deficiencies associated with this facility. No data found for this asset Mar 11, 2017 Page 138 of 161
139 Campus Assessment Report Gym/9th Grade Wing Deficiency Summary by Priority The following chart shows the total repair costs broken down by priority. Assessors assigned deficiencies within ecomet to one of the following priority categories: No data found for this asset Mar 11, 2017 Page 139 of 161
140 Campus Assessment Report Gym/9th Grade Wing Deficiency By Priority Investment Table The table below shows the current investment cost grouped by deficiency priority and building system. No data found for this asset Mar 11, 2017 Page 140 of 161
141 Campus Assessment Report Gym/9th Grade Wing Deficiency Summary by Category The following chart shows the total repair costs broken down by deficiency categories. Assessors assigned deficiencies to one of the following categories: No data found for this asset Mar 11, 2017 Page 141 of 161
142 Campus Assessment Report Gym/9th Grade Wing Deficiency Details by Priority The deficiency detail notes listed below provide additional information on identified deficiencies found within the facility. No data found for this asset Mar 11, 2017 Page 142 of 161
143 Campus Assessment Report - Site Executive Summary Building condition is evaluated based on the functional systems and elements of a building and organized according to the UNIFORMAT II Elemental Classification. The grouping of these systems and elements and applying a current replacement value to them develops a representative building cost model. Cost Models are developed for similar building types and functions. Systems and their elements are evaluated based on their current replacement values, life cycles, installation dates and next renewal dates. Systems and their elements that are within their useful lives are further evaluated to identify current deficient conditions that may have a significant impact on a system's or element's remaining service life, and to determine if they are beyond their predicted expected life. The system's or element's current replacement value is based on RS Means Commercial Cost Data. Following are the cost model's system details for this facility. The Replacement Value is the amount needed to replace the property of the same present scope. The Repair Cost (the sum of the cost to repair/replace the Deficiencies) represents the budgeted contractor-installed costs plus owner's soft costs for the repair, replacement or renewal for a component or system level deficiency. It excludes contributing costs for other components or systems that might also be associated with the corrective actions due to packaging of the work. Facility Condition Index ( FCI) is an industry-standard measurement of facility condition calculated as the ratio of the costs to correct a facility's deficiencies (Condition Needs) to the facility's Current Replacement Value. It ranges from 0% (new) to 100% (very poor - beyond service life). The Remaining Service Life Index (RSLI) is calculated as the sum of a renewable system's Remaining Service Life (RSL) divided by the sum of a system's Replacement Value (both values exclude soft-cost to simplify calculation updates) expressed as a percentage ranging from 100% (new) to 0% (expired). The relationship between the key metrics FCI and RSLI is an important indicator, at either the facility, building, system, or component levels, of the condition trend and the imminent need for capital renewal. These indices exist in an inverse relationship wherein the FCI increases when systems reach their expected life-cycle age, whereas the RSLI decreases annually indicating the relative time remaining before reaching the life-cycle expiration age. For example, a facility or a system with a high RSLI and a low FCI indicates it is in the early portion of its useful life. However, a low RSLI indicates that expiration dates are approaching at which point the FCI would increase. The term FCA Score is the inverse of Total FCI and calculated as 100-Total FCI (without the %) where 100 is best and 0 is worst condition. Function: Gross Area (SF): Year Built: Last Renovation: Replacement Value: Repair Cost: Total FCI: Total RSLI: HS -High School 208, $8,054,522 $412, % % FCA Score: Description: The narrative for this site is included in the Executive Summary Description at the front of this report. Attributes: This asset has no attributes. Mar 11, 2017 Page 143 of 161
144 Campus Assessment Report - Site Dashboard Summary Function: Year Built: Repair Cost: FCI: HS -High School 1977 $412, % Gross Area: Last Renovation: Replacement Value: RSLI%: 208,181 $8,054, % Deficiency By Category Deficiency By Priority 1 - Currently Critical (Immediate) - $412, Potentially Critical (Year 1) Safety - $412, Necessary/Not Yet Critical (Years 2-5) 4 - Recommended (Years 6-10) 5 - Codes or Standards Compliance $400,000 $300,000 Deficiency By System $311K $200,000 $100,000 $0 Site Improvements $4,000,000 $3,000,000 $2,000,000 $3M 10 Year Investment Forecast $3M $1,000,000 $0 $575K $278K $0 $0 $0 $0 $0 $ Mar 11, 2017 Page 144 of 161
145 Campus Assessment Report - Site Condition Summary The Table below shows the RSLI and FCI for each major building system shown at the UNIFORMAT classification Level II. Note that Systems with lower FCIs require less investment than systems with higher FCIs. UNIFORMAT Classification RSLI % FCI % Current Repair Cost G20 - Site Improvements % 8.20 % $412, G30 - Site Mechanical Utilities % 0.00 % $0.00 G40 - Site Electrical Utilities % 0.00 % $0.00 Totals: % 5.12 % $412, Mar 11, 2017 Page 145 of 161
146 Campus Assessment Report - Site Photo Album The photo album consists of the various cardinal directions of the building.. 1). Aerial Image of Harnett Central High School - Nov 17, 2016 Mar 11, 2017 Page 146 of 161
147 Campus Assessment Report - Site Condition Detail This section of the report contains results of the Facility Condition Assessment. The building is separated into system components based on UNIFORMAT II. The columns in the System Listing table represent the following: 1. System Code: A code that identifies the system. 2. System Description: A brief description of a system present in the building. 3. Unit Price $: The unit price of the system. 4. UoM: The unit of measure of the system. 5. Qty: The quantity for the system 6. Life: Building Owners and Managers Association (BOMA) recommended system design life. 7. Year Installed: The date of system installation. 8. Calc Next Renewal Year: The date of system expiration based on the life, NR stands for non renewable. 9. Next Renewal Year: The suggested system expiration date by the assessor based on visual inspection. 10. RSLI: The Remaining Service Life Index of the system. 11. FCI: The Facility Condition Index of the system. 12. RSL: Remaining Service Life in years. 13. ecr: ecomet Condition Rating (not used in this assessment). 14. Deficiency $: The financial investment to repair/replace system to address deficiency. 15. Replacement Value $: The replacement cost of the system. Mar 11, 2017 Page 147 of 161
148 Campus Assessment Report - Site System Listing The System Listing table below lists each of the systems organized by their UNIFORMAT II classification. The assessment team was tasked with recording the most recent replacement year of each system, determining the remaining service life based on the theoretical life, and evaluating the condition to confirm the forecast next replacement year. The system listing is the basis for all data contained in the Building Assessment Report. System Code System Description Unit Price $ UoM Qty Life Year Installed Calc Next Renewal Year Next Renewal Year RSLI% FCI% RSL ecr Deficiency $ Replacement Value $ G2010 Roadways $3.76 S.F. 208, % 0.00 % 22 $782,761 G2020 Parking Lots $1.61 S.F. 208, % 0.00 % 22 $335,171 G2030 Pedestrian Paving $1.98 S.F. 208, % 0.00 % 3 $412,198 G Fence & Guardrails $1.20 S.F. 208, % 0.00 % 4 $249,817 G Baseball Field $5.78 S.F. 208, % 0.00 % 3 $1,203,286 G Canopies $0.15 S.F. 208, % 0.00 % 8 $31,227 G Covered Walkways $0.81 S.F. 208, % 0.00 % 8 $168,627 G Football Field $3.38 S.F. 208, % 0.00 % 3 $703,652 G Tennis Courts $1.80 S.F. 208, % % 0 $412, $374,726 G Track $1.78 S.F. 208, % 0.00 % 3 $370,562 G2050 Landscaping $1.91 S.F. 208, % 0.00 % -5 $397,626 G3010 Water Supply $2.42 S.F. 208, % 0.00 % 10 $503,798 G3020 Sanitary Sewer $1.52 S.F. 208, % 0.00 % 10 $316,435 G3030 Storm Sewer $4.67 S.F. 208, % 0.00 % 10 $972,205 G3060 Fuel Distribution $1.03 S.F. 208, % 0.00 % 4 $214,426 G4010 Electrical Distribution $2.44 S.F. 208, % 0.00 % 10 $507,962 G4020 Site Lighting $1.57 S.F. 208, % 0.00 % 13 $326,844 G4030 Site Communications & Security $0.88 S.F. 208, % 0.00 % 12 $183,199 Total % 5.12 % $412, $8,054,522 Mar 11, 2017 Page 148 of 161


149 Campus Assessment Report - Site System Notes The facility description in the executive summary contains an overview of each system. The photos of each system and any associated notes listed below provide additional information on select systems found within the facility: G Roadways G Parking Lots G Pedestrian Paving Mar 11, 2017 Page 149 of 161
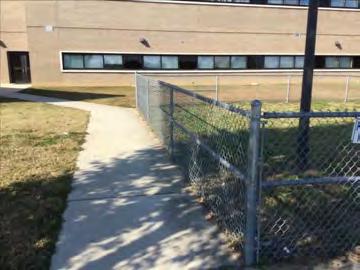
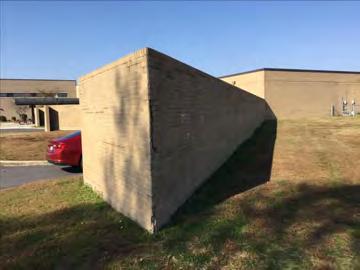
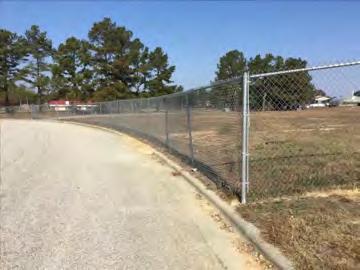
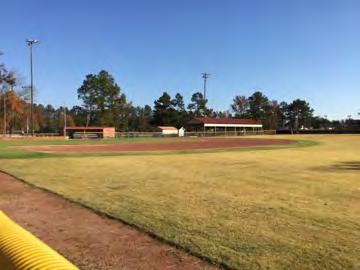
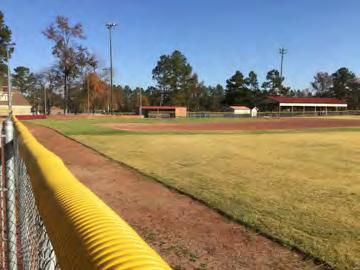
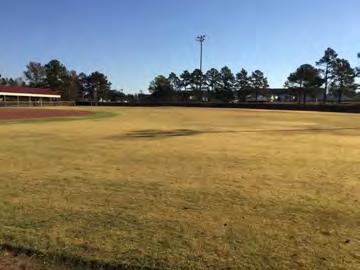
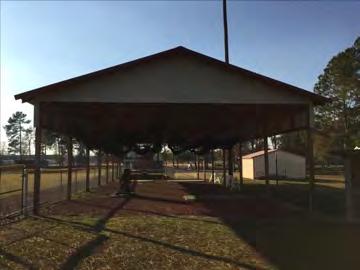
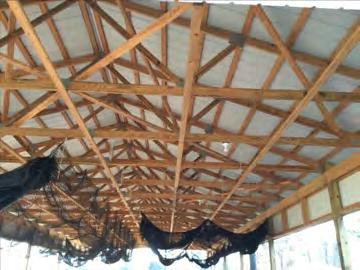
150 Campus Assessment Report - Site G Fence & Guardrails G Baseball Field G Canopies Mar 11, 2017 Page 150 of 161
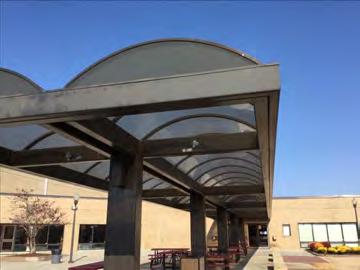
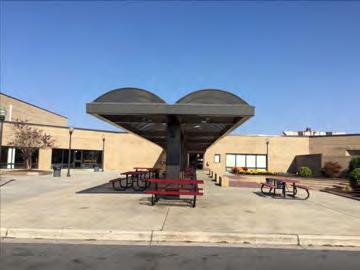
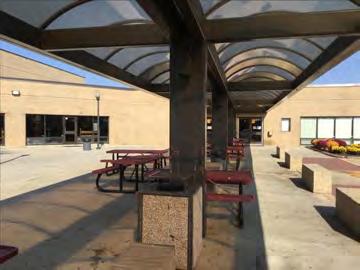
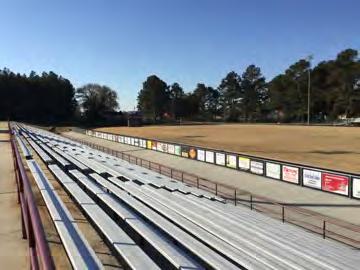
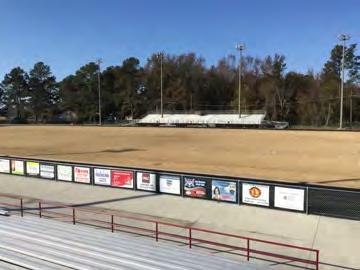
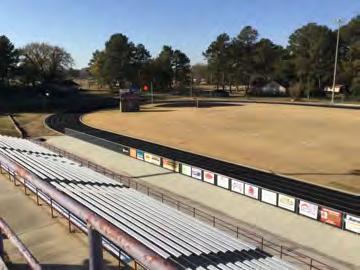
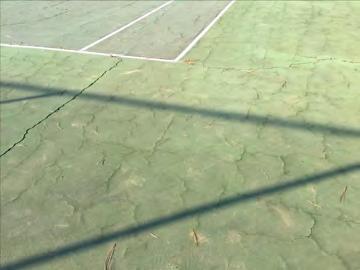
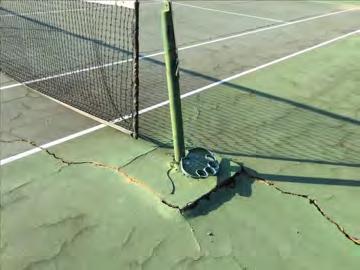
151 Campus Assessment Report - Site G Covered Walkways G Football Field G Tennis Courts Mar 11, 2017 Page 151 of 161
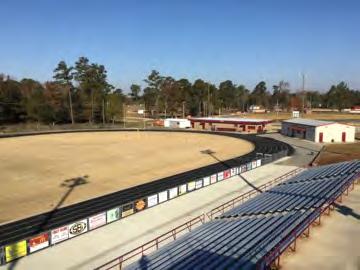
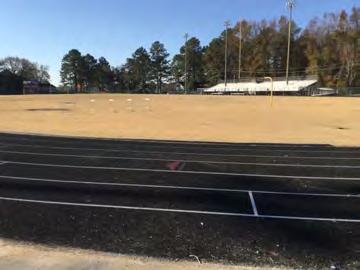
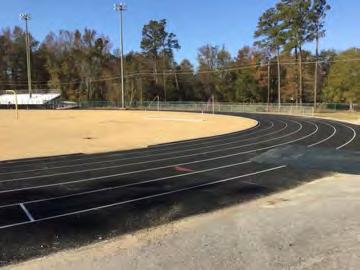
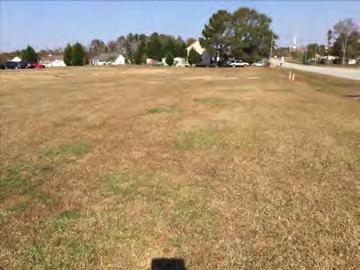
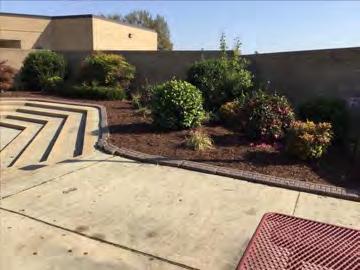
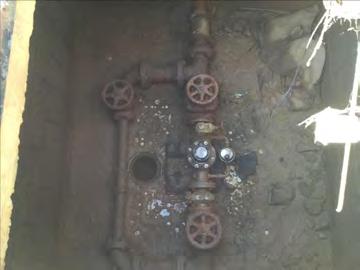
152 Campus Assessment Report - Site G Track G Landscaping G Water Supply Mar 11, 2017 Page 152 of 161
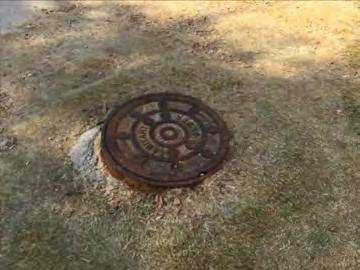
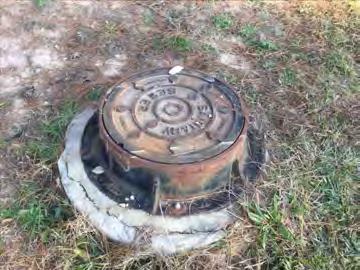
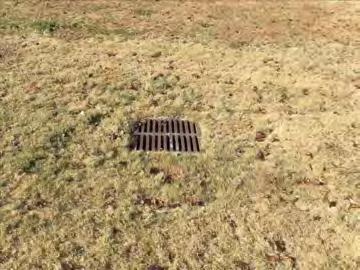
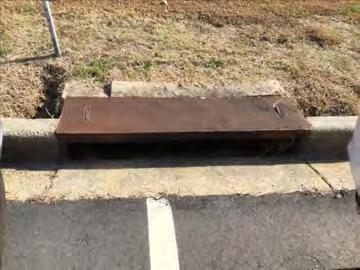
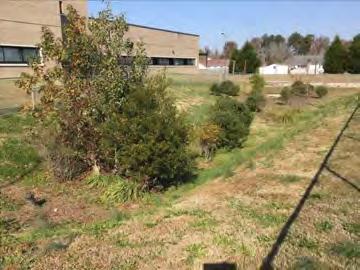
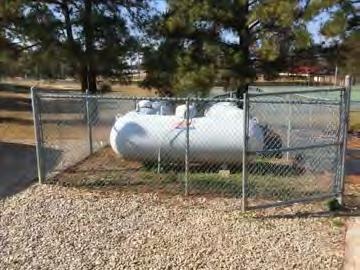
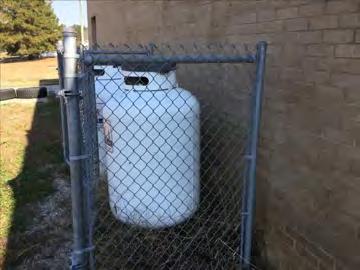
153 Campus Assessment Report - Site G Sanitary Sewer G Storm Sewer G Fuel Distribution Mar 11, 2017 Page 153 of 161


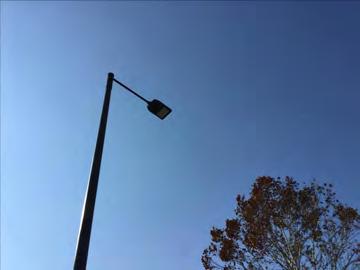
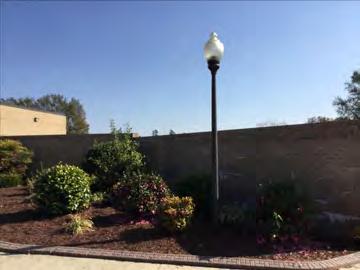
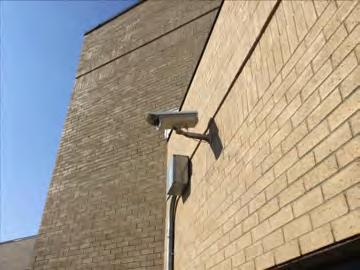
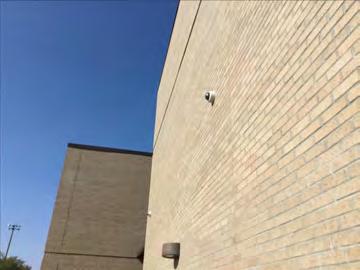
154 Campus Assessment Report - Site G Electrical Distribution G Site Lighting G Site Communications & Security Mar 11, 2017 Page 154 of 161
NC School District/430 Harnett County/Middle School Highland Middle Final Campus Assessment Report March 11, 2017
 NC School District/430 Harnett County/Middle School Highland Middle Final Campus Assessment Report March 11, 2017 PARSONS Campus Assessment Report Table of Contents Campus Executive Summary 5 Campus Dashboard
Anson County Early College High
 NC School District/040 Anson County/High School Anson County Early College High Final Campus Assessment Report March 11, 2017 PARSONS Campus Assessment Report Table of Contents Campus Executive Summary
Anderson Creek Primary
 NC School District/430 Harnett County/Elementary School Anderson Creek Primary Final Campus Assessment Report March 11, 2017 PARSONS Campus Assessment Report Table of Contents Campus Executive Summary
Laurel Hill Elementary
 NC School District/830 Scotland County/Elementary School Laurel Hill Elementary Final Campus Assessment Report March 11, 2017 PARSONS Campus Assessment Report Table of Contents Campus Executive Summary
Pinebrook Elementary
 NC School District/300 Davie County/Elementary School Pinebrook Elementary Final Campus Assessment Report March 10, 2017 PARSONS Campus Assessment Report Table of Contents Campus Executive Summary 6 Campus
Mountain Heritage High
 NC School District/995 Yancey County/High School Mountain Heritage High Final Campus Assessment Report March 12, 2017 PARSONS Campus Assessment Report Table of Contents Campus Executive Summary 7 Campus
Davie County Early College High
 NC School District/300 Davie County/High School Davie County Early College High Final Campus Assessment Report March 10, 2017 PARSONS Campus Assessment Report Table of Contents Campus Executive Summary
Harnett Central Middle
 NC School District/430 Harnett County/Middle School Harnett Central Middle Final Campus Assessment Report March 11, 2017 PARSONS Campus Assessment Report Table of Contents Campus Executive Summary 5 Campus
Ronald E. McNair Discovery Learning Academy
 DeKalb County School District/Elementary Schools Ronald E. McNair Discovery Learning Academy Final School Assessment Report May 20, 2016 PARSONS School Assessment Report Table of Contents School Executive
NC School District/520 Jones County/Elementary School Trenton Elementary Final Campus Assessment Report March 11, 2017
 NC School District/520 Jones County/Elementary School Trenton Elementary Final Campus Assessment Report March 11, 2017 PARSONS Campus Assessment Report Table of Contents Campus Executive Summary 4 Campus
DeKalb County School District/Elementary Schools Dunwoody Elementary Final School Assessment Report May 19, 2016
 DeKalb County School District/Elementary Schools Dunwoody Elementary Final School Assessment Report May 19, 2016 PARSONS School Assessment Report Table of Contents School Executive Summary 4 School Condition
Central Davie Academy
 NC School District/300 Davie County/High School Central Davie Academy Final Campus Assessment Report March 10, 2017 PARSONS Campus Assessment Report Table of Contents Campus Executive Summary 4 Campus
William Bradley Bryant Center
 DeKalb County School District/Education Other William Bradley Bryant Center Final School Assessment Report May 19, 2016 PARSONS School Assessment Report Table of Contents School Executive Summary 4 School
Pleasantdale Elementary
 DeKalb County School District/Elementary Schools Pleasantdale Elementary Final School Assessment Report May 20, 2016 PARSONS School Assessment Report Table of Contents School Executive Summary 5 School
Robert Shaw Theme Elementary
 DeKalb County School District/Elementary Schools Robert Shaw Theme Elementary Final School Assessment Report May 20, 2016 PARSONS School Assessment Report Table of Contents School Executive Summary 4 School
Lafayette Elementary
 NC School District/430 Harnett County/Elementary School Lafayette Elementary Final Campus Assessment Report March 11, 2017 PARSONS Campus Assessment Report Table of Contents Campus Executive Summary 5
DeKalb County School District/High Schools Druid Hills High Final School Assessment Report May 19, 2016
 DeKalb County School District/High Schools Druid Hills High Final School Assessment Report May 19, 2016 PARSONS School Assessment Report Table of Contents School Executive Summary 5 School Condition Summary
Stone Mountain Middle
 DeKalb County School District/Middle Schools Stone Mountain Middle Final School Assessment Report May 20, 2016 PARSONS School Assessment Report Table of Contents School Executive Summary 4 School Condition
DeKalb Elementary School of the Arts at Terry Mills
 DeKalb County School District/Elementary Schools DeKalb Elementary School of the Arts at Terry Mills Final School Assessment Report May 19, 2016 PARSONS School Assessment Report Table of Contents School
Bob Mathis Elementary
 DeKalb County School District/Elementary Schools Bob Mathis Elementary Final School Assessment Report May 19, 2016 PARSONS School Assessment Report Table of Contents School Executive Summary 4 School Condition
Sagamore Hills Elementary
 DeKalb County School District/Elementary Schools Sagamore Hills Elementary Final School Assessment Report May 20, 2016 PARSONS School Assessment Report Table of Contents School Executive Summary 4 School
William Ellis Middle
 NC School District/300 Davie County/Middle School William Ellis Middle Final Campus Assessment Report March 10, 2017 PARSONS Campus Assessment Report Table of Contents Campus Executive Summary 5 Campus
NC School District/430 Harnett County/Elementary School Gentry Primary Final Campus Assessment Report March 11, 2017
 NC School District/430 Harnett County/Elementary School Gentry Primary Final Campus Assessment Report March 11, 2017 PARSONS Campus Assessment Report Table of Contents Campus Executive Summary 6 Campus
DeKalb County School District/Middle Schools Chapel Hill Middle Final School Assessment Report May 20, 2016
 DeKalb County School District/Middle Schools Chapel Hill Middle Final School Assessment Report May 20, 2016 PARSONS School Assessment Report Table of Contents School Executive Summary 3 School Condition
Mocksville Elementary
 NC School District/300 Davie County/Elementary School Mocksville Elementary Final Campus Assessment Report March 10, 2017 PARSONS Campus Assessment Report Table of Contents Campus Executive Summary 5 Campus
Martin Luther King Jr. High
 DeKalb County School District/High Schools Martin Luther King Jr. High Final School Assessment Report May 19, 2016 PARSONS School Assessment Report Table of Contents School Executive Summary 4 School Condition
DeKalb County School District/Middle Schools Peachtree Middle Final School Assessment Report May 20, 2016
 DeKalb County School District/Middle Schools Peachtree Middle Final School Assessment Report May 20, 2016 PARSONS School Assessment Report Table of Contents School Executive Summary 3 School Condition
NC School District/430 Harnett County/Elementary School Coats Elementary Final Campus Assessment Report March 11, 2017
 NC School District/430 Harnett County/Elementary School Coats Elementary Final Campus Assessment Report March 11, 2017 PARSONS Campus Assessment Report Table of Contents Campus Executive Summary 5 Campus
Lilesville Elementary
 NC School District/040 Anson County/Elementary School Lilesville Elementary Final Campus Assessment Report March 11, 2017 PARSONS Campus Assessment Report Table of Contents Campus Executive Summary 4 Campus
Backlog Reduction Plan
 2003-2013 Executive Summary proposes to achieve reductions in our facilities maintenance backlog by documenting and completing backlog projects on a priority basis and by minimizing or eliminating future
BUILDING CONDITION ASSESSMENT. A Comprehensive Approach in Energy and Facility Management
 BUILDING CONDITION ASSESSMENT A Comprehensive Approach in Energy and Facility Management Presentation Outline Page Nadine International Company Profile.. 3 FCI -Industry Preferred Formula.... 4 FCI -Other
Listing of Events Fort McMurray Roman Catholic Seperate School District Fr. M. Beauregard School
 Fort McMurray Roman Catholic Seperate School District Fr. M. Beauregard School Building Events 2004 2005 2006 2007 2008 Total Code Repair Add ventilation to storage room $ 1,000.00 $ - $ - $ - $ - $ 1,000.00
Howsyth Court Condominium Corporation No. CCN Avenue SW Calgary, Alberta
 Entuitive Corporation Calgary + Toronto Howsyth Court Condominium Corporation No. CCN9011190 305 25 Avenue SW Calgary, Alberta Submitted By: Entuitive Corporation 209 8 th Avenue SW, Suite 300 Calgary,
Subject: Capital Reserve Expenditure Guidelines. *incl. former OCHAP/CSHP Peel Access to Housing (PATH)
") HIP Housing In Peel Subject: Capital Reserve Expenditure Guidelines Date: August 1, 2012 Applicable To The information contained in this document applies to the following: Municipal & Private Non- Federal
HIP Housing In Peel Subject: Capital Reserve Expenditure Guidelines Date: August 1, 2012 Applicable To The information contained in this document applies to the following: Municipal & Private Non- Federal
ORIGINAL YEAR OF CONSTRUCTION NUMBER OF BUILDING STORIES 4/19/2013 BUILDING SURVEY DATE
 0134 614 EAST PENNSYLVANIA AVENUE CHAMPAIGN, ILLINOIS 61820 SYSTEM CONDITION INDEX.528 PRIMARY BUILDING USE BUILDING SURVEY TEAM BUILDING SYSTEM REPLACEMENT COST $ 495,100 LABORATORY BUILDING GROSS SQUARE
ORIGINAL YEAR OF CONSTRUCTION NUMBER OF BUILDING STORIES 2/15/2013 BUILDING SURVEY DATE
 0807 3502 SOUTH FIRST STREET CHAMPAIGN, ILLINOIS SYSTEM CONDITION INDEX.771 PRIMARY BUILDING USE BUILDING SURVEY TEAM BUILDING SYSTEM REPLACEMENT COST $ 347,400 LABORATORY BUILDING GROSS SQUARE FEET 16,986
Social Housing Administration Directive No
 Regional Municipality of Halton Social Housing Administration Directive No. 06-05 Date: August 30, 06 To: Federally-Funded Social Housing Providers subject to Operating Agreements under Section 95 of the
Integrating Green Building Measures into Capital Planning for HUD Assisted and Public Housing Programs
 Building Bridges to Net Zero Integrating Green Building Measures into Capital Planning for HUD Assisted and Public Housing Programs Evolution of HUD's Green Capital Needs Assessment, and the new CNA etool
Reserve Analysis Report
 Reserve Analysis Report Parkway Towers 1155 Ash St Denver, CO 80220 Level I Study with Site Inspection Fiscal Year End Date: 12/31/2014 8597 Via Mallorca Suite E La Jolla, CA 92037 Phone: 858-764-1895
City School District of Albany Five Year Facilities Plan 3/14/2019
 Bold indicates change from 3/7/19 BOE meeting Available Local Share $ 3,300,000 1 SPA Air condition gymnasium $ 267,000 1 $ 41,385 $ 41,385 $ 267,000 2 DCS Air condition gymnasium $ 221,000 1 $ 34,255
Our Focus: Your Future
 Town of Fort Erie Infrastructure Services Our Focus: Your Future Prepared for Council-in-Committee Report No. IS-53-07 Agenda Date November 19, 2007 File No. 220102 Subject 5 YEAR FACILITY CONDITION STATUS
Educational & Performing Arts Center: Downriver Campus
 Educational & Performing Arts Center: Total Estimated Project Construction Cost: $ 18.04 million Groundbreaking: September 2006 Percentage Completed: 100 percent Anticipated Completion Date: Completed
Agenda Item # 5b Page 1 of 43
 Page 1 of 43 Page 2 of 43 Page 3 of 43 Page 4 of 43 Page 5 of 43 Page 6 of 43 Page 7 of 43 Page 8 of 43 Page 9 of 43 Page 10 of 43 Page 11 of 43 Page 12 of 43 Page 13 of 43 Page 14 of 43 Page 15 of 43
Board of Trustees Proposition Summary Table of Contents
 Table of Contents Table of Contents... ii 1 Facilities Condition Assessment... 2 1.1 Priority One... 2 1.2 Priority Two... 5 1.3 Priority Three... 7 1.4 Priority Four... 9 2 Major Projects... 10 2.1 Facility
Urban Heights Condominium
 Condominium Capital 2011 2010, AssociationAnalysis, LLC Condominium Prepared For: Table of Contents Condominium Association, Inc. 1642 Maxwell Road Atlanta, GA 30012 October 19, 2010 INTRODUCTION INTRODUCTION
Reference: The Bel-Harbour Condominium Association Reserve Study Update Kipcon Great Lakes Project No CRU
 August 18, 2016 Mr. Nicholas Burbulis 420 W. Belmont Ave. Chicago, IL 60657 Reference: The Kipcon Great Lakes Dear Mr. Burbulis: Attached, please find Kipcon Great Lakes, which has been prepared for the.
CAPITAL RESERVE STUDY
 CAPITAL RESERVE STUDY FOR THE HIALEAH CONDOMINIUM WILDWOOD CREST, NEW JERSEY Project Number: 12-1066 W:\2012\12-1066\CORR\12-1066v1.doc Date: March 29, 2013 Table of Contents Section Page Executive Summary...
PROFESSIONAL RESERVE STUDY
 PROFESSIONAL RESERVE STUDY Seavue Condominiums 130-5 th Avenue South, Edmonds, WA 98020 For: Seavue Homeowners Association c/o Jay Grant Board President (202) 351-9399 Prepared By: Jeff Samdal, PE, RS,
Body Corporate ten year maintenance plan example for South Africa
 Body Corporate ten year maintenance plan example for South Africa Prepared by: Date: This plan covers the period of ten years from.. Building details & report inputs Supplied information Building name
Property Assessment Form Property Data. Servicer and Loan Data
 Property Data Property Name: Holmead Apartments Property Address: 3435 Holmead Place NW Change from previously reported City: Washington State: DC Zip: 20010 # Units: 101 # Buildings: 1 Year Built: 1951
Washingtonville Central School District Building Condition Survey Five Year Plan
 Building Condition Survey Five Year Plan Project Cost Summary Building 2011 2012 2013 2014 2015 Totals 0001 Washingtonville Jr High School $38,759 $325,990 $1,882,653 $1,417,341 $1,025,559 $4,690,302 0002
Reserve Study Transmittal Letter
 Reserve Study Transmittal Letter Date: January 18, 2012 To: Michael Lee, Collins Management Co. From: Richard Avelar & Associates (RA&A) Re: Bridgewater Condominium Association Attached, please find the
1. CALL TO ORDER AND RECOGNITION OF A QUORUM
 Mesa Union School District Agenda for the Special Board Meeting of the Board of Trustees to be held on Thursday, May 3, 2018, at 6:00 p.m. in the School Multi-Purpose Room located at 3901 North Mesa School
CAPITAL FUNDING SUMMARY
 CAPITAL SUMMARY SCC (School Consolidation Capital ) CAPITAL : B19 -December 1, Specifically to address a school board s excess capacity : B11 -May 26, Opportunity to identify most urgent & pressing accommodations
CAPITAL RESERVE STUDY. Meadow Wood Commons. City, State
 CAPITAL RESERVE STUDY FOR THE Meadow Wood Commons City, State Management Company: Any Management Company Contact Name: Mr. Bob Smith Date: July 28, 2014 Table of Contents Section Name Section # Executive
Hayfield Community Schools Bond Referendum. Vote Monday, September 11, Our Schools Our Communities Our Future
 Hayfield Community Schools 2017 Bond Referendum Vote Monday, September 11, 2017 Our Schools Our Communities Our Future 2017 Bond Referendum What s Already Been Done? Studies and Meetings and Meetings 2014-15
ORIGINAL YEAR OF CONSTRUCTION NUMBER OF BUILDING STORIES 6/19/2013 BUILDING SURVEY DATE
 0154 52 EAST GREGORY DRIVE CHAMPAIGN, ILLINOIS 61820 SYSTEM CONDITION INDEX.646 PRIMARY BUILDING USE BUILDING SURVEY TEAM BUILDING SYSTEM REPLACEMENT COST $ 1,203,500 OFFICE BUILDING GROSS SQUARE FEET
ORIGINAL YEAR OF CONSTRUCTION NUMBER OF BUILDING STORIES 2/6/2013 BUILDING SURVEY DATE
 0133 608 EAST PENNSYLVANIA AVENUE CHAMPAIGN, ILLINOIS 61820 SYSTEM CONDITION INDEX.516 PRIMARY BUILDING USE BUILDING SURVEY TEAM BUILDING SYSTEM REPLACEMENT COST $ 646,900 PARKING STRUCTURE BUILDING GROSS
Facility Condition Assessment Report. Coast Community College District
 Facility Condition Assessment Report Coast Community College District February 28, 2003 Introduction To help document the need for funding the necessary replacement and upgrading of facilities within California
Depreciation Report Level I
 Depreciation Report Level I Prepared for Strata VIS 2720 s 2013 Fiscal Year Prepared by RBC STRATA CONSULTING LTD. Version 3.1 2014 RBC STRATA CONSULTING LTD. Have questions about this Depreciation Report.
DEPRECIATION REPORT Strata VR 1591 The Leicester West 13th Avenue Vancouver BC V6J 2G5
 DEPRECIATION REPORT 2015 Strata VR 1591 The Leicester 1545 West 13th Avenue Vancouver BC V6J 2G5 Created by Strata Council Members Merry Meredith Tom Heise Antoine Issa The authors have compiled this report
Capital Projects Completed since 1988
 Projects Completed since 1988 Project Cost FY1988 ICCB Building Illinois Repair & Renovation - Replace Carpet in Classroom Buildings, Library and Lobby of Admin $ 51,901.00 $ 51,901.00 $ 51,901.00 FY1990
Reserve Fund Study My Condominium Plan
 Reserve Fund Study My Condominium Plan 12 3456 Number of Units 36 Number of Buildings 1 Building Construction 21 Contact Ima Happy Position(s) President Contact Phone 43.555.4321 Report Date August 8,
WASHINGTON BROWN DEPRECIATION PTY LTD
 Wednesday, 4 July 2007 The Owners - Strata Plan Number C/- Strata Management Company Address PROPERTY ADDRESS SINKING FUND FORECAST REPORT For the attention of: Strata Manager Dear Strata Manager, In accordance
Tumwater University School District Budget Myths Bond Project Update. February 2016 Mel Murray, Director of Capital Projects John Bash, Superintendent
 Tumwater University School District Budget Myths Bond Project Update February 2016 Mel Murray, Director of Capital Projects John Bash, Superintendent Construction Update $136,000,000 in bonds approved
NCAHMA Spring Underwriting Forum April 7-8, 2010 Physical Needs Assessments
 NCAHMA Spring Underwriting Forum April 7-8, 2010 Physical Needs Assessments 1. What is a CNA? Presentation by: Thomas E. Fielder Phone: 859-276-0000 / tfielder@fieldergroup.com a) Comprehensive review
ORIGINAL YEAR OF CONSTRUCTION NUMBER OF BUILDING STORIES 6/18/2013 BUILDING SURVEY DATE
 0238 URBANA, ILLINOIS 61801 SYSTEM CONDITION INDEX.183 PRIMARY BUILDING USE BUILDING SURVEY TEAM BUILDING SYSTEM REPLACEMENT COST $ 1,237,600 OFFICE BUILDING GROSS SQUARE FEET 18,054 NUMBER OF BUILDING
Burlington Area School District Community Survey Results. Winter 2016
 Burlington Area School District Community Survey Results Winter 2016 Survey Summary The community survey was conducted in December of 2016. Residents within the District were mailed a paper survey. Each
THE VINEYARDS AT DUBLIN GREENE OWNERS ASSOCIATION
 THE VINEYARDS AT DUBLIN GREENE OWNERS ASSOCIATION Full Reserve Study With On-site Visual Inspection October 3, 2018 Reserve Study for Fiscal Year: 01/01/2019 through 12/31/2019 2059 Camden Ave. Suite 151
VENDOR PREQUALIFICATION FORM
 VENDOR PREQUALIFICATION FORM Date: Please complete this form and return to Rockford Construction via e mail (prequal@rockfordconstruction.com) or fax (1 616 285 8423 must include the 1 616). Name of Company
Springfield High School
 5.1 Springfield High School Springfield School District Delaware County - Pennsylvania Master Plan Presentation Town Hall Meeting 5 Project Cost Estimates/ Project Financing Strategy / Tax Impact February
Desktop Facilities Assessment
 Desktop Facilities Assessment Town of Gravenhurst 3-5 Pineridge Gate Gravenhurst, Ontario PP Z3 R.J. Burnside & Associates Limited 28 Wellington Street West Suite 30 Barrie ON L4N 8J6 CANADA January 20,
REPLACEMENT RESERVE GUIDE
 CANADA MORTGAGE AND HOUSING CORPORATION REPLACEMENT RESERVE GUIDE What is the Replacement Reserve? The replacement reserve is a fund kept by each housing sponsor under the terms of its operating agreement
ORIGINAL YEAR OF CONSTRUCTION NUMBER OF BUILDING STORIES 6/5/2013 BUILDING SURVEY DATE
 0062 1105 WEST NEVADA STREET URBANA, ILLINOIS 61801 SYSTEM CONDITION INDEX.850 PRIMARY BUILDING USE BUILDING SURVEY TEAM BUILDING SYSTEM REPLACEMENT COST $ 2,286,000 LABORATORY BUILDING GROSS SQUARE FEET
Update With Site Visit
 Update With Site Visit Le Chateau Bellevue, WA 10/28/2011 Report #1002 Phone: 253-241-8151 Fax: 360-872-8073 E-mail: jeremy@reservesolutions.net www.reservesolutions.net Le Chateau Client Info: REPORT
Northern Gateway Regional Division No.10 Listing of Events
 Building Events Maintenance Events D2020.01.03 Piping Specialties (Backflow Preventors)** David Ovans Elementary School B3989A Code Northern Gateway Regional Division No.10 Install vacuum breakers on non
Reserve Analysis Report
 Reserve Analysis Report Sample Condominium Association Laguna Hills, California Version 1 March 31, 2004 23201 Mill Creek Drive, Suite 100 Laguna Hills, California 92653 Phone (949) 474-9800 Facsimile
Measure RR Bond Budget by Project. Measure RR BAN Measure RR BAN Interest Measure RR Series AB Measure RR Series AB Interest
 6/30/15 15/16 Thru 6/30/15 15/16 Thru 6/30/15 15/16 Thru 6/30/15 15/16 A Library, Learning Resources and Campus Center 217,200 GSF; State Funding component; begin design est. 2015/16 771120 $ 197,529.21
ORIGINAL YEAR OF CONSTRUCTION NUMBER OF BUILDING STORIES 6/6/2013 BUILDING SURVEY DATE
 0004 1103 SOUTH SIXTH STREET CHAMPAIGN, ILLINOIS 61820 SYSTEM CONDITION INDEX.810 PRIMARY BUILDING USE BUILDING SURVEY TEAM BUILDING SYSTEM REPLACEMENT COST $ 1,831,000 CLASSROOMS / LIBRARY BUILDING GROSS
Final Report. Capital Plan Building Condition and Energy Assessments Khyber Building 1588 Barrington Street Halifax, Nova Scotia
 Capital Management Engineering Limited EMPOWERING OUR CLIENTS WITH KNOWLEDGE 5531 Cornwallis Street, Halifax, NS, Canada B3K 1B3 Phone: 902 429 4412 Fax: 902 423 4945 Final Report Capital Plan Building
ORIGINAL YEAR OF CONSTRUCTION NUMBER OF BUILDING STORIES 6/18/2013 BUILDING SURVEY DATE
 0358 1004 SOUTH FOURTH STREET CHAMPAIGN, ILLINOIS 61820 SYSTEM CONDITION INDEX.508 PRIMARY BUILDING USE BUILDING SURVEY TEAM BUILDING SYSTEM REPLACEMENT COST $ 2,281,700 CLASSROOMS / LIBRARY BUILDING GROSS
PROFESSIONAL RESERVE STUDY
 PROFESSIONAL RESERVE STUDY Cambridge Court 9512-1 st Avenue Northeast, Seattle, WA 98115 For: Cambridge Court Homeowners Association c/o Tim Kammer, Property Manager Condo Managements, Inc. 1661 Harbor
Page Item 174 Overview 175 Revenue 177 Expenditures 178 Elementary School Allocation 180 Middle School Allocation 181 High School Allocation 182
 Page Item 174 Overview 175 Revenue 177 Expenditures 178 Elementary School Allocation 180 Middle School Allocation 181 High School Allocation 182 Operational Services/Central Services/Axtell Park School
Physical Plant. Five-Year Capital Budget Plan. State College Area School District November Page 1 of 15
 Physical Plant Five-Year Capital Budget Plan State College Area School District November 2011 Page 1 of 15 Table of Contents Background and 2013 Projects Pages 3-5 Funding Level Pages 6-7 Existing Buildings
OVERSIGHT OF MEASURE C SPENDING THE CITIZENS OVERSIGHT COMMITTEE
 MEASURE C SCHOOL SAFETY AND MODERNIZATION On November 3, 2009 the voters residing in the Mill Valley School District (MVSD) approved the Measure C Safety and Modernization Bond of 2009 (Measure C). Measure
ORIGINAL YEAR OF CONSTRUCTION NUMBER OF BUILDING STORIES 4/11/2013 BUILDING SURVEY DATE
 0040 1402 WEST PENNSYLVANIA AVENUE URBANA, ILLINOIS 61801 SYSTEM CONDITION INDEX.685 PRIMARY BUILDING USE BUILDING SURVEY TEAM BUILDING SYSTEM REPLACEMENT COST $ 1,364,800 LECTURE HALL BUILDING GROSS SQUARE
Boca Rio Condominium Homeowners Association LEVEL III: UPDATE RESERVE STUDY December 31, 2017
 Boca Rio Condominium Homeowners Association LEVEL III: UPDATE RESERVE STUDY Section Page RESERVE STUDY EXECUTIVE SUMMARY 1-2 ASSESSMENT AND RESERVE FUNDING 3 DISCLOSURE SUMMARY (These 3 pages should be
Progress Update Identified Needs & Capital Plan
 Progress Update Identified Needs & Capital Plan May 29, 2012 Buena Park School District Facilities Assessment & Implementation Plan 0 Facilities Planning, Public Finance, Program Administration Summary
Release Date: January 3, 2019 Due Date: January 17, 2019
 SAN JUAN SCHOOL DISTRICT REQUEST FOR BID CONSTRUCTION OF NEW BLUFF ELEMENTARY SCHOOL AND NEW MONTEZUMA CREEK ELEMENTARY GYM Release Date: January 3, 2019 Due Date: January 17, 2019 I. GENERAL A. Intent
Reserve Request Instructions: Documentation Requirements
 Reserve Request Instructions: Documentation Requirements These instructions specify documentation that must be submitted with requests for withdrawals from property reserve accounts held by IHDA. All requests
November 22, Boca Rio Condominium Homeowners Association Board of Directors Blossom Valley Road El Cajon, CA Attn: Robin Clegg
 Sonnenberg & Company, CPAs 5190 Governor Drive, Suite 201, San Diego, California 92122 Phone: (858) 457-5252 -- (800) 464-4HOA -- Fax: (858) 457-2211 -- (800) 303-4FAX November 22, 2017 Boca Rio Condominium
DRAFT CAPITAL RESERVE STUDY. The Piano Works Condominium Association. Deep River, Connecticut FOR THE. Project Number:
 CAPITAL RESERVE STUDY DRAFT FOR THE Management Company: Sound Real Estate Services, Contact Name: Josh Parsons Date: August 22, 2016 Table of Contents Section Name Section # Executive Summary... 1 Reserve
Town of Middleton Salt Storage Building Pioneer Road Pioneer Lands Town of Middleton Dane County, WI 53562
 Town of Middleton Salt Storage Building Pioneer Road Pioneer Lands Town of Middleton Dane County, WI 53562 1 T100 PROJECT LOCATION MAP Scale: NTS N Revisions: No. Date: Description: Scale As Indicated
NUNAVUT HOUSING CORPORATION. Home Renovation Program (HRP)
") NUNAVUT HOUSING CORPORATION Home Renovation (HRP) October 2014 Date October 201 TABLE OF CONTENTS OBJECTIVE... 1 SUMMARY... 1 ENABLING LEGISLATION... 1 ELIGIBLE CLIENTS... 1 PRIORITY OF APPLICANTS...
NUNAVUT HOUSING CORPORATION Home Renovation (HRP) October 2014 Date October 201 TABLE OF CONTENTS OBJECTIVE... 1 SUMMARY... 1 ENABLING LEGISLATION... 1 ELIGIBLE CLIENTS... 1 PRIORITY OF APPLICANTS...
ORIGINAL YEAR OF CONSTRUCTION NUMBER OF BUILDING STORIES 6/4/2013 BUILDING SURVEY DATE
 0218 504 EAST ARMORY AVENUE CHAMPAIGN, ILLINOIS 61820 SYSTEM CONDITION INDEX.764 PRIMARY BUILDING USE BUILDING SURVEY TEAM BUILDING SYSTEM REPLACEMENT COST $ 1,714,300 OFFICE BUILDING GROSS SQUARE FEET
POJOAQUE VALLEY SCHOOL DISTRICT October 12, 2016
 POJOAQUE VALLEY SCHOOL DISTRICT October 2, 206 Results from data gathered from community meeting held September 20, 206 regarding use of current bond funds and goals setting for possible 207 bond On Tuesday,
PROFESSIONAL RESERVE STUDY
 PROFESSIONAL RESERVE STUDY Tamarack Village 10701 to 10798-221 st Lane NE, Redmond, WA 98053 For: Tamrack Village Homeowners Association c/o Jason Kozleski Board President 10790-221 st Lane NE Redmond,
CIP FY2015 FY2019 Requests SCH-1, SCH-2 and SCH-5
 CIP FY2015 FY2019 Requests SCH-1, SCH-2 and SCH-5 Edwin Ataide Deputy Director Plant & Facilities SCH-1 School Projects All Schools Priority FY15 FY16 FY17 FY18 FY19 ADA Compliance (Handicap Accessibility)
 RESERVE STUDY Component Analysis and Reserve Fund Plan Annual Review Study 2016/17 For Middlefield Meadows HOA Mountain View, CA Prepared By RESERVE ANALYSIS CONSULTING, LLC 1750 Bridgeway, Suite B106
Condominium Reserve Fund Planners Inc.
 Condominium Reserve Fund Planners Inc. Reserve Fund Study York County Condominium Corporation No. 10 185 Reynolds Street Fredericton, NB E3A 0K7 Prepared for Board of Directors May 29, 2014 Table of Contents