Regional Issues Forum Labor Force Trends in Northern Colorado
|
|
|
- Allyson Bond
- 5 years ago
- Views:
Transcription
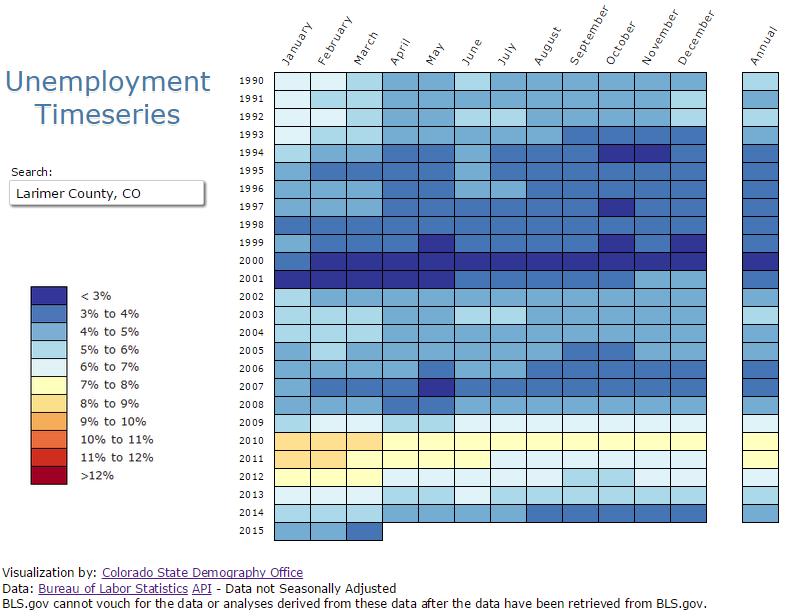
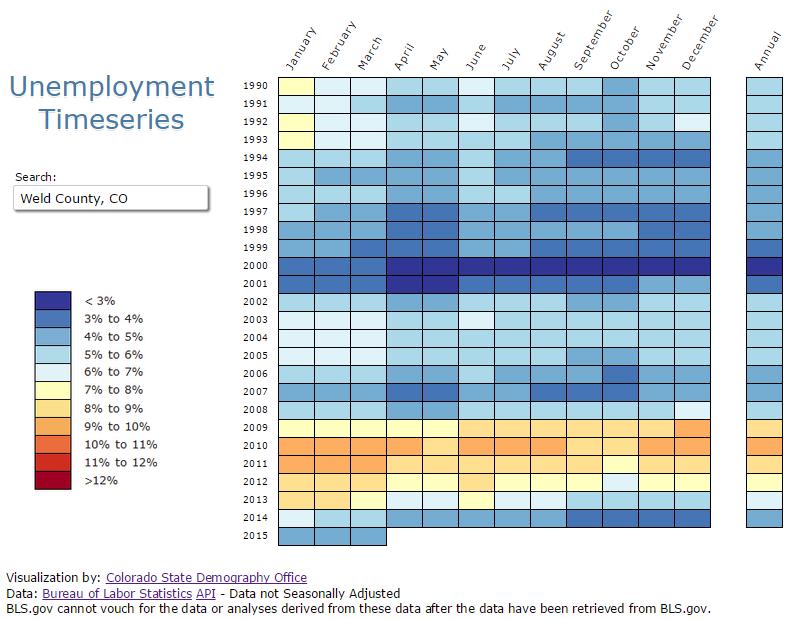
1 Regional Issues Forum Labor Force Trends in Northern Colorado Elizabeth Garner State Demography Office Colorado Department of Local Affairs
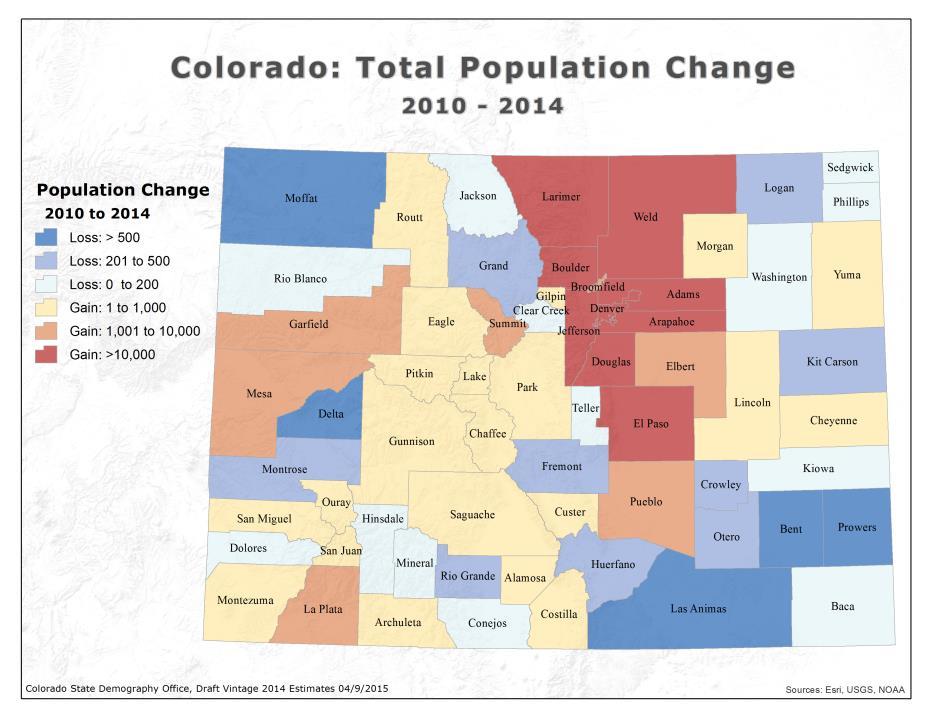
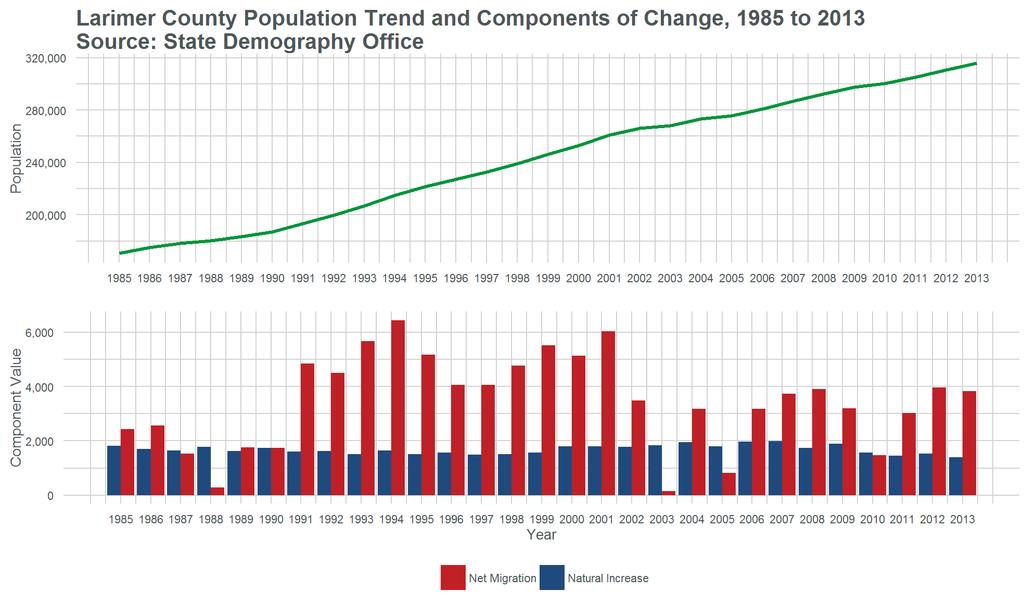
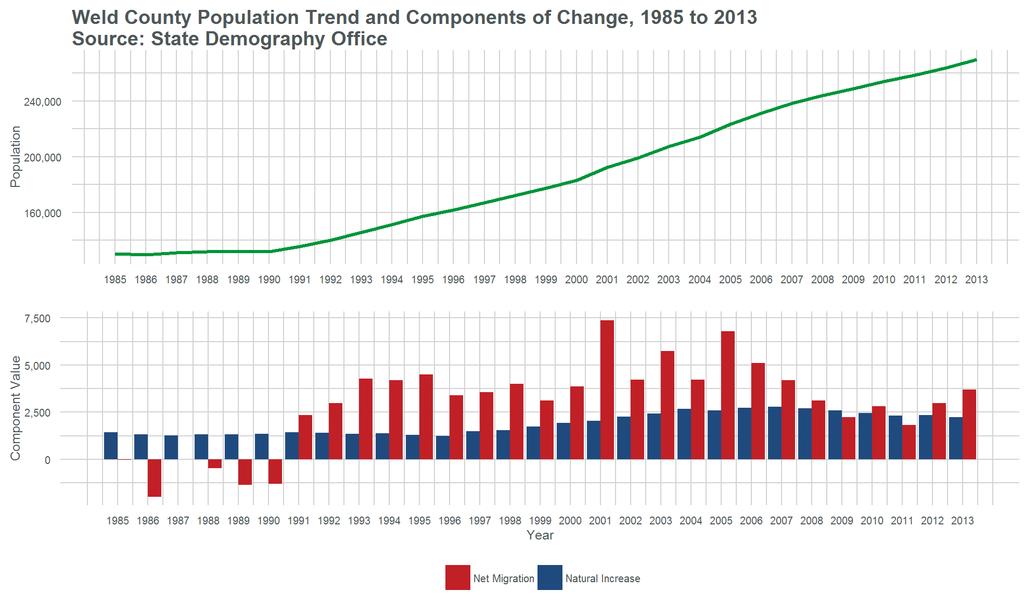
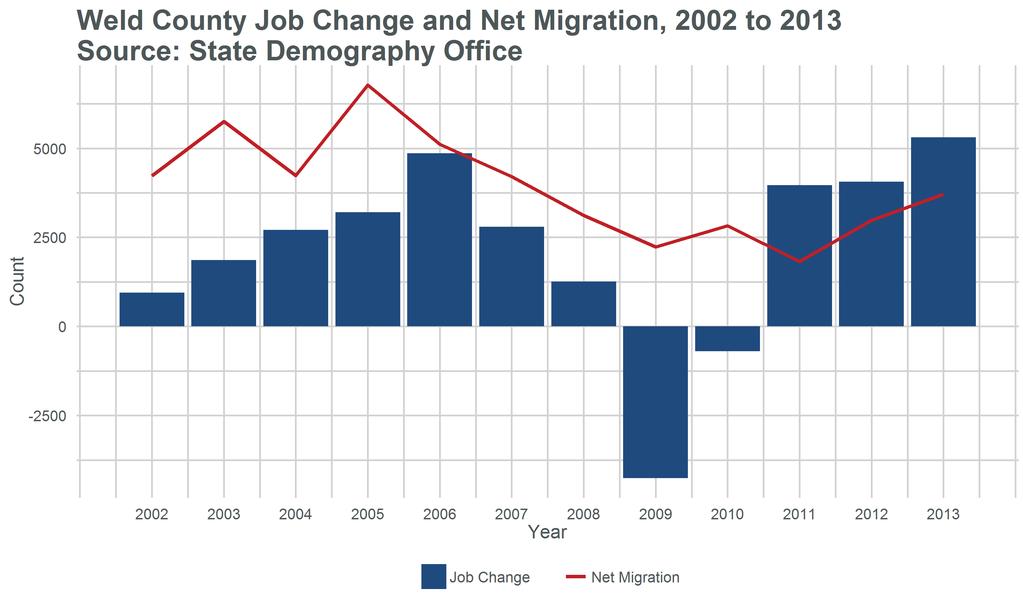
2 Big Picture Pop Change US 318 million, million or.7% Colorado 5,355,000 Ranked 4 th fastest 1.6% - ND, NV, TX 8 th absolute growth 83,700 TX, CA, FL, GA, AZ, NC, WA Range in Colorado - +15,000 to -400 Larimer 2.4% - +7,700 = Total 323K Weld 2.1% - +5,800 = Total 276K
3

4
5
6
7
8
9 100,000 80,000 Colorado New Jobs and Net Migration New Jobs Net Migration 60,000 40,000 20, ,000-40,000 Source: State Demography Office
10
11
12 Jobs and the Economy
13 Employment & Wage % Change % 18.0% 16.0% 14.0% 12.0% 10.0% 8.0% 6.0% 4.0% 2.0% 0.0% Colorado Larimer Weld Employment Growth Avg Weekly Wage Growth
14
15

16
17
18 Age and the Labor Force
19 Falling Labor Force Participation Rates Overall labor force participation rates will continue to decline (as they have since 2000) through Sharpest declines will occur this decade with the rapid aging of the population. Male participation will decline more than female participation.
20
21

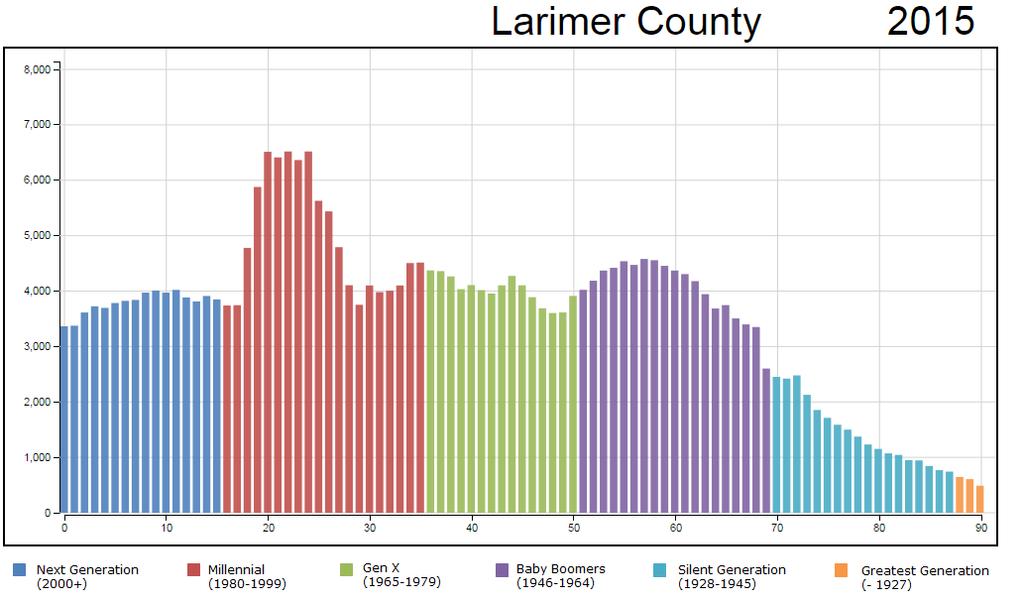
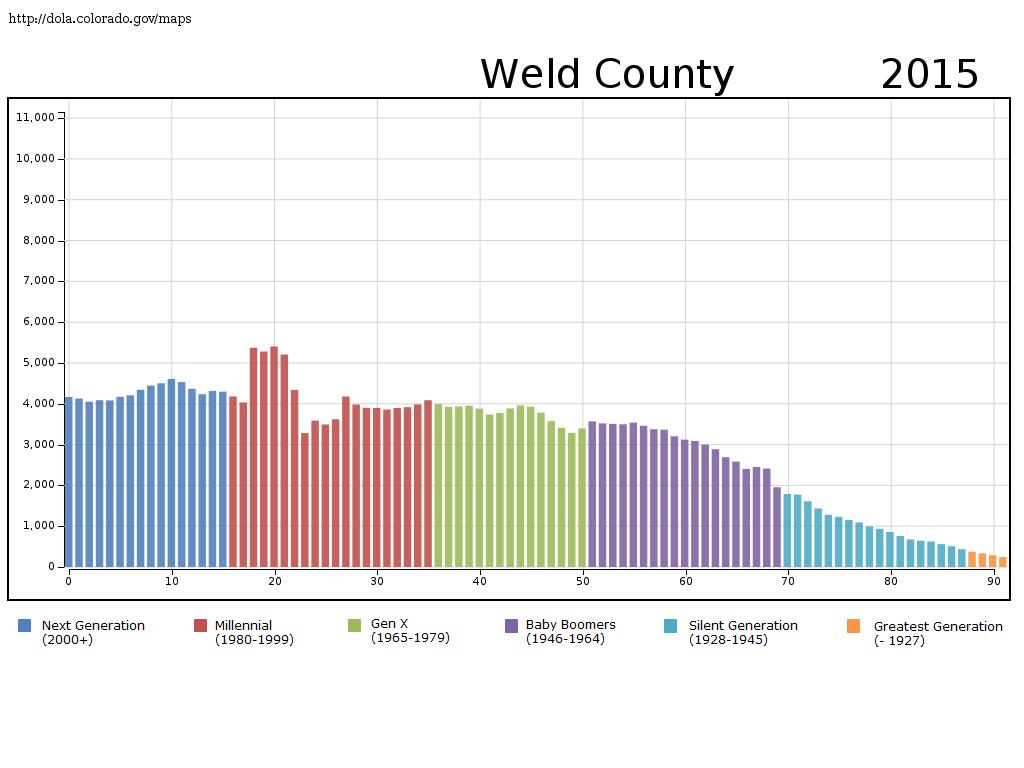
22 Share of labor force by age group State Demography Office
23 Millennial
24 Millennial
25 Share of Net Increase in Working Age Population, American Indian, NH Black, NH White, NH Asian, NH Hispanic 0% 20% 40% 60% 80%
26 Labor Force tightening forces Structural labor force participation rates peaked in 2010 due to aging Female share of the labor force peaked in 2010 at 46%. Growth in Leavers (exiting the labor force) will create more demand for workers. Fewer Gen X Higher un/under employment for year olds. Other states experiencing same concerns. Aging around the world.
27


28 Larimer Commuting Weld Commuting
29 Current Trends
30 10.0% Annual job Growth Rates 1st Half '14 to 1st Half '15 9.0% 8.0% 7.0% 6.0% 5.0% 4.0% 3.0% 2.0% 1.0% 0.0% Jan Feb Mar Apr May June Colorado Larmier Weld
31
32 Potential Impacts from slowing in oil and gas in Weld January 2015 will show up as peak employment From January-June, Weld down about 1,800 in the mining/oil/gas industry. Weld will still show positive job growth in Slowing in Oil and Gas may help other industries. Total impact could be a loss of 2,500-6,000 jobs in the Oil and Gas and related industries.
33 Summary Northern Colorado fast growing region.even without Oil and Gas. Labor market has been tightening due to changes in the age distribution as well as other demographic factors. Oil and Gas and related industries have been and will continue to lose jobs for how long? Both Weld and Larimer have a diverse industrial base and should be able to manage the downturn. Slowing in Oil and Gas may help labor force conditions for other sectors. Can Northern Colorado continue to complete for the Best and the Brightest??
34 Thank you State Demography Office Department of Local Affairs Elizabeth Garner
35
36
37

38
39
40
41 State Demography Office
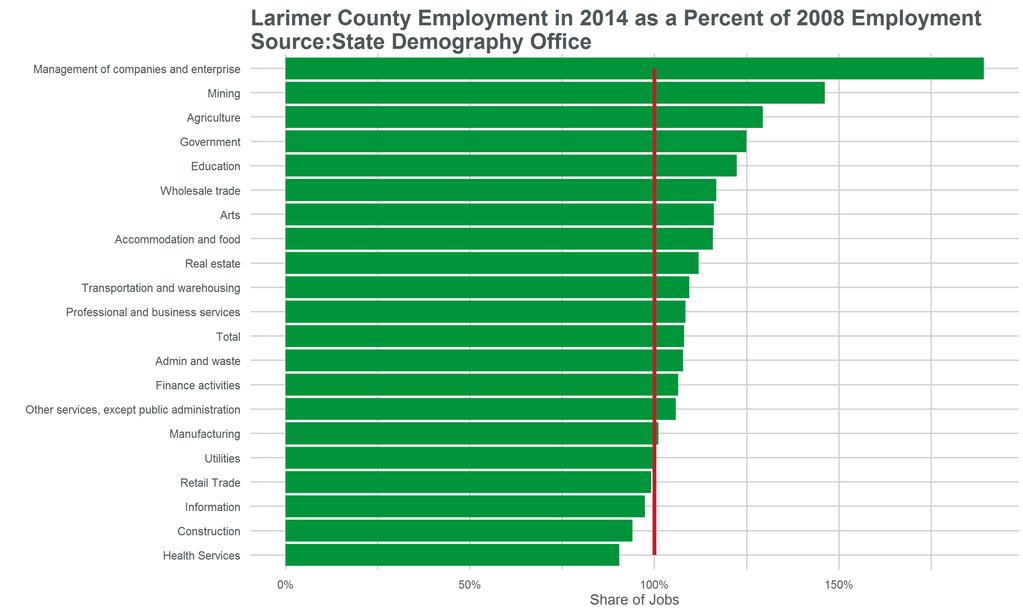
42 +8% since 2008
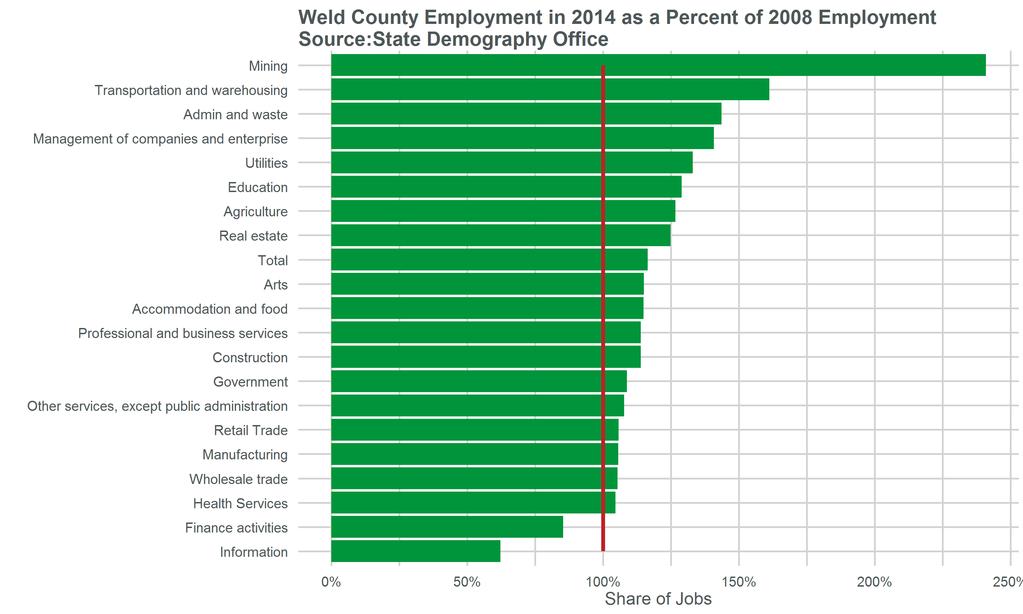
43 +16% since 2008
44 Forecasts - Trends Growth in race/ethnic diversity especially at the young end. Growth in Young and Aging Growth in both high and low end service Labor Force Changes Income Challenges Transition Decade

45 Census Bureau
46
47

48 Growth in leavers will create more demand for workers Source: State Demography Office

49 Colorado labor force change
50 Labor Force Boomers are 37% of the labor force (2010) Staying longer in workforce want and need to Participation rates for ages 65+ increasing. Age relations in the workplace Approx. 1,000,000 workers aging out the next 20 years. Increase demands on labor force Demands will vary by industry Education, Health, Utilities, Mining, Govt. Current low numbers of Long Term Care Workers and Gerontologist Doctors accepting Medicare Increase in demand for caregivers informal sector Metro/urban demands will impact rural areas
51 2015 POVERTY GUIDELINES FOR THE 48 CONTIGUOUS STATES AND THE DISTRICT OF COLUMBIA Persons in family/household Poverty guideline 1 $11,770 2 $15,930 3 $20,090 4 $24,250 5 $28,410 6 $32,570 7 $36,730 8 $40,890

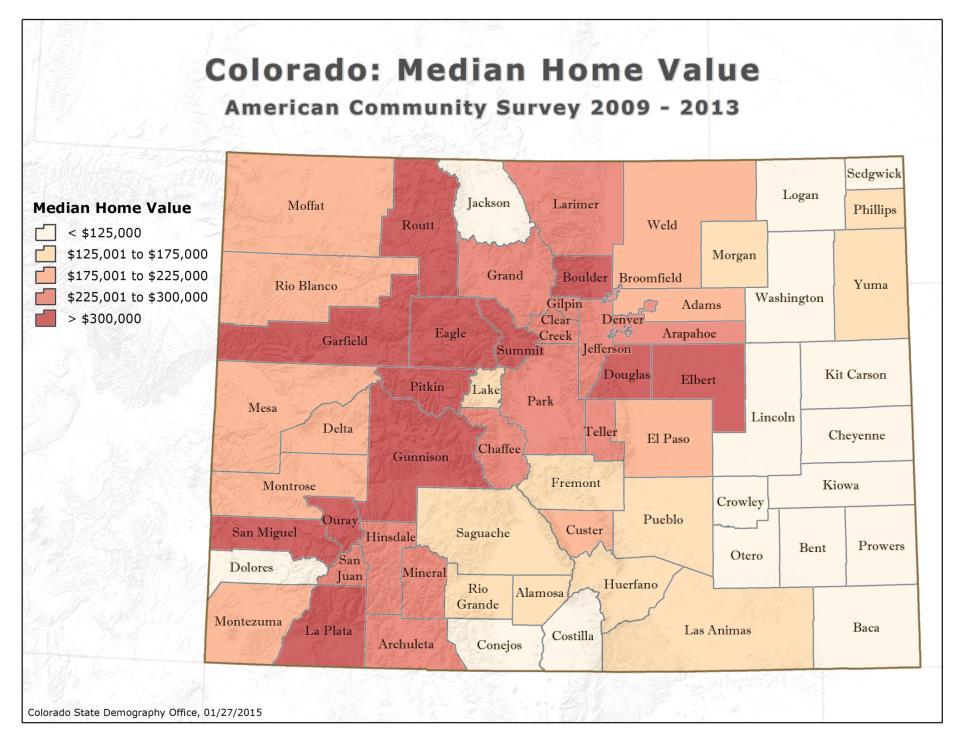
52 Median Home Value
53 Source: State Demography Office
Transitions. Population and Economic Trends For Northern Colorado
 Transitions Population and Economic Trends For Northern Colorado EDCC 2017 Elizabeth Garner State Demography Office Colorado Department of Local Affairs Demography.dola.colorado.gov Transitions to Watch
Colorado and Eagle County
 Colorado and Eagle County Population and Economic Transitions Vail Symposium 2017 Elizabeth Garner State Demography Office Colorado Department of Local Affairs Demography.dola.colorado.gov Ideas Demographics
Transitions. Population and Economic Trends for Colorado and Garfield County
 Transitions Population and Economic Trends for Colorado and Garfield County Elizabeth Garner State Demography Office Colorado Department of Local Affairs Summer 2016 www.colorado.gov/demography Main Points
Transitions. Population and Economic Trends for Colorado
 Transitions Population and Economic Trends for Colorado Cindy DeGroen State Demography Office Colorado Department of Local Affairs 2016 www.colorado.gov/demography State Demography Office State agency
Growing Colorado. Population Transitions In Boulder
 Growing Colorado Population Transitions In Boulder Elizabeth Garner State Demography Office Colorado Department of Local Affairs 2018 Demography.dola.colorado.gov Transitions to Watch Disparate growth
POPULATION AND ECONOMIC OVERVIEW. State Demography Office Colorado Department of Local Affairs February 2014
 POPULATION AND ECONOMIC OVERVIEW State Demography Office Colorado Department of Local Affairs February 2014 Big Picture 2011-2012 Pop Change US 313 million, + 2.3 million or.7% Colorado 5,189,458, + 70,157
DEMOGRAPHY AND THE ECONOMY
 DEMOGRAPHY AND THE ECONOMY David Keyser State Demography Office September 22, 2011 Colorado.gov/demography Demography Powerful Big changes often predictable Informative Today Information about us Role
Rifle city Demographic and Economic Profile
 Rifle city Demographic and Economic Profile Community Quick Facts Population (2014) 9,289 Population Change 2010 to 2014 156 Place Median HH Income (ACS 10-14) $52,539 State Median HH Income (ACS 10-14)
TABLE OF CONTENTS INTRODUCTION... 1
 TABLE OF CONTENTS INTRODUCTION... GENERAL WORKFORCE TRENDS... 3 General Workforce Trends and Comparisons Overview... 5 State Government Employees to State Population... 6 State Government Full-Time Equivalent
TABLE OF CONTENTS INTRODUCTION... 1
 TABLE OF CONTENTS INTRODUCTION... GENERAL WORKFORCE TRENDS... 3 General Workforce Trends and Comparisons Overview... 5 State Government Employees to State Population... 6 State Government Full-Time Equivalent
TABLE OF CONTENTS INTRODUCTION... 1
 TABLE OF CONTENTS INTRODUCTION... GENERAL WORKFORCE TRENDS... 3 General Workforce Trends and Comparisons Overview... 5 State Government Employees to State Population... 6 State Government Full-Time Equivalent
TABLE OF CONTENTS INTRODUCTION... 1
 TABLE OF CONTENTS INTRODUCTION... GENERAL WORKFORCE TRENDS... 3 General Workforce Trends and Comparisons Overview... 5 State Government Employees to State Population... 6 State Government Full-Time Equivalent
From Crisis to Transition Demographic trends and American housing futures, with lessons from Texas
 From Crisis to Transition Demographic trends and American housing futures, with lessons from Texas Rolf Pendall, Ph.D. The Urban Institute Presentation to the Bipartisan Housing Commission, San Antonio,
Utah s Long Run Demographic Trends: Evolving Community Contexts
 Utah s Long Run Demographic Trends: Evolving Community Contexts Pamela S. Perlich, Ph.D. Director, Demographic Research Kem C. Gardner Policy Institute, University of Utah GROWTH Intermountain States Population:
Regional Data Snapshot
 Regional Data Snapshot Population, Economy & Education Features SET Civic Forum Forest Country Region (FCR), Texas Table of Contents 01 Overview 03 Human Capital 02 Demography 04 Labor Force 01 overview
Regional Data Snapshot
 Regional Data Snapshot Population, Economy & Education Features SET Civic Forum Ozark Foothills Region, Missouri Table of Contents 01 Overview 03 Human Capital 02 Demography 04 Labor Force 01 overview
The Affordable Care Act (ACA)
") The Affordable Care Act (ACA) An Overview by the Kaiser Family Foundation NBC News Editorial Roundtable June 26, 2013 1. The Basics of the Affordable Care Act (ACA) Expanded Medicaid Coverage Starting
The Affordable Care Act (ACA) An Overview by the Kaiser Family Foundation NBC News Editorial Roundtable June 26, 2013 1. The Basics of the Affordable Care Act (ACA) Expanded Medicaid Coverage Starting
Texas Mid-Year Economic Outlook: Strong Growth Continues
 Texas Mid-Year Economic Outlook: Strong Growth Continues Keith Phillips Assistant Vice President and Senior Economist 9/27/18 The views expressed in this presentation are strictly those of the presenter
NORTH CENTRAL COLORADO
 DOLA Planning and Management Region 2 Socioeconomic Profile Regional Profile NORTH CENTRAL COLORADO The central work of the State Demography Office is the research and production of population data and
Plunging Crude Prices: Impact on U.S. and State Economies
 Plunging Crude Prices: Impact on U.S. and State Economies Mine Yücel Senior Vice President and Director of Research August 7, 215 Oil and gas prices plunge Nominal price, $, weekly 16 14 12 Oil Price 1
VECTRA BANK 23 RD ANNUAL ECONOMIC FORECAST BREAKFAST START SMART IN 2016! Member FDIC VectraBank.com
 VECTRA BANK 23 RD ANNUAL ECONOMIC FORECAST BREAKFAST START SMART IN 2016! Member FDIC VectraBank.com Economic Presentation April 26, 2016 Tatiana Bailey, Ph.D. Director, UCCS Economic Forum A Little Humor
ECONOMIC OUTLOOK GROWING BUT SLOWING. Chris Akers State Demography Office November 4, 2016
 z ECONOMIC OUTLOOK GROWING BUT SLOWING Chris Akers State Demography Office November 4, 2016 OVERVIEW Global Economic Outlook Better in 2017 U.S. Economic Overview Slowing Job Growth Colorado 2015 Economic
Metro Houston Population Forecast
 Metro Houston Population Forecast Projections to 2050 Prepared by the Greater Houston Partnership Research Department Data from Texas Demographic Center www.houston.org April 2017 Greater Houston Partnership
White Pine County. Economic and Demographic Profile, 1999
 TECHNICAL REPORT UCED 99/2000-18 White Pine County Economic and Demographic Profile, 1999 UNIVERSITY OF NEVADA, RENO White Pine County Economic and Demographic Profile, 1999 Study Conducted by: Shawn W.
Zions Bank Economic Overview
 Zions Bank Economic Overview Utah League of Cities and Towns June 18, 2018 Utah Economic Conditions CA 0.6% OR 1.4% WA 1.7% NV 2.0% Utah Population 3 rd Fastest Growing in U.S. ID 2.2% UT 1.9% AZ 1.6%
Who s Above the Social Security Payroll Tax Cap? BY NICOLE WOO, JANELLE JONES, AND JOHN SCHMITT*
 Issue Brief September 2011 Center for Economic and Policy Research 1611 Connecticut Ave, NW Suite 400 Washington, DC 20009 tel: 202-293-5380 fax: 202-588-1356 www.cepr.net Who s Above the Social Security
Construction Spending, Labor and Materials Outlook
 Construction Spending, Labor and Materials Outlook 2018 Realtors Legislative Meetings & Trade Expo Washington, DC, May 18, 2018 Ken Simonson Chief Economist, AGC of America simonsonk@agc.org 2 Construction
The Health of Jefferson County: 2010 Demographic Update
 The Health of : 2010 Demographic Update BACKGROUND How people live the sociodemographic context of their lives influences their health. People who have lower incomes may not have the resources to meet
Monte Vista Population, ,744 4,651 4,564 4,467 4,458 4,432 4,451
 1 Monte Vista 4,8 4,7 4,6 4,5 4,4 4,3 4,2 4,1 4,61 4,612 4,61 4,676 Monte Vista, 2-213 4,744 4,651 4,564 4,467 4,458 4,432 4,451 4,418 4,412 4,355 2 21 22 23 24 25 26 27 28 29 21 211 212 213 Year Monte
Uinta Basin Energy Summit Economic Overview September 10, 2015
 Uinta Basin Energy Summit Economic Overview September 10, 2015 Overview National Economic Conditions Utah Economic Conditions Utah is One of the Fastest Growing CA States in the Country Percent Change
Texas: Demographically Different
 FEDERAL RESERVE BANK OF DALLAS ISSUE 3 99 : Demographically Different A s the st century nears, demographic changes are reshaping the U.S. economy. The largest impact is coming from the maturing of baby
Economic Overview City of Tyler, TX. January 8, 2018
 Economic Overview City of Tyler, TX January 8, 2018 DEMOGRAPHIC PROFILE...3 EMPLOYMENT TRENDS...5 WAGE TRENDS...5 COST OF LIVING INDEX...6 INDUSTRY SNAPSHOT...7 OCCUPATION SNAPSHOT...9 INDUSTRY CLUSTERS...
Minnesota s Economics & Demographics Looking To 2030 & Beyond. Tom Stinson, State Economist Tom Gillaspy, State Demographer July 2008
 Minnesota s Economics & Demographics Looking To 2030 & Beyond Tom Stinson, State Economist Tom Gillaspy, State Demographer July 2008 Minnesota Has Been Very Successful (Especially For A Cold Weather State
2018:IIIQ Nevada Unemployment Rate Demographics Report*
 2018:IIIQ Nevada Unemployment Rate Demographics Report* Department of Employment, Training & Rehabilitation Research and Analysis Bureau Dr. Tiffany Tyler-Garner, Director Dennis Perea, Deputy Director
 Robert D. Cruz, PhD, Chief Economist Miami-Dade County 305-375-1879 cruzr1@miamidade.gov www.miamidade.gov/economicdevelopment Department of Regulatory and Economic Resources Page 1 Local economic indicators
September Turning 65. Beyond a Rite of Passage. A nonprofit service and advocacy organization National Council on Aging
 September 2012 Turning 65 Beyond a Rite of Passage 1 Cumulatively 31.4 million adults will turn 65 between 2012 and 2020 4,000,000 3,900,000 Turning 65 by Year 3.8 M 3,800,000 3,700,000 3,600,000 3,500,000
Zions Bank Economic Overview
 Zions Bank Economic Overview Jackson Hole Mountain Resort March 20, 2018 National Economic Conditions When Good News is Bad News Is Good News?? Dow Tops 26,000 Up 44% Since 2016 Election Source: Wall Street
Economic Overview York County, South Carolina. February 14, 2018
 Economic Overview York County, February 14, 2018 DEMOGRAPHIC PROFILE... 3 EMPLOYMENT TRENDS... 5 UNEMPLOYMENT RATE... 5 WAGE TRENDS... 6 COST OF LIVING INDEX... 6 INDUSTRY SNAPSHOT... 7 OCCUPATION SNAPSHOT...
Florida: An Economic Overview
 Florida: An Economic Overview February 7, 2018 Presented by: The Florida Legislature Office of Economic and Demographic Research 850.487.1402 http://edr.state.fl.us Residential Credit Still Difficult to
The State of the Nation s Housing Report 2017
 The State of the Nation s Housing Report 217 Tennessee Governor s Housing Conference Nashville, Tennessee September 2, 217 The Report s Major Themes National home prices have regained their previous peak,
REGIONAL SNAPSHOT. Foothills Region, North Carolina
 REGIONAL SNAPSHOT Foothills Region, North Carolina Table of contents 01 Overview 04 Labor force 02 Demography 05 Industry and occupation 03 Human capital 01 overview Foothills Region, NC What is a regional
Metropolitan Washington Area Key Economic & Demographic Indicators
 Metropolitan Washington Area Key Economic & Demographic Indicators Arlington County Community Facilities Study March 11, 2015 Lisa A. Sturtevant, PhD Vice President of Research National Housing Conference
2012 Catalyst Census Fortune 500
 2012 Catalyst Census Fortune 500 Impetus In 1993, Catalyst instituted an annual Census to systematically examine women s representation at the highest levels of corporate America. First assessing the status
Diversity in the Insurance and Finance Industry Workforce
 Diversity in the Insurance and Finance Industry Workforce DBP RESEARCH REQUEST: AXA 1 Representation: Diversity in the Industry 2018 DBP INCLUSION INDEX Finance and Insurance Sector Position held % Male
Population & Demographic Analysis
 Population & Demographic Analysis The United States Census Bureau conducts a nationwide census every ten years. This census compiles information relating to the socio-economic characteristics of the entire
Independence, MO Data Profile 2015
 , MO Data Profile 2015 5 year American Community Survey (ACS) Jackson County, Missouri Data sources: U.S. Census Bureau, American Community Survey (ACS), 2011 2015 (released December 8, 2016), compared
Written Statement for the. Subcommittee on Long-Term Growth and Debt Reduction. Senate Committee on Finance
 T-146 Written Statement for the Subcommittee on Long-Term Growth and Debt Reduction Senate Committee on Finance Hearing on: Small Business Pension Plans: How Can We Increase Worker Coverage? Thursday,
2000s, a trend. rates and with. workforce participation as. followed. 2015, 50 th
 Labor Force Participat tion Trends in Michigan and the United States Executive Summary Labor force participation rates in the United States have been on the gradual decline since peaking in the early 2000s,
Regional Socio-Economic Profile
 Overview The central work of the State Demography Office is the research and production of population data and information and of the forces (fertility, mortality, migration) that lead to population change.
Residency Slots Are the Rate Limiting Factor of Physician Production to Meet Rural Demand
 Rural Impact of Medicaid Expansion and the ACA 40 th Annual Rural Health Conference Prescott, Arizona August 20, 2013 United States - Physician & Health Professions Supply in Rural & Urban Underserved
While one in five Californians overall is uninsured, the rate among those who work is even higher: one in four.
 : By the Numbers December 2013 Introduction California had the greatest number of uninsured residents of any state, 7 million, and the seventh largest percentage of uninsured residents under 65 in the
We re Not All The Same!
 We re Not All The Same! Exploring the DIVERSITY in Millennials Jason Dunkel jason.dunkel@environicsanalytics.ca 647-259-2811 @jdunkel_ea Worldwide Millennials are In need of Some PR Generation Maybe The
The Province of Prince Edward Island Employment Trends and Data Poverty Reduction Action Plan Backgrounder
 The Province of Prince Edward Island Employment Trends and Data Poverty Reduction Action Plan Backgrounder 5/17/2018 www.princeedwardisland.ca/poverty-reduction $000's Poverty Reduction Action Plan Backgrounder:
The Oil Market: From Boom to Gloom
 The Oil Market: From Boom to Gloom Mine Yücel Senior Vice President and Director of Research February 12, 216 The views expressed are those of the speaker and should not be attributed to the or the Federal
Paying Out-of-Pocket
 September 2017 Paying Out-of-Pocket The Healthcare Spending of 2 Million US Families Healthcare costs are rising for families. In 2015 the US spent 18 percent of Gross Domestic Product (GDP) on healthcare,
REGIONAL SNAPSHOT. Northern Shenandoah Valley Regional Partnership (NSVRP), Virginia
, Virginia") REGIONAL SNAPSHOT Northern Shenandoah Valley Regional Partnership (NSVRP), Virginia Table of contents 01 Overview 04 Labor force 02 Demography 05 Industry and occupation 03 Human capital 01 overview Northern
REGIONAL SNAPSHOT Northern Shenandoah Valley Regional Partnership (NSVRP), Virginia Table of contents 01 Overview 04 Labor force 02 Demography 05 Industry and occupation 03 Human capital 01 overview Northern
Are Affordability Perceptions Reducing Household Mobility and Exacerbating the Housing Shortage?
 Are Affordability Perceptions Reducing Household Mobility and Exacerbating the Housing Shortage? National Housing Survey Topic Analysis Q4 2017 Published on June 27, 2018 2018 Fannie Mae. Trademarks of
WHO IS TODAY S HOMEBUYER C.A.R. EXPO Oscar Wei, Senior Economist
 WHO IS TODAY S HOMEBUYER 2015 C.A.R. EXPO Oscar Wei, Senior Economist SALES OF EXISTING DETACHED HOMES California, Aug 2015 Sales: 431,800 Units, +7.4% YTD, +9.3% YTY 700,000 600,000 500,000 Aug-14: 395,080
Marshall & Lyon County Economic Update
 Marshall & Lyon County Economic Update Cameron Macht, Regional Analyst Minnesota Department of Employment and Economic Development 320-231-5174 ext. 7535 cameron.macht@state.mn.us www.deed.state.mn.us/lmi
Public Registers Bumpy Launch of Health Exchange Websites
 October 21, 2013 Public Registers Bumpy Launch of Health Exchange Websites 22% of Uninsured Have Visited Online Exchanges FOR FURTHER INFORMATION CONTACT THE PEW RESEARCH CENTER FOR THE PEOPLE & THE PRESS
What Does Population Aging Mean for Growth and Investments? Paula Campbell Roberts
 What Does Population Aging Mean for Growth and Investments? Paula Campbell Roberts Disclaimer The views expressed in this presentation are the personal views of Henry McVey of Kohlberg Kravis Roberts &
The Vision Series,
 The Vision Series, 212-213 The Washington Area Economy: Transitioning From Federal Dependency to a Global Business Base Stephen S. Fuller, Ph.D. Dwight Schar Faculty Chair and University Professor Director,
SMALL AREA ESTIMATES OF HEALTH INSURANCE COVERAGE:
 SMALL AREA ESTIMATES OF HEALTH INSURANCE COVERAGE: A LOCAL HEALTH DEPARTMENT PERSPECTIVE Sanaa Abedin, MPH sanaa.abedin@sdcounty.ca.gov Epidemiologist, Public Health Services Community Health Statistics
Comparative Revenues and Revenue Forecasts Prepared By: Bureau of Legislative Research Fiscal Services Division State of Arkansas
 Comparative Revenues and Revenue Forecasts 2010-2014 Prepared By: Bureau of Legislative Research Fiscal Services Division State of Arkansas Comparative Revenues and Revenue Forecasts This data shows tax
THE HOME BUYERS OF TOMORROW. September 8, 2016 Azad Amir-Ghassemi Research Analyst
 THE HOME BUYERS OF TOMORROW September 8, 2016 Azad Amir-Ghassemi Research Analyst METHODOLOGY Online Only Survey conducted from January 2016- February 2016 1871 respondents: 633 Emerging Millennials (18-25);
Women in the Labor Force: A Databook
 Cornell University ILR School DigitalCommons@ILR Federal Publications Key Workplace Documents 2-2013 Women in the Labor Force: A Databook Bureau of Labor Statistics Follow this and additional works at:
Office of the Chief Economist National Credit Union Administration. Economic Overview. California State Examiner School.
 Office of the Chief Economist National Credit Union Administration California State Examiner School May 30, 2017 Credit Union Performance Trends Recent Data About Credit Union Performance in California,
Health and Health Coverage in the South: A Data Update
 February 2016 Issue Brief Health and Health Coverage in the South: A Data Update Samantha Artiga and Anthony Damico With its recent adoption of the Affordable Care Act (ACA) Medicaid expansion to adults,
CURRENT DEMOGRAPHICS & CONTEXT GROWTH FORECAST SOUTHERN CALIFORNIA ASSOCIATION OF GOVERNMENTS APPENDIX
 CURRENT DEMOGRAPHICS & CONTEXT GROWTH FORECAST SOUTHERN CALIFORNIA ASSOCIATION OF GOVERNMENTS APPENDIX PROPOSED FINAL MARCH 2016 INTRODUCTION 1 FORECASTING PROCESS 1 GROWTH TRENDS 2 REGIONAL GROWTH FORECAST
Economic Potential Drives Commercial Real Estate
 Boom Boom Boom What Drives Commercial Real Estate Today September, 2016 First American Financial Corporation makes no express or implied warranty respecting the information presented and assumes no responsibility
Income inequality and mobility in Australia over the last decade
 Income inequality and mobility in Australia over the last decade Roger Wilkins Meeting of National Economic Research Organisations, OECD Headquarters, 18 June 2012 1993-94 1994-95 1995-96 1996-97 1997-98
The Cost & Benefits of Short-Term Individual and Family Health Insurance Plans. June, policies surveyed were active in October 2011
 The Cost & Benefits of Short-Term Individual and Family Health Insurance Plans June, 2012 2011 policies surveyed were active in October 2011 Table of Contents Introduction and Background....................................................................
Economic Overview. Lawrence, KS MSA
 Economic Overview Lawrence, KS MSA March 5, 2019 DEMOGRAPHIC PROFILE... 3 EMPLOYMENT TRENDS... 5 UNEMPLOYMENT RATE... 5 WAGE TRENDS... 6 COST OF LIVING INDEX... 7 INDUSTRY SNAPSHOT... 8 OCCUPATION SNAPSHOT...
Economic Status of. Older Women. The. Status Report CONTACT INFORMATION. Acknowledgements
 July 2010 The Economic Status t of Older CONTACT INFORMATION Office on the Economic Status of OESW Legislative Coordinating Commission Minnesota State Legislature 85 State Office Building St. Paul, Minnesota
THE RISE OF LATINO-OWNED BUSINESSES IN THE U.S.
 8 FACTS ABOUT LATINO-OWNED BUSINESSES ON THE UP AND UP: THE RISE OF LATINO-OWNED BUSINESSES IN THE U.S. PUBLICATION OF STANFORD GRADUATE SCHOOL OF BUSINESS IN COLLABORATION WITH THE LATINO BUSINESS ACTION
Enhancing Economic Security for the Latino Community
 Enhancing Economic Security for the Latino Community March 21, 2012 Presented at a Symposium Honoring the Center for Policy Research on Aging s 15 th Anniversary Aging in a Minority-Majority Nation: Interracial
Maintaining Equilibrium. Metro Denver 2017 Economic Forecast January 2017
 Maintaining Equilibrium Metro Denver 2017 Economic Forecast January 2017 Consumer Activity Income Wealth Prices Interest Rates Consumer Confidence Spend or Save? Retail Spending What & Where? Housing Options
Exhibit 1. The Number of Uninsured Adults Dropped to 29 Million in 2014, Down from 37 Million in 2010
 Exhibit 1. The Number of Uninsured Adults Dropped to 29 Million in 14, Down from 37 Million in 1 Adults ages 19 64 1 3 5 1 12 14 Uninsured now 15% 24 million 17% 3 million 18% 32 million % 37 million 19%
Health Insurance Coverage: 2001
 Health Insurance Coverage: 200 Consumer Income Issued September 2002 P60-220 Reversing 2 years of falling uninsured rates, the share of the population without health insurance rose in 200. An estimated
Atlanta Regional Commission Link. Overview of the Greater Washington Region: Trends and Challenges
 Atlanta Regional Commission Link Overview of the Greater Washington Region: Trends and Challenges Stephen S. Fuller, Ph.D. Dwight Schar Faculty Chair and University Professor Director, Center for Regional
Projected Job Growth
 1 Projected Job Growth Baton Rouge is projected to increase employment by 1.1% in 2018, which translates into approximately 4,500 new jobs Percentage change in nonfarm jobs* Actual Growth YTD Actual Growth
When comparing this study s results with the HMDA data to the results found in the previous 2001 report, small changes have been found.
 172 173 174 175 Comparisons to Previous Findings When comparing this study s results with the HMDA data to the results found in the previous 2001 report, small changes have been found. Race/Ethnicity When
REGIONAL SNAPSHOT. Eastern Shore Region, Virginia
 REGIONAL SNAPSHOT Eastern Shore Region, Virginia Table of contents 01 Overview 04 Labor force 02 Demography 05 Industry and occupation 03 Human capital 01 overview Eastern Shore Region, VA What is a regional
AMERICAN CONSUMER STUDY
 LIFE INSURANCE PRIORITIZATION AMERICAN CONSUMER STUDY Conducted 4Q 2016 LCN-1928868-102017 Lincoln Financial Group is the marketing name for Lincoln National Corporation and its affiliates. Affiliates
Utah Land Title Association Economic Overview February 1, 2016
 Utah Land Title Association Economic Overview February 1, 2016 Utah is One of the Fastest Growing CA 0.9% States in the Country Percent Change in Population for States: 2012 to 2013 WA 1.1% OR 0.8% NV
ehealth, Inc Fall Cost Report for Individual and Family Policyholders
 ehealth, Inc. 2010 Fall Cost Report for and Family Policyholders Table of Contents Page Methodology.................................................................. 2 ehealth, Inc. 2010 Fall Cost Report
New Mexico 2016 State of the Workforce Report A Report Highlighting New Mexico s Current and Future Workforce
 New Mexico 2016 State of the Workforce Report A Report Highlighting New Mexico s Current and Future Workforce POPULATION WORKFORCE SKILLS & EDUCATION INDUSTRIES, OCCUPATIONS & WAGES FUTURE WORKFORCE March
Opinion Poll. Small Business Owners Want Fair Tax System Over Tax Cuts. October 26, 2017
 Opinion Poll Small Business Owners Want Fair Tax System Over Tax Cuts October 26, 2017 Small Business Majority 1101 14 th Street, NW, Suite 950 Washington, DC 20005 (202) 828-8357 www.smallbusinessmajority.org
REGIONAL SNAPSHOT. Indiana 15 Regional Planning Commission Region, Indiana
 REGIONAL SNAPSHOT Indiana 15 Regional Planning Commission Region, Indiana Table of contents 01 Overview 04 Labor force 02 Demography 05 Industry and occupation 03 Human capital 01 overview Indiana 15 Regional
The State of Working Florida 2011
 The State of Working Florida 2011 Labor Day, September 5, 2011 By Emily Eisenhauer and Carlos A. Sanchez Contact: Emily Eisenhauer Center for Labor Research and Studies Florida International University
Poverty Rises, Median Income Falls and More Minnesotans Go Without Health Insurance in 2010
 Poverty Rises, Median Income Falls and More Minnesotans Go Without Health Insurance in 2010 Economic well-being of Minnesotans is declining The United States has weathered two recessions in the last decade,
Dual-eligible beneficiaries S E C T I O N
 Dual-eligible beneficiaries S E C T I O N Chart 4-1. Dual-eligible beneficiaries account for a disproportionate share of Medicare spending, 2010 Percent of FFS beneficiaries Dual eligible 19% Percent
Women in the Labor Force: A Databook
 Cornell University ILR School DigitalCommons@ILR Federal Publications Key Workplace Documents 12-2011 Women in the Labor Force: A Databook Bureau of Labor Statistics Follow this and additional works at:
2016 Workers compensation premium index rates
 2016 Workers compensation premium index rates NH WA OR NV CA AK ID AZ UT MT WY CO NM MI VT ND MN SD WI NY NE IA PA IL IN OH WV VA KS MO KY NC TN OK AR SC MS AL GA TX LA FL ME MA RI CT NJ DE MD DC = Under
MINNEAPOLIS ST. PAUL VISITOR COUNTS AND PROFILE. Kevin Hanstad April 28, 2016
 MINNEAPOLIS ST. PAUL VISITOR COUNTS AND PROFILE Kevin Hanstad April 28, 2016 SUMMARY 32 Million People Visited Minneapolis-St. Paul in 2015 and Spent $7.5 Billion Average Age: 46 Average Income: $95,000
Women in the Labor Force: A Databook
 Cornell University ILR School DigitalCommons@ILR Federal Publications Key Workplace Documents 12-2010 Women in the Labor Force: A Databook Bureau of Labor Statistics Follow this and additional works at:
REGIONAL SNAPSHOT. Crossing Borders Region (CBR), Oklahoma
, Oklahoma") REGIONAL SNAPSHOT Crossing Borders Region (CBR), Oklahoma Table of contents 01 Overview 04 Labor force 02 Demography 05 Industry and occupation 03 Human capital 01 overview Crossing Borders Region, OK
REGIONAL SNAPSHOT Crossing Borders Region (CBR), Oklahoma Table of contents 01 Overview 04 Labor force 02 Demography 05 Industry and occupation 03 Human capital 01 overview Crossing Borders Region, OK
Older consumers and student loan debt by state
 August 2017 Older consumers and student loan debt by state New data on the burden of student loan debt on older consumers In January, the Bureau published a snapshot of older consumers and student loan
Obamacare in Pictures. Visualizing the Effects of the Patient Protection and Affordable Care Act
 Visualizing the Effects of the Patient Protection and Affordable Care Act Fall 2012 expands dependence on government health care dumps millions into Medicaid and creates new federal subsidies for government-approved
The Impact of the Recession on Employment-Based Health Coverage
 May 2010 No. 342 The Impact of the Recession on Employment-Based Health Coverage By Paul Fronstin, Employee Benefit Research Institute E X E C U T I V E S U M M A R Y HEALTH COVERAGE AND THE RECESSION: