VECTRA BANK 23 RD ANNUAL ECONOMIC FORECAST BREAKFAST START SMART IN 2016! Member FDIC VectraBank.com
|
|
|
- Jayson Cole
- 6 years ago
- Views:
Transcription

1 VECTRA BANK 23 RD ANNUAL ECONOMIC FORECAST BREAKFAST START SMART IN 2016! Member FDIC VectraBank.com
2 Economic Presentation April 26, 2016 Tatiana Bailey, Ph.D. Director, UCCS Economic Forum


3 A Little Humor First

4 A Little Humor First
5 Overview National Indicators The Big Picture to the Local Picture Labor Force, Employment & Unemployment Real Estate & Tourism
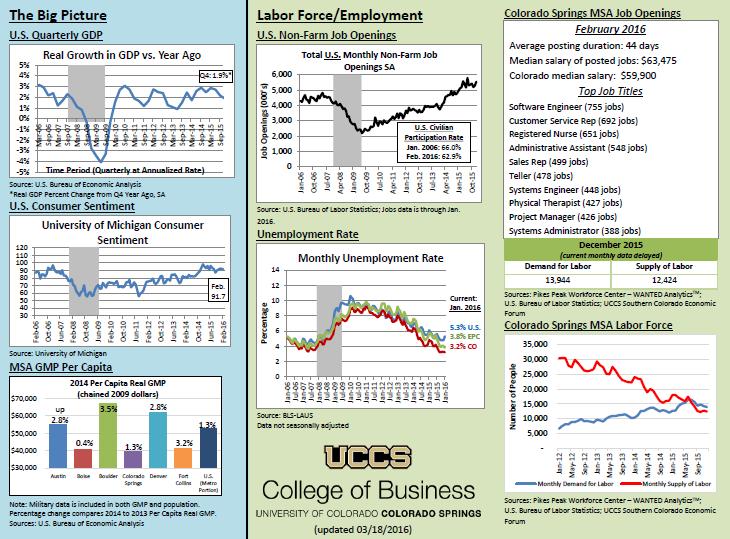
6 Percentage Jan-01 Real Growth in GDP vs. Year Ago Jan-02 Jan-03 Jan-04 Jan-05 Jan-06 Jan-07 Jan-08 Jan-09 Jan-10 Jan-11 Jan-12 Jan-13 Time Period (Quarterly at Annualized Rate) Source: Federal Reserve Bank of St. Louis, U.S. Bureau of Economic Analysis; Forecasts by CO Office of State Planning & Budgeting *Preliminary Real GDP Percent Change from Q4 Year Ago, SA; 3 rd revision Jan-14 Q4: 2.0%* Jan-15 Forecasts: GDP 2016: 2.6% GSP 2016: 3.2% GMP 2016: 2.2%
7 University of Michigan Consumer Sentiment Actual Forecasts: 2015: : 89.0 Mar: 91.0 Jun-90 Jun-91 Jun-92 Jun-93 Jun-94 Jun-95 Jun-96 Jun-97 Jun-98 Jun-99 Jun-00 Jun-01 Jun-02 Jun-03 Jun-04 Jun-05 Jun-06 Jun-07 Jun-08 Jun-09 Jun-10 Jun-11 Jun-12 Jun-13 Jun-14 Jun-15 Source: University of Michigan; Forecasts by UCCS Southern Colorado Economic Forum
8 $70,000 $65,000 $60,000 $55,000 $50,000 up 2.8% 3.5% 2014 Per Capita Real GMP (chained 2009 dollars) 2.8% 0.3% 1.0% 1.3% $45,000 $40, % $35,000 $30,000 Austin Boulder Colorado Springs Denver Huntsville Salt Lake City U.S. (Metro Portion) Source: Bureau of Economic Analysis
9 Overview National Indicators The Big Picture to the Local Picture Labor Force, Employment & Unemployment Real Estate & Tourism
10 6,000 Survey Employer Data through February 2016 Total U.S. Monthly Non-Farm Job Openings SA (000's) Job Openings (000s) 5,000 4,000 3,000 2,000 1,000 0 Jan-01 Jul-01 Jan-02 Jul-02 Jan-03 Jul-03 Jan-04 Jul-04 Jan-05 Jul-05 Jan-06 Jul-06 Jan-07 Jul-07 Jan-08 Jul-08 Jan-09 Jul-09 Jan-10 Jul-10 Jan-11 Jul-11 Jan-12 Jul-12 Jan-13 Jul-13 Jan-14 Jul-14 Jan-15 Jul-15 Jan-16 Source: Federal Reserve Bank of St. Louis, U.S. Bureau of Labor Statistics; Forecasts by CO Office of State Planning & Budgeting and UCCS Southern Colorado Economic Forum
11 March 2016 BLS Data Total nonfarm payroll employment rose by 215,000 in March (avg. 209,000/mo for last 3 months). Last 12 months, average hourly earnings up 2.3%. Most gains in retail trade, construction, health care & social assistance, food services & drinking places and financial activities; declines in manufacturing and mining jobs. Source: U.S. Bureau of Labor Statistics
12 Number of Employees (000s) 25,000 20,000 15,000 10,000 5,000 U.S. Employment by Industry, NSA 0 Jan-07 Jan-15 Jan-16 Source: U.S. Bureau of Labor Statistics, Current Employment Survey
13 March BLS Data Number of long-term unemployed (27 wks+) was essentially unchanged at 2.2 million in March. Account for 27.6% of unemployed and little movement since June. Civilian participation rate increased slightly to 63.0% from 62.9% in February.
14 U.S. Employment/Population, Labor Force Participation Rate SA Percentage Jan-01 Jan-02 Jan-03 Jan-04 Jan-05 Jan-06 Jan-07 Jan-08 Jan-09 Jan-10 Jan-11 Jan-12 Jan-13 Jan-14 Jan-15 Jan-16 Recession Civilian Participation Rate SA Employment/Population Data through March 2016 Source: Federal Reserve Bank of St. Louis, U.S. Bureau of Labor Statistics
15 Percentage Household Data: U.S. Civilian Participation Rates SA Employment/Population SA Blue and Red are same as before but on a different scale Civilian Participation Rate Civilian Participation Rate Civilian Participation Rate (Total) Employment/Population Civilian Participation Rate 55+ Recession Data through March 2016 Source: Federal Reserve Bank of St. Louis, U.S. Bureau of Labor Statistics
16 Unemployment Rate & Number Unemployed by Age and Gender, December 2015* Unemployment Rate Source: BLS. *Bubble size represents number of unemployed
17 Monthly Unemployment Rate NSA Percentage Jan-02 Jul-02 Jan-03 Jul-03 Jan-04 Jul-04 Jan-05 Jul-05 Jan-06 Jul-06 Jan-07 Jul-07 Jan-08 Jul-08 Jan-09 Jul-09 Jan-10 Jul-10 Jan-11 Jul-11 Jan-12 Jul-12 Jan-13 Jul-13 Jan-14 Jul-14 Jan-15 Jul-15 Jan-16 Current: Feb % U.S. 4.7% PC 3.9% EPC 3.8% TC 3.3% CO Sources: BLS-LAUS; Forecasts (NSA) for U.S. and CO from Colorado Office of Budgeting and Planning, EPC from Forum
18 Per Capita Personal Income - NSA $60,000 $50,000 $40,000 $30,000 $20,000 $10,000 $0 EPC: 86% of Colorado; 91% of U.S. U.S. Colorado El Paso Teller Source: Bureau of Economic Analysis; not seasonally adjusted and not chained (current $)
19 Colorado Springs MSA Job Openings Real Time Job Market Data for March 2016 Average posting duration (44 days) Median salary of posted jobs ($62,800); higher now than Colorado median ($59,500) Suggests more professional/higher skills jobs Sources: WANTED Analytics TM ; Pikes Peak Workforce Center
20 Colorado Springs MSA Job Openings Top job titles March 2016: 1) Software Engineer (745 jobs) 2) Customer Service Rep (706 jobs) 3) Registered Nurse (657 jobs) 4) Administrative Assistant (550 jobs) 5) Sales Rep (495 jobs) December ) Teller (488 jobs) 7) Systems Engineer (454 jobs) 8) Project Manager (422 jobs) 9) Physical Therapist (416 jobs) 10) Systems Administrator (393 jobs) Demand for Labor Supply of Labor 13,944 12,424 Sources: WANTED Analytics TM ; Pikes Peak Workforce Center
21 40,000 Colorado Springs MSA Labor Force Number of People 30,000 20,000 10,000 0 Monthly Demand for Labor Sources: WANTED Analytics TM ; Pikes Peak Workforce Center Monthly Supply of Labor
22 Colorado Springs MSA Job Openings Top job titles March 2016: 1) Software Engineer (745 jobs) 2) Customer Service Rep (706 jobs) 3) Registered Nurse (657 jobs) 4) Administrative Assistant (550 jobs) 5) Sales Rep (495 jobs) December ) Teller (488 jobs) 7) Systems Engineer (454 jobs) 8) Project Manager (422 jobs) 9) Physical Therapist (416 jobs) 10) Systems Administrator (393 jobs) Demand for Labor Supply of Labor 13,944 12,424 Sources: WANTED Analytics TM ; Pikes Peak Workforce Center
23 Number of Job Openings 15,000 10,000 5,000 0 Jobs Demanded 2012 to 2015 Top Categories 56% 99% 78% 83% 93% 94% 129% 20% 100% 174% 48% Source: WANTED ANALYTICS via Pikes Peak Workforce Center
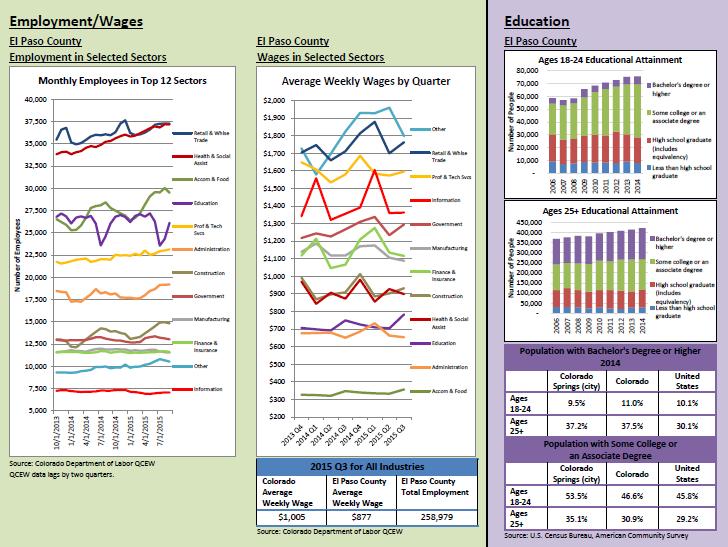
24 Employment 40,000 35,000 30,000 25,000 20,000 15,000 10,000 5,000 0 El Paso County Employment for Selected Sectors for Q3 of 2006 and Q3 of Q Q3 Source: Colorado Department of Labor, Quarterly Census of Employment and Wages (QCEW)
25 2009 Dollars $450 $400 $350 $300 $250 $200 $150 $100 $50 $0 El Paso County Total Real Wages ($M) for Selected Sectors, Q3 of 2006 and Q3 of 2015 Note: Sectors are in order based on the number of employees in Q3 of Source: Colorado Department of Labor, Quarterly Census of Employment and Wages (QCEW) Q Q3
26 Establishments 4,000 3,500 3,000 2,500 2,000 1,500 1, El Paso County Average Number of Establishments in Selected Sectors for Q3 of 2006 and Q3 of 2015 Note: Sectors are in order based on the number of employees in Q3 of Source: Colorado Department of Labor, Quarterly Census of Employment and Wages (QCEW) Q Q3
27 Top 7 Industries for Employee Growth in Colorado Springs MSA between 2016 and 2018 Employment Change Annual Average Percent Increase Health & Social Assistance 3, % Accom & Food Services 2, % Construction 1, % Pro & Tech Services 1, % Administrative & Waste 1, % Retail Trade 1, % Educational Services % Source: Colorado Department of Labor: QCEW
28 Industries Projected to Lose Employees in Colorado Springs MSA between 2016 and 2018 Employment Change Annual Average Percent Decrease Information % Manufacturing % Source: Colorado Department of Labor: QCEW
29 Overview National Indicators The Big Picture to the Local Picture Labor Force, Employment & Unemployment Real Estate & Tourism
30 National Picture - Housing U.S. home prices increased 6.9% comparing Q4 of 2015 to Q4 of 2014; 85% of measured MSAs had increases. Home values in the Denver-Lakewood-Aurora MSA jumped 11.8% in January 2016 compared to January 2015 (#1 spot). San Francisco #2, with home prices rising 11.6% Colorado #2 state in the nation for year-over-year home appreciation: up 10.9% (Jan 2016 to Jan 2015) #1 was Washington state, up 11.6% (Jan to Jan). Source: National Association of Realtors; Core Logic March report
31 National Picture - Housing The national median existing single-family home price in Q4 was $222,700 (up 6.9%). The average condo price in the U.S. was $209,200 (up 3.6% Q4, 2015 compared to Q4, 2014) 72% of MSAs showed gains in median condo prices. Source: National Association of Realtors
32 $280,000 $260,000 $269,492 U.S. Annual Average & Median Existing Single-Family Home Prices $265,183 $240,000 $222,092 $220,000 $200,000 $212,933 $219,867 Median Price Average Price $180,000 $160,000 $164,542 $140,000 Source: National Association of Realtors
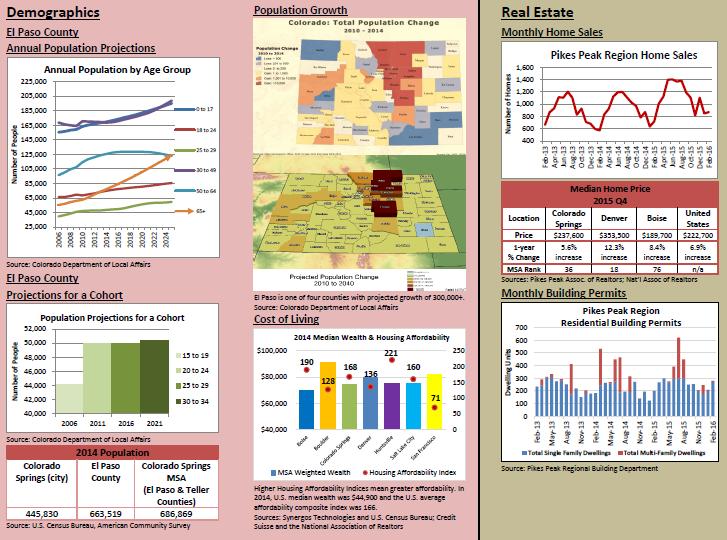
33 Local Picture - Housing 2015 Q4, Colorado Springs had a median price of $237,600 up 5.6% from 2014 Q4. Denver had an 12.3% increase and the median price was $353,500. Boulder s median price was almost $470, % increase in home sales 2014 to Supply of homes for sale in January 2016 fell to 1,923; the lowest for any month in 20 years. Sources: National Association of Realtors; PPAR (RSC)
34 $300,000 Pikes Peak Region Average & Median (Single-Family) Home Prices, through March, 2016 $280,000 $260,000 $240,000 $268,010 $239,500 $220,000 $200,000 $180,000 Median $ Average $ $160,000 Source: PPAR (RSC); data through February
35 $280,000 $260,000 $240,000 Pikes Peak Region Annual Average & Median (Single-Family) Home Prices $268,686 $245,433 $238,700 $220,000 $200,000 $180,000 $160,000 $206,819 $217,824 $185,000 Median Price Average Price Forecasts: Average 2016: $291,000 Median 2016: $257,000 Source: PPAR (RSC); Forecasts by UCCS Southern Colorado Economic Forum
36 Number of Days Average Days on Market Pikes Peak Region (Single Family/Patio Homes) Mar-14 Apr-14 May-14 Jun-14 Jul-14 Aug-14 Sep-14 Oct-14 Nov-14 Dec-14 Jan-15 Feb-15 Mar-15 Apr-15 May-15 Jun-15 Jul-15 Aug-15 Sep-15 Oct-15 Nov-15 Dec-15 Jan-16 Feb-16 Mar Source: PPAR (RSC)
37 Some Anecdotal Information Still a split market (above and below $400k) High student debt and perhaps demographics are causing homeownership to still be low (50- yr. low) 63.8%. Nonetheless, Kiplinger s is forecasting a 15% increase in new home construction, Source: Local realtors and Patterson Group data; Census Bureau for homeownership rate Q4, 2015
38 Number of Homes Pikes Peak Single Family (Detached) Home Sales 14,000 12,000 10,000 8,000 6,000 4,000 2,000 9,624 9,750 10,204 11,746 13,118 11,890 9,995 8,339 8,346 8,185 8,459 9,146 10,786 11,197 13,250 - Source: PPAR (RSC)
39 Pikes Peak Single and Multi-Family Permits Number of Permits 8,000 7,000 6,000 5,000 4,000 3,000 2,000 1,000 0 Healthy number of permits, Single Family Multi-Family Source: Pikes Peak Regional Building Department; Forecasts by UCCS Southern Colorado Economic Forum with input from PPRBD
40 Top 10 hottest housing markets for 2016 based on job growth, vacancies, affordability and demographics: 1. Grand Rapids, MI 2. Charleston, SC 3. Austin, TX 4. Baton Rouge, LA 5. San Antonio, TX 6. Colorado Springs, CO 7. Columbia, SC 8. Riverside, CA 9. Las Vegas, NV 10. Tacoma, WA Source: Bloomberg News, Dec. 18, 2015 (Ralph McLaughlin, Trulia)
41 $100,000 $90, Median Wealth & Housing Affordability $80,000 $70, $60, $50, $40,000 Austin Boulder Colorado Springs Denver Huntsville Salt Lake City San Antonio San Francisco 0 MSA Weighted Wealth Housing Affordability Index Higher Housing Affordability Indices mean greater affordability; U.S. median wealth was $44,900; U.S. average affordability composite index was 166. Sources: Synergos Technologies and U.S. Census Bureau; Credit Suisse and National Association of Realtors

42 El Paso County Population Projections Source: Colorado State Demography Office
43 El Paso County Population Projections by Age Group 225,000 Number of People 175, ,000 75,000 25, to 49 0 to to to to 29 Source: Colorado Department of Local Affairs
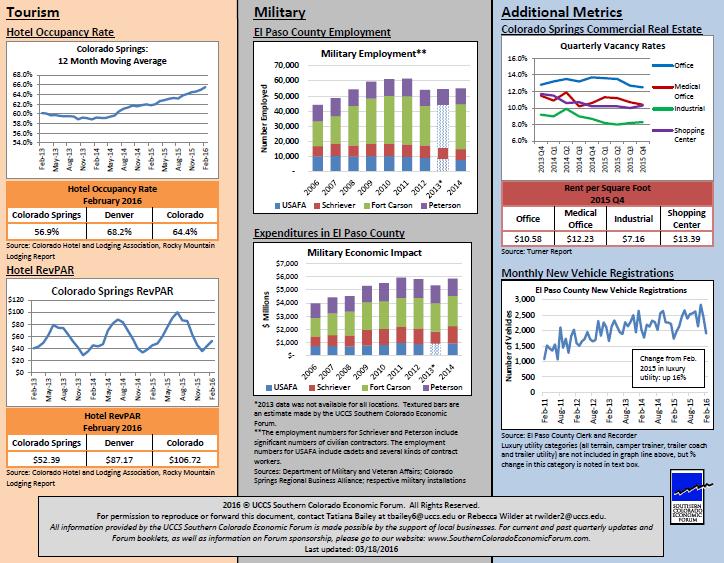
44 70% 65% Colorado Springs Hotel Occupancy Rate 12 Month Moving Average 60% 55% Mar. Actual: 60.8% 50% Mar-02 Sep-02 Mar-03 Sep-03 Mar-04 Sep-04 Mar-05 Sep-05 Mar-06 Sep-06 Mar-07 Sep-07 Mar-08 Sep-08 Mar-09 Sep-09 Mar-10 Sep-10 Mar-11 Sep-11 Mar-12 Sep-12 Mar-13 Sep-13 Mar-14 Sep-14 Mar-15 Sep-15 Mar-16 Source: CO Hotel and Lodging Association, Rocky Mountain Lodging Report
45 $ $90.00 Annual Hotel RevPAR Colorado and Colorado Springs $100 $70.00 $50.00 $65 $ Colorado Springs Colorado Source: CO Hotel and Lodging Association, Rocky Mountain Lodging Report; Forecasts by Robert S. Benton & Associates, Inc.
46
47
48
49
50 Find publications on our website: SouthernColoradoEconomicForum.com SAVE THE DATE! 20th Annual Southern Colorado Economic Forum! October 14, 2016 from 1:00 4:30 p.m. Broadmoor Hall Keynote address by Jim Paulsen of Wells Fargo Updates by community leaders Panel Theme: Colorado Springs: Going for the Gold (Exploring best practices and next steps for our community) Follow us on


51
52 Thank you! Wishing you a prosperous 2016! Presentations available at vectrabank.com/cosprings Member FDIC VectraBank.com
Labor Force/Employment U.S. Non-Farm Job Openings
 Jun7 Feb8 Oct8 Jun9 May6 May8 May1 May12 Number of People Feb1 Oct1 Jun11 Feb12 Jan8 Sep8 Jan1 Sep1 Jan12 Sep12 Jan14 Percentage Jan8 Sep8 Jan1 Sep1 Jan12 Sep12 Jan14 Job Openings ('s) The Big Picture
The National, State & Local Economies
 The National, State & Local Economies September 29, 2017 Tatiana Bailey, Ph.D. Director, UCCS Economic Forum Please do not reproduce, forward or post this presentation without permission. Platinum Level
14 th Annual. October 1, Tom Zwirlein, Ph.D. and Fred Crowley, Ph.D Southern Colorado Economic Forum University of Colorado at Colorado Springs
 14 th Annual Southern Colorado o Economic o c Forum October 1, 2010 Tom Zwirlein, Ph.D. and Fred Crowley, Ph.D Southern Colorado Economic Forum University of Colorado at Colorado Springs College of Business
Quarterly Economic Update
 Apr-6 Aug-6 Dec-6 Apr-7 Aug-7 Dec-7 Apr-8 Aug-8 Dec-8 Apr-9 Aug-9 Dec-9 Apr-1 Aug-1 Dec-1 Apr-11 Aug-11 Dec-11 Apr-12 Aug-12 Dec-12 Apr-13 Aug-13 Dec-13 Apr-14 Aug-14 Dec-14 Apr-15 Aug-15 Dec-15 26 Q2
Quarterly Economic Update
 Apr-7 Nov-7 Jun-8 Jan-9 Aug-9 Mar-1 Oct-1 May-11 Dec-11 Jul-12 Feb-13 Sep-13 Apr-14 Nov-14 Jun-15 Jan-16 Aug-16 Mar-17 27 Q1 27 Q3 28 Q1 28 Q3 29 Q1 29 Q3 21 Q1 21 Q3 211 Q1 211 Q3 212 Q1 212 Q3 213 Q1
Quarterly Economic Update
 Jan-6 May-6 Sep-6 Jan-7 May-7 Sep-7 Jan-8 May-8 Sep-8 Jan-9 May-9 Sep-9 Jan-1 May-1 Sep-1 Jan-11 May-11 Jan-12 May-12 Jan-13 May-13 Jan-14 May-14 Jan-15 26 Q1 26 Q3 27 Q1 27 Q3 28 Q1 28 Q3 29 Q1 29 Q3
Quarterly Economic Update
 Jan-6 May-6 Sep-6 Jan-7 May-7 Sep-7 Jan-8 May-8 Sep-8 Jan-9 May-9 Sep-9 Jan-1 May-1 Sep-1 Jan-11 May-11 Sep-11 Jan-12 May-12 Jan-13 May-13 Sep-13 Jan-14 May-14 Sep-14 Jan-15 May-15 Sep-15 26 Q1 26 Q3 27
Key Labor Market and Economic Metrics
 Key Labor Market and Economic Metrics May Update Incorporates Data Available on May 27 th, 2016 This reference is the result of a collaboration between the Bureau of Labor Market Information and Strategic
VECTRA BANK 23 RD ANNUAL ECONOMIC FORECAST BREAKFAST START SMART IN 2016! Member FDIC VectraBank.com
 VECTRA BANK 23 RD ANNUAL ECONOMIC FORECAST BREAKFAST START SMART IN 2016! Member FDIC VectraBank.com Colorado s Economy and State Budget Office of State Planning and Budgeting April 26, 2016 Jason Schrock,
Will the Recovery Ever End? Boulder Economic Forecast
 Will the Recovery Ever End? Boulder Economic Forecast Place cover image here Richard Wobbekind Senior Economist and Associate Dean for Business and Government Relations January 17, 219 #COBizOutlook Real
Quarterly Updates and Estimates Volume 11 Number 2 October 2012 Fred Crowley - Senior Economist
 Forum Business Conditions Index 142 Austin Bluffs Parkway, Colorado Springs, CO 8918 Quarterly Updates and Estimates Volume 11 Number 2 October 212 Fred Crowley - Senior Economist Update on the El Paso
The Economic Backdrop When will this cycle end?
 The Economic Backdrop When will this cycle end? How far are we into the current economic expansion? Current expansion in 8 th year; 4 th longest since 1960 Length of economic expansions (months) Apr-91-Feb-01
CBER Economic Indexes for Nevada and Southern Nevada
 CBER Economic Indexes for Nevada and Southern Nevada Published November 14, 2018 Stephen M. Miller, PhD, Director Hasara Rathnasekara, Graduate Research Assistant Summary of CBER s Nevada Indexes Coincident
Robert D. Cruz, PhD, Chief Economist
 Robert D. Cruz, PhD, Chief Economist Office of Economic Development and International Trade Miami-Dade County cruzr1@miamidade.gov / www.miamidade.gov/oedit Office of Economic Development and International
 Robert D. Cruz, PhD, Chief Economist Miami-Dade County 305-375-1879 cruzr1@miamidade.gov www.miamidade.gov/economicdevelopment Department of Regulatory and Economic Resources Page 1 Local economic indicators
CBER Indexes for Nevada and Southern Nevada
 CBER Indexes for Nevada and Southern Nevada Published March 24, 2016 Stephen M. Miller, PhD, Director Jinju Lee, Economic Analyst Summary of CBER s Nevada Indexes Coincident Index Leading Index Mo. to
CALHOUN COUNTY CHAMBER OF COMMERCE AND VISITORS CENTER
 2017 Economic Forum CALHOUN COUNTY CHAMBER OF COMMERCE AND VISITORS CENTER Information provided by School of Business and Industry THANK YOU to our SPONSORS Calhoun County Economy Forum National Update
Rising Risks for the Housing Outlook
 Rising Risks for the Housing Outlook Master Builders Association of Pierce County October 17, 2018 Robert Dietz, Ph.D. NAHB Chief Economist Population Growth Pierce County population growing faster than
CBER Economic Indexes for Nevada and Southern Nevada
 CBER Economic Indexes for Nevada and Southern Nevada Published December 19, 2017 Stephen M. Miller, PhD, Director Nicolas Prada, M.A., Graduate Research Assistant Summary of CBER s Nevada Indexes Coincident
ECONOMIC AND FINANCIAL HIGHLIGHTS
 ECONOMIC AND FINANCIAL HIGHLIGHTS LABOR MARKET Contributions to Change in Nonfarm Payrolls 2 Unemployment and Labor Force Participation Rate 3 MANUFACTURING ISM Manufacturing Index 4 CONSUMERS Light Vehicle
Emerging Trends in the U.S. and Colorado Economies
 Emerging Trends in the U.S. and Colorado Economies Sam Chapman Associate Economist Federal Reserve Bank of Kansas City Denver Branch The views expressed are those of the presenter and do not necessarily
Projected Job Growth
 1 Projected Job Growth Baton Rouge is projected to increase employment by 1.1% in 2018, which translates into approximately 4,500 new jobs Percentage change in nonfarm jobs* Actual Growth YTD Actual Growth
CBER Indexes for Nevada and Southern Nevada
 CBER Indexes for Nevada and Southern Nevada Published June 23, 2017 Stephen M. Miller, PhD, Director Nicolas Prada, Graduate Research Assistant Summary of CBER s Nevada Indexes Coincident Index (March)
The President s Report to the Board of Directors
 The President s Report to the Board of Directors April 4, 214 Current Economic Developments - April 4, 214 Data released since your last Directors' meeting show the economy was a bit stronger in the fourth
Will the Recovery Ever End? Certified Financial Planners
 Will the Recovery Ever End? Certified Financial Planners Place cover image here Richard Wobbekind Senior Economist and Associate Dean for Business and Government Relations January 25, 219 Attention: This
SOUTHERN NEVADA 2015 ECONOMIC OUTLOOK
 SOUTHERN NEVADA 2015 ECONOMIC OUTLOOK NAIOP Washington D.C. Legislative Retreat February 9-11, 2015 Prepared by: ECONOMIC OVERVIEW 2 Nevada job recovery from Great Recession after 90 months. Nevada Recession
Current Economic Review April 16, 2014
 Current Economic Review April 16, 2014 Brian Bonnenfant Project Manager Center for Regional Studies University of Nevada, Reno 784-1771 bonnen@unr.edu 230,000 225,000 **Peak = 228,100 Emp **Start of Great
Quarterly Updates and Estimates Volume 10, Number 4, April 2012 Fred Crowley - Senior Economist
 Forum Business Conditions Index Quarterly Updates and Estimates Volume 1, Number 4, April 212 Fred Crowley - Senior Economist Update on the El Paso County Economy The local economy showed some of its strongest
The Great Recession 1-2 Punch of Credit Crisis and Consumer Retrenchment
 Economic Recovery: Wherefore Art Thou? Jon Haveman Chief Economist, BAC Economic Institute November 8, 1 The Great Recession 1- Punch of Credit Crisis and Consumer Retrenchment 6 GDP Growth (SAAR) and
Economic Outlook: Grand Strand Economy
 Economic Outlook: Grand Strand Economy 20 th Annual Economic Growth and Real Estate Summit Pine Lakes Country Club, September 29, 2017 Robert F. Salvino, Ph.D. E. Craig Wall Sr. College of Business Coastal
The Economic Outlook
 The Economic Outlook 5th Annual Meyers Research: Housing Market Outlook April 18, 2018 Robert A. Kleinhenz, Ph.D. Economist/Executive Director of Research LLC Outline U.S. Economy State Economy So Cal/Local
U.S. Consumer Sentiment Jan 2011 Jan 2012
 2012 Economic Update Information provided by Jacksonville State University Center for Economic Development and College of Commerce and Business Administration U.S. Consumer Sentiment Jan 2011 Jan 2012
Metro Areas Show Moderate Employment Growth Over the Month with Trends Remaining Strong Over the Year
 AUGUST SUB-STATE PRESS RELEASE For Immediate Release September 25, 2018 Metro Areas Show Moderate Employment Growth Over the Month with Trends Remaining Strong Over the Year CARSON CITY, NV Statewide,
Emerging Trends in the U.S. and Colorado Economies
 Emerging Trends in the U.S. and Colorado Economies Alison Felix Economist and Branch Executive Federal Reserve Bank of Kansas City Denver Branch The views expressed are those of the presenter and do not
Zions Bank Economic Overview
 Zions Bank Economic Overview Utah Institute of Real Estate Management Economic Summit September 12, 2017 National Economic Conditions August Job Indicators Indicator Expectation Actual Total Nonfarm Payrolls
7.6% The YOY percent increase in Nevada taxable sales in August--up $259 million from August 2011.
 Jan-03 Jun-03 Nov-03 Apr-04 Sep-04 Feb-05 Jul-05 Dec-05 May-06 Oct-06 Mar-07 Aug-07 Jan-08 Jun-08 Nov-08 Apr-09 Sep-09 Feb-10 Dec-10 May-11 Oct-11 Aug-12 Index Municipal Investment Management In This Issue
The U.S. Economy s Current Performance and Outlook
 Delta Associates Spring Seminar The U.S. and Washington Area Economies: Current Performance and Outlook: 24-29 Stephen S. Fuller, Ph.D. Dwight Schar Faculty Chair and University Professor Director, Center
The U.S. Economy s Current Performance and Outlook
 /3/4 Board of Directors, Northern Virginia Association of Realtors The Current Economic Outlook & Area Housing Market Conditions Stephen S. Fuller, Ph.D. Dwight Schar Faculty Chair and University Professor
2018 Economic Forum CALHOUN COUNTY CHAMBER OF COMMERCE AND VISITORS CENTER. School of Business and Industry. Information provided by
 2018 Economic Forum CALHOUN COUNTY CHAMBER OF COMMERCE AND VISITORS CENTER Information provided by School of Business and Industry THANK YOU to our SPONSORS Calhoun County Economy Forum National Update
Uinta Basin Energy Summit Economic Overview September 10, 2015
 Uinta Basin Energy Summit Economic Overview September 10, 2015 Overview National Economic Conditions Utah Economic Conditions Utah is One of the Fastest Growing CA States in the Country Percent Change
March 2016 Lutgert College Of Business FGCU Blvd. South Fort Myers, FL Phone
 Southwest Florida Regional Economic Indicators March 2016 Lutgert College Of Business 10501 FGCU Blvd. South Fort Myers, FL 33965 Phone 239-590-7090 www.fgcu.edu/cob/reri Table of Contents Introduction:
Unemployment Rate Edges Lower to 5.0 Percent Employment Down in December
 Media Contact 609-984-2841 EMAIL: MediaCalls@dol.state.nj.us Unemployment Rate Edges Lower to 5.0 Percent Employment Down in December TRENTON, January 18, 2018 Preliminary monthly estimates released by
February 2016 Lutgert College Of Business FGCU Blvd. South Fort Myers, FL Phone
 Southwest Florida Regional Economic Indicators February 2016 Lutgert College Of Business 10501 FGCU Blvd. South Fort Myers, FL 33965 Phone 239-590-7090 www.fgcu.edu/cob/reri Table of Contents Introduction:
August 2015 Lutgert College Of Business FGCU Blvd. South Fort Myers, FL Phone
 Southwest Florida Regional Economic Indicators August 215 Lutgert College Of Business 151 FGCU Blvd. South Fort Myers, FL 33965 Phone 239-59-79 www.fgcu.edu/cob/reri Table of Contents Introduction: Regional
Nevada s Metropolitan Areas Unemployment Rates Down Year over Year
 For Immediate Release August 25, 2015 Nevada s Metropolitan Areas Unemployment Rates Down Year over Year CARSON CITY, NV Nevada s metropolitan area unemployment rates all decreased year over year in July.
ECONOMIC & REVENUE UPDATE
 January 11, 2018 Summary summary The U.S. labor market gained 148,000 net new jobs in December. U.S. housing starts in November 2017 were 12.9% above their year-ago level. Consumer confidence declined
The Unemployment Rates Decline in September in Nevada s Metro Areas
 For Immediate Release October 25, 2016 The Unemployment Rates Decline in September in Nevada s Metro Areas CARSON CITY, NV In September, unemployment rates in all three of the Silver State s major population
NEAZ Members: Cherokee County
 1 NEAZ Members: Cherokee County 2 NEAZ Members: DeKalb County 3 NEAZ Members: Etowah County 4 NEAZ Members: Marshall County 5 NEAZ Members: Cherokee County April 27, 2011 6 NEAZ Members: DeKalb County
September 2017 VOLUME XI NUMBER 9
 Southwest Florida Regional Economic Indicators September 2017 VOLUME XI NUMBER 9 Regional Economic Research Institute Lutgert College Of Business 10501 FGCU Blvd. South Fort Myers, FL 33965 Phone 239-590-7090
Metro Area Unemployment Rates All Decline; Las Vegas Accounts for the Bulk of the Job Growth Over the Month
 SEPTEMBER SUB-STATE PRESS RELEASE For Immediate Release October 23, 2018 Metro Area Unemployment Rates All Decline; Las Vegas Accounts for the Bulk of the Job Growth Over the Month CARSON CITY, NV According
Consumer Price Index, Jobless Claims, Housing Starts Each of These Reports Have Favorable Aspects to Note
 Consumer Price Index, Jobless Claims, Housing Starts Each of These Reports Have Favorable Aspects to Note January 19, Asha G. Bangalore agb3@ntrs.com The Consumer Price Index (CPI) held steady in December,
Nonfarm Payroll Employment
 PRESIDENT'S REPORT TO THE BOARD OF DIRECTORS, FEDERAL RESERVE BANK OF BOSTON Current Economic Developments - June 10, 2004 Data released since your last Directors' meeting show the economy continues to
Emerging Trends in the Regional Economy
 Emerging Trends in the Regional Economy Alison Felix Economist & Branch Executive Federal Reserve Bank of Kansas City Denver Branch The views expressed are those of the presenter and do not necessarily
Nevada s Metro Areas Experience Drop in Unemployment in December
 For Immediate Release January 24, 2017 Nevada s Metro Areas Experience Drop in Unemployment in December CARSON CITY, NV The jobless rate in Las Vegas declined to 5 percent in December, down 0.2 percentage
Southwest Florida Regional Economic Indicators. July 2017 VOLUME XI NUMBER 7
 Southwest Florida Regional Economic Indicators July 2017 VOLUME XI NUMBER 7 Lutgert College Of Business 10501 FGCU Blvd. South Fort Myers, FL 33965 Phone 239-590-7090 www.fgcu.edu/cob/reri Table of Contents
TAMPA AREA ECONOMIC SUMMARY
 TAMPA AREA ECONOMIC SUMMARY This summary presents a sampling of economic information and indicators for both Hillsborough County and the Tampa Bay Metropolitan Statistical Area (MSA). These economic indicators
There has been considerable discussion of the possibility
 NationalEconomicTrends February Housing and the R Word There has been considerable discussion of the possibility that ongoing troubles in the housing market could push the economy into recession 1 But
Trends and Transitory Shocks
 EMBARGOED UNTIL WEDNESDAY, SEPTEMBER 27 AT 7:00 P.M.; OR UPON DELIVERY Trends and Transitory Shocks Eric S. Rosengren President & CEO Federal Reserve Bank of Boston September 27, 2017 The Money Marketeers
Quarterly Updates and Estimates Volume 1, Number 3, January 2003 Fred Crowley - Senior Economist
 Quarterly Updates and Estimates Volume 1, Number 3, January 2003 Fred Crowley - Senior Economist Update on the Economy There appears to have been a downturn in the Colorado Springs economy in the last
Nevada s Unemployment Rate Falls in October to 6.6 Percent Outlook is Positive for Holiday Hiring
 For Immediate Release Nov. 18, 2015 Nevada s Unemployment Rate Falls in October to 6.6 Percent Outlook is Positive for Holiday Hiring CARSON CITY, NV Nevada s unemployment rate dipped to a seasonally adjusted
Southwest Florida Regional Economic Indicators. August 2013
 Southwest Florida Regional Economic Indicators August 213 Regional Economic Research Institute Lutgert College Of Business Phone 239-59-7319 Florida Gulf Coast University 151 FGCU Blvd. South Fort Myers,
Decline in Economic Activity Larger Than Advance GDP Estimate February 27, 2009
 Northern Trust Global Economic Research 5 South LaSalle Chicago, Illinois 663 northerntrust.com Asha G. Bangalore agb3@ntrs.com Decline in Economic Activity Larger Than Advance GDP Estimate February 27,
Plunging Oil Prices: Impact on the U.S. and State Economies
 Plunging Oil Prices: Impact on the U.S. and State Economies Mine Yücel Senior Vice President and Director of Research November 17, 216 Nominal price, weekly 16 14 Oil and gas prices volatile 12 1 Oil price
Data current as of: August 5, ,200,000 1,000, , , , , , , , , , , ,000
 Forecast Version: Spring 216 Economic Indicators The Bureau of Labor Statistics reported a total nonfarm payroll employment increase of 287, in June with the unemployment rate rising.2% to 4.9%. The jobs
NationalEconomicTrends
 NationalEconomicTrends January 00 Stag-nations Economic growth in the United States has slowed substantially since the days of rapid expansion during the mid to late 1990s. According to preliminary estimates,
April 2016 Lutgert College Of Business FGCU Blvd. South Fort Myers, FL Phone
 Southwest Florida Regional Economic Indicators April 2016 Lutgert College Of Business 10501 FGCU Blvd. South Fort Myers, FL 33965 Phone 239-590-7090 www.fgcu.edu/cob/reri Table of Contents Introduction:
C I T Y O F B O I S E
 C I T Y O F B O I S E D E P A R T M E N T O F F I N A N C E A N D A D M I N I S T R A T I O N Office of Budget Development & Monitoring Economic Brief Mike Sherack, Senior Budget Analyst & Brent Davis,
Indicators of the Kansas Economy
 Governor s Council of Economic Advisors Indicators of the Kansas Economy A Review of Economic Trends and the Kansas Economy 1000 S.W. Jackson St. Suite 100 Topeka, KS 66612-1354 Phone: (785) 296-0967 Fax:
January 2018 VOLUME XII NUMBER 1
 Southwest Florida Regional Economic Indicators January 2018 VOLUME XII NUMBER 1 Regional Economic Research Institute Lutgert College Of Business 10501 FGCU Blvd. South Fort Myers, FL 33965 Phone 239-590-7090
Illinois Job Index. Growth Rate %
 Illinois Job Index Release Data Issue 03/14/2011 Jan 1990 / Jan 2011 2011.02 www.real.illinois.edu For January Illinois Job Index, the Nation, RMW and the state all had positive job growth. The monthly
The U.S. and Washington Area Economic Performance and Outlook
 // The U.S. and Washington Area Economic Performance and Outlook Center for Regional Analysis School of Public Policy George Mason University January, 3 Recession Recovery Patterns of GDP Past Four Recessions
April 2018 VOLUME XII NUMBER 4
 Southwest Florida Regional Economic Indicators April 2018 VOLUME XII NUMBER 4 Regional Economic Research Institute Lutgert College Of Business 10501 FGCU Blvd. South Fort Myers, FL 33965 Phone 239-590-7090
Macroeconomic View of the Housing Market. Frank Nothaft CoreLogic Chief Economist December 12 th 2018
 Macroeconomic View of the Housing Market Frank Nothaft CoreLogic Chief Economist December 12 th 2018 2019 Economic and Housing Outlook Economic growth continues, recession risk rises, interest rates increase
SOUTHEASTERN LOUISIANA UNIVERSITY Economic Reporter. Spring 2018 Vol. 14 No. 1
 SOUTHEASTERN LOUISIANA UNIVERSITY Promoting Economic Development in Southeast Louisiana NATIONAL U.S. Economy STATE Louisiana Economy REGIONAL Employment Spring 218 Vol. 14 No. 1 NATIONAL U.S. Economy
With the tax filing season in full swing, these summary
 NationalEconomicTrends March Income Taxes: Who Pays and How Much? With the tax filing season in full swing, these summary figures may provide some perspective on the issue of who is paying federal individual
Southwest Florida Regional Economic Indicators. June 2013
 Southwest Florida Regional Economic Indicators June 213 Regional Economic Research Institute Lutgert College Of Business Phone 239-59-7319 Florida Gulf Coast University 151 FGCU Blvd. South Fort Myers,
July 2016 Lutgert College Of Business FGCU Blvd. South Fort Myers, FL Phone
 Southwest Florida Regional Economic Indicators July 2016 Lutgert College Of Business 10501 FGCU Blvd. South Fort Myers, FL 33965 Phone 239-590-7090 www.fgcu.edu/cob/reri Table of Contents Introduction:
CBER Economic Indexes for Nevada and Southern Nevada
 CBER Economic Indexes for Nevada and Southern Nevada Published February 9, 2018 Stephen M. Miller, PhD, Director Marshall Krakauer, Graduate Research Assistant Summary of CBER s Nevada Indexes Coincident
The relatively slow growth of employment has
 NationalEconomicTrends August Please go to researchstlouisfedorg/publications/net for important information about your subscription Labor s Share The relatively slow growth of employment has been a prominent
Employment Data (establishment)
") Table 1: Major Indicators of Labor Market Activity for New Jersey Seasonally Adjusted (thousands) Benchmark Labor Force Data (resident) Current Month Previous Month One Year Ago Net Change Net Change May
Table 1: Major Indicators of Labor Market Activity for New Jersey Seasonally Adjusted (thousands) Benchmark Labor Force Data (resident) Current Month Previous Month One Year Ago Net Change Net Change May
North Carolina s June Employment Figures Released
 For Immediate Release: July 20, For More Information, Contact: Beth Gargan/919.814.4610 North Carolina s Employment Figures Released RALEIGH The state s seasonally adjusted unemployment rate was 4.2 percent,
Quarterly Updates and Estimates Volume 12 Number 4 May 2014 Fred Crowley - Senior Economist
 142 Austin Bluffs Parkway, Colorado Springs, CO 8918 Quarterly Updates and Estimates Volume 12 Number 4 May 214 Fred Crowley - Senior Economist Update on the Economy The local economy s first quarter proved
2015 End of Year Economic Update
 BROOMFIELD Economic Development 2015 End of Year Economic Update RELEASED: FEBRUARY 2016 Provided by: Broomfield Economic Development One Descombes Drive Broomfield, CO 80020 303-464-5579 www.investbroomfield.com
Nevada s Metro Areas Experience Decreased Unemployment Rates in December
 For Immediate Release Jan. 26, 2016 Nevada s Metro Areas Experience Decreased Unemployment Rates in December CARSON CITY, NV Nevada s metropolitan areas saw an improvement in the unemployment rate for
Information provided by. Jacksonville State University Center for Economic Development and Business Research School of Business & Industry
 Information provided by Jacksonville State University Center for Economic Development and Business Research School of Business & Industry Connecting Our Greater Communities: Overview CEAZ Update (#2-#75)
September 2015 Lutgert College Of Business FGCU Blvd. South Fort Myers, FL Phone
 Southwest Florida Regional Economic Indicators September 215 Lutgert College Of Business 151 FGCU Blvd. South Fort Myers, FL 33965 Phone 239-59-79 www.fgcu.edu/cob/reri Table of Contents Introduction:
North Carolina s January Employment Figures Released
 For Immediate Release: March 13, For More Information, Contact: Beth Gargan/919.814.4610 North Carolina s January Employment Figures Released RALEIGH The state s seasonally adjusted January unemployment
October 2017 VOLUME XI NUMBER 10
 Southwest Florida Regional Economic Indicators October 2017 VOLUME XI NUMBER 10 Regional Economic Research Institute Lutgert College Of Business 10501 FGCU Blvd. South Fort Myers, FL 33965 Phone 239-590-7090
South Central Alabama Comprehensive Economic Development Strategy
 South Central Alabama Comprehensive Economic Development Strategy August 2012 2013 Updated Excerpt CGI Group, Inc. in Troy Hyundai Motor Manufacturing Alabama in Montgomery Acknowledgements: Funding for
North Carolina s June Employment Figures Released
 For Immediate Release: July 22, For More Information, Contact: Kim Genardo/919.814.4610 North Carolina s Employment Figures Released RALEIGH The state s seasonally adjusted unemployment rate was 4.9 percent,
Sharp declines in home prices, followed by a financial
 NationalEconomicTrends April Household Retrenchment Sharp declines in home prices, followed by a financial crisis and a steep recession, rattled US households in Economic misfortunes have caused many to
C I T Y O F B O I S E
 C I T Y O F B O I S E D E P A R T M E N T O F F I N A N C E A N D A D M I N I S T R A T I O N Office of Budget Development & Monitoring Economic Brief Shannon Cade, Financial Analyst & Brent Davis, Budget
REBUILD & RECOVER. VEGAS HOUSING REPORT Suncoast Hotel & Casino April 22, Prepared by:
 REBUILD & RECOVER VEGAS HOUSING REPORT Suncoast Hotel & Casino April 22, 2014 Prepared by: REBUILD The Great Recovery continues moderately. Nevada Recovery Comparison: Last 11 Recessions % Job Losses Compared
Southwest Florida Regional Economic Indicators. December 2016 VOLUME X NUMBER 12
 Southwest Florida Regional Economic Indicators December 2016 VOLUME X NUMBER 12 Lutgert College Of Business 10501 FGCU Blvd. South Fort Myers, FL 33965 Phone 239-590-7090 www.fgcu.edu/cob/reri Table of
MARKET AREA UPDATE Report as of: 1Q 2Q 3Q 4Q
 Market Area (City, State):Greater Seattle, WA MARKET AREA UPDATE Report as of: 1Q 2Q 3Q 4Q Year:2012 Provided by (Company / Companies):Coldwell Banker Bain, Windermere, Prudential NW, John L. Scott What
The US and California Economic Outlook
 Regional Economic Forum April 25, 2018 The US and California Economic Outlook Robert A. Kleinhenz, Ph.D. Economist/Executive Director of Research LLC Outline U.S. Economy State & Region Conclusion/Looking
HAND/CNHED Joint Meeting. Washington Area Economy and Housing Market Trends and Outlook
 1/26/12 HAND/CNHED Joint Meeting Washington Area Economy and Housing ket Trends and Outlook Lisa A. Sturtevant, PhD Center for Regional Analysis School of Public Policy George Mason University October
MACRO Report: Review of Wyoming s Economy
 MACRO Report: Review of Wyoming s Economy Economic Update as of December 31, 2017 The MACRO Report is a quarterly publication comprised of charts focusing on energy, employment, state revenues, and other
Zions Bank Economic Overview
 Zions Bank Economic Overview Jackson Hole Mountain Resort March 20, 2018 National Economic Conditions When Good News is Bad News Is Good News?? Dow Tops 26,000 Up 44% Since 2016 Election Source: Wall Street
LABOR SITUATION Office of Research
 Sharon Palmer Commissioner LABOR SITUATION Office of Research FOR IMMEDIATE RELEASE May 2013 Data CT Unemployment Rate = 8.0% US Unemployment Rate = 7.6% Nonfarm jobs rise 1,000 in May but the unemployment