MARKET AREA UPDATE Report as of: 1Q 2Q 3Q 4Q
|
|
|
- Marion Gibson
- 6 years ago
- Views:
Transcription

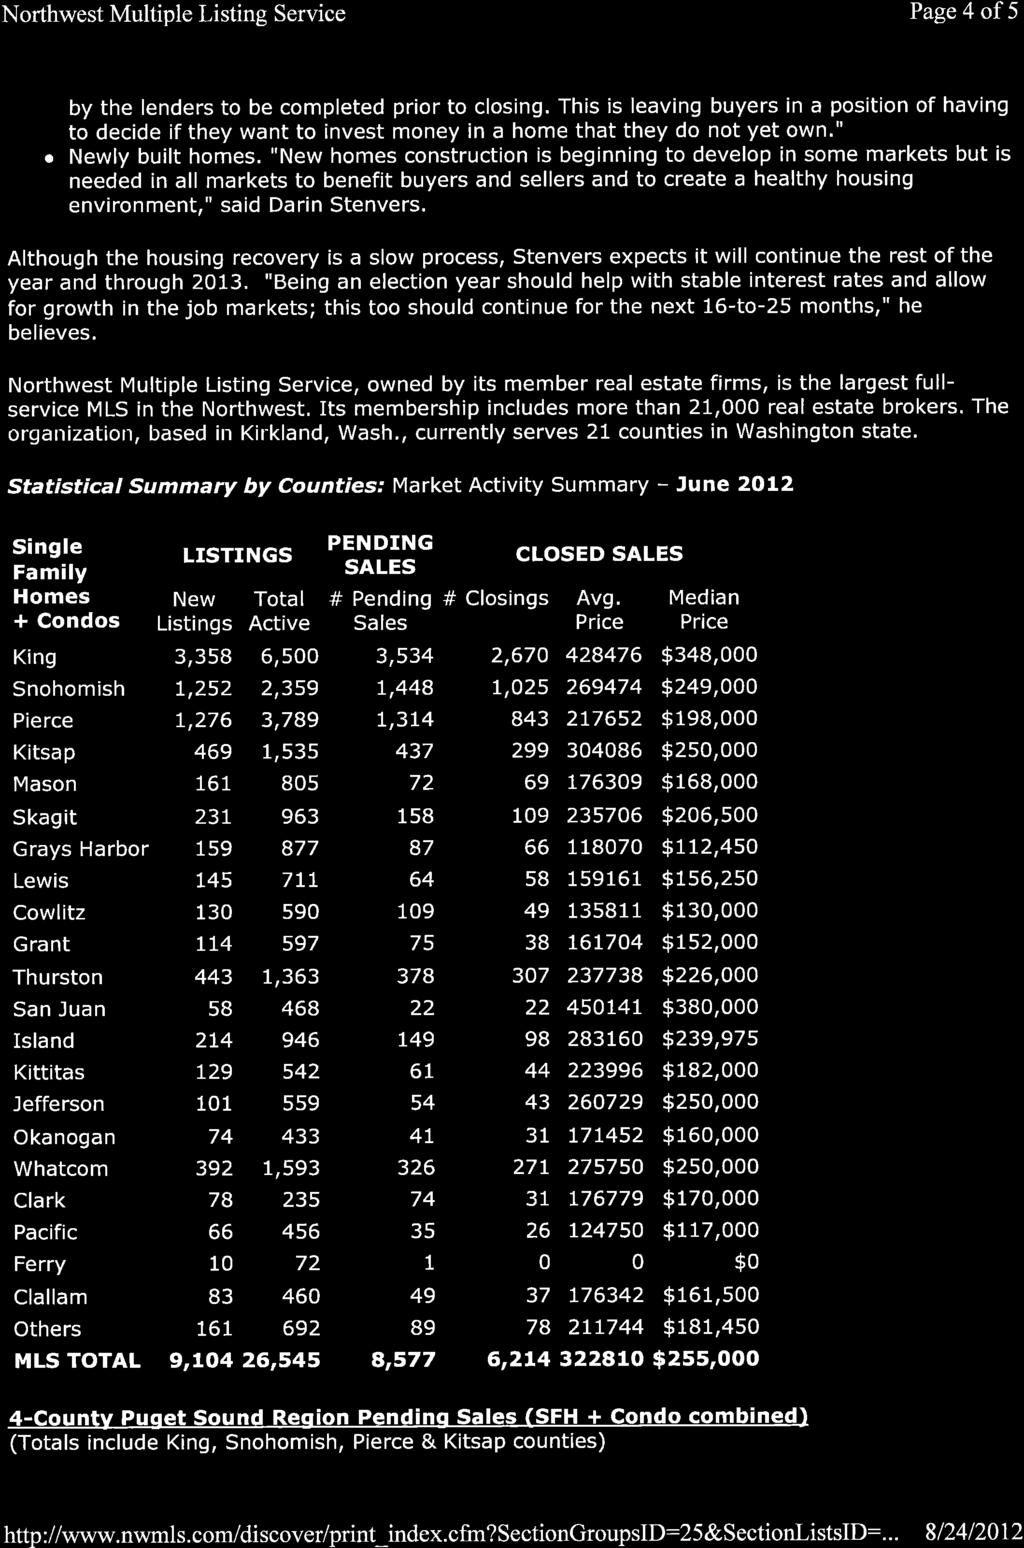
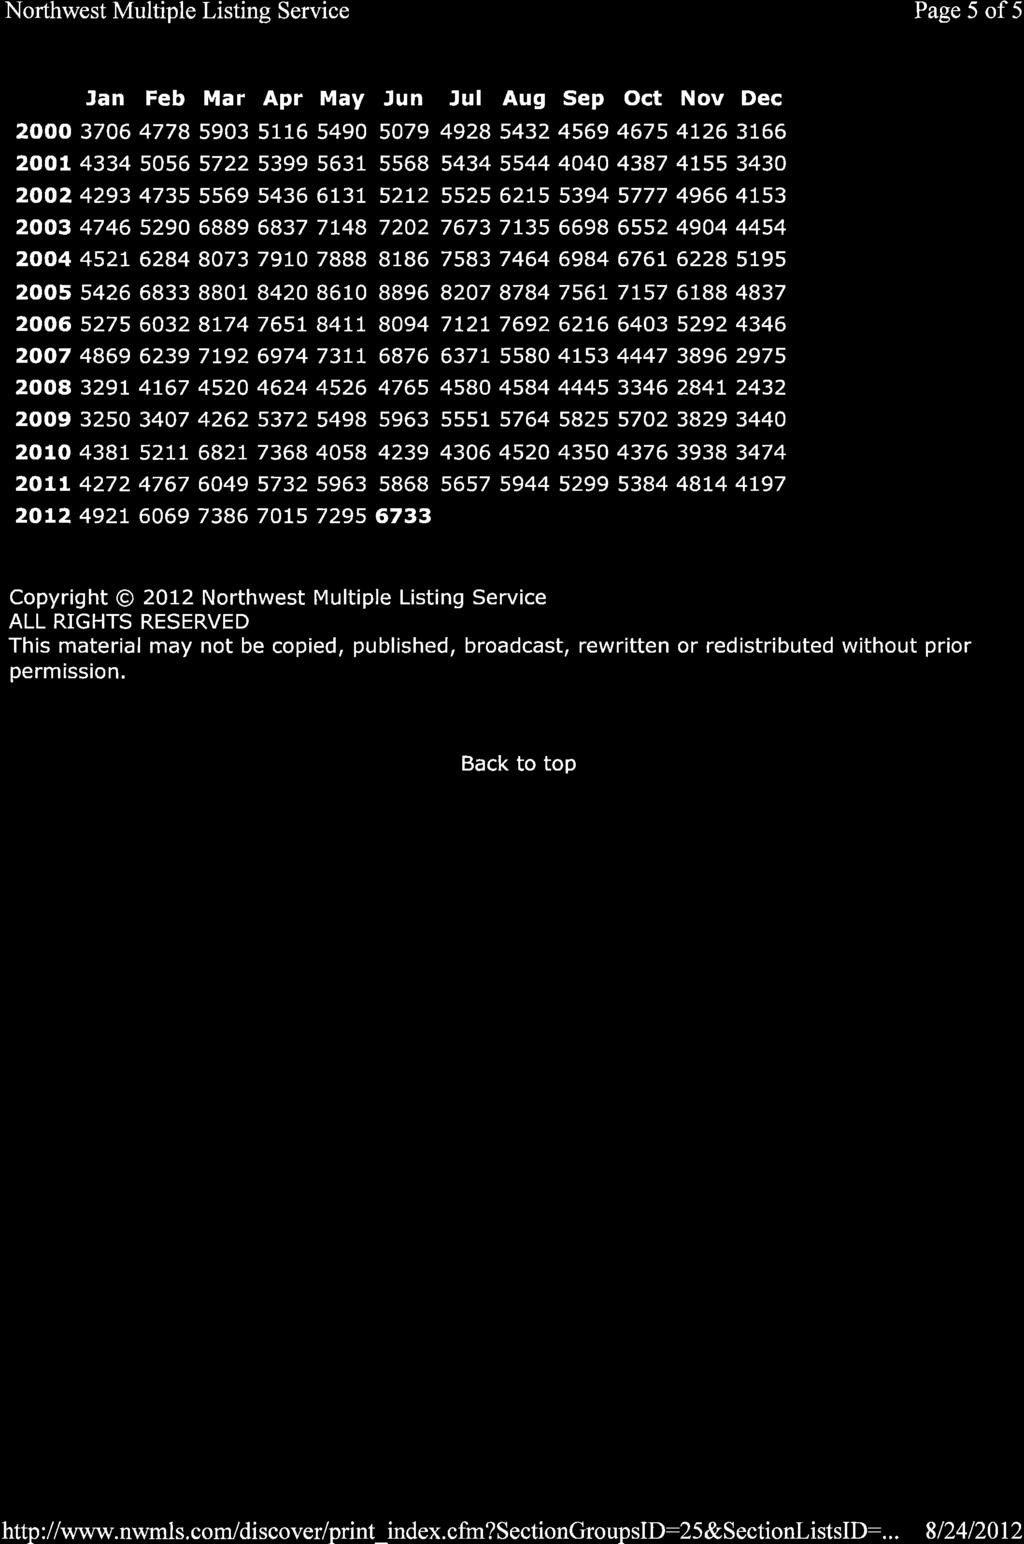
1 Market Area (City, State):Greater Seattle, WA MARKET AREA UPDATE Report as of: 1Q 2Q 3Q 4Q Year:2012 Provided by (Company / Companies):Coldwell Banker Bain, Windermere, Prudential NW, John L. Scott What are the most significant trends in your current real estate market? (Attach addenda, charts, graphs, etc. as appropriate) Around March activity spiked causing low inventory, multiple offers!* Define Market Area: Urban (city limit area only) Metro Area (as defined by MSA) Other: Please explain: * Single Family (detached) Condominiums / Townhome (attached) **Sales Price (current) Choose one: Average Median $462,000 $340,000 **Sales Price (same time prior year) Choose one: Average Median $466,000 $336,000 Average Days on Market list to contract (current) Absorption Months of Inventory (last 3 months) Number of active listings divided by the average # of sales per month (for the last 3 months) = # of months needed to sell existing inventory Absorption Months of Inventory (same time prior year) Active Listings Closed ( total last 3 months) #58 Increase Decreasing Stable #2 #2.9 #3.5 #7.1 #1428 #659 #2061 #543 Expired Listings ( total last 3 months if available) #n/a #n/a Change in Home Values %+3.8 %+3.8 Sold LP/SP Ratio (last 3 months) REAL ESTATE MARKET DATA Increase in past 3 months Stable Decreasing in past 3 months % 97 % 94 #91 Increase Decreasing Stabl Increase in past3months Stable Decreasing in past3months **Average = the result by adding all sales prices and dividing by the number of units sold Median = denoting the middle of the range of values GENERAL ECONOMY How would you rate the overall economic conditions in area as defined above: Mixed Stable Healthy Shrinking Depressed Supply of Listings: (Single family) Shortage Oversupply Balanced ~ (Condo/Townhome) Shortage Oversupply Balanced Overall Market Conditions: Active Stable Sluggish Flat Depressed Unemployment Rate:% %7.5Average Please check trend: Increasing Decreasing Same Please describe local economic conditions/climate: (draw upon newspaper articles concerning the coming and going of corporations, layoffs, etc.) Economy is improving, hiring increasing by most of our major employers. Slight decrease in jobs June over July, but Qtrly increased. Private sector has increased jobs while public sector saw a decrease.* RENTAL INFORMATION Is There a Charge for Rental Assistance: Yes No Outsourced Is Home/Condo Rental Information Available in Your MLS: Yes No Single Family Housing Availability: (3+Bedrooms) Shortage Oversupply Balanced Average Rent 3000limited in MLS Condo/Townhome Availability: (2+Bedrooms) Shortage Oversupply Balanced Average Rent 2550 limited in mls Apartment Availability: (2+Bedrooms) Shortage Oversupply Balanced Average Rent $2500 not in mls
.")
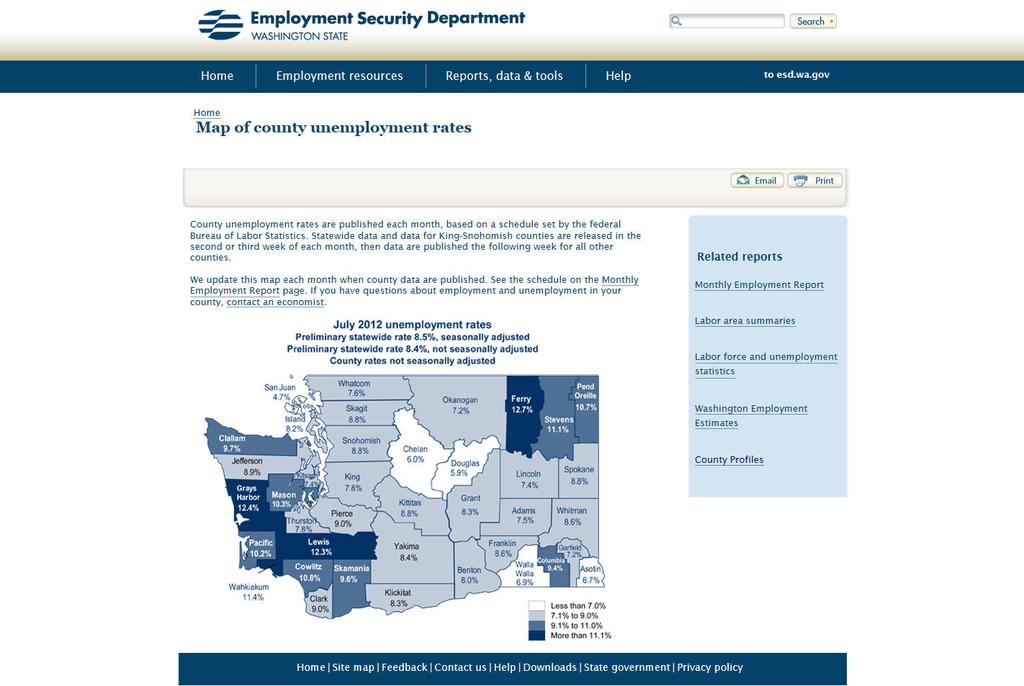
2 Monthly Employment Report for July 2012 On a seasonally adjusted basis, preliminary estimates from the federal Bureau of Labor Statistics (BLS) indicate Washington added 5,000 jobs from June to July BLS estimates the private sector added 6,300 jobs over the month and the public sector lost 1,300 jobs. Employment estimates in this report are generated by the U.S. Bureau of Labor Statistics (BLS). Due to changes in the method BLS uses to produce these data, we expect increased volatility in the estimates. BLS data in this report are rounded to the nearest 100. BLS estimates from July 2011 to July 2012 show a total job gain of 57,000 for the state. Over the year, the private sector added an estimated 62,500 jobs, while the public sector lost an estimated 5,500 jobs. Washington s preliminary seasonally adjusted unemployment rate for July 2012 rose to 8.5 percent. The estimated June 2012 unemployment rate of 8.3 percent was unchanged. The July 2011 unemployment rate was 9.3 percent. BLS estimates of monthly job gains and losses are based on a survey of businesses. Preliminary estimates are subject to revision. July 2012 jobs revisions: June s preliminary estimated gain of 10,200 jobs was revised to a gain of 12,200 jobs. Sectors with the biggest positive revisions were: government (1,500 jobs higher), other services (700 jobs higher), education and health services (400 jobs higher) and retail trade (300 jobs higher). Sectors with the largest downward revisions were professional and business services (1,000 jobs lower), construction (900 jobs lower) and transportation, warehousing and utilities (700 jobs lower). For more information, call Joe Elling at Resident civilian labor force and unemployment, seasonally adjusted The resident civilian labor force is the total number of people in the workforce, employed and unemployed, ages 16 and up. The number of unemployed is the estimated number of people who currently do not have a job, are available for work and have actively looked for work in the last four weeks. The unemployment rate is the ratio of the estimated number of unemployed divided by the civilian labor force. July June July June (Preliminary) (Revised) (Revised) (Revised) United States Unemployment rate 8.3% 8.2% 9.1% 9.1% Washington Unemployment rate 8.5% 8.3% 9.3% 9.3% Resident labor force 3,516,400 3,526,100 3,477,300 3,477,600 Unemployed 298, , , ,000 Seattle/Bellevue/Everett Unemployment rate 7.5% 7.2% 8.5% 8.6% Resident labor force 1,509,700 1,507,100 1,491,000 1,487,700 Unemployed 112, , , ,400 Washington State Employment Security Department Labor Market and Economic Analysis August 2012
3 Unemployment, seasonally adjusted The BLS estimates Washington s preliminary seasonally adjusted unemployment rate for July 2012 was 8.5 percent. The preliminary June unemployment rate of 8.3 percent was unchanged. U.S., Washington and Seattle unemployment rates, seasonally adjusted July 2007 through July 2012 Source: U.S. Bureau of Labor Statistics 11% 10% According to BLS estimates, the number of jobless people who were actively seeking work increased by about 4,200. At the same time, the number of employed workers fell an estimated 14,000. Overall, this amounted to a decrease of 9,800 people in the labor force. The preliminary July 2012 unemployment rate is 0.8 percentage point below the July 2011 rate of 9.3 percent. Unemployment rate 9% 8% 7% 6% 5% 4% 3% Jul-07 Jan-08 Jul-08 July 2012 preliminary unemployment rates: Jan-09 Jul-09 Washington U.S. Seattle Jan-10 Jul-10 Jan-11 Jul-11 Jan-12 U.S. (preliminary) 8.3% Washington (preliminary) 8.5% Seattle area (preliminary) 7.5% Jul-12 Employment change and moving average, seasonally adjusted Based on BLS estimates, Washington state gained 5,000 jobs from June 2012 to July 2012 and 57,000 jobs from July 2011 to July Recent employment change May 2012: Up 9,700 jobs (revised) June 2012: Up 12,200 jobs (revised) July 2012: Up 5,000 jobs (preliminary) Monthly employment change and three-month moving average, seasonally adjusted Washington state, July 2010 through July 2012 Source: Employment Security Dept./LMEA; U.S. Bureau of Labor Statistics Change in employment 16,000 12,000 8,000 4, ,000-8,000 Jul-10 Oct-10 Jan-11 Apr-11 Jul-11 Washington Oct-11 Jan-12 3-month average Apr-12 Jul-12 2 Monthly Employment Report for July 2012
4 Employment and the unemployment since the start of the recession, seasonally adjusted February 2008 (start of recent employment recession in Washington) Nonfarm employment: 2,976,200 Unemployment rate: 4.6% February 2010 (end of recent employment recession in Washington) Nonfarm employment: 2,770,100 Unemployment rate: 10.2% July 2012 (preliminary) Nonfarm employment: 2,887,800 Unemployment rate: 8.5% Nonfarm employment and unemployment since the start of the recession, seasonally adjusted Washington state, December 2007 through July 2012 Source: U.S. Bureau of Labor Statistics Nonfarm employment 3,000,000 2,950,000 2,900,000 2,850,000 2,800,000 2,750,000 2,700,000 2,650,000 2,600,000 Dec-07 May-08 Oct-08 Mar-09 Aug-09 Jan-10 Jun-10 Nov-10 Nonfarm employment Unemployment rate Apr-11 Sep-11 Feb-12 Jul-12 12% 10% 8% 6% 4% 2% 0% Unemployment rate 3 Monthly Employment Report for July 2012
5 Industry employment in Washington, seasonally adjusted One-month employment change by industry Based on a BLS survey of businesses, Washington gained an estimated 5,000 jobs over the month, on a seasonally adjusted basis: Overall, nine sectors expanded in July, while three contracted and one was unchanged. Private sector employment is estimated to have risen by 6,300, while government employment fell by an estimated 1,300 jobs. The manufacturing sector added an estimated 1,600 jobs. Aerospace product and parts manufacturing accounted for 1,100 of the increase. Retail trade employment grew by an estimated 400 in July. The largest growth within retail trade came from building materials and garden supply stores, up 400, while the number of jobs in clothing and accessory stores fell by 900. Wholesale trade expanded by 1,200 jobs over the month. Merchant wholesaler employment in nondurable goods increased by 800 and 500 among durable goods wholesalers. Education and health services employment increased by 1,900. The number of education based jobs was up 2,300 while health services jobs fell by 400. State government lost an estimated 1,900 jobs over the month. Federal and local government employment each rose by 300. Estimated one-month employment change by industry, seasonally adjusted Washington state, June 2012 to July 2012 Source: U.S. Bureau of Labor Statistics Total Nonfarm 5,000 Other Services 2,900 Education and Health Services 1,900 Manufacturing 1,600 Wholesale Trade 1,200 Leisure and Hospitality 1,200 Transportation, Warehousing and Utilities 900 Financial Activities 900 Retail Trade 400 Information 100 Mining and Logging 0 Construction -200 Government -1,300 Professional and Business Services -4,600 4 Monthly Employment Report for July 2012
6 Industry employment in Washington, seasonally adjusted, continued Over the year change by industry Based on a BLS survey of businesses, Washington added an estimated 57,000 jobs over the year: Overall, 11 sectors grew, one sector contracted and another was unchanged. Private sector employment rose 2.7 percent, up an estimated 62,500 jobs. Public sector employment fell 1%, a loss of 5,500 jobs. Professional and business services added an estimated 10,900 jobs over the year. Within the sector, administrative and support services grew by 7,300 jobs over the year, computer systems design and related services by 2,000 jobs, and accounting and bookkeeping services by 1,600 jobs. Manufacturing employment grew by an estimated 14,100 jobs over the year. Durablegoods manufacturers added 11,900 jobs with 7,800 of the increase in aerospace product and parts manufacturing. Nondurable goods manufacturers added 2,200 jobs. Retail trade grew by an estimated 7,700 jobs. Other retail trade contributed 6,300 jobs to the increase. Total government employment fell 5,500 over the year. Local governments cut 2,900 jobs and the state and federal governments each reduced employment by 1,300. Estimated year-over-year employment change by industry, seasonally adjusted Washington state, July 2011 to July 2012 Source: U.S. Bureau of Labor Statistics Total Nonfarm 57,000 Manufacturing 14,100 Professional and Business Services 10,900 Leisure and Hospitality 8,500 Retail Trade 7,700 Wholesale Trade 7,300 Other Services 5,100 Financial Activities 2,800 Transportation, Warehousing and Utilities 2,600 Construction 1,700 Education and Health Services 1,400 Information 400 Mining and Logging 0 Government -5,500 5 Monthly Employment Report for July 2012
7 Seasonally adjusted employment Seasonally adjusted numbers account for normal seasonal patterns that occur year after year, such as strong seasonal hiring in retail trade around the holidays. Taking into account normal seasonal variations makes it possible to see unusual changes in employment levels. Normal seasonal change is the expected monthly change in employment based on history. Estimated change is the employment change over the month based on BLS survey data. Seasonally adjusted change is change in employment taking into account the normal seasonal movement. Normal, estimated and seasonally adjusted employment Washington state, July 2012 Source: U.S. Bureau of Labor Statistics Industry sector Normal seasonal change Estimated change Seasonally adjusted change Total Nonfarm -13,540-8,540 5,000 Total Private 8,259 14,559 6,300 Construction 3,740 3, Manufacturing 2,029 3,629 1,600 Professional and Business Services 1,983-2,617-4,600 Retail Trade 1,859 2, Leisure and Hospitality 1,829 3,029 1,200 Transportation, Warehousing and Utilities 1,219 2, Other Services 867 3,767 2,900 Information Wholesale Trade 444 1,644 1,200 Financial Activities 408 1, Mining and Logging Education and Health Services -6,915-5,015 1,900 Government -21,799-23,099-1,300 Based on historical patterns, Washington typically loses 13,500 jobs from June to July. This year, the state had an estimated loss of 8,500 jobs, amounting to a seasonally adjusted increase of 5,000 jobs. Construction typically experiences a gain of 3,700 jobs in July. The unadjusted job gain for this July was 3,500, meaning there was a seasonally adjusted loss of 200 jobs. The leisure and hospitality sector historically adds 1,800 jobs in July. This sector added 3,000 jobs driving a seasonally adjusted increase of 1,200 jobs for the month. Manufacturing employment rose by 3,600 in July. Typically the July increase is 2,000, so on a seasonally adjusted basis manufacturing employment rose 1,600. Government employment normally falls by 21,800 in July. This July it fell by an estimated 23,100 jobs for a seasonally adjusted loss of 1,300 jobs. 6 Monthly Employment Report for July 2012
8 Benchmarking highlights, seasonally adjusted Quarterly benchmarked industry employment Washington state, March 2012 Source: U.S. Bureau of Labor Statistics, Quarterly Census of Employment and Wages Revisions to March 2012 employment Industry sector level Total Nonfarm -1,300 Other Services 1,700 Manufacturing 1,400 Financial Activities 700 Professional and Business Services 500 Information 400 Transportation, Warehousing and Utilities 200 Government 200 Mining and Logging 100 Wholesale Trade 0 Education and Health Services -700 Leisure and Hospitality -900 Construction -1,800 Retail Trade -3,100 Benchmarking is a process that replaces employment estimates with the actual number of job gains or losses. Each month, economists estimate monthly job gains and losses based on a survey of employers. Then, each quarter, economists benchmark the estimates by replacing them with data from employer tax records, before applying seasonal adjustments. Benchmarked employment data are now available through March Employment estimates for July 2012 presented in this report were based on these new data, plus seasonal adjustments. Based on benchmarked March 2012 data: The overall seasonally adjusted employment level at the end of March 2012 was 1,300 lower than initially estimated. Other services had the largest upward revision (up 1,700 jobs, seasonally adjusted), followed by manufacturing (up 1,400 jobs). The sector with the largest downward revision in jobs was retail trade, down 3,100 jobs from earlier estimates. Other sectors with notable downward benchmarking revisions were construction (down 1,800 jobs), and leisure and hospitality (down 900 jobs). Each time employment estimates are benchmarked, estimates for subsequent months are recalculated. Based on benchmarked March 2012 data, employment estimates for April, May and June of 2012 were recalculated. 7 Monthly Employment Report for July 2012
9 Total agricultural employment summary, not seasonally adjusted Statewide from June to July, agricultural employment increased 45.6 percent. Year over year statewide, agricultural employment increased 7.8 percent. This was due primarily to a 13.7 percent increase in cherry harvest. Regionally, over the past year, all six areas had increases in total agricultural employment. The largest increase (4,230 jobs) was in the North Central agricultural reporting area. Total agricultural employment Washington state, July 2012 Source: Employment Security Department/LMEA Change Percent change July 2012 June 2012 July 2011 June 11 - July 11 - June 11 - July 11 - Preliminary Revised Revised July 12 July 12 July 12 July 12 Statewide 139,220 95, ,160 43,590 10, % 7.8% Western 16,000 10,820 14,080 5,180 1, % 13.6% South Central 43,740 32,480 42,310 11,270 1, % 3.4% North Central 38,520 19,750 34,210 18,770 4, % 12.6% Columbia Basin 15,680 12,470 14,730 3, % 6.4% South Eastern 23,520 18,510 22,260 5,000 1, % 5.7% Eastern 1,760 1,600 1, % 12.1% Totals may not add due to rounding. We report only agricultural employment covered by unemployment insurance, not adjusted for multiple jobholders. Agricultural employment estimates are developed by the Labor Market and Economic Analysis branch of the Employment Security Department. Estimates are based on a monthly survey of agricultural producers conducted by Employment Security. For agricultural reporting, we divide the state into six areas based on geography and types of agricultural activity. View a map of Washington s agricultural reporting areas at: wa.gov/esd/employmentdata/ reports-publications/industryreports/agricultural-employmentand-wage-report/map-ofwash ingtons-agricultural-areas. 8 Monthly Employment Report for July 2012
10 Contacts Chief Economist: Joe Elling Economists: Bruce Nimmo Alex Roubinchtein, Ph.D Chris Thomas Regional labor economists: Scott Bailey, Southwest Washington Mark Berreth, N. Central Washington Don Meseck, S. Central Washington Desiree Phair, King County ext Elizabeth Scott, Ph.D., Olympic Consortium Ajsa Suljic, Benton-Franklin Paul Turek, Ph.D., Pierce Doug Tweedy, Spokane Anneliese Vance-Sherman, Ph.D., Snohomish Jim Vleming, Pacific Mountain Washington Relay Service: Most of the employment numbers discussed in this report refer to jobs, not persons. For example, if a person holds two positions, these positions are counted as two jobs in the employment series. In the section titled Unemployment, these positions refer to individuals, not jobs. In this case, a person holding two jobs is counted only once. Note: Due to changes in the processing of the monthly employment data by the U.S. Bureau of Labor Statistics, the county level information will be available at 10 a.m., July 24, The publication schedule for 2012 can be found at: The Employment Security Department is an equal-opportunity employer and provider of programs and services. Auxiliary aids and services are available upon request to people with disabilities. 9 Monthly Employment Report for July 2012 LM
11
12
13

14
15


16
17
18

19
20
21
Monthly Employment Report
 Washington 5.8% United States 4.9% Seasonally adjusted Employment estimates in this report are generated by the U.S. Bureau of Labor Statistics (BLS). Monthly employment estimates are subject to revision
Monthly Employment Report for June 2018
 Washington 4.7% United States 4.0% Seasonally adjusted Employment estimates in this report are generated by the U.S. Bureau of Labor Statistics (BLS). Monthly employment estimates are subject to revision
Monthly Employment Report
 Washington 4.5% United States 4.1% Seasonally adjusted Employment estimates in this report are generated by the U.S. Bureau of Labor Statistics (BLS). Monthly employment estimates are subject to revision
Monthly Employment Report
 Washington 4.5% United States 4.1% Seasonally adjusted Employment estimates in this report are generated by the U.S. Bureau of Labor Statistics (BLS). Monthly employment estimates are subject to revision
Monthly Employment Report
 Washington 4.5% United States 4.0% Seasonally adjusted Monthly Employment Report January 2019 Employment estimates in this report are generated by the U.S. Bureau of Labor Statistics (BLS). Monthly employment
Monthly Employment Report
 Washington 4.5% United States 4.4% Seasonally adjusted Employment estimates in this report are generated by the U.S. Bureau of Labor Statistics (BLS). Monthly employment estimates are subject to revision
Monthly Employment Report
 Washington 4.7% United States 4.1% Seasonally adjusted Employment estimates in this report are generated by the U.S. Bureau of Labor Statistics (BLS). Monthly employment estimates are subject to revision
Monthly Employment Report
 Seasonally adjusted Washington 4.3% United States 3.7% Monthly Employment Report November 2018 Employment estimates in this report are generated by the U.S. Bureau of Labor Statistics (BLS). Monthly employment
Monthly Employment Report
 Seasonally adjusted Washington 4.3% United States 3.9% Monthly Employment Report December 2018 Employment estimates in this report are generated by the U.S. Bureau of Labor Statistics (BLS). Monthly employment
Monthly Employment Report
 Washington 5.6% United States 5.0% Seasonally adjusted Employment estimates in this report are generated by the U.S. Bureau of Labor Statistics (BLS). Monthly employment estimates are subject to revision
Washington State Business Employment Dynamics Second Quarter 2017
 Quarterly Census of Employment and Wages Business Employment Dynamics April to June 2017 Washington State Business Employment Dynamics Second Quarter 2017 Figure 1 Net change in jobs, seasonally adjusted
MARKET AREA UPDATE Year: 2017 Report as of: 1Q 2Q 3Q 4Q
 Market Area (City, State): San Francisco, CA Provided by (Company / Companies): Coldwell Banker Provided by RDC Member(s): Lorna Magers MARKET AREA UPDATE Year: 2017 Report as of: 1Q 2Q 3Q 4Q What are
MARKET AREA UPDATE Report as of: 1Q 2Q 3Q 4Q
 Market Area (City, State): Mid-Atlantic Region MARKET AREA UPDATE Report as of: 1Q 2Q 3Q 4Q Year: 2010 Provided by (Company / Companies): Long & Foster Real Estate What are the most significant trends
MARKET AREA UPDATE Year: 2018 Report as of: 1Q 2Q 3Q 4Q
 arket Area (City, State): Palm Beach, Florida ARKET AREA UPDATE Year: 2 Report as of: 1Q 2Q 3Q 4Q Provided by (Company / Companies): Provided by RDC ember(s): What are the most significant trends in your
State of Ohio Workforce. 2 nd Quarter
 To Strengthen Ohio s Families through the Delivery of Integrated Solutions to Temporary Challenges State of Ohio Workforce 2 nd Quarter 2 0 1 2 Quarterly Report on the State of Ohio s Workforce Reference
DEPARTMENT OF LABOR AND INDUSTRIAL RELATIONS. HAWAII'S UNEMPLOYMENT RATE AT 2.2 PERCENT IN SEPTEMBER Jobs Increase 11,600 Over the Year
 DEPARTMENT OF LABOR AND INDUSTRIAL RELATIONS FOR IMMEDIATE RELEASE October, 20 DAVID Y. IGE GOVERNOR LEONARD HOSHIJO DIRECTOR HAWAII'S UNEMPLOYMENT RATE AT 2.2 PERCENT IN SEPTEMBER Jobs Increase 11,600
Employment in Central Oregon: January, 2015
 FOR IMMEDIATE RELEASE: March 10, 2015 CONTACT INFORMATION: Damon Runberg, Regional Economist Damon.M.Runberg@oregon.gov (541) 388-6442 Employment in Central Oregon: January, 2015 Central Oregon finished
DEPARTMENT OF LABOR AND INDUSTRIAL RELATIONS HAWAII'S UNEMPLOYMENT RATE AT NEW RECORD 2.0 PERCENT IN NOVEMBER
 DEPARTMENT OF LABOR AND INDUSTRIAL RELATIONS FOR IMMEDIATE RELEASE December 21, 20 D A V I D Y. I G E G O V E R N O R L E O N A R D H O S H I J O A C T I N G D I R E C T O R HAWAII'S UNEMPLOYMENT RATE
Unemployment Rate Edges Lower to 5.0 Percent Employment Down in December
 Media Contact 609-984-2841 EMAIL: MediaCalls@dol.state.nj.us Unemployment Rate Edges Lower to 5.0 Percent Employment Down in December TRENTON, January 18, 2018 Preliminary monthly estimates released by
HOUSTON-THE WOODLANDS-SUGAR LAND METROPOLITAN STATISTICAL AREA (H-W-S MSA) Visit our website at
 Visit our website at") Labor Market Information DECEMBER 2015 Employment Data HOUSTON-THE WOODLANDS-SUGAR LAND METROPOLITAN STATISTICAL AREA () Visit our website at www.wrksolutions.com The Houston-The Woodlands-Sugar Land Metropolitan
Labor Market Information DECEMBER 2015 Employment Data HOUSTON-THE WOODLANDS-SUGAR LAND METROPOLITAN STATISTICAL AREA () Visit our website at www.wrksolutions.com The Houston-The Woodlands-Sugar Land Metropolitan
Employment in Central Oregon: June 2015
 FOR IMMEDIATE RELEASE: July 21, 2015 CONTACT INFORMATION: Damon Runberg, Regional Economist Damon.M.Runberg@oregon.gov (541) 706-0779 Employment in Central Oregon: June 2015 There were no significant changes
Michigan s July Unemployment Rate Moves Up Seasonally
 Labor Market News Michigan s September 2016 Vol. 72, Issue No. 7 Percent Michigan s July Unemployment Rate Moves Up Seasonally Michigan s unemployment rate (not seasonally adjusted) increased by 0.5 of
Table 1: Major Indicators of Labor Market Activity for New Jersey Seasonally Adjusted 2016 Benchmark Labor Force Data (resident)
") Table 1: Major Indicators of Labor Market Activity for New Jersey Seasonally Adjusted Benchmark Labor Force Data (resident) Current Month Previous Month One Year Ago Net Change Net Change Dec. 17 (P) Nov.
Table 1: Major Indicators of Labor Market Activity for New Jersey Seasonally Adjusted Benchmark Labor Force Data (resident) Current Month Previous Month One Year Ago Net Change Net Change Dec. 17 (P) Nov.
Employment Data (establishment)
") Table 1: Major Indicators of Labor Market Activity for New Jersey Seasonally Adjusted (thousands) Benchmark Labor Force Data (resident) Current Month Previous Month One Year Ago Net Change Net Change May
Table 1: Major Indicators of Labor Market Activity for New Jersey Seasonally Adjusted (thousands) Benchmark Labor Force Data (resident) Current Month Previous Month One Year Ago Net Change Net Change May
Employment in Central Oregon: December 2016
 FOR IMMEDIATE RELEASE: January 24, 2017 CONTACT INFORMATION: Damon Runberg, Economist Damon.M.Runberg@oregon.gov (541) 706-0779 Employment in Central Oregon: December 2016 There was a distinct urban-rural
Oregon s Payroll Employment Dropped by 6,400 in February While the Unemployment Rate Held Steady at 8.8 Percent
 FOR IMMEDIATE RELEASE: March 20, 2012 PRESS CONFERENCE PRESENTER: Nick Beleiciks, State Employment Economist CONTACT INFORMATION: David Cooke, Economist (503) 947 1272 Oregon s Payroll Employment Dropped
Central Oregon Employment Situation for December 2014
 January 26, 2015 Contact: Damon M. Runberg Regional Economist (541) 388-6442 Central Oregon Employment Situation for December 2014 Central Oregon closed out 2014 with mixed results. This past year Deschutes
MARKET AREA UPDATE Report as of: 1Q 2Q 3Q 4Q
 Year: 2014 Market Area (City, State): Honolulu MSA aka Oahu, Hawaii Provided by (Company / Companies): Kahala Associates MARKET AREA UPDATE Report as of: 1Q 2Q 3Q 4Q What are the most significant trends
Michigan s January Unemployment Rate Moves Up Seasonally
 Labor Market News Michigan s March 2016 Vol. 72, Issue No. 1 Percent Michigan s January Unemployment Rate Moves Up Seasonally Michigan s unemployment rate (not seasonally adjusted) increased by 0.6 of
LABOR SITUATION Office of Research
 Sharon Palmer Commissioner LABOR SITUATION Office of Research FOR IMMEDIATE RELEASE May 2013 Data CT Unemployment Rate = 8.0% US Unemployment Rate = 7.6% Nonfarm jobs rise 1,000 in May but the unemployment
Metro Area Unemployment Rates All Decline; Las Vegas Accounts for the Bulk of the Job Growth Over the Month
 SEPTEMBER SUB-STATE PRESS RELEASE For Immediate Release October 23, 2018 Metro Area Unemployment Rates All Decline; Las Vegas Accounts for the Bulk of the Job Growth Over the Month CARSON CITY, NV According
Nevada s Unemployment Rate Falls to 10.2 Percent in December
 For Immediate Release January 18, 2013 Nevada s Unemployment Rate Falls to 10.2 Percent in December For the month of December, Nevada saw a decline in its unemployment rate from 10.8 percent in November
MARKET AREA UPDATE Report as of: 1Q 2Q 3Q 4Q
 Market Area (City, State):Omaha, NE MARKET AREA UPDATE Report as of: 1Q Q 3Q Q Year:01 Provided by (Company / Companies):Prudential Ambassador Real Estate What are the most significant trends in your current
North Carolina s April Employment Figures Released
 For Immediate Release: May 18, For More Information, Contact: Beth Gargan/919.814.4610 North Carolina s April Employment Figures Released RALEIGH The state s seasonally adjusted April unemployment rate
THE EMPLOYMENT SITUATION JULY 2018
 Transmission of material in this news release is embargoed until 8:30 a.m. (EDT) Friday, August 3, USDL-18-1240 Technical information: Household data: Establishment data: Media contact: (202) 691-6378
James K. Polk United States President ( ) Mecklenburg County NC
 Mecklenburg County NC") february 2006 James K. Polk United States President (1845-1849) Mecklenburg County NC http://www.whitehouse.gov/history/presidents/jp11.html January Highlights The Unemployment Rate (Seasonally Adjusted)
february 2006 James K. Polk United States President (1845-1849) Mecklenburg County NC http://www.whitehouse.gov/history/presidents/jp11.html January Highlights The Unemployment Rate (Seasonally Adjusted)
Oregon s Unemployment Rate Was Unchanged at 8.4 Percent in February, as Payroll Employment Grew by 6,800. Millions
 NEWS 875 Union Street NE Salem, Oregon 97311 PH: 503.947.1394 TTY-TDD 711 www.qualityinfo.org FOR IMMEDIATE RELEASE: March 19, 2013 PRESS CONFERENCE PRESENTER: Nick Beleiciks, State Employment Economist
Nonfarm jobs slip 1,700 in December; unemployment rate declines to 4.4%
 Lincoln.dyer@ct.gov appears Office of Research Scott D. Jackson, Commissioner FOR IMMEDIATE RELEASE December 2016 Data CT Unemployment Rate = 4.4% US Unemployment Rate = 4.7% Nonfarm jobs slip 1,700 in
Nonfarm jobs fall by 2,000 in March; unemployment rate at 4.5%
 Lincoln.dyer@ct.gov appears Office of Research Scott D. Jackson, Commissioner FOR IMMEDIATE RELEASE March 2018 Data CT Unemployment Rate = 4.5% US Unemployment Rate = 4.1% Nonfarm jobs fall by 2,000 in
ECONOMIC & REVENUE UPDATE
 January 11, 2018 Summary summary The U.S. labor market gained 148,000 net new jobs in December. U.S. housing starts in November 2017 were 12.9% above their year-ago level. Consumer confidence declined
Oregon s Unemployment Rate Was Essentially Unchanged at 8.4 Percent in January, as Payroll Employment Grew by 4,200. Millions
 NEWS 875 Union Street NE Salem, Oregon 97311 PH: 503.947.1394 TTY-TDD 711 www.qualityinfo.org FOR IMMEDIATE RELEASE: March 5, 2013 PRESS CONFERENCE PRESENTER: Nick Beleiciks, State Employment Economist
MARKET AREA UPDATE Report as of: 1Q 2Q 3Q 4Q
 MARKET AREA UPDATE Report as of: 1Q 2Q 3Q 4Q Year: 2013 Market Area (City, State): Metropolitan Area - Detroit, Michigan Provided by (Company / Companies): Real Estate One, Inc. What are the most significant
Metro Areas Show Moderate Employment Growth Over the Month with Trends Remaining Strong Over the Year
 AUGUST SUB-STATE PRESS RELEASE For Immediate Release September 25, 2018 Metro Areas Show Moderate Employment Growth Over the Month with Trends Remaining Strong Over the Year CARSON CITY, NV Statewide,
Key Labor Market and Economic Metrics
 Key Labor Market and Economic Metrics May Update Incorporates Data Available on May 27 th, 2016 This reference is the result of a collaboration between the Bureau of Labor Market Information and Strategic
Unemployment Rates Declined in the Metro Areas in August
 For Immediate Release Sept.18, 2017 Unemployment Rates Declined in the Metro Areas in August CARSON CITY, NV Unemployment rates were down in all of the state s major population centers, both on a monthover-month
Nevada Closes Out 2017 on a Strong Note; Unemployment Down Throughout the State
 DECEMBER SUB-STATE PRESS RELEASE January 23 rd, 2018 Nevada Closes Out 2017 on a Strong Note; Unemployment Down Throughout the State Statement from Bill Anderson, Chief Economist, Department of Employment,
The Unemployment Rates Decline in September in Nevada s Metro Areas
 For Immediate Release October 25, 2016 The Unemployment Rates Decline in September in Nevada s Metro Areas CARSON CITY, NV In September, unemployment rates in all three of the Silver State s major population
Nonfarm jobs down 1,600 in February; unemployment rate at 4.7%
 Lincoln.dyer@ct.gov appears Office of Research Scott D. Jackson, Commissioner FOR IMMEDIATE RELEASE February 2017 Data CT Unemployment Rate = 4.7% US Unemployment Rate = 4.7% Nonfarm jobs down 1,600 in
Nonfarm jobs decline 2,000 in September; unemployment rate falls to 4.6%
 Lincoln.dyer@ct.gov appears Office of Research Scott D. Jackson, Commissioner FOR IMMEDIATE RELEASE September 2017 Data CT Unemployment Rate = 4.6% US Unemployment Rate = 4.2% Nonfarm jobs decline 2,000
Nevada s Metro Areas Experience Drop in Unemployment in December
 For Immediate Release January 24, 2017 Nevada s Metro Areas Experience Drop in Unemployment in December CARSON CITY, NV The jobless rate in Las Vegas declined to 5 percent in December, down 0.2 percentage
Employment Situation: Ohio and U.S. (Seasonally Adjusted) 20,000 15,000 10,000 5,000 -5,000. In This Issue
 20,000 15,000 10,000 5,000 -5,000. In This Issue") Civilian Labor Force Ohio s unemployment rate was 4.8 percent in November 217, down from 5.1 percent in October 217. The number of unemployed in Ohio in November was 279,, down 17, from 296, in October.
Civilian Labor Force Ohio s unemployment rate was 4.8 percent in November 217, down from 5.1 percent in October 217. The number of unemployed in Ohio in November was 279,, down 17, from 296, in October.
North Carolina s January Employment Figures Released
 For Immediate Release: March 13, For More Information, Contact: Beth Gargan/919.814.4610 North Carolina s January Employment Figures Released RALEIGH The state s seasonally adjusted January unemployment
Nevada s Metropolitan Areas Unemployment Rates Down Year over Year
 For Immediate Release August 25, 2015 Nevada s Metropolitan Areas Unemployment Rates Down Year over Year CARSON CITY, NV Nevada s metropolitan area unemployment rates all decreased year over year in July.
North Carolina s June Employment Figures Released
 For Immediate Release: July 22, For More Information, Contact: Kim Genardo/919.814.4610 North Carolina s Employment Figures Released RALEIGH The state s seasonally adjusted unemployment rate was 4.9 percent,
Nonfarm jobs fall by 400 in February; unemployment rate unchanged at 3.8%
 Lincoln.dyer@ct.gov appears Office of Research Kurt Westby, Commissioner FOR IMMEDIATE RELEASE February 2019 Data CT Unemployment Rate = 3.8% US Unemployment Rate = 3.8% Nonfarm jobs fall by 400 in February;
nc today october 2006 Photo courtesy of NC Division of Tourism, Film and Sports development. Linn Cove Viaduct, Blue Ridge Parkway, NC
 nc today october 2006 Photo courtesy of NC Division of Tourism, Film and Sports development. Linn Cove Viaduct, Blue Ridge Parkway, NC September Highlights North Carolina Unemployment Rate (Seasonally
EMPLOYMENT AND EARNINGS
 L2- EMPLOYMENT AND EARNINGS U.S. Department of Labor Bureau of Labor Statistics October 997 In this issue: Third quarter 997 averages for household survey data Monthly Household Data Historical A-. Employment
State of California January 22, 2010 EMPLOYMENT DEVELOPMENT DEPARTMENT S. Bascom Ave. (408) Campbell, CA 95008
 Campbell, CA 95008") State of California EMPLOYMENT DEVELOPMENT DEPARTMENT Contact: Janice Shriver 2450 S. Bascom Ave. (408) 558-0689 Campbell, CA 95008 OAKLAND-FREMONT-HAYWARD METROPOLITAN DIVISION (MD) (ALAMEDA AND CONTRA
State of California EMPLOYMENT DEVELOPMENT DEPARTMENT Contact: Janice Shriver 2450 S. Bascom Ave. (408) 558-0689 Campbell, CA 95008 OAKLAND-FREMONT-HAYWARD METROPOLITAN DIVISION (MD) (ALAMEDA AND CONTRA
Nonfarm jobs climb 6,700 in May; unemployment rate steady at 4.9%
 Lincoln.dyer@ct.gov appears Office of Research Scott D. Jackson, Commissioner FOR IMMEDIATE RELEASE May 2017 Data CT Unemployment Rate = 4.9% US Unemployment Rate = 4.3% Nonfarm jobs climb 6,700 in May;
Communities Count Data Updates for October Bankruptcies Home Foreclosures Unemployment
 Communities Count 2008 Data Updates for October 2009 Bankruptcies Home Foreclosures Unemployment HTUwww.communitiescount.orgUTH Page 1 of 8 Communities Count reports on a set of social and health indicators
Current Employment Statistics
 Current Employment Statistics October 2017 If you have any questions or seek additional information, please contact: Vermont Department of Labor Economic and Labor Market Information Division 802-828-4202
Current Employment Statistics
 Current Employment Statistics December 2017 If you have any questions or seek additional information, please contact: Vermont Department of Labor Economic and Labor Market Information Division 802-828-4202
Nevada s Unemployment Rate Drops Again in February
 For Immediate Release March 28, 2014 Nevada s Unemployment Rate Drops Again in February Carson City, NV Nevada s unemployment rate fell to 8.5 percent in February, which equates to 116,600 people who are
NEW ORLEANS REGIONAL COUNCIL FOR BUSINESS ECONOMICS
 Monthly Non-Farm Employment Jan. 2008 Apr Jul Jan.2009 Jan. 2010 Jan.2011 Jan.2012 Jan.2013 Jan.2014 Jan. 2015 Jan. 2016 Jan.2017 2017 THE NEW ORLEANS REGIONAL ECONOMIC INDEX NEW ORLEANS REGIONAL COUNCIL
Nonfarm jobs grow by 1,500 in October; unemployment rate unchanged at 4.2%
 Lincoln.dyer@ct.gov appears Office of Research Kurt Westby, Commissioner FOR IMMEDIATE RELEASE October 2018 Data CT Unemployment Rate = 4.2% US Unemployment Rate = 3.7% Nonfarm jobs grow by 1,500 in October;
C I T Y O F B O I S E
 C I T Y O F B O I S E D E P A R T M E N T O F F I N A N C E A N D A D M I N I S T R A T I O N Office of Budget Development & Monitoring Economic Brief Shannon Cade, Financial Analyst & Brent Davis, Budget
North Carolina s June Employment Figures Released
 For Immediate Release: July 20, For More Information, Contact: Beth Gargan/919.814.4610 North Carolina s Employment Figures Released RALEIGH The state s seasonally adjusted unemployment rate was 4.2 percent,
Nonfarm jobs increase by 6,100 in June; unemployment rate at 4.4%
 Lincoln.dyer@ct.gov appears Office of Research Kurt Westby, Commissioner FOR IMMEDIATE RELEASE June 2018 Data CT Unemployment Rate = 4.4% US Unemployment Rate = 4.0% Nonfarm jobs increase by 6,100 in June;
May brings largest nonfarm job gain in 2014 (+5,800); unemployment rate unchanged
; unemployment rate unchanged") Office of Research Sharon M. Palmer, Commissioner FOR IMMEDIATE RELEASE May 2014 Data CT Unemployment Rate = 6.9% US Unemployment Rate = 6.3% May brings largest nonfarm job gain in 2014 (+5,800); unemployment
Office of Research Sharon M. Palmer, Commissioner FOR IMMEDIATE RELEASE May 2014 Data CT Unemployment Rate = 6.9% US Unemployment Rate = 6.3% May brings largest nonfarm job gain in 2014 (+5,800); unemployment
Nonfarm jobs fall by 500 in September; unemployment rate falls to 4.2%
 Lincoln.dyer@ct.gov appears Office of Research Kurt Westby, Commissioner FOR IMMEDIATE RELEASE September 2018 Data CT Unemployment Rate = 4.2% US Unemployment Rate = 3.7% Nonfarm jobs fall by 500 in September;
BLS Data: State Adds 8,900 Private Sector Jobs, 2,100 Manufacturing Jobs in March: Unemployment Rate Holds at Historically Low 2.
 Department of Workforce Development Secretary s Office 201 E. Washington Avenue P.O. Box 7946 Madison, WI 53707 Telephone: (608) 266-3131 Fax: (608) 266-1784 Email: sec@dwd.wisconsin.gov Scott Walker,
M onthly arket. May Table of Contents. Monthly Highlights
 Table of Contents Market Inventory...2 www.gaar.com Monthly Highlights The median sales price for single-family, detached homes held at $165,000 for the second consecutive month. The number of properties
Employment Situation: Ohio and U.S. (Seasonally Adjusted) 25,000 20,000 15,000 10,000 5,000. In This Issue
 25,000 20,000 15,000 10,000 5,000. In This Issue") Civilian Labor Force Ohio s unemployment rate was 4.5 percent in June 218, up from 4.3 percent in May. The number of unemployed in Ohio in June was 259,, up 9, from 25, in May. The number of unemployed
Civilian Labor Force Ohio s unemployment rate was 4.5 percent in June 218, up from 4.3 percent in May. The number of unemployed in Ohio in June was 259,, up 9, from 25, in May. The number of unemployed
Nevada s Unemployment Rate Declines to 9.6 Percent in February
 For Immediate Release March 29, 2013 Nevada s Unemployment Rate Declines to 9.6 Percent in February Nevada s unemployment rate fell to a seasonally adjusted 9.6 percent in February, down from 11.8 percent
Nevada s Unemployment Rate Falls in October to 6.6 Percent Outlook is Positive for Holiday Hiring
 For Immediate Release Nov. 18, 2015 Nevada s Unemployment Rate Falls in October to 6.6 Percent Outlook is Positive for Holiday Hiring CARSON CITY, NV Nevada s unemployment rate dipped to a seasonally adjusted
BLS Data: Wisconsin Adds Statistically Significant 35,900 Private-Sector, 22,800 Manufacturing Jobs Over Year
 Department of Workforce Development Secretary s Office 201 E. Washington Avenue P.O. Box 7946 Madison, WI 53707 Telephone: (608) 266-3131 Fax: (608) 266-1784 Email: sec@dwd.wisconsin.gov Scott Walker,
MonthlyEconomicIndicators. MarchUpdate: 2017Benchmark EmploymentRevision. EnergeticBodies.EnergeticMinds. ResearchSponsor.
 MonthlyEconomicIndicators EnergeticBodies.EnergeticMinds. www.metrodenver.org MarchUpdate: 2017Benchmark EmploymentRevision ResearchSponsor www.pinnacol.com www.developmentresearch.net 2016 and 2017 Employment
Economic Indicators For Manufacturing Executives
 Economic Indicators For Manufacturing Executives Valuable Data for a Complex World Presented by: Cliff Waldman Chief Economist, MAPI Foundation cwaldman@mapi.net Today s Presentation The Value of Economic
THE EMPLOYMENT SITUATION OCTOBER 2018
 Transmission of material in this news release is embargoed until 8:30 a.m. (EDT) Friday, November 2, USDL-18-1739 Technical information: Household data: Establishment data: Media contact: (202) 691-6378
VECTRA BANK 23 RD ANNUAL ECONOMIC FORECAST BREAKFAST START SMART IN 2016! Member FDIC VectraBank.com
 VECTRA BANK 23 RD ANNUAL ECONOMIC FORECAST BREAKFAST START SMART IN 2016! Member FDIC VectraBank.com Economic Presentation April 26, 2016 Tatiana Bailey, Ph.D. Director, UCCS Economic Forum A Little Humor
Anchorage Employment Report
 Third Edition April Anchorage Employment Report CO-SPONSORED BY: TABLE OF CONTENTS EXECUTIVE SUMMARY...2 GOODS PRODUCING JOBS SUMMARY...3 SERVICES PROVIDING JOBS SUMMARY...4 HEALTH CARE SNAPSHOT...4 PROFESSIONAL
Nevada Adds 2,800 Jobs in September to 1,394,100 While Unemployment Remains Unchanged at 4.5%
 For Immediate Release October 17, 2018 SEPTEMBER STATEWIDE LABOR MARKET RELEASE Nevada Adds 2,800 Jobs in September to 1,394,100 While Unemployment Remains Unchanged at 4.5% CARSON CITY, NV - The state
BLS Data: Wisconsin Unemployment Rate Remains at or Below 3 percent for Record 9 th Straight Month
 Department of Workforce Development Secretary s Office 201 E. Washington Avenue P.O. Box 7946 Madison, WI 53707 Telephone: (608) 266-3131 Fax: (608) 266-1784 Email: sec@dwd.wisconsin.gov Scott Walker,
November 2018 Labor Market Review Reported by: Kathy Jaworski
 November 2018 Labor Market Review Reported by: Kathy Jaworski Regional Workforce Analyst Tel: 219-841-6347 Email Kathy kjaworski@dwd.in.gov Economic Growth Region 1 Statistical Data Report for November
An abnormally-slow December caps off the year with a range of bright spots as well as challenges. U.S. employment situation: September 2013
 An abnormally-slow December caps off the year with a range of bright spots as well as challenges U.S. employment situation: September 2013 U.S. Release employment date: October situation: 22, December
THE EMPLOYMENT SITUATION JULY 2018
 Transmission of material in this news release is embargoed until 8:30 a.m. (EDT) Friday, August 3, USDL-18-1240 Technical information: Household data: Establishment data: Media contact: (202) 691-6378
Nevada s Metro Areas Experience Decreased Unemployment Rates in December
 For Immediate Release Jan. 26, 2016 Nevada s Metro Areas Experience Decreased Unemployment Rates in December CARSON CITY, NV Nevada s metropolitan areas saw an improvement in the unemployment rate for
ECONOMIC CURRENTS. Vol. 2, Issue 1 THE SOUTH FLORIDA ECONOMIC QUARTERLY. Introduction. In this Issue:
 ECONOMIC CURRENTS THE SOUTH FLORIDA ECONOMIC QUARTERLY Vol. 2, Issue 1 Introduction Economic Currents provides an overview of the South Florida regional economy. The report combines current employment,
July 2015 Lutgert College Of Business FGCU Blvd. South Fort Myers, FL Phone
 Southwest Florida Regional Economic Indicators July 215 Lutgert College Of Business 151 FGCU Blvd. South Fort Myers, FL 33965 Phone 239-59-79 www.fgcu.edu/cob/reri Table of Contents Introduction: Regional
Unemployment Rate Falls to 6.9 Percent in June
 For Immediate Release July 15, 2015 Unemployment Rate Falls to 6.9 Percent in June Carson City, NV Nevada unemployment rate fell to 6.9 percent in June, down from 7 percent in May and 7.8 percent a year
ECONOMIC CURRENTS. Vol. 1, Issue 3 THE SOUTH FLORIDA ECONOMIC QUARTERLY. Introduction. In this Issue:
 ECONOMIC CURRENTS THE SOUTH FLORIDA ECONOMIC QUARTERLY Vol. 1, Issue 3 Introduction Economic Currents provides a comprehensive overview of the South Florida regional economy. The report combines current
THE EMPLOYMENT SITUATION DECEMBER 2018
 Transmission of material in this news release is embargoed until 8:30 a.m. (EST) Friday, January 4, 2019 USDL-19-0002 Technical information: Household data: Establishment data: Media contact: (202) 691-6378
Wisconsin Adds Nearly 10,000 Private-Sector Jobs in November, Unemployment Rate Remains at or Below 3 percent for 10 th Straight Month
 Department of Workforce Development Secretary s Office 201 E. Washington Avenue P.O. Box 7946 Madison, WI 53707 Telephone: (608) 266-3131 Fax: (608) 266-1784 Email: sec@dwd.wisconsin.gov Scott Walker,
Nevada s Unemployment Rate Drops to 9 Percent
 For Immediate Release December 20, 2013 Nevada s Unemployment Rate Drops to 9 Percent Carson City, NV Nevada s unemployment rate fell to 9 percent in November, down from 9.3 percent in October, making
THE EMPLOYMENT SITUATION APRIL 2015
 Transmission of material in this release is embargoed until 8:30 a.m. (EDT) Friday, May 8, USDL-15-0838 Technical information: Household data: Establishment data: Media contact: (202) 691-6378 cpsinfo@bls.gov
Nevada s Unemployment Rate Down to 7.9 Percent in May
 For Immediate Release June 20, 2014 Nevada s Unemployment Rate Down to 7.9 Percent in May Carson City, NV Nevada s unemployment rate fell to a seasonally adjusted 7.9 percent in May, the lowest it has
The Agricultural Workforce
 The Agricultural Workforce in Washington State The Influence of Weather and the Business Cycle Washington State Employment Security Department Karen T. Lee, Commissioner Labor Market and Economic Analysis
LABOR MARKET NEWS MICHIGAN S. The Components of Personal Income in Michigan. Map of the Month: Michigan Median Age by County
 MICHIGAN S LABOR MARKET NEWS VOL. 74, ISSUE NO.11 JANUARY 2019 The Components of Personal Income in Michigan Feature Article pg. 16 Map of the Month: Michigan Median Age by County pg. 15 Data Spotlight:
Nevada s Unemployment Rate Drops to 10.8 Percent
 For Immediate Release December 21, 2012 Nevada s Unemployment Rate Drops to 10.8 Percent Nevada s unemployment rate for November fell to 10.8 percent, the lowest it has been in more than three years. Las
Southwest Florida Regional Economic Indicators. June 2013
 Southwest Florida Regional Economic Indicators June 213 Regional Economic Research Institute Lutgert College Of Business Phone 239-59-7319 Florida Gulf Coast University 151 FGCU Blvd. South Fort Myers,