POPULATION AND ECONOMIC OVERVIEW. State Demography Office Colorado Department of Local Affairs February 2014
|
|
|
- Scarlett Cori Jones
- 5 years ago
- Views:
Transcription

1 POPULATION AND ECONOMIC OVERVIEW State Demography Office Colorado Department of Local Affairs February 2014
2 Big Picture Pop Change US 313 million, million or.7% Colorado 5,189,458, + 70,157 or 1.4%. 9 th ranked in total change. Top 5 total change - TX, CA, FL, GA and NC 7 th ranked in percent change behind ND, DC, TX, WY, UT and NV ,268,367 Ranked 4 th fastest 1.5% - ND, DC, UT 5 th absolute growth 78,909 TX, CA, FL, NC

3
4 Top 5 Counties for Population Growth and Decline Increase Absolute Percentage Largest DENVER 13,702 OURAY 2.5% EL PASO 646,160 ARAPAHOE 10,028 DENVER 2.2% DENVER 634,619 EL PASO 8,858 SAGUACHE 2.1% ARAPAHOE 594,731 ADAMS 7,979 WELD 2.0% JEFFERSON 546,653 JEFFERSON 6,630 DOUGLAS 2.0% ADAMS 459,555 Decline Smallest BENT (536) BENT -8.5% MINERAL 708 CROWLEY (447) CROWLEY -7.7% HINSDALE 788 FREMONT (364) HINSDALE -4.0% JACKSON 1,326 GRAND (362) JACKSON -2.9% KIOWA 1,412 MOFFAT (280) GRAND -2.5% CHEYENNE 1,888 Douglas 298K +, 5,862 Arapahoe 594K Source: State Demography Office
5 Municipal Population Change Largest Increases Largest Declines Denver 13,702 Craig -198 Aurora 6,214 Montrose -98 Colorado Springs 4,827 Burlington -72 Loveland 2,330 La Junta -69 Thornton 2,286 Fort Morgan -61 Lakewood 1,635 Lamar -61 Westminster 1,605 Las Animas -61 Fort Collins 1,594 Canon City -60 Arvada 1,484 Sterling -47 Longmont 1,453 Fraser -44 Source: State Demography Office
6

7 In Migration DENVER 8,694 ARAPAHOE 5,654 JEFFERSON 4,971 LARIMER 3,870 ADAMS 3,806 Out Migration BENT -531 CROWLEY -440 GRAND -428 EAGLE -427 MOFFAT -324
8
9 Source: State Demography Office

10 Source: State Demography Office


11 Colorado is Coming Back Consistent with Prior Recessions, Colorado has entered recessionary conditions earlier and resumed growth ahead of the rest of the nation. State s Major industries (Professional and Business Services, Energy, Tourism) have all been rebounding Housing Market strengthening as job growth gathers pace and unemployment rates recede


12 Only 16 of 50 exceed prerecession peak


13 Initial data from 2013 indicates state reached peak employment June-July 2013


14 Job Growth by Industry Largest gains Health Care & Social Assistance, Accommodation and Food Services, and Professional & Technical Services industries Diverse education, compensation. Across the 69 classifications, all but 19 had positive job growth 22 industries 2012 job total exceeds the peak job number posted in either 2007 or 2008

15 Only 35 of the 64 counties experienced job growth. Front Range accounted for 19 out of every 20 jobs created

16 Only 16 of the 64 counties have exceeded pre-recession peak job totals.
17 2012 Share of Jobs by Industry Sector Name Arapahoe Douglas Colorado Agriculture 0.0% 0.2% 0.6% Mining 0.5% 0.4% 1.3% Utilities 0.1% 0.2% 0.4% Construction 5.0% 6.4% 5.1% Manufacturing 2.7% 2.4% 5.9% Wholesale Trade 4.8% 3.5% 4.0% Retail Trade 10.7% 16.6% 10.8% Transportation & Warehousing 1.1% 0.8% 2.7% Information 6.3% 3.9% 3.0% Finance and Insurance 8.9% 6.3% 4.4% Real Estate and Rental and Leasing 1.9% 1.3% 1.9% Professional and Technical Services 9.4% 10.3% 7.8% Management of Companies 2.5% 2.4% 1.4% Administrative and Waste Services 9.0% 5.8% 6.4% Educational Services 1.3% 1.7% 1.4% Health Care and Social Assistance 11.8% 9.0% 11.0% Arts, Entertainment, and Recreation 1.3% 3.4% 2.1% Accommodation and Food Services 7.8% 10.6% 10.3% Other Services 2.7% 3.2% 3.0% Government 12.3% 11.7% 16.7% Source: Quarterly Census of Employment and Wages 2012, Colorado Department of Labor & Em
18 Forecasts - Trends Growth in both high and low end service Aging More racially/ethnically diverse. Transition Decade Income
19 Economic and Population Forecasts County level revised annually Population change tied to both economic and demographic change. Demographic cohort-survival model = supply of labor provided by existing populations. Economic forecast = demand for labor. Economic Drivers National Forecast Local information openings/closures Differences in labor supply vs. labor demand resolved by the net migration of populations and associated household members

20 Source: State Demography Office

21 Average Annual Job Growth,


22 Douglas County Commuting Arapahoe County

23 Colorado Population by Region Source: State Demography Office, 2013

24 Arapahoe K +276 Douglas K +191
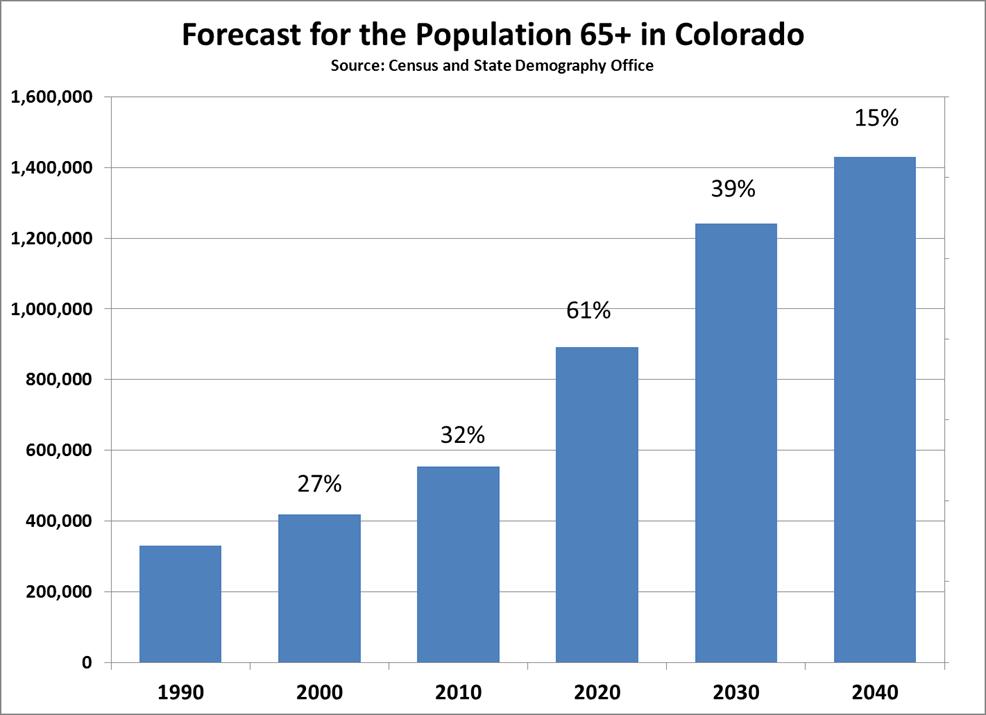
25 Why Are We Getting Old Fast? Currently very few people over the age th lowest share of all states in US (10%) Baby Boomers Born ,340,000 Boomers in Colorado (26% of pop. in 2010) By 2030, Colorado s population 65+ will be 125% larger than it was in 2010 growing from 555,000 to 1,243,000. (just from aging) Transition age distribution from young to more US average between 2010 and Source: Census 2010 and State Demography Office
26

27 Source: State Demography Office


28 Source: State Demography Office
29 Aging Issues Numbers Economic Driver diversity, base Labor Force aging, increase demands, industry Health Services Housing Transportation Public Finance Downward pressure on income, sales and property tax.
30 Source: State Demography Office
31 Aging and Public Finance Ratio of 65+ per year olds in CO Becoming more normal End of the demographic dividend Public Finance change in revenue and expenditures. Income tax downward pressure Sales tax downward pressure Property tax downward pressure Health services increasing Medicaid increasing Transition

32 Real Median Household Income has fallen Colorado 7.6% US - 5.6% Source: American Community Survey

33
34 Household Income.its future could be dim. Age distributions End of Demographic Dividend Occupational Mix high and low service Race/ethnicity of householder + Educational attainment (if historical trends hold) Household type and size single and smaller. Youth un and under employment - Long term permanent impacts on earnings. State Demography Office
35 Long-Term Challenges - Colorado Maintaining Economic and Amenity Advantages Everyone competing for best and brightest. Fostering Health and Diverse Base Industries in otherwise mineral and energy-intensive regions or single industry dominant areas. Growth in high and low skill/wage service jobs bifurcation Disparate growth across state. Coping with opportunities and challenges of an aging population Income downward pressure on per household income. Age Educational attainment potential Long run un and under employment


36 Thank you State Demography Office Department of Local Affairs Elizabeth Garner
Transitions. Population and Economic Trends For Northern Colorado
 Transitions Population and Economic Trends For Northern Colorado EDCC 2017 Elizabeth Garner State Demography Office Colorado Department of Local Affairs Demography.dola.colorado.gov Transitions to Watch
Transitions. Population and Economic Trends for Colorado and Garfield County
 Transitions Population and Economic Trends for Colorado and Garfield County Elizabeth Garner State Demography Office Colorado Department of Local Affairs Summer 2016 www.colorado.gov/demography Main Points
Transitions. Population and Economic Trends for Colorado
 Transitions Population and Economic Trends for Colorado Cindy DeGroen State Demography Office Colorado Department of Local Affairs 2016 www.colorado.gov/demography State Demography Office State agency
Growing Colorado. Population Transitions In Boulder
 Growing Colorado Population Transitions In Boulder Elizabeth Garner State Demography Office Colorado Department of Local Affairs 2018 Demography.dola.colorado.gov Transitions to Watch Disparate growth
Colorado and Eagle County
 Colorado and Eagle County Population and Economic Transitions Vail Symposium 2017 Elizabeth Garner State Demography Office Colorado Department of Local Affairs Demography.dola.colorado.gov Ideas Demographics
NORTH CENTRAL COLORADO
 DOLA Planning and Management Region 2 Socioeconomic Profile Regional Profile NORTH CENTRAL COLORADO The central work of the State Demography Office is the research and production of population data and
Regional Issues Forum Labor Force Trends in Northern Colorado
 Regional Issues Forum Labor Force Trends in Northern Colorado Elizabeth Garner State Demography Office Colorado Department of Local Affairs 2015 www.colorado.gov/demography Big Picture - 2013-2014 Pop
A summary of regional economic indicators for the state of Colorado
 THE ECONOMIC DATABOOK A summary of regional economic indicators for the state of JULY 24, 217 FEDERAL RESERVE BANK of KANSAS CITY SUMMARY OF CURRENT COLORADO ECONOMIC CONDITIONS In, the unemployment rate
ECONOMIC CONTRIBUTIONS OF COLORADO S NONPROFIT SECTOR
 ECONOMIC CONTRIBUTIONS OF COLORADO S NONPROFIT SECTOR E x e c u t i v e S u m m a r y This economic impact study is a component of a larger effort to demonstrate the contributions that the nonprofit sector
FYI For Your Information
 TAXPAYER SERVICE DIVISION FYI For Your Information Research and Development Income Tax Credit for Enterprise Zones Taxpayers who make expenditures on research and experimental activities in an enterprise
Rifle city Demographic and Economic Profile
 Rifle city Demographic and Economic Profile Community Quick Facts Population (2014) 9,289 Population Change 2010 to 2014 156 Place Median HH Income (ACS 10-14) $52,539 State Median HH Income (ACS 10-14)
DEMOGRAPHY AND THE ECONOMY
 DEMOGRAPHY AND THE ECONOMY David Keyser State Demography Office September 22, 2011 Colorado.gov/demography Demography Powerful Big changes often predictable Informative Today Information about us Role
ECONOMIC OUTLOOK GROWING BUT SLOWING. Chris Akers State Demography Office November 4, 2016
 z ECONOMIC OUTLOOK GROWING BUT SLOWING Chris Akers State Demography Office November 4, 2016 OVERVIEW Global Economic Outlook Better in 2017 U.S. Economic Overview Slowing Job Growth Colorado 2015 Economic
Regional Socio-Economic Profile
 Overview The central work of the State Demography Office is the research and production of population data and information and of the forces (fertility, mortality, migration) that lead to population change.
Prepared by Miller & Newberg (MN) Consulting Actuaries
 Consulting Actuaries") Prepared by Miller & Newberg (MN) Consulting Actuaries Project Manager: Michael Brown, FSA, MAAA, Managing Director Gene Blobaum, FSA, MAAA, Senior Actuary Spencer Loudon, Actuarial Analyst Introduction
Prepared by Miller & Newberg (MN) Consulting Actuaries Project Manager: Michael Brown, FSA, MAAA, Managing Director Gene Blobaum, FSA, MAAA, Senior Actuary Spencer Loudon, Actuarial Analyst Introduction
Monte Vista Population, ,744 4,651 4,564 4,467 4,458 4,432 4,451
 1 Monte Vista 4,8 4,7 4,6 4,5 4,4 4,3 4,2 4,1 4,61 4,612 4,61 4,676 Monte Vista, 2-213 4,744 4,651 4,564 4,467 4,458 4,432 4,451 4,418 4,412 4,355 2 21 22 23 24 25 26 27 28 29 21 211 212 213 Year Monte
Drug Felony Filings Continue to Increase in Colorado, Driving Up State Prison Budget
 Special Report January 3, 219 Continue to Increase in Colorado, Driving Up State Prison Budget With prisons nearly full and the Department of Corrections budget closing in on $1 billion, most Coloradans
Medicare Supplement Outline of Coverage
 Medicare Supplement Outline of Coverage Plans A, F, G & N Anthem Blue Cross and Blue Shield Colorado 2017 This booklet includes premium rates, Medicare deductibles, copays and maximum out-of-pocket costs.
Medicare Supplement Outline of Coverage
 OOC_MS_CO-T_NTM_AOOC001M(Rev 7-16)(09-19-2017)-2019rates 9/19/2018 10:52 AM (BASE/ORIG) Medicare Supplement Outline of Coverage Plans A, F, G & N Anthem Blue Cross and Blue Shield Colorado 2019 This booklet
Adams County. Alamosa County. Arapahoe County. Archuleta County 1A 2017 Sales Tax Increase & Debt Increase. Baca County.
 2017 Ballot Issues (Unofficial Results) Spending Waiver Adams Alamosa Arapahoe Archuleta & 1% sales tax increase beginning January 1, 2018 and terminating on December 31, 2032 to pay off sales tax revenue
THE SELF-SUFFICIENCY STANDARD FOR COLORADO Prepared for Colorado Center on Law and Policy
 THE SELF-SUFFICIENCY STANDARD FOR COLORADO 2018 Prepared for Colorado Center on Law and Policy Colorado Center on Law and Policy Colorado s legal aid community created CCLP in 1998, so that people would
Labor Force & Economic Analysis I-70 Corridor
 Labor Force & Economic Analysis I-70 Corridor Prepared by Patrick J. Holwell Arapahoe/Douglas Works! For Don Klemme, Director Arapahoe County Department of Community Resources August 5, 2014 Arapahoe County
INDIVIDUAL SILVER COST-SHARE REDUCTION PLANS. Benefits Summary
 2019 INDIVIDUAL SILVER COST-SHARE REDUCTION PLANS Benefits Summary Friday Health Plans Coverage Map Counties Served by Region Denver Metro Adams Arapahoe Broomfield Boulder Denver Douglas Elbert Jefferson
SMALL GROUP HEALTH PLANS. Benefits Summary
 2019 SMALL GROUP HEALTH PLANS Benefits Summary Friday Health Plans Group Coverage Map Counties Served by Region Denver Metro Adams Arapahoe Broomfield Boulder Denver Douglas Elbert Jefferson Grand Junction
Monthly Rates. Plans A, F, High Deductible Plan F, G & N Effective January 1, 2012
 Administrative Office: PO Box 906, Oxnard, CA 90-906 Toll Free Telephone Number: -877-8-000 Effective January, 0 Premium Information We, Anthem, can only raise your premium if we raise the premium for
ECONOMIC FORECAST BREAKFAST
 ECONOMIC FORECAST BREAKFAST LEADERSHIP IN A STARTUP ECONOMY FRIDAY, JANUARY 15, 2016 www.colorado.edu/leeds/brd CAREER ADVANCING DEGREES FROM LEEDS EVENING MBA PROGRAM FOR WORKING PROFESSIONALS #1 PART-TIME
INDIVIDUAL HEALTH PLANS. Benefits Summary
 2019 INDIVIDUAL HEALTH PLANS Benefits Summary Friday Health Plans Coverage Map Counties Served by Region Denver Metro Adams Arapahoe Broomfield Boulder Denver Douglas Elbert Jefferson Grand Junction Mesa
Fiscal Year Every Student Succeeds Act of 2015
 Fiscal Year 2018-19 Every Succeeds Act of 2015 Title II - A 0010 Adams Mapleton 1 $1,162,304 $192,593 $180,836 $0 $73,604 $0 $1,609,337 0020 Adams Northglenn-Thornton 12 $4,483,355 $858,128 $494,637 $13,946
Please be aware that PMD also has two team members to serve as C-Stat performance resources to the counties.
 County C-Stat Arapahoe County March 2015 Dear Human Services Directors, In an effort to improve our services to you, the CDHS Performance Management Division (PMD) will provide you with the County C-Stat
capturing new and emerging market opportunities Shelley Ervin, CML
 capturing new and emerging market opportunities Shelley Ervin, CML chfa? Why in the world did they have the bond program come talk about new and emerging markets? chfa fact or fiction? first time buyers?
COLORADO PERA ECONOMIC AND FISCAL IMPACTS
 COLORADO PERA ECONOMIC AND FISCAL IMPACTS Knowles Gallery/iStock/Thinkstock Prepared by PACEY ECONOMICS, INC. December 2018 CONTENTS 01 Executive Summary 03 Colorado PERA Background 04 PERA and Perspective
provided to months. or essential not change substantially
 Coloradoo Department of Humann Services Indirect Cost FAQ These answers have been provided to various stakeholders (e.g. counties, Joint Budget Committee, Joint Budget Committee Staff ) over the past few
Will the Recovery Ever End? Boulder Economic Forecast
 Will the Recovery Ever End? Boulder Economic Forecast Place cover image here Richard Wobbekind Senior Economist and Associate Dean for Business and Government Relations January 17, 219 #COBizOutlook Real
Ravenna s most significant growth occurred before Between 1960 and 1980 the city s population declined by 8.5%.
 DRAFT Ravenna Comprehensive Plan Draft May 2008 1 A Profile of Ravenna This section examines demographic trends that will affect Ravenna. The analysis examines population and demographic dynamics, including
San Luis Valley Statistical Profile
 Valley Statistical Profile Revised December 3, 2007 Physical Setting Alamosa Conejos Costilla Mineral Rio Grande Saguache Valley Colorado Land area Total square miles 723 1,287 1,227 876 911 3,168 8,192
The Economic Impact of Department of Defense, Veterans and Military Retirees, and the Department of Veterans Affairs Activities in Colorado
 The Economic Impact of Department of Defense, Veterans and Military Retirees, and the Department of Veterans Affairs Activities in Colorado By Summit Economics, LLC Paul Rochette, Senior Partner, Principle
Colorado Economic Chronicle
 Colorado Economic Chronicle Mike Mauer Chief Economist Kerryn Duran Staff Assistant NATIONAL ECONOMY By Natalie Mullis Inflation-adjusted Gross Domestic Product (GDP) increased at an annualized rate of
Demographic and Economic Profile. Nevada. Updated May 2006
 Demographic and Economic Profile Nevada Updated May 2006 Metro and Nonmetro Counties in Nevada Based on the most recent listing of core based statistical areas by the Office of Management and Budget (December
COLORADO EMPLOYMENT AND WAGES
 COLORADO EMPLOYMENT AND WAGES ANNUAL 2000 STATE OF COLORADO BILL OWENS, GOVERNOR DEPARTMENT OF LABOR & EMPLOYMENT VICKIE ARMSTRONG, EXECUTIVE DIRECTOR DIVISION OF EMPLOYMENT & TRAINING LABOR MARKET INFORMATION
Fiscal Year No Child Left Behind Act of 2001
 Fiscal Year 2014-15 No Child Left Behind Act of 2001 0010 Adams Mapleton 1 $1,213,143 $181,541 $149,680 $0 $0 $1,544,364 0020 Adams Northglenn-Thornton 12 $4,723,447 $712,570 $419,358 $53,501 $0 $5,908,877
Fiscal Year No Child Left Behind Act of 2001
 Fiscal Year 2016-17 No Child Left Behind Act of 2001 0010 Adams Mapleton 1 $1,104,243 $173,136 $163,644 $20,368 $0 $1,461,391 0020 Adams Northglenn-Thornton 12 $4,300,395 $682,600 $469,667 $0 $0 $5,452,662
NCLB Revised Final Allocations Fiscal Year No Child Left Behind Act of 2001
 NCLB Revised Final Allocations Fiscal Year 2016-17 No Child Left Behind Act of 2001 CODE COUNTY RICT TITLE I TITLE II 0010 Adams Mapleton 1 $1,108,927 $173,992 $163,644 $20,368 $0 $1,466,931 0020 Adams
West Central Colorado Service Area
 West Central Colorado Service Area Region 10 Services Regional Development Services Economic Development District/Economic Development Strategy Regional Transit/Transportation Planning Enterprise Zone
COLORADO INDIGENT CARE PROGRAM
 COLORADO INDIGENT CARE PROGRAM FISCAL YEAR 2009 MANUAL SECTION II: DATA COLLECTION EFFECTIVE: JULY 1, 2008 TABLE OF CONTENTS ARTICLE I. PROGRAM OVERVIEW 1 Section 1.01 Program Definition 1 Section 1.02
Structural Financial Task Force Tax Burden Benchmarking
 Structural Financial Task Force Tax Burden Benchmarking Meeting 5 June 17, 2011 DRAFT 1 Executive Summary Given our assumptions, the hypothetical household in Denver at $59,007 faces a: Sales tax burden
2015 Mid-Year Economic Update
 BROOMFIELD Economic Development 2015 Mid-Year Economic Update Provided by: Broomfield Economic Development One Descombes Drive Broomfield, CO 80020 303-464-5579 www.investbroomfield.com Prepared by: Development
Economic Contribution of Off-Highway Vehicle Recreation in Colorado Season. A joint cooperation report
 Recreation in Colorado 2014-2015 Season A joint cooperation report December 6, 2016 Recreation in Colorado Prepared For: Colorado Off-Highway Vehicle Coalition P.O. Box 741353 Arvada, Colorado 80006 Prepared
County Technical Services, Inc County Salary Survey
 County Technical Services, Inc. 2017 County Salary Survey Table of Contents Executive Summary... 1 Unemployment Rate in Colorado Remains Low... 1 The GDP and Non-Farm Payroll Jobs... 1 Labor Force Participation...
Texas Mid-Year Economic Outlook: Strong Growth Continues
 Texas Mid-Year Economic Outlook: Strong Growth Continues Keith Phillips Assistant Vice President and Senior Economist 9/27/18 The views expressed in this presentation are strictly those of the presenter
Will the Recovery Ever End? Certified Financial Planners
 Will the Recovery Ever End? Certified Financial Planners Place cover image here Richard Wobbekind Senior Economist and Associate Dean for Business and Government Relations January 25, 219 Attention: This
Charting a New (Economy) Course
 Course") Charting a New (Economy) Course Metro Denver 2009 Economic Forecast January 2009 Colorado Outperforms the U.S. 2009 forecast values Colorado United States Job losses less severe -0.4% -1.1% Unemployment
Charting a New (Economy) Course Metro Denver 2009 Economic Forecast January 2009 Colorado Outperforms the U.S. 2009 forecast values Colorado United States Job losses less severe -0.4% -1.1% Unemployment
UNIVERSAL MEMBERSHIP AGREEMENT SCHEDULE A THE WORK NUMBER EXPRESS SOCIAL SERVICE FEES AND SERVICE DESCRIPTION
 UNIVERSAL MEMBERSHIP AGREEMENT SCHEDULE A THE WORK NUMBER EXPRESS SOCIAL SERVICE FEES AND SERVICE DESCRIPTION I) USE OF SERVICE: The Work Number is an employment verification service provided by TALX Corporation
General Decision Number: CO /26/2013 CO13. Superseded General Decision Number: CO State: Colorado. Construction Type: Heavy
 General Decision Number: CO130013 07/26/2013 CO13 Superseded General Decision Number: CO20120013 State: Colorado Construction Type: Heavy Counties: Alamosa, Archuleta, Baca, Bent, Chaffee, Cheyenne, Clear
MonthlyEconomicIndicators. MarchUpdate: 2017Benchmark EmploymentRevision. EnergeticBodies.EnergeticMinds. ResearchSponsor.
 MonthlyEconomicIndicators EnergeticBodies.EnergeticMinds. www.metrodenver.org MarchUpdate: 2017Benchmark EmploymentRevision ResearchSponsor www.pinnacol.com www.developmentresearch.net 2016 and 2017 Employment
Nevada County Population Projections 2010 to 2030 October 2010
 Nevada County Projections 2010 to 2030 October 2010 Prepared By: The Nevada State Demographer s Office Jeff Hardcastle, AICP NV State Demographer University of NV Reno MS/032 Reno, NV 89557 (775) 784-6353
BROWARD COUNTY LABOR FORCE
 BROWARD COUNTY LABOR FORCE Broward County s has a workforce of 978,000 people, including 54,000 self-employed. Twenty-three percent of residents commute to a job outside Broward County and five percent
VECTRA BANK 23 RD ANNUAL ECONOMIC FORECAST BREAKFAST START SMART IN 2016! Member FDIC VectraBank.com
 VECTRA BANK 23 RD ANNUAL ECONOMIC FORECAST BREAKFAST START SMART IN 2016! Member FDIC VectraBank.com Economic Presentation April 26, 2016 Tatiana Bailey, Ph.D. Director, UCCS Economic Forum A Little Humor
CHAPTER 2: SOCIO-ECONOMIC PROFILE
 2040 Regional Transit Element CHAPTER 2: SOCIO-ECONOMIC PROFILE STUDY AREA The study area for this 2040 RTE is the NFRMPO region, also designated by the Colorado Department of Transportation (CDOT) as
A summary of economic events, data, and trends published by the Community Research Institute. The Workforce Without the Baby Boomers
 Allen County Insight A summary of economic events, data, and trends published by the October 2014 On the web: www.ipfw.edu/cri In this Issue Focus on... Baby Boomers and Labor Force Also... Employment
AGENDA ITEM #5. CITY COUNCIL COMMUNICATION FORM
 AGENDA ITEM #5. CITY COUNCIL COMMUNICATION FORM FROM: THROUGH: Kim Weber, Finance Director Gary Suiter, City Manager DATE: March 13, 2018 ITEM: Fiscal Sustainability Revenue Diversification. X DIRECTION
More of the Same? Southwest Business Forum
 More of the Same? Southwest Business Forum Place cover image here Richard Wobbekind Senior Associate Dean, Leeds School of Business Executive Director, Business Research Division January 4, 2017 Colorado
Region VIII Applications of Nationwide HAZUS Flood and Earthquake Modeling-Multi
 Region VIII Mitigation GIS Region VIII Applications of Nationwide HAZUS Flood and Earthquake Modeling-Multi Multi- Hazard Vulnerability Index 22 May 2009, EF-3 Tornado Forms in Northern Colorado http://www.allamericanpatriots.com/48747834_colorado-gov-ritter-issues-formal-disaster-declara
TREASURER & PUBLIC TRUSTEE QUADRENNIAL. February 14, 15, 16, 2011
 TREASURER & PUBLIC TRUSTEE QUADRENNIAL February 14, 15, 16, 2011 2011 CCTA/CTPA Quadrennial February 14, 15 and 16 Southwest Weld Office 4209 WCR 24 ½, Longmont Hosted by Weld County Treasurer s Office
CURRENT DEMOGRAPHICS & CONTEXT GROWTH FORECAST SOUTHERN CALIFORNIA ASSOCIATION OF GOVERNMENTS APPENDIX
 CURRENT DEMOGRAPHICS & CONTEXT GROWTH FORECAST SOUTHERN CALIFORNIA ASSOCIATION OF GOVERNMENTS APPENDIX PROPOSED FINAL MARCH 2016 INTRODUCTION 1 FORECASTING PROCESS 1 GROWTH TRENDS 2 REGIONAL GROWTH FORECAST
Acknowledgments. Special thanks to public- and private-sector financial contributors: Arapahoe County. City of Arvada.
 Acknowledgments Preparation of this report has been financed in part through grants from the U.S. Department of Transportation, Federal Transit Administration and Federal Highway Administration. Special
City of Edmonton Population Change by Age,
 Population Change by Age, 1996-2001 2001 Edmonton Demographic Profile The City of Edmonton s 2001population increased by 49,800 since the 1996 census. Migration figures are not available at the municipal
2017 Economic Forecast
 2017 Economic Forecast Mid-Year Update Greater Kansas City Chamber of Commerce June 29, 2017 We ve come a long way but the pace of job recovery seems to be gradually downshifting This is even more true
National & Colorado. Economic Update. Alison Felix Economist & Branch Executive Federal Reserve Bank of Kansas City Denver Branch
 National & Colorado Economic Update Alison Felix Economist & Branch Executive Federal Reserve Bank of Kansas City Denver Branch The views expressed are those of the presenter and do not necessarily reflect
Economic Activity Report. October 2016
 Economic Activity Report October 2016 The current economic activity report for Commerce City economy reported mixed trends across many indicators. The employment situation improved, with overall employment
ECONOMIC SUMMARY: NATIONAL, STATE AND LOCAL TRENDS
 ECONOMIC SUMMARY: NATIONAL, STATE AND LOCAL TRENDS This report is an overview of economic conditions for the United States, the State of Florida, the Tampa Metropolitan Statistical Area and Hillsborough
E APPENDIX METHODOLOGY FOR LAND USE PROJECTIONS IN THE BOSTON REGION INTRODUCTION
 E APPENDIX METHODOLOGY FOR LAND USE PROJECTIONS IN THE BOSTON REGION INTRODUCTION The Metropolitan Area Planning Council (MAPC), the region s land use planning agency, is responsible for preparing detailed
Overlooked & Undercounted 2018 Struggling to Make Ends Meet in Colorado
 Overlooked & Undercounted 2018 Struggling to Make Ends Meet in Colorado Prepared for Colorado Center on Law and Policy Colorado Center on Law and Policy Colorado s legal aid community created CCLP in 1998,
Utah. Demographic and Economic Profile. Metro and Nonmetro Counties in Utah
 Demographic and Economic Profile Utah Updated July 2006 Metro and Nonmetro Counties in Utah Based on the most recent listing of core based statistical areas by the Office of Management and Budget (December
THE COST OF CARE: CAN COLORADANS AFFORD HEALTH CARE
 THE COST OF CARE: CAN COLORADANS AFFORD HEALTH CARE Presented to the Interim Health Care Committee August 31, 2009 1 Contact: Elisabeth Arenales, Esq. Health Care Program Director, Colorado Center on Law
A LOOK AT CONNECTICUT S OLDER WORKERS
 BY NICHOLAS A. JOLLY, ECONOMIST, DOL H IGHLIGHTS AGING OF THE POPULATION The number of Connecticut residents who are 65 and older is projected to increase by 72% between 2005 and 2030, whereas those from
Minnesota Energy Industry
 Energy Industry Jobs Q3 2000 Q3 2001 Q3 2002 Q3 2003 Q3 2004 Q3 2005 Q3 2006 Q3 2007 Q3 2008 Q3 2009 Q3 2010 Q3 2011 Q3 Q3 Q3 Q3 Q3 2016 Minnesota Energy Consortium April 13, 2017 Cameron Macht DEED Labor
LABOUR MARKET DEVELOPMENTS IN MALTA: A LOOK BACK, AND FORWARD. April 2016 Ministry for Finance
 LABOUR MARKET DEVELOPMENTS IN MALTA: A LOOK BACK, AND FORWARD April 2016 Godwin Mifsud Economic Policy Department Ministry for Finance Outline Review of Key Indicators The story behind the numbers Disaggregating
Labor Force/Employment U.S. Non-Farm Job Openings
 Jun7 Feb8 Oct8 Jun9 May6 May8 May1 May12 Number of People Feb1 Oct1 Jun11 Feb12 Jan8 Sep8 Jan1 Sep1 Jan12 Sep12 Jan14 Percentage Jan8 Sep8 Jan1 Sep1 Jan12 Sep12 Jan14 Job Openings ('s) The Big Picture
American Community Survey 5-Year Estimates
 DP03 SELECTED ECONOMIC CHARACTERISTICS 2013-2017 American Community Survey 5-Year Estimates Supporting documentation on code lists, subject definitions, data accuracy, and statistical testing can be found
Tell us what you think. Provide feedback to help make American Community Survey data more useful for you.
 DP03 SELECTED ECONOMIC CHARACTERISTICS 2016 American Community Survey 1-Year Estimates Supporting documentation on code lists, subject definitions, data accuracy, and statistical testing can be found on
Sussex Demographic and Labor Market Trends
 Sussex Demographic and Labor Market Trends Ed Simon (302) 672-6845 edward.simon@state.de.us October 2012 Introduction Statistical Update Economic and labor market update for 2012 Is Sussex doing better?
ESSA NCLB Variance
 Variance 2016-17 Attached is an illustration for discussion purposes of allocations under No Child Left Behind () and Every Student Succeeds Act (). The attached illustration compares 2016-17 and allocations
American Community Survey 5-Year Estimates
 DP03 SELECTED ECONOMIC CHARACTERISTICS 2012-2016 American Community Survey 5-Year Estimates Supporting documentation on code lists, subject definitions, data accuracy, and statistical testing can be found
American Community Survey 5-Year Estimates
 DP03 SELECTED ECONOMIC CHARACTERISTICS 2012-2016 American Community Survey 5-Year Estimates Supporting documentation on code lists, subject definitions, data accuracy, and statistical testing can be found
American Community Survey 5-Year Estimates
 DP03 SELECTED ECONOMIC CHARACTERISTICS 2012-2016 American Community Survey 5-Year Estimates Supporting documentation on code lists, subject definitions, data accuracy, and statistical testing can be found
American Community Survey 5-Year Estimates
 DP03 SELECTED ECONOMIC CHARACTERISTICS 2012-2016 American Community Survey 5-Year Estimates Supporting documentation on code lists, subject definitions, data accuracy, and statistical testing can be found
American Community Survey 5-Year Estimates
 DP03 SELECTED ECONOMIC CHARACTERISTICS 2012-2016 American Community Survey 5-Year Estimates Supporting documentation on code lists, subject definitions, data accuracy, and statistical testing can be found
American Community Survey 5-Year Estimates
 DP03 SELECTED ECONOMIC CHARACTERISTICS 2012-2016 American Community Survey 5-Year Estimates Supporting documentation on code lists, subject definitions, data accuracy, and statistical testing can be found
American Community Survey 5-Year Estimates
 DP03 SELECTED ECONOMIC CHARACTERISTICS 2012-2016 American Community Survey 5-Year Estimates Supporting documentation on code lists, subject definitions, data accuracy, and statistical testing can be found
American Community Survey 5-Year Estimates
 DP03 SELECTED ECONOMIC CHARACTERISTICS 2012-2016 American Community Survey 5-Year Estimates Supporting documentation on code lists, subject definitions, data accuracy, and statistical testing can be found
American Community Survey 5-Year Estimates
 DP03 SELECTED ECONOMIC CHARACTERISTICS 2012-2016 American Community Survey 5-Year Estimates Supporting documentation on code lists, subject definitions, data accuracy, and statistical testing can be found
American Community Survey 5-Year Estimates
 DP03 SELECTED ECONOMIC CHARACTERISTICS 2012-2016 American Community Survey 5-Year Estimates Supporting documentation on code lists, subject definitions, data accuracy, and statistical testing can be found
American Community Survey 5-Year Estimates
 DP03 SELECTED ECONOMIC CHARACTERISTICS 2012-2016 American Community Survey 5-Year Estimates Supporting documentation on code lists, subject definitions, data accuracy, and statistical testing can be found
American Community Survey 5-Year Estimates
 DP03 SELECTED ECONOMIC CHARACTERISTICS 2012-2016 American Community Survey 5-Year Estimates Supporting documentation on code lists, subject definitions, data accuracy, and statistical testing can be found
American Community Survey 5-Year Estimates
 DP03 SELECTED ECONOMIC CHARACTERISTICS 2012-2016 American Community Survey 5-Year Estimates Supporting documentation on code lists, subject definitions, data accuracy, and statistical testing can be found
American Community Survey 5-Year Estimates
 DP03 SELECTED ECONOMIC CHARACTERISTICS 2012-2016 American Community Survey 5-Year Estimates Supporting documentation on code lists, subject definitions, data accuracy, and statistical testing can be found
American Community Survey 5-Year Estimates
 DP03 SELECTED ECONOMIC CHARACTERISTICS 2012-2016 American Community Survey 5-Year Estimates Supporting documentation on code lists, subject definitions, data accuracy, and statistical testing can be found
American Community Survey 5-Year Estimates
 DP03 SELECTED ECONOMIC CHARACTERISTICS 2012-2016 American Community Survey 5-Year Estimates Supporting documentation on code lists, subject definitions, data accuracy, and statistical testing can be found
American Community Survey 5-Year Estimates
 DP03 SELECTED ECONOMIC CHARACTERISTICS 2012-2016 American Community Survey 5-Year Estimates Supporting documentation on code lists, subject definitions, data accuracy, and statistical testing can be found
American Community Survey 5-Year Estimates
 DP03 SELECTED ECONOMIC CHARACTERISTICS 2012-2016 American Community Survey 5-Year Estimates Supporting documentation on code lists, subject definitions, data accuracy, and statistical testing can be found