Transitions. Population and Economic Trends for Colorado
|
|
|
- Rose George
- 6 years ago
- Views:
Transcription
1 Transitions Population and Economic Trends for Colorado Cindy DeGroen State Demography Office Colorado Department of Local Affairs
2 State Demography Office State agency Responsible for population data needed by state agencies Department of Local Affairs Prepare data and information in ways that account for local perspectives, needs Public information Make data and information readily available to the public, including citizens, businesses and non-profit agencies Outreach Work with local governments and others to understand what the numbers are saying
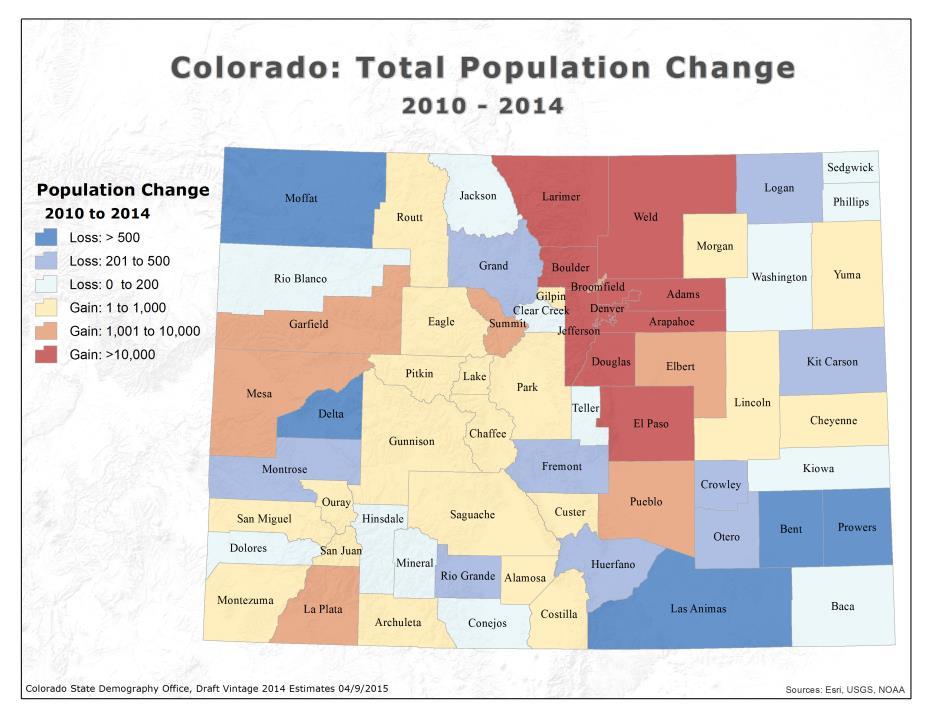
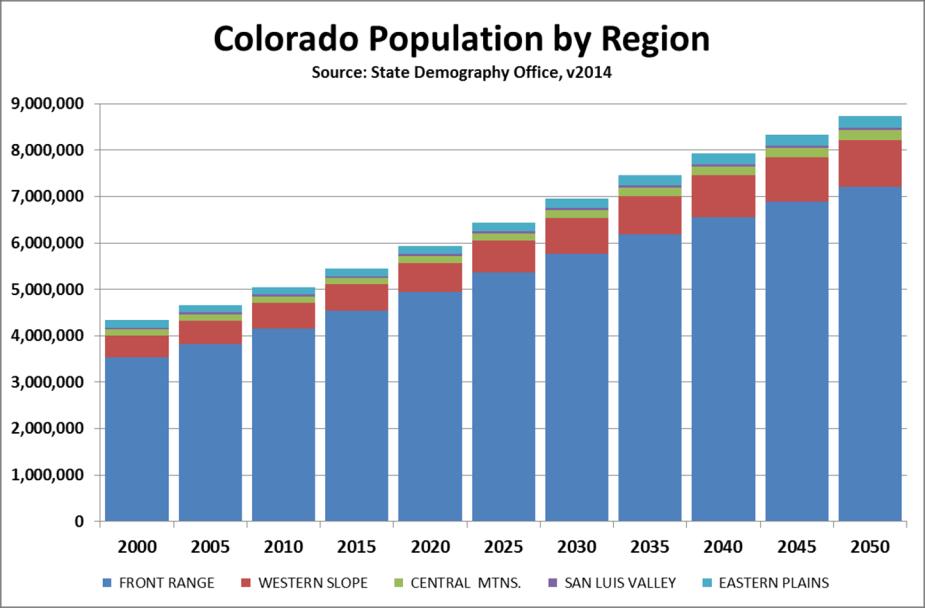
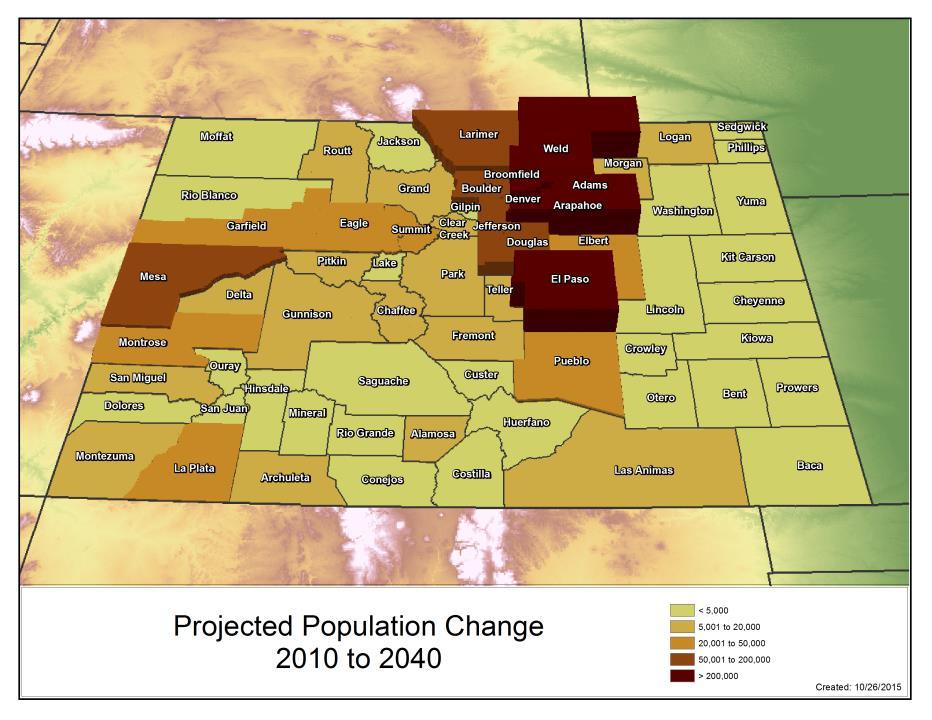
3 Main Points Migration how much, where Growth disparate across the state Ethnic/race diversity increasing and aging into labor force. Aging we are getting old fast, labor force, income, industrial mix
4 Big Picture Pop Change US million, million or.8% Colorado - 5,456,500 Ranked 2 nd fastest 1.9% - ND 7 th absolute growth 101,000 TX, FL, CA, GA,WA, NC Range in Colorado +15,000 to % to -3.5%
5
6
7
8
9

10 State Demography Office v2014
11
12 State Demography Office
13
14 Forecast
15 Population forecast methodology Economic forecast Cohort-component Jobs - 2 nd & 3 rd job - Commuters +Births - Deaths + Net Migration X LFPR Labor Demand Labor Supply Differences resolved by net migration
16
17
18 Factors Growing Forward? Current Conditions as a base. National/International Conditions Build Out Cost of Living Competition with lower cost states. Water

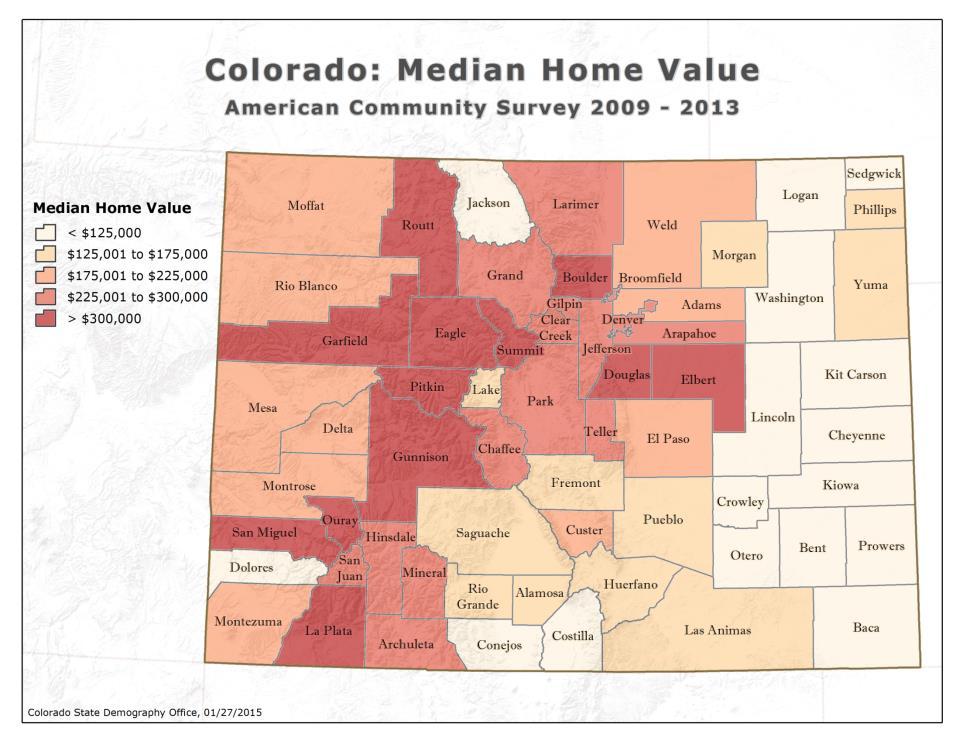
19 Median Home Value
20
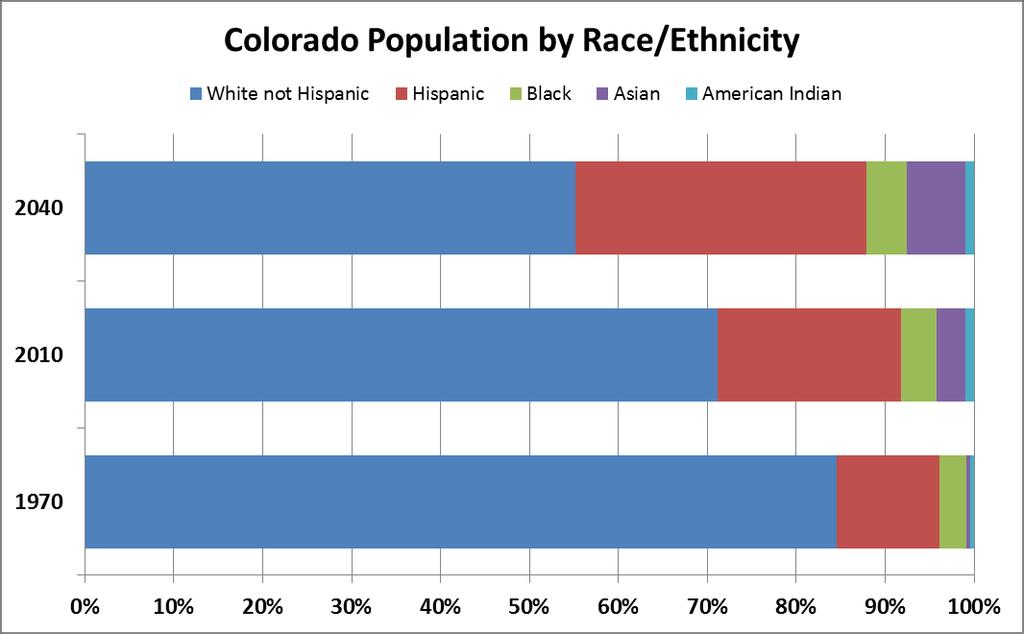
21 Increasing Diversity
22

23 Census Bureau
24 Share of Net Increase in Working Age Population, American Indian, NH Black, NH White, NH Asian, NH Hispanic 0% 20% 40% 60% 80%
25 Age
26
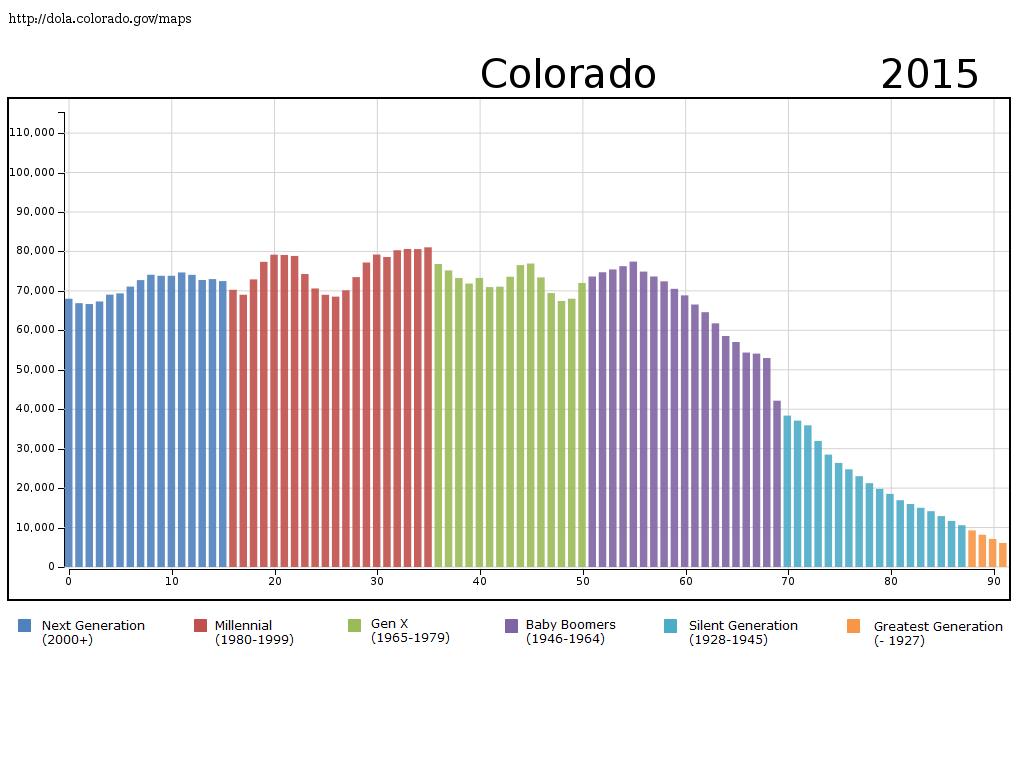
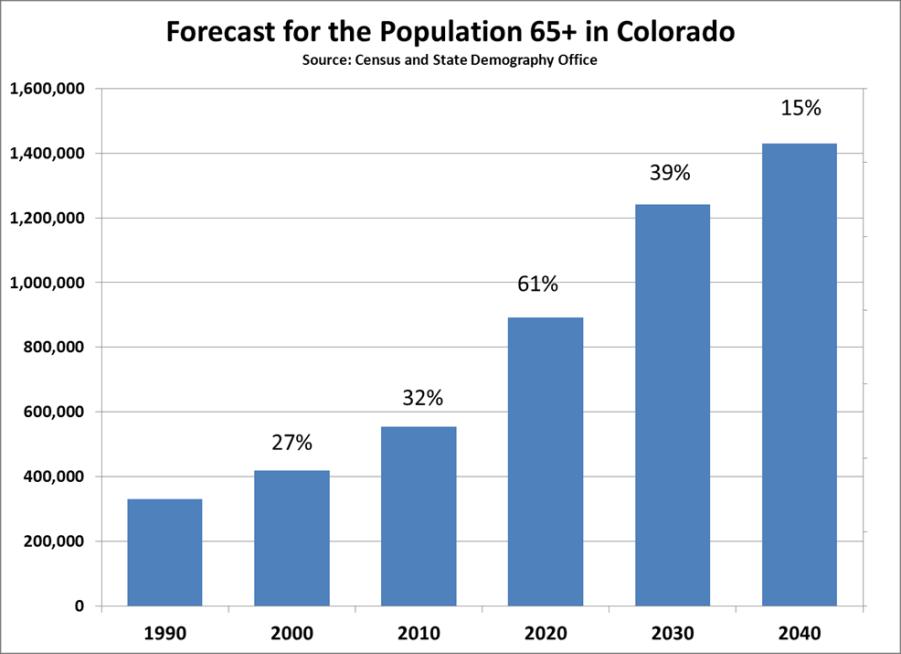
27 Why Are We Getting Old Fast? Currently very few people over the age th lowest share of all states in US (10%) Baby Boomers Born ,340,000 Boomers in Colorado (26% of pop. in 2010) By 2030, Colorado s population 65+ will be 125% larger than it was in 2010 growing from 555,000 to 1,243,000. (just from aging) Transition age distribution from young to more US average between 2010 and State Demography Office, Census Bureau

28 Growth in young adults due to migration Demographic Dividend AGE
29
30 Aging Issues Numbers Economic Driver - wealthier. depends Impact on occupational mix Labor Force Housing Income Downward Pressure Health Disabilities Transportation Public Finance Downward Pressure
31 Aging and Public Finance Ratio of 65+ per year olds in CO Becoming more normal End of the demographic dividend Public Finance change in revenue and expenditures. Income tax downward pressure Sales tax downward pressure Property tax downward pressure Health services increasing Medicaid increasing Transition
32 Income
33 Household Income.its future is demographically challenged. Age distributions End of Demographic Dividend Occupational Mix high and low service More race/ethnicity diverse especially at young end but achievement gap is growing as well. Household type and size single and smaller. Youth un and under employment - Long term permanent impacts on earnings. State Demography Office

34 Census Bureau and Incomes-by-Age-Brackets.php
35 To Ponder in My Community Income Challenges how could downward pressure impact our community? Migration how much, where, and can we compete for the best and the brightest? Aging we are getting old fast, is my community ready for the changes to the labor force, income, industrial mix, housing, etc. Growth disparate across the state, what is causing it and what can be done? Ethnic/race diversity increasing and aging into labor force. Educational attainment gap continues putting downward pressure on income. What is being done?
36 Thank you State Demography Office Department of Local Affairs Cindy DeGroen
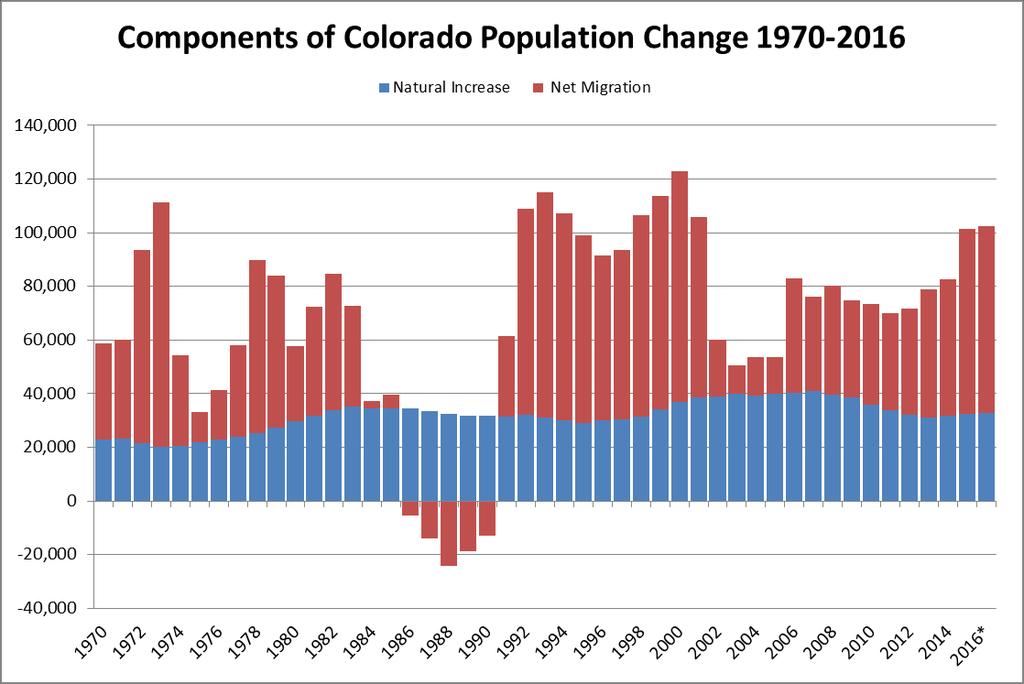
: 5.2% 20 Year (1988, 92, 93, 95): 14.3% Migration most variable component.")
37 Historical projections Most state & local population projections have a Mean Average Percent Error (MAPE) of 6-7% for 10 year projections and 11-15% for 20 years 1. Demography Office MAPES 10 Year ( ): 5.2% 20 Year (1988, 92, 93, 95): 14.3% Migration most variable component. 1 "State and Local Population Projections" Smith, Tayman, and Swanson.
Transitions. Population and Economic Trends for Colorado and Garfield County
 Transitions Population and Economic Trends for Colorado and Garfield County Elizabeth Garner State Demography Office Colorado Department of Local Affairs Summer 2016 www.colorado.gov/demography Main Points
Transitions. Population and Economic Trends For Northern Colorado
 Transitions Population and Economic Trends For Northern Colorado EDCC 2017 Elizabeth Garner State Demography Office Colorado Department of Local Affairs Demography.dola.colorado.gov Transitions to Watch
Colorado and Eagle County
 Colorado and Eagle County Population and Economic Transitions Vail Symposium 2017 Elizabeth Garner State Demography Office Colorado Department of Local Affairs Demography.dola.colorado.gov Ideas Demographics
Growing Colorado. Population Transitions In Boulder
 Growing Colorado Population Transitions In Boulder Elizabeth Garner State Demography Office Colorado Department of Local Affairs 2018 Demography.dola.colorado.gov Transitions to Watch Disparate growth
Regional Issues Forum Labor Force Trends in Northern Colorado
 Regional Issues Forum Labor Force Trends in Northern Colorado Elizabeth Garner State Demography Office Colorado Department of Local Affairs 2015 www.colorado.gov/demography Big Picture - 2013-2014 Pop
POPULATION AND ECONOMIC OVERVIEW. State Demography Office Colorado Department of Local Affairs February 2014
 POPULATION AND ECONOMIC OVERVIEW State Demography Office Colorado Department of Local Affairs February 2014 Big Picture 2011-2012 Pop Change US 313 million, + 2.3 million or.7% Colorado 5,189,458, + 70,157
DEMOGRAPHY AND THE ECONOMY
 DEMOGRAPHY AND THE ECONOMY David Keyser State Demography Office September 22, 2011 Colorado.gov/demography Demography Powerful Big changes often predictable Informative Today Information about us Role
Rifle city Demographic and Economic Profile
 Rifle city Demographic and Economic Profile Community Quick Facts Population (2014) 9,289 Population Change 2010 to 2014 156 Place Median HH Income (ACS 10-14) $52,539 State Median HH Income (ACS 10-14)
How Economic Security Changes during Retirement
 How Economic Security Changes during Retirement Barbara A. Butrica March 2007 The Retirement Project Discussion Paper 07-02 How Economic Security Changes during Retirement Barbara A. Butrica March 2007
Metro Houston Population Forecast
 Metro Houston Population Forecast Projections to 2050 Prepared by the Greater Houston Partnership Research Department Data from Texas Demographic Center www.houston.org April 2017 Greater Houston Partnership
Utah s Long Run Demographic Trends: Evolving Community Contexts
 Utah s Long Run Demographic Trends: Evolving Community Contexts Pamela S. Perlich, Ph.D. Director, Demographic Research Kem C. Gardner Policy Institute, University of Utah GROWTH Intermountain States Population:
From Crisis to Transition Demographic trends and American housing futures, with lessons from Texas
 From Crisis to Transition Demographic trends and American housing futures, with lessons from Texas Rolf Pendall, Ph.D. The Urban Institute Presentation to the Bipartisan Housing Commission, San Antonio,
TABLE OF CONTENTS INTRODUCTION... 1
 TABLE OF CONTENTS INTRODUCTION... GENERAL WORKFORCE TRENDS... 3 General Workforce Trends and Comparisons Overview... 5 State Government Employees to State Population... 6 State Government Full-Time Equivalent
Monte Vista Population, ,744 4,651 4,564 4,467 4,458 4,432 4,451
 1 Monte Vista 4,8 4,7 4,6 4,5 4,4 4,3 4,2 4,1 4,61 4,612 4,61 4,676 Monte Vista, 2-213 4,744 4,651 4,564 4,467 4,458 4,432 4,451 4,418 4,412 4,355 2 21 22 23 24 25 26 27 28 29 21 211 212 213 Year Monte
TABLE OF CONTENTS INTRODUCTION... 1
 TABLE OF CONTENTS INTRODUCTION... GENERAL WORKFORCE TRENDS... 3 General Workforce Trends and Comparisons Overview... 5 State Government Employees to State Population... 6 State Government Full-Time Equivalent
Regional Socio-Economic Profile
 Overview The central work of the State Demography Office is the research and production of population data and information and of the forces (fertility, mortality, migration) that lead to population change.
Census Data on Health Insurance Coverage of Women and Children. Highlights of National Data for 2009
 March of Dimes Foundation Office of Government Affairs 1401 K Street, NW, Suite 900 Washington, DC 20005 Telephone (202) 659-1800 Fax (202) 296-2964 marchofdimes.com nacersano.org Census Data on Health
CURRENT DEMOGRAPHICS & CONTEXT GROWTH FORECAST SOUTHERN CALIFORNIA ASSOCIATION OF GOVERNMENTS APPENDIX
 CURRENT DEMOGRAPHICS & CONTEXT GROWTH FORECAST SOUTHERN CALIFORNIA ASSOCIATION OF GOVERNMENTS APPENDIX PROPOSED FINAL MARCH 2016 INTRODUCTION 1 FORECASTING PROCESS 1 GROWTH TRENDS 2 REGIONAL GROWTH FORECAST
Regional Data Snapshot
 Regional Data Snapshot Population, Economy & Education Features SET Civic Forum Forest Country Region (FCR), Texas Table of Contents 01 Overview 03 Human Capital 02 Demography 04 Labor Force 01 overview
TABLE OF CONTENTS INTRODUCTION... 1
 TABLE OF CONTENTS INTRODUCTION... GENERAL WORKFORCE TRENDS... 3 General Workforce Trends and Comparisons Overview... 5 State Government Employees to State Population... 6 State Government Full-Time Equivalent
Regional Data Snapshot
 Regional Data Snapshot Population, Economy & Education Features SET Civic Forum Ozark Foothills Region, Missouri Table of Contents 01 Overview 03 Human Capital 02 Demography 04 Labor Force 01 overview
TABLE OF CONTENTS INTRODUCTION... 1
 TABLE OF CONTENTS INTRODUCTION... GENERAL WORKFORCE TRENDS... 3 General Workforce Trends and Comparisons Overview... 5 State Government Employees to State Population... 6 State Government Full-Time Equivalent
Independence, MO Data Profile 2015
 , MO Data Profile 2015 5 year American Community Survey (ACS) Jackson County, Missouri Data sources: U.S. Census Bureau, American Community Survey (ACS), 2011 2015 (released December 8, 2016), compared
The Health of Jefferson County: 2010 Demographic Update
 The Health of : 2010 Demographic Update BACKGROUND How people live the sociodemographic context of their lives influences their health. People who have lower incomes may not have the resources to meet
Oregon Population Forecast Program Regional Forecast Meeting - September 23, 2014
 Oregon Population Forecast Program Regional Forecast Meeting - September 23, 2014 Presentation by Population Forecast Program Team CURRY COUNTY Oregon Population Forecast Program Project Team Xiaomin Ruan,
NORTH CENTRAL COLORADO
 DOLA Planning and Management Region 2 Socioeconomic Profile Regional Profile NORTH CENTRAL COLORADO The central work of the State Demography Office is the research and production of population data and
The Affordable Care Act (ACA)
") The Affordable Care Act (ACA) An Overview by the Kaiser Family Foundation NBC News Editorial Roundtable June 26, 2013 1. The Basics of the Affordable Care Act (ACA) Expanded Medicaid Coverage Starting
The Affordable Care Act (ACA) An Overview by the Kaiser Family Foundation NBC News Editorial Roundtable June 26, 2013 1. The Basics of the Affordable Care Act (ACA) Expanded Medicaid Coverage Starting
A Summary of The Texas Challenge in the Twenty- First Century: Implications of Population Change for the Future of Texas
 A Summary of The Texas Challenge in the Twenty- First Century: Implications of Population Change for the Future of Texas The Center for Demographic and Socioeconomic Research and Education by Steve H.
Population & Demographic Analysis
 Population & Demographic Analysis The United States Census Bureau conducts a nationwide census every ten years. This census compiles information relating to the socio-economic characteristics of the entire
THE HOME BUYERS OF TOMORROW. September 8, 2016 Azad Amir-Ghassemi Research Analyst
 THE HOME BUYERS OF TOMORROW September 8, 2016 Azad Amir-Ghassemi Research Analyst METHODOLOGY Online Only Survey conducted from January 2016- February 2016 1871 respondents: 633 Emerging Millennials (18-25);
Demographic Drivers. Joint Center for Housing Studies of Harvard University 11
 3 Demographic Drivers Household formations were already on the decline when the recession started to hit in December 27. Annual net additions fell from 1.37 million in the first half of the decade to only
The Uninsured at the Starting Line in California: California findings from the 2013 Kaiser Survey of Low-Income Americans and the ACA
 The Uninsured at the Starting Line in California: California findings from the 2013 Kaiser Survey of Low-Income Americans and the ACA Rachel Garfield Kaiser Family Foundation February 19, 2014 Figure 1
Population and Labor Force Projections for New Jersey: 2008 to 2028
 Population and Labor Force Projections for New Jersey: 2008 to 2028 by Sen-Yuan Wu, Division of Labor Market and Demographic Research Similar to other northern states, New Jersey has had slower population
Toshiko Kaneda, PhD Population Reference Bureau (PRB) James Kirby, PhD Agency for Healthcare Research and Quality (AHRQ)
 James Kirby, PhD Agency for Healthcare Research and Quality (AHRQ)") Disparities in Health Care Spending among Older Adults: Trends in Total and Out-of-Pocket Health Expenditures by Sex, Race/Ethnicity, and Income between 1996 and 21 Toshiko Kaneda, PhD Population Reference
Disparities in Health Care Spending among Older Adults: Trends in Total and Out-of-Pocket Health Expenditures by Sex, Race/Ethnicity, and Income between 1996 and 21 Toshiko Kaneda, PhD Population Reference
Tyler Area Economic Overview
 Tyler Area Economic Overview Demographic Profile. 2 Unemployment Rate. 4 Wage Trends. 4 Cost of Living Index...... 5 Industry Clusters. 5 Occupation Snapshot. 6 Education Levels 7 Gross Domestic Product
TECHNICAL REPORT NO. 11 (5 TH EDITION) THE POPULATION OF SOUTHEASTERN WISCONSIN PRELIMINARY DRAFT SOUTHEASTERN WISCONSIN REGIONAL PLANNING COMMISSION
 THE POPULATION OF SOUTHEASTERN WISCONSIN PRELIMINARY DRAFT SOUTHEASTERN WISCONSIN REGIONAL PLANNING COMMISSION") TECHNICAL REPORT NO. 11 (5 TH EDITION) THE POPULATION OF SOUTHEASTERN WISCONSIN PRELIMINARY DRAFT 208903 SOUTHEASTERN WISCONSIN REGIONAL PLANNING COMMISSION KRY/WJS/lgh 12/17/12 203905 SEWRPC Technical
TECHNICAL REPORT NO. 11 (5 TH EDITION) THE POPULATION OF SOUTHEASTERN WISCONSIN PRELIMINARY DRAFT 208903 SOUTHEASTERN WISCONSIN REGIONAL PLANNING COMMISSION KRY/WJS/lgh 12/17/12 203905 SEWRPC Technical
UNEMPLOYMENT RATES IMPROVING IN THE DISTRICT By Caitlin Biegler
 An Affiliate of the Center on Budget and Policy Priorities 820 First Street NE, Suite 460 Washington, DC 20002 (202) 408-1080 Fax (202) 408-8173 www.dcfpi.org UNEMPLOYMENT RATES IMPROVING IN THE DISTRICT
Evaluating the BLS Labor Force projections to 2000
 Evaluating the BLS Labor Force projections to 2000 Howard N Fullerton Jr. Bureau of Labor Statistics, Office of Occupational Statistics and Employment Projections Washington, DC 20212-0001 KEY WORDS: Population
High LTV Lending Conference
 High LTV Lending Conference Eric Belsky May 213 Chapel Hill, NC Homeownership Has Mattered Profoundly to Wealth Accumulation Even After Crude Control for Income 12 Median Net Worth of Middle Income Quintile
Mike Alexander, AICP Research and Analytics Division Manager Atlanta Regional Commission
 Making the Case: THE NEW ECONOMY of an Aging Population in Metropolitan Atlanta Mike Alexander, AICP Research and Analytics Division Manager Atlanta Regional Commission malexander@atlantaregional.com For
2. Demographics. Population and Households
 2. Demographics This analysis describes the existing demographics in. It will be used to identify the major demographic trends that may have an effect on public policy in in the next decade. Demographic
While one in five Californians overall is uninsured, the rate among those who work is even higher: one in four.
 : By the Numbers December 2013 Introduction California had the greatest number of uninsured residents of any state, 7 million, and the seventh largest percentage of uninsured residents under 65 in the
Advancing Health Equity and Inclusive Growth in the Sacramento Region: Narrative and Data for an Equity Policy Agenda
 Advancing Health Equity and Inclusive Growth in the Sacramento Region: Narrative and Data for an Equity Policy Agenda Equity is the Superior Growth Model Racial inequities hinder economic prosperity Sacramento
Minnesota Energy Industry
 Energy Industry Jobs Q3 2000 Q3 2001 Q3 2002 Q3 2003 Q3 2004 Q3 2005 Q3 2006 Q3 2007 Q3 2008 Q3 2009 Q3 2010 Q3 2011 Q3 Q3 Q3 Q3 Q3 2016 Minnesota Energy Consortium April 13, 2017 Cameron Macht DEED Labor
FUTURE LANDSCAPES. The effects of changing demographics. Background. Future landscapes: The effects of changing demographics February, 2007
 FUTURE LANDSCAPES The effects of changing demographics Background DRCOG Board Retreat 1 Our region is changing Demographic facts: Rapid growth of the older population Increasing immigration Flexible, creative
Clay County Comprehensive Plan
 2011-2021 Clay County Comprehensive Plan Chapter 1: Demographic Overview Clay County Comprehensive Plan Demographic Overview Population Trends This section examines historic and current population trends
Minnesota s Economics & Demographics Looking To 2030 & Beyond. Tom Stinson, State Economist Tom Gillaspy, State Demographer July 2008
 Minnesota s Economics & Demographics Looking To 2030 & Beyond Tom Stinson, State Economist Tom Gillaspy, State Demographer July 2008 Minnesota Has Been Very Successful (Especially For A Cold Weather State
Poverty and the Safety Net After the Great Recession
 Poverty and the Safety Net After the Great Recession Deep Issues of the 2012 Elections: Equality, Liberty and Democracy, Cornell University Hilary Hoynes University of California, Davis November 2012 In
2000s, a trend. rates and with. workforce participation as. followed. 2015, 50 th
 Labor Force Participat tion Trends in Michigan and the United States Executive Summary Labor force participation rates in the United States have been on the gradual decline since peaking in the early 2000s,
The Relationship Between Income and Health Insurance, p. 2 Retirement Annuity and Employment-Based Pension Income, p. 7
 E B R I Notes E M P L O Y E E B E N E F I T R E S E A R C H I N S T I T U T E February 2005, Vol. 26, No. 2 The Relationship Between Income and Health Insurance, p. 2 Retirement Annuity and Employment-Based
Fact Sheet. Health Insurance Coverage in Minnesota, 2001 vs February Changes in Health Insurance Coverage and Uninsurance
 Fact Sheet February 2006 Health Insurance Coverage in Minnesota, 2001 vs. 2004 This fact sheet provides a summary of final estimates of health insurance coverage gathered from the 2001 and 2004 Minnesota
Florida s Budget and Financial Outlook Dr. James A. Zingale Capital Hill Group
 Florida s Budget and Financial Outlook 2017 Dr. James A. Zingale Capital Hill Group February 7, 2017 National Economic Forecast * No Recession Currently Forecasted * Current recovery 4th Longest Recovery
2017 Regional Indicators Summary
 2017 Regional Indicators Summary Regional Indicators Regional indicators are a specific set of data points that help gauge the relative health of the region in a number of areas. These include economy,
CHAPTER 3 POPULATION AND ECONOMIC CHARACTERISTICS
 CHAPTER 3 POPULATION AND ECONOMIC CHARACTERISTICS INTRODUCTION Population trends in La Vista and its respective planning jurisdiction serve as valuable indicators of future development needs and patterns
Populations: an Introduction to Demography. Population Trends In Canada
 Populations: an Introduction to Demography Population Trends In Canada Demography Demography is the study of populations over time and over place. The three major components of demography are: (1) mortality,
2014 Memphis Poverty Fact Sheet (Data from 2013 ACS)
") (Data from 2013 ACS) Elena Delavega, PhD, MSW Assistant Professor Department of Social Work School of Urban Affairs and Public Policy 223 McCord Hall Memphis, TN 28152 Who are the Poor? Memphis has a poverty
(Data from 2013 ACS) Elena Delavega, PhD, MSW Assistant Professor Department of Social Work School of Urban Affairs and Public Policy 223 McCord Hall Memphis, TN 28152 Who are the Poor? Memphis has a poverty
What does your Community look like and how is it changing?
 What does your Community look like and how is it changing? Trends in the State population related to health and health determinants and where you can find this data to support your local work Who is Likely
Ravenna s most significant growth occurred before Between 1960 and 1980 the city s population declined by 8.5%.
 DRAFT Ravenna Comprehensive Plan Draft May 2008 1 A Profile of Ravenna This section examines demographic trends that will affect Ravenna. The analysis examines population and demographic dynamics, including
Figure 1. Half of the Uninsured are Low-Income Adults. The Nonelderly Uninsured by Age and Income Groups, 2003: Low-Income Children 15%
 P O L I C Y B R I E F kaiser commission on medicaid SUMMARY and the uninsured Health Coverage for Low-Income Adults: Eligibility and Enrollment in Medicaid and State Programs, 2002 By Amy Davidoff, Ph.D.,
Economic Overview City of Tyler, TX. January 8, 2018
 Economic Overview City of Tyler, TX January 8, 2018 DEMOGRAPHIC PROFILE...3 EMPLOYMENT TRENDS...5 WAGE TRENDS...5 COST OF LIVING INDEX...6 INDUSTRY SNAPSHOT...7 OCCUPATION SNAPSHOT...9 INDUSTRY CLUSTERS...
Health and Health Coverage in the South: A Data Update
 February 2016 Issue Brief Health and Health Coverage in the South: A Data Update Samantha Artiga and Anthony Damico With its recent adoption of the Affordable Care Act (ACA) Medicaid expansion to adults,
BUDGET BACKGROUNDER PLANNING FOR CALIFORNIA S FUTURE: THE STATE S POPULATION IS GROWING, AGING, AND BECOMING MORE DIVERSE.
 BUDGET BACKGROUNDER NOBVEMBER 2005 M A K I N G D O L L A R S M A K E S E N S E PLANNING FOR CALIFORNIA S FUTURE: THE STATE S POPULATION IS GROWING, AGING, AND BECOMING MORE DIVERSE Introduction California
Texas: Demographically Different
 FEDERAL RESERVE BANK OF DALLAS ISSUE 3 99 : Demographically Different A s the st century nears, demographic changes are reshaping the U.S. economy. The largest impact is coming from the maturing of baby
Enhancing Economic Security for the Latino Community
 Enhancing Economic Security for the Latino Community March 21, 2012 Presented at a Symposium Honoring the Center for Policy Research on Aging s 15 th Anniversary Aging in a Minority-Majority Nation: Interracial
REGIONAL SNAPSHOT. Foothills Region, North Carolina
 REGIONAL SNAPSHOT Foothills Region, North Carolina Table of contents 01 Overview 04 Labor force 02 Demography 05 Industry and occupation 03 Human capital 01 overview Foothills Region, NC What is a regional
Health Insurance Coverage among Puerto Ricans in the U.S.,
 Health Insurance Coverage among Puerto Ricans in the U.S., 2010 2015 Research Brief Issued April 2017 By: Jennifer Hinojosa Centro RB2016-15 The recent debates and issues surrounding the 2010 Affordable
Trend Analysis of Changes to Population and Income in Philadelphia, using American Community Survey (ACS) Data
 Data") OFFICE OF THE PRESIDENT FINANCE AND BUDGET TEAM City Council of Philadelphia 9.22.17 Trend Analysis of Changes to Population and Income in Philadelphia, using 2010-2016 American Community Survey (ACS)
OFFICE OF THE PRESIDENT FINANCE AND BUDGET TEAM City Council of Philadelphia 9.22.17 Trend Analysis of Changes to Population and Income in Philadelphia, using 2010-2016 American Community Survey (ACS)
Changes in Labor Market Participation across the Household Income Distribution
 Changes in Labor Market Participation across the Household Income Distribution Robert E. Hall Hoover Institution and Department of Economics Stanford University National Bureau of Economic Research Nicolas
Poverty Rises, Median Income Falls and More Minnesotans Go Without Health Insurance in 2010
 Poverty Rises, Median Income Falls and More Minnesotans Go Without Health Insurance in 2010 Economic well-being of Minnesotans is declining The United States has weathered two recessions in the last decade,
Economic Overview York County, South Carolina. February 14, 2018
 Economic Overview York County, February 14, 2018 DEMOGRAPHIC PROFILE... 3 EMPLOYMENT TRENDS... 5 UNEMPLOYMENT RATE... 5 WAGE TRENDS... 6 COST OF LIVING INDEX... 6 INDUSTRY SNAPSHOT... 7 OCCUPATION SNAPSHOT...
2018 Trustee & Employee Diversity Update. June 2018
 2018 Trustee & Employee Diversity Update June 2018 Highlights at a Glance Established DEI Task Force & Steering Committee DEI Transparency: posted demographic data publicly Defined diversity, equity and
Town Profiles: Demographic, Economic, and Housing Statistics for De Smet City and Wall Town, SOuth Dakota
 South Dakota State University Open PRAIRIE: Open Public Research Access Institutional Repository and Information Exchange Census Data Center News Releases SDSU Census Data Center 12-7-2017 Town Profiles:
Demographics, Wealth and Opportunity
 NCSL Family Opportunity Forum Demographics, Wealth and Opportunity June 14, 2016 William R. Emmons Federal Reserve Bank of St. Louis William.R.Emmons@stls.frb.org These comments do not necessarily represent
MEMORANDUM. Gloria Macdonald, Jennifer Benedict Nevada Division of Health Care Financing and Policy (DHCFP)
") MEMORANDUM To: From: Re: Gloria Macdonald, Jennifer Benedict Nevada Division of Health Care Financing and Policy (DHCFP) Bob Carey, Public Consulting Group (PCG) An Overview of the in the State of Nevada
MEMORANDUM To: From: Re: Gloria Macdonald, Jennifer Benedict Nevada Division of Health Care Financing and Policy (DHCFP) Bob Carey, Public Consulting Group (PCG) An Overview of the in the State of Nevada
Lapkoff & Gobalet Demographic Research, Inc.
 Lapkoff & Gobalet Demographic Research, Inc. 22361 Rolling Hills Road, Saratoga, CA 95070-6560 (408) 725-8164 Fax (408) 725-1479 2120 6 th Street #9, Berkeley, CA 94710-2204 (510) 540-6424 Fax (510) 540-6425
September Turning 65. Beyond a Rite of Passage. A nonprofit service and advocacy organization National Council on Aging
 September 2012 Turning 65 Beyond a Rite of Passage 1 Cumulatively 31.4 million adults will turn 65 between 2012 and 2020 4,000,000 3,900,000 Turning 65 by Year 3.8 M 3,800,000 3,700,000 3,600,000 3,500,000
OVERVIEW OF THE SAN DIEGO REGION Current Conditions and Future Trends
 OVERVIEW OF THE SAN DIEGO REGION Current Conditions and Future Trends Why do we need a Regional Comprehensive Plan? Let s examine the facts. It helps to look at some objective statistical information that
Adolescents & Young Adults: The Health Insurance Challenge
 Adolescents & Young Adults: The Health Insurance Challenge Abigail English, JD english@cahl.org National Institute of Health Care Management Closing the Gaps in Health Care for Adolescents & Young Adults
A Sublette County Profile: Socioeconomics
 JULY 2015 A Sublette County Profile: Socioeconomics Sublette County Board of County Commissioners Andy Nelson, Chair Joel Bousman Jim Latta INTRODUCTION In a rapidly changing world, timely and accurate
Indicators for the 2nd cycle of review and appraisal of RIS/MIPAA (A suggestion from MA:IMI) European Centre Vienna
 European Centre Vienna") Indicators for the 2nd cycle of review and appraisal of RIS/MIPAA 2007-2012 (A suggestion from MA:IMI) European Centre Vienna April 2011 The indicators cover four main topics: demography, income and wealth,
Indicators for the 2nd cycle of review and appraisal of RIS/MIPAA 2007-2012 (A suggestion from MA:IMI) European Centre Vienna April 2011 The indicators cover four main topics: demography, income and wealth,
Methodology behind the Federal Reserve Bank of Atlanta s Labor Force Participation Dynamics
 February 14, 219 Methodology behind the Federal Reserve Bank of Atlanta s Labor Force Participation Dynamics https://www.frbatlanta.org/chcs/labor-force-participation-dynamics By Ellyn Terry The methodology
Social Security. Yolanda York Public Affairs Specialist.
 Social Security Yolanda York Public Affairs Specialist www.socialsecurity.gov The Real Beginning... Bismarck introduced first Social Security old-age benefits in Germany in 1889 2 2 3 Who Gets Benefits
The State of the Nation s Housing Report 2017
 The State of the Nation s Housing Report 217 Tennessee Governor s Housing Conference Nashville, Tennessee September 2, 217 The Report s Major Themes National home prices have regained their previous peak,
ECONOMIC OVERVIEW DuPage County, Illinois
 ECONOMIC OVERVIEW DuPage County, Illinois DEMOGRAPHIC PROFILE... 3 EMPLOYMENT TRENDS... 5 UNEMPLOYMENT RATE... 5 WAGE TRENDS... 6 COST OF LIVING INDEX... 7 INDUSTRY SNAPSHOT... 8 OCCUPATION SNAPSHOT...
Part 1. Demographics, Socioeconomics, Community Safety
 The Health of 2014 Community Health Assessment Prepared by: Siri Kushner MPH, CPH Presented: February 21, 2014 Part 1. Demographics, Socioeconomics, Community Safety Section A: Population 1. Total Population
Economic Overview. Lawrence, KS MSA
 Economic Overview Lawrence, KS MSA March 5, 2019 DEMOGRAPHIC PROFILE... 3 EMPLOYMENT TRENDS... 5 UNEMPLOYMENT RATE... 5 WAGE TRENDS... 6 COST OF LIVING INDEX... 7 INDUSTRY SNAPSHOT... 8 OCCUPATION SNAPSHOT...
Economic Overview 45-Minute Commute From Airport Park. June 6, 2017
 Economic Overview 45-Minute Commute From Airport Park June 6, 2017 DEMOGRAPHIC PROFILE... 3 EMPLOYMENT TRENDS... 5 WAGE TRENDS... 5 COST OF LIVING INDEX... 6 INDUSTRY SNAPSHOT... 7 OCCUPATION SNAPSHOT...
What do we know FOR SURE?
 What do we know FOR SURE? It s a whole new world. Not just a cycle. We must go forward, we can t go back. The combination of factors creates a whole new economy, requiring new analysis What s Next? Real
Uninsurance Is Not Just a Minority Issue: White Americans Are a Large Share of the Growth from 2000 to 2010
 ACA Implementation Monitoring and Tracking Uninsurance Is Not Just a Minority Issue: White Americans Are a Large Share of the Growth from 2000 to 2010 November 2012 Frederic Blavin John Holahan Genevieve
Florida: Demographic Trends
 Florida: Demographic Trends September 26, 2011 Presented by: The Florida Legislature Office of Economic and Demographic Research 850.487.1402 http://edr.state.fl.us Population Growth Recovering Population
Health Coverage for the Black Population Today and Under the Affordable Care Act
 fact sheet Health Coverage for the Black Population Today and Under the Affordable Care Act July 2013 As of 2011, 37 million individuals living in the United States identified as Black or African American.
REGIONAL SNAPSHOT. Eastern Shore Region, Virginia
 REGIONAL SNAPSHOT Eastern Shore Region, Virginia Table of contents 01 Overview 04 Labor force 02 Demography 05 Industry and occupation 03 Human capital 01 overview Eastern Shore Region, VA What is a regional
Proportion of income 1 Hispanics may be of any race.
 POLICY PAPER This report addresses how individuals from various racial and ethnic groups fare under the current Social Security system. It examines the relative importance of Social Security for these
REGIONAL SNAPSHOT. Indiana 15 Regional Planning Commission Region, Indiana
 REGIONAL SNAPSHOT Indiana 15 Regional Planning Commission Region, Indiana Table of contents 01 Overview 04 Labor force 02 Demography 05 Industry and occupation 03 Human capital 01 overview Indiana 15 Regional
Simulation of Young Adult Homeownership Change through 2035: Effects of Growing Diversity and Rising Educational Attainment
 Simulation of Young Adult Homeownership Change through 2035: Effects of Growing Diversity and Rising Educational Attainment Working Paper June 20, 2017 Dowell Myers Professor of Policy, Planning, and Demography
We re Not All The Same!
 We re Not All The Same! Exploring the DIVERSITY in Millennials Jason Dunkel jason.dunkel@environicsanalytics.ca 647-259-2811 @jdunkel_ea Worldwide Millennials are In need of Some PR Generation Maybe The
White Pine County Economic Overview
 Economic Overview Population (2016) 10,105 Jobs (2016) 4,597 Average Earnings (2016) $65,033 Unemployed (2/2016) 229 GRP (2014) $996,944,330 Exports (2014) $1,789,478,088 Imports (2014) $1,181,738,119
REGIONAL SNAPSHOT. Northern Shenandoah Valley Regional Partnership (NSVRP), Virginia
, Virginia") REGIONAL SNAPSHOT Northern Shenandoah Valley Regional Partnership (NSVRP), Virginia Table of contents 01 Overview 04 Labor force 02 Demography 05 Industry and occupation 03 Human capital 01 overview Northern
REGIONAL SNAPSHOT Northern Shenandoah Valley Regional Partnership (NSVRP), Virginia Table of contents 01 Overview 04 Labor force 02 Demography 05 Industry and occupation 03 Human capital 01 overview Northern
Women in the Labor Force: A Databook
 Cornell University ILR School DigitalCommons@ILR Federal Publications Key Workplace Documents 12-2011 Women in the Labor Force: A Databook Bureau of Labor Statistics Follow this and additional works at:
Economic Overview Plant City Region. April 5, 2017
 Economic Overview Plant City Region April 5, 2017 DEMOGRAPHIC PROFILE... 3 EMPLOYMENT TRENDS... 5 WAGE TRENDS... 5 COST OF LIVING INDEX... 6 INDUSTRY SNAPSHOT... 7 OCCUPATION SNAPSHOT... 9 INDUSTRY CLUSTERS...