Lapkoff & Gobalet Demographic Research, Inc.
|
|
|
- Barbara Booth
- 5 years ago
- Views:
Transcription
1 Lapkoff & Gobalet Demographic Research, Inc Rolling Hills Road, Saratoga, CA (408) Fax (408) th Street #9, Berkeley, CA (510) Fax (510) Demographic Evaluation of Current Monterey Peninsula Community College District Trustee Areas Using Census 2010 Data May 21, 2011; revised 7/6/11 This report presents the results of our demographic evaluation of the current trustee areas of the Monterey Peninsula Community College District (MPCCD, MPC, the District) in order to determine whether the populations of those areas are balanced or equal. We have found that the populations are out of balance and that boundaries need to be adjusted. However, relatively minor adjustments could bring the current plan into compliance with the equal population requirement. In this report, we detail our findings and suggest one possible approach to balancing the current trustee area populations. What is Redistricting? Jurisdictions that elect board members by election district must review those district boundaries and make adjustments, if necessary, after each Census. This applies to the election districts for the U.S. House of Representatives, state legislatures, and local political entities (such as community college districts, county boards of supervisors, city councils, school districts, and special districts). Jurisdictions in Monterey County must preclear any changes with the U.S. Department of Justice before the changes take effect. Legal Requirements The equal protection clause of the 14 th Amendment of the U.S. Constitution and Section of the California Education Code require that after each U.S. Census, trustee areas must be evaluated for population equality and adjusted, if necessary: California Education Code, Section (a) Following each decennial federal census, and using population figures as validated by the Population Research Unit of the Department of Finance as a basis, the governing board of each school district or community college district in which trustee areas have been established, and in which each trustee is elected by the residents of the area he or she represents, shall adjust the boundaries of any or all of the trustee areas of the district so that one or both of the following conditions is satisfied: (1) The population of each area is, as nearly as may be, the same proportion of the total population of the district as the ratio that the number of governing board members elected from the area bears to the total number of members of the governing board. (2) The population of each area is, as nearly as may be, the same proportion of the total population of the district as each of the other areas. (b) The boundaries of the trustee areas shall be adjusted by the governing board of each school district or community college district, in accordance with subdivision (a), before the first day of March of the year following the year in which the results of each decennial census are released. 1 If the governing board fails to adjust the boundaries before the first day of March of the year following the year in which the results of each decennial census are released, the county committee on school district organization shall do so before the 30th day of April of the same year. 1 The post-2010 Census redistricting must be completed before March 1,
2 In addition to population equality, the Education Code (Section 1002a) states that trustee area boundaries may take into account topography; geography; cohesiveness, contiguity, integrity, and compactness of territory; and communities of interest. Other important redistricting requirements are specified by the federal Voting Rights Act, which is intended to protect the voting power of certain classes, such as ethnic/racial/language minority groups. If the population of a protected class is sufficiently large, geographically compact, and politically cohesive, the law says that boundaries should be drawn so that members of the group can elect representatives of their choice. For the purposes of redistricting, the protected classes include African Americans, Asian Americans, Pacific Islanders, Latinos/Hispanics, Native Americans, Alaska Natives, and some language minority groups. The Voting Rights Act (particularly Section 5) prohibits retrogression, which refers to any changes that have the purpose of, or will have the effect of, diminishing the ability of any citizens of the United States because of race, color, or membership in a language minority group (as defined in the Act) to elect their preferred candidates of choice. 2 Any adjustments of the District s trustee area boundaries must not have retrogressive effects. The data presented in this report will provide the baseline against which any proposed modification of trustee area boundaries will be compared to determine if the modification would have retrogressive effects. In Shaw v. Reno, the U.S. Supreme Court ruled that election districts should not be oddly shaped solely for the purpose of forming an ethnic minority election district. Essentially, other factors, such as communities of interest, should be considered, as well as the shape of the trustee area. 3 The Appendix to this report contains a series of maps that are intended to help suggest some possible communities of interest within the District. Current Trustee Areas MPC has five trustee areas. Map 1 shows the current boundaries of these areas. We translated the trustee areas into Census 2010 geography (Census blocks), 4 and computed each trustee area s population characteristics. 2 See the February 9, 2011, Guidance Concerning Redistricting Under Section 5 of the Voting Rights Act Notice by the U.S. Justice Department, 3 Although not specifically applicable to community college districts, the legislation that created the California Citizens Redistricting Commission (-Section 2(d)(4) of Article XXI of the California Constitution) defines a community of interest as a contiguous population which shares common social and economic interests that should be included within a single district for purposes of its effective and fair representation. 4 In order to maintain precinct geography, it was necessary to split one large census block that includes residences and population on the north side of Military Avenue in Seaside. The boundary between Trustee Areas 1 and 2 is the back property line of the homes on the north side of Military Avenue, so that homes on both sides of Military Avenue in Trustee Area 1. One census block ( ) includes the north side of Military Avenue plus other residences to the north. The other residences are in Trustee Area 2, while those on Military Avenue are in Trustee Area 1. As a result, this Census block needed to be split. We used the distribution of registered voters in the split census block to allocate the Census population between Trustee Areas 1 and 2. Of the registered voters in the census block, 83.4 percent live on Military Avenue, and the other 16.6 percent live north of Military Avenue. We used these shares to allocate the block s 591 persons (493 persons to Trustee Area 1 and 98 persons to Trustee Area 2). We assumed identical ethnic shares in both parts of the census block. All data on trustee area populations reported in this document assume this of Census block
3 Population Equality Census 2010 counted 128,205 people living within the MPC jurisdiction. 5 Each of the five trustee areas would have an ideal population of 25,641, which is one-fifth of the District s total population. In actuality, trustee area populations range from 23,406 (Area 3) to 27,461 (Area 2). Table 1 shows the population of each trustee area, its deviation from the ideal district size, and its percentage deviation from the ideal size. For example, Area 1 has a Census 2010 population of 25,828, which is (slightly) too large (187 persons). That represents a deviation of 0.7 percent from the ideal size. Area 2, with the largest population, has a deviation of 7.1 percent, while Area 3, with the smallest population, has a deviation of minus 8.7 percent. Table 1 presents the evaluation of population equality among the trustee areas. Trustee area populations do not need to be exactly equal; the guideline is that a districting plan should not exceed a 10 percent deviation, which we define below. There are several ways one can calculate a districting plan s deviation. One way is to measure the difference between the most and least populous trustee areas and divide by the ideal trustee area size. For MPC, the difference between Areas 2 and 3 (the most and least populous trustee areas) is 4,055. The current plan has a deviation of 15.8 percent (4,055 divided by the ideal trustee area size of 25,641). Another way to calculate a plan s deviation is to sum the absolute values of the percentage deviations of the most and least populous trustee areas. For MPC, the least populous trustee area has a deviation of 8.7 percent while the most populous trustee area has a deviation of 7.1 percent. These deviations combine to the total of 15.8 percent deviation. The current plan s deviation, 15.8 percent, is too high. The difference between the most and least populous trustee areas needs to be below 10 percent in order to achieve the requirement of population equality. Therefore, some boundary adjustment is needed. However, as we explain below, this adjustment could be relatively minor. The deviation could be reduced to below 10 percent by shifting a yet-to-be-defined area with about 2,000 residents from Area 2 to Area 3. 5 The MPC jurisdiction consists of the combination of Monterey Peninsula, Pacific Grove, and Carmel Unified School Districts. 3
4 Table 1: Trustee Area Census 2010 Population Totals Election District Population Deviation % Deviation of Each Area Trustee Area 1 25, % Trustee Area 2 27,461 1, % Trustee Area 3 23,406-2, % Trustee Area 4 24, % Trustee Area 5 26,737 1, % Total 128,205 Ideal Trustee Area Size 25,641 (one fifth of the total population) This Plan's Deviation 4,055 (largest minus smallest district) Plan Deviation 15.8% (deviation divided by ideal trustee area size) 4

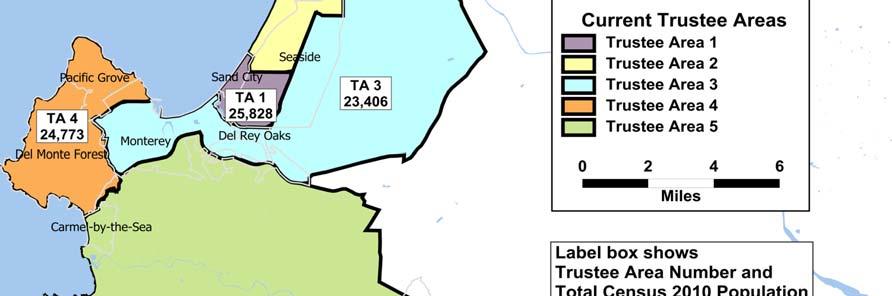
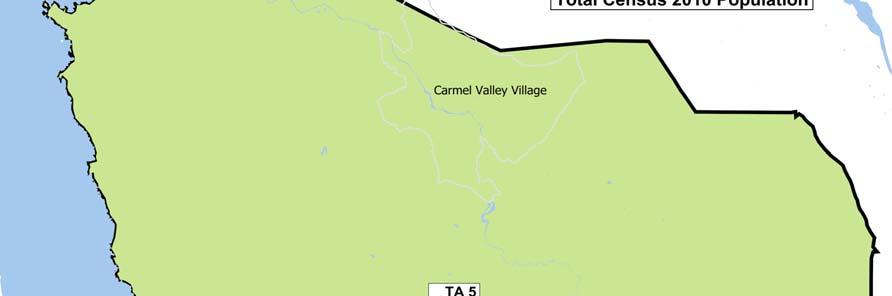


5 Map 1 5
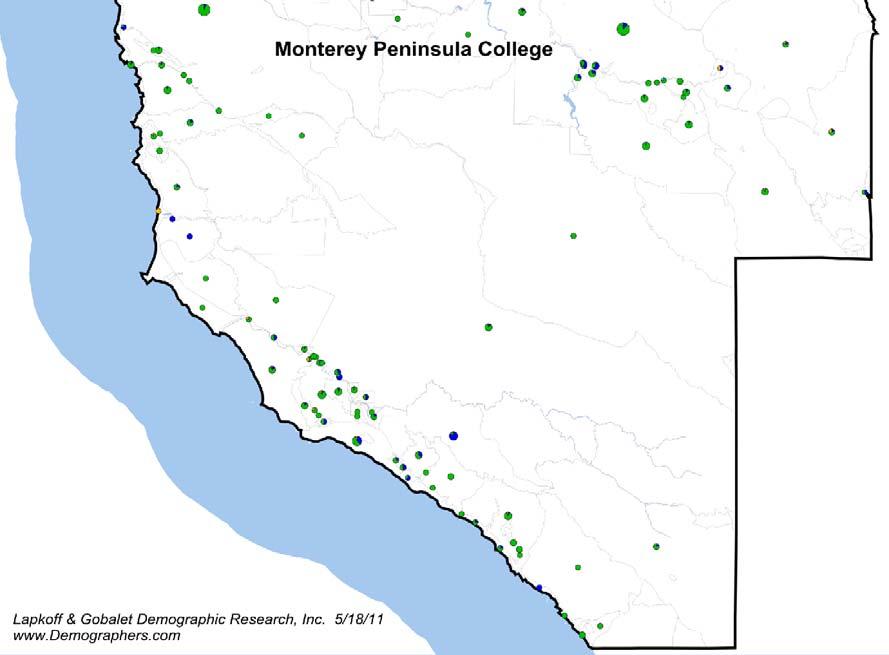
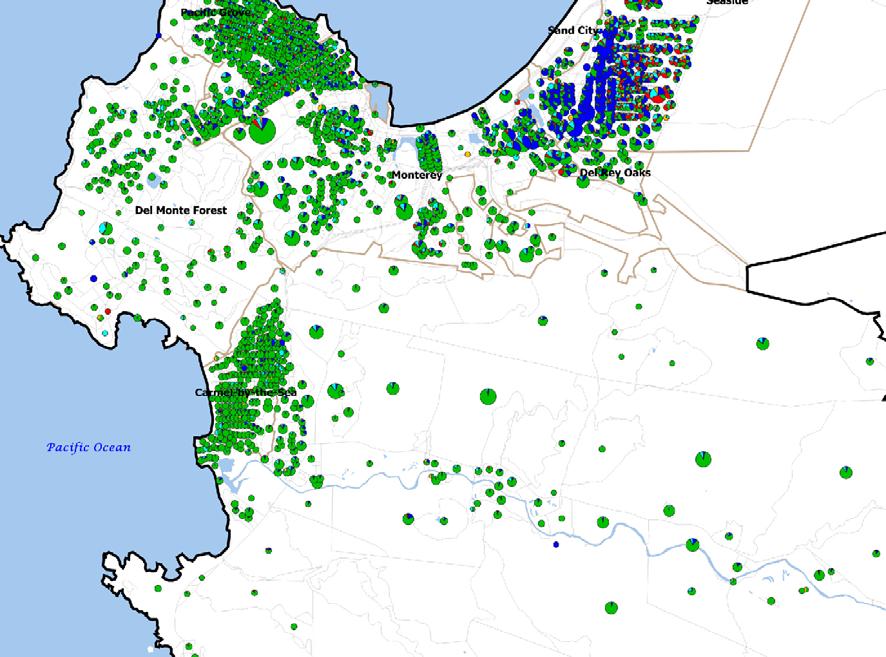
6 Voting Rights Act The Federal Voting Rights Act has been interpreted to mean that if there are sufficiently numerous, geographically compact, politically cohesive, protected groups (including Hispanics, Asian Americans, and African Americans) in a jurisdiction, political subdivisions should be drawn (and adjusted) so as to permit members of these groups to elect representatives of their choice. For Voting Rights Act purposes, the population over age 18 is most relevant, since this is the group eligible to vote. Census 2010 showed that Non-Hispanic Whites are the District s most numerous adult population group, with 64 percent of the voting age (aged 18+) population (VAP), followed by Hispanics with 18 percent, non-hispanic Asians with 11 percent, Non-Hispanic African- Americans with five percent, and others comprising the remainder. Maps 2a and 2b, along with Table 2, show the geographical distributions of these groups. The Census 2010 enumerations show that MPC does not have a single protected group that is sufficiently numerous to elect representatives of choice from any current trustee area. Hispanics are a substantial minority group in Areas 1 and 2, comprising 44 and 21 percent of the voting age population (VAP), respectively. The lower citizenship rates of Hispanics compared to Whites causes their influence to be less than the VAP share would suggest. However, the geographical concentrations of members of these protected groups in the District and the fact that the various groups live together (along with non-hispanic Whites) in northern MPCCD communities suggest that they may qualify as a single community of interest. Representatives of these groups have made statements over the years that they, collectively, are a community of interest and are politically cohesive. The combined protected group populations comprise 70 percent of Area 1 s VAP and 55 percent of Area 2 s. We geocoded the registered voters in the college district, and noted the ones with Spanish Surnames. This allowed us to develop an estimate of the number and share of registered voters in each Census block that are likely to be Hispanic. In Area 1, 20 percent of 2010 registered voters had Spanish surnames, as did 16 percent of actual voters in the November 2008 general election. Trustee Area 2 had the next largest concentration of Spanish surname voters, with 15 percent of 2010 registered voters and 14 percent of 2008 actual voters. Unfortunately, there is no way to identify African American registered voters, and the Asian surname analysis methodology is relatively untested, so that we cannot estimate the share of registered and actual voters who belong to all of the protected groups. Nevertheless, in both the current Areas 1 and 2, protected groups have large population shares. These measurements and estimates of the VAP, registered voter, and actual voter shares that protected groups have of populations in each current trustee area will be used as the baseline against which to compare any proposed boundary modification during the redistricting process. Section 5 of the federal Voting Rights Act prohibits retrogression, and this means that any proposed modification of current trustee area boundaries, even if it results in population balance, is not legal if it reduces the voting power of protected groups. In the request that the U.S. Department of Justice preclear trustee area boundary modifications, it will be necessary to establish that those modifications are not retrogressive. 6
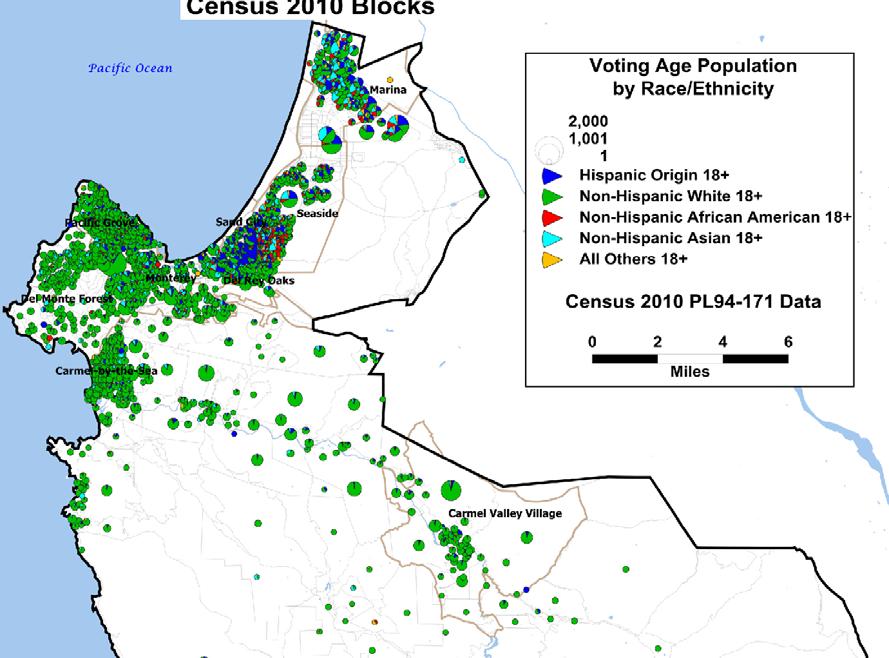
7 Map 2a 7

8 Map 2b 8
9 Table 2 Percent of Population in Each Ethnic Group Hispanic NH White NH Black NH Indian NH Asian NH Hawaiian NH Other NH Multiple Race Divisions Population Deviation from Ideal Number Percent 1 25, % 51% 25% 9% 1% 10% 2% 0% 2% 100% 2 27,461 1, % 25% 41% 8% 1% 19% 2% 0% 3% 100% 3 23,406-2, % 16% 69% 3% 1% 10% 1% 0% 1% 100% 4 24, % 10% 78% 2% 1% 8% 0% 0% 1% 100% 5 26,737 1, % 7% 85% 1% 1% 5% 0% 0% 0% 100% Total 128,205 22% 59% 5% 1% 11% 1% 0% 1% 100% Total Ideal district size 25,641 Smallest district 23,406 Largest district 27,461 % Deviation 15.8% Percent of Population 18+ in Each Ethnic Group Hispanic NH White NH Black NH Indian NH Asian NH Hawaiian NH Other NH Multiple Race Divisions Total Pop ,055 44% 30% 10% 1% 11% 2% 0% 2% 100% 2 20,947 21% 45% 8% 1% 21% 2% 0% 2% 100% 3 19,742 13% 72% 3% 1% 10% 0% 0% 1% 100% 4 20,861 8% 81% 2% 1% 7% 0% 0% 0% 100% 5 22,209 6% 88% 1% 1% 4% 0% 0% 0% 100% Total 102,814 18% 64% 5% 1% 11% 1% 0% 1% 100% Divisions Registered Voters, Registered Voters with Spanish Surnames Voters, 2008 Voters, 2008 with Spanish Surnames 1 9,138 20% % 2 10,857 15% % 3 10,945 8% % 4 15,488 6% % 5 17,536 4% % Total 63,964 9% 50,266 8% Total 9

10 Preliminary Ideas about Adjusting Boundaries Relatively small changes will be needed to balance MPC s trustee area populations. If approximately 2,000 people were moved from Area 2 to Area 3, the plan s deviation would drop below 10 percent. However, it is necessary to decide which area to move. Option 1: Move main CSUMB campus from Area 2 to Area 3 (Map 3). One approach would shift 2,688 persons from Area 2 to Area 3, reducing the current plan s deviation to 7.6 percent, well below the 10 percent maximum. The area that could be moved is shaded orange in Map 3, and it is the main part of the CSUMB campus. Map 3 Option 2: Move some area north of Military Avenue from Area 2 to Area 3 (Map 4). A second option might be to move some territory in the former Fort Ord portion of the city of Seaside from Area 2 to Area 3. This area gained substantial population between 2000 and It now is home to 4,602 persons and includes the Seaside Highlands housing development (just north of the north-side-of-military Avenue homes). If about half of the population in this area was moved from Area 2 to Area 3, and no other changes were made, the plan deviation would drop below 10 percent. The area that is shaded orange in Map 4 contains 4,602 persons. It is currently part of Area 2. Some of this territory (perhaps the southernmost portion) might be moved from Area 2 to Area 3. 10

11 Map 4 11
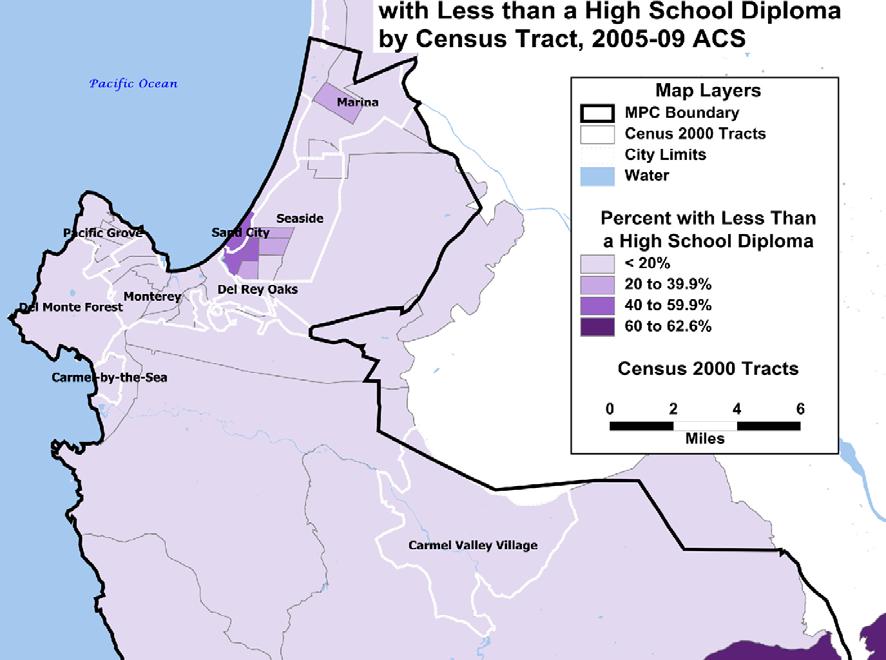
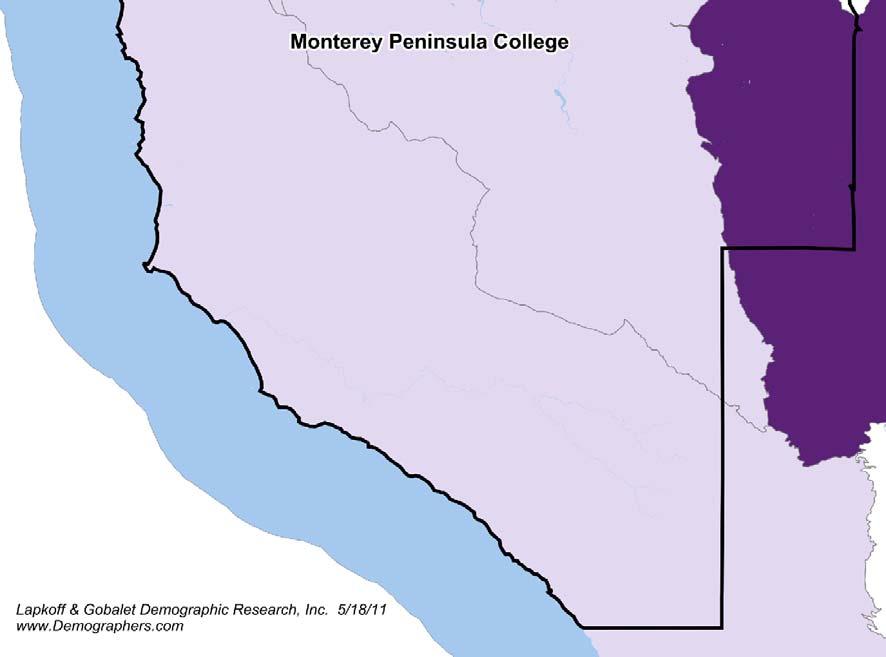
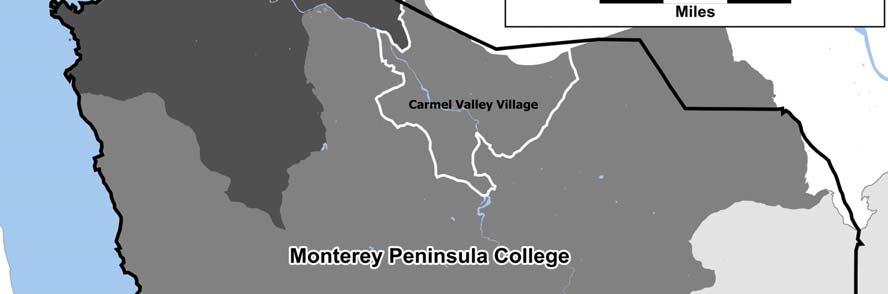
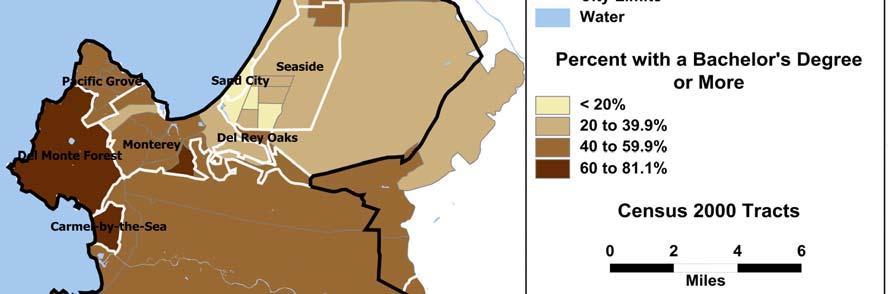
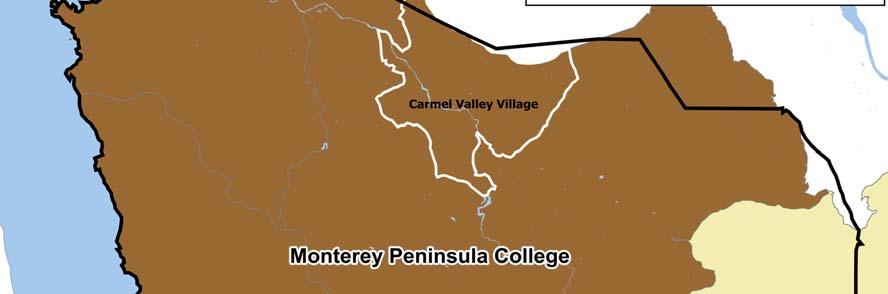
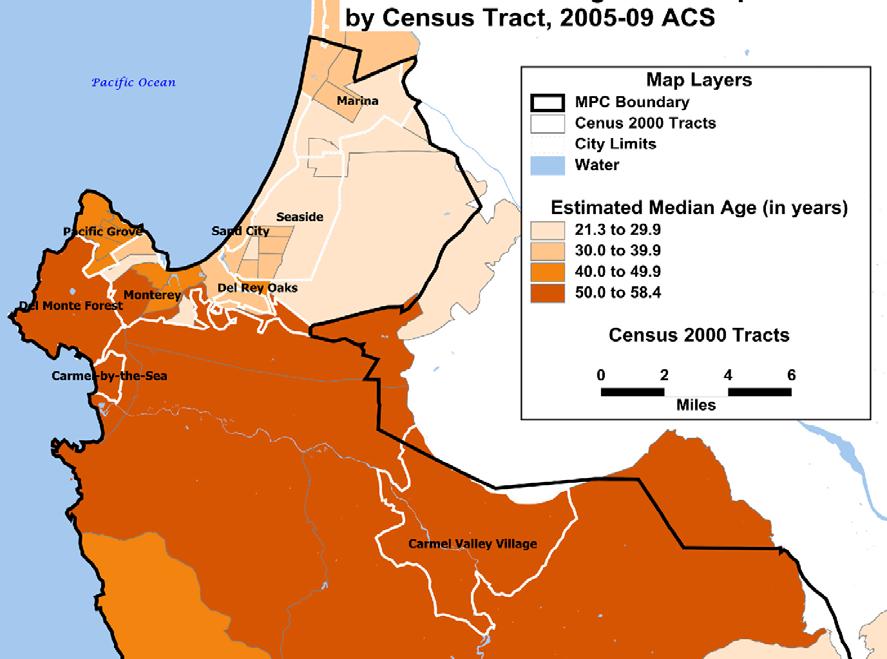
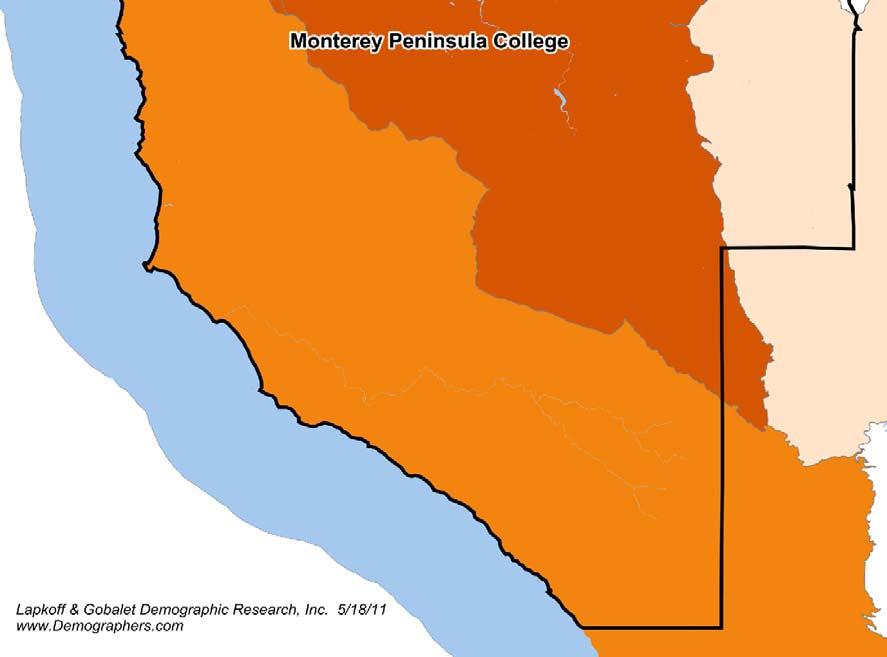
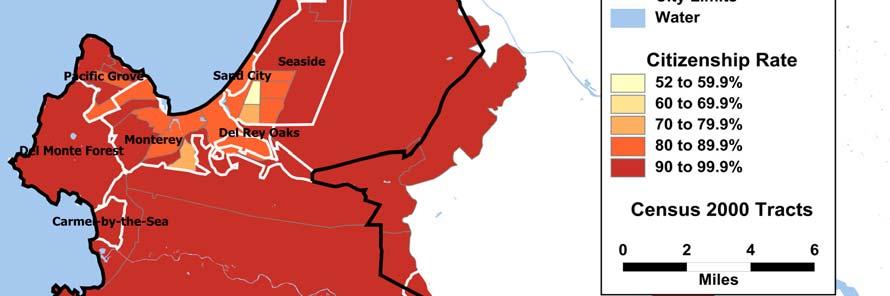
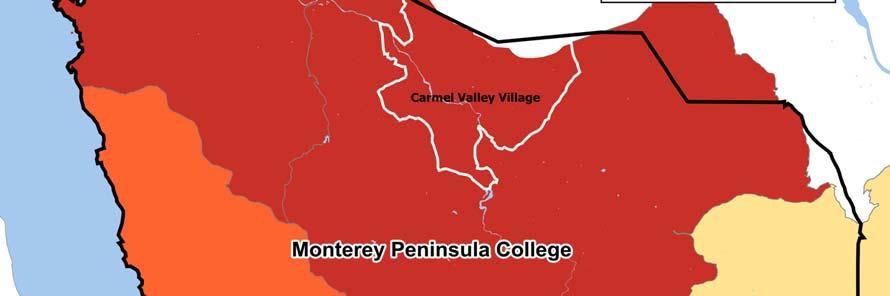
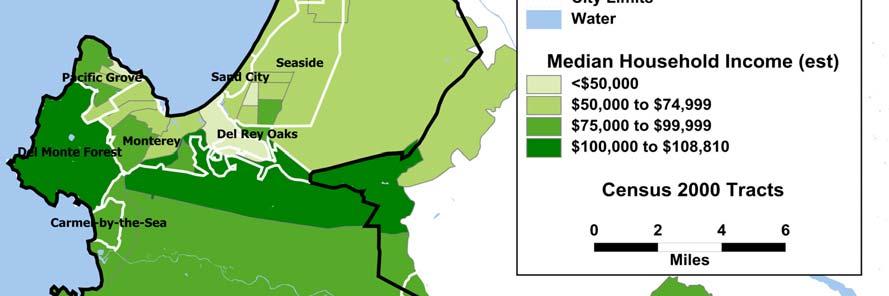
12 Appendix Background Maps Suggesting Some Possible Communities of Interest in Monterey Peninsula Community College District. Data from the U.S. Census Bureau: American Community Survey (ACS). Page 12. Educational Attainment: Estimated Percent of Adults Aged 25+ with Less than a High School Diploma by Census Tract, ACS Page 13. Educational Attainment: Estimated Percent of Adults Aged 25+ with an Associate s Degree or More by Census Tract, ACS Page 14. Educational Attainment: Estimated Percent of Adults Aged 25+ with a Bachelor s Degree or More by Census Tract, ACS Page 15. Population Age Structure: Estimated Median Age of the Population by Census Tract, ACS Page 16. Estimated Citizenship Rate by Census Tract, ACS (population of all ages) Page 17. Estimated Median Household Income by Census Tract, ACS (population of all ages) All maps show city limits because cities and unincorporated communities are possible communities of interest 12
13 13


14 14
15 15
16 16


17 17


18 18
Commission District 4 Census Data Aggregation
 Commission District 4 Census Data Aggregation 2011-2015 American Community Survey Data, U.S. Census Bureau Table 1 (page 2) Table 2 (page 2) Table 3 (page 3) Table 4 (page 4) Table 5 (page 4) Table 6 (page
Northwest Census Data Aggregation
 Northwest Census Data Aggregation 2011-2015 American Community Survey Data, U.S. Census Bureau Table 1 (page 2) Table 2 (page 2) Table 3 (page 3) Table 4 (page 4) Table 5 (page 4) Table 6 (page 5) Table
Riverview Census Data Aggregation
 Riverview Census Data Aggregation 2011-2015 American Community Survey Data, U.S. Census Bureau Table 1 (page 2) Table 2 (page 2) Table 3 (page 3) Table 4 (page 4) Table 5 (page 4) Table 6 (page 5) Table
Zipe Code Census Data Aggregation
 Zipe Code 66101 Census Data Aggregation 2011-2015 American Community Survey Data, U.S. Census Bureau Table 1 (page 2) Table 2 (page 2) Table 3 (page 3) Table 4 (page 4) Table 5 (page 4) Table 6 (page 5)
Zipe Code Census Data Aggregation
 Zipe Code 66103 Census Data Aggregation 2011-2015 American Community Survey Data, U.S. Census Bureau Table 1 (page 2) Table 2 (page 2) Table 3 (page 3) Table 4 (page 4) Table 5 (page 4) Table 6 (page 5)
2018:IIIQ Nevada Unemployment Rate Demographics Report*
 2018:IIIQ Nevada Unemployment Rate Demographics Report* Department of Employment, Training & Rehabilitation Research and Analysis Bureau Dr. Tiffany Tyler-Garner, Director Dennis Perea, Deputy Director
Poverty in the United Way Service Area
 Poverty in the United Way Service Area Year 4 Update - 2014 The Institute for Urban Policy Research At The University of Texas at Dallas Poverty in the United Way Service Area Year 4 Update - 2014 Introduction
TECHNICAL REPORT NO. 11 (5 TH EDITION) THE POPULATION OF SOUTHEASTERN WISCONSIN PRELIMINARY DRAFT SOUTHEASTERN WISCONSIN REGIONAL PLANNING COMMISSION
 THE POPULATION OF SOUTHEASTERN WISCONSIN PRELIMINARY DRAFT SOUTHEASTERN WISCONSIN REGIONAL PLANNING COMMISSION") TECHNICAL REPORT NO. 11 (5 TH EDITION) THE POPULATION OF SOUTHEASTERN WISCONSIN PRELIMINARY DRAFT 208903 SOUTHEASTERN WISCONSIN REGIONAL PLANNING COMMISSION KRY/WJS/lgh 12/17/12 203905 SEWRPC Technical
TECHNICAL REPORT NO. 11 (5 TH EDITION) THE POPULATION OF SOUTHEASTERN WISCONSIN PRELIMINARY DRAFT 208903 SOUTHEASTERN WISCONSIN REGIONAL PLANNING COMMISSION KRY/WJS/lgh 12/17/12 203905 SEWRPC Technical
A (800) (800)
 (800)") No. 14- IN THE Supreme Court of the United States SUE EVENWEL, EDWARD PFENNINGER, Appellants, v. GREG ABBOTT, IN HIS OFFICIAL CAPACITY AS GOVERNOR OF TEXAS, et al., Appellees. ON APPEAL FROM THE UNITED
No. 14- IN THE Supreme Court of the United States SUE EVENWEL, EDWARD PFENNINGER, Appellants, v. GREG ABBOTT, IN HIS OFFICIAL CAPACITY AS GOVERNOR OF TEXAS, et al., Appellees. ON APPEAL FROM THE UNITED
Independence, MO Data Profile 2015
 , MO Data Profile 2015 5 year American Community Survey (ACS) Jackson County, Missouri Data sources: U.S. Census Bureau, American Community Survey (ACS), 2011 2015 (released December 8, 2016), compared
MEMORANDUM. Gloria Macdonald, Jennifer Benedict Nevada Division of Health Care Financing and Policy (DHCFP)
") MEMORANDUM To: From: Re: Gloria Macdonald, Jennifer Benedict Nevada Division of Health Care Financing and Policy (DHCFP) Bob Carey, Public Consulting Group (PCG) An Overview of the in the State of Nevada
MEMORANDUM To: From: Re: Gloria Macdonald, Jennifer Benedict Nevada Division of Health Care Financing and Policy (DHCFP) Bob Carey, Public Consulting Group (PCG) An Overview of the in the State of Nevada
Local Business Profile All Sectors - Fairfield city, Ohio. Contents. What will I find in this report? My Customers
 Local Business Profile All Sectors -, Contents What will I find in this report? My Customers The My Customers section provides summarized demographic information for,. This information provides a snapshot
Rifle city Demographic and Economic Profile
 Rifle city Demographic and Economic Profile Community Quick Facts Population (2014) 9,289 Population Change 2010 to 2014 156 Place Median HH Income (ACS 10-14) $52,539 State Median HH Income (ACS 10-14)
Tyler Area Economic Overview
 Tyler Area Economic Overview Demographic Profile. 2 Unemployment Rate. 4 Wage Trends. 4 Cost of Living Index...... 5 Industry Clusters. 5 Occupation Snapshot. 6 Education Levels 7 Gross Domestic Product
Regional Data Snapshot
 Regional Data Snapshot Population, Economy & Education Features SET Civic Forum Ozark Foothills Region, Missouri Table of Contents 01 Overview 03 Human Capital 02 Demography 04 Labor Force 01 overview
Economic Overview Monterey County, California. July 22, 2016
 Economic Overview Monterey July 22, 2016 DEMOGRAPHIC PROFILE... 3 EMPLOYMENT TRENDS... 5 UNEMPLOYMENT RATE... 5 WAGE TRENDS... 6 COST OF LIVING INDEX... 6 INDUSTRY SNAPSHOT... 7 OCCUPATION SNAPSHOT...
Economic Overview New York
 Report created on October 20, 2015 Economic Overview Created using: Contact: Lisa.Montiel@suny.edu DEMOGRAPHIC PROFILE...3 EMPLOYMENT TRENDS...5 UNEMPLOYMENT RATE...5 WAGE TRENDS...6 COST OF LIVING INDEX...6
Economic Overview York County, South Carolina. February 14, 2018
 Economic Overview York County, February 14, 2018 DEMOGRAPHIC PROFILE... 3 EMPLOYMENT TRENDS... 5 UNEMPLOYMENT RATE... 5 WAGE TRENDS... 6 COST OF LIVING INDEX... 6 INDUSTRY SNAPSHOT... 7 OCCUPATION SNAPSHOT...
Risk and Technology Review - Analysis of Socio-Economic Factors for Populations Living Near Hard Chromium Electroplating Facilities
 Risk and Technology Review - Analysis of Socio-Economic Factors for Populations Living Near Hard Chromium Electroplating Facilities Prepared by: EC/R Incorporated 501 Eastowne Drive, Suite 250 Chapel Hill,
Economic Overview Long Island
 Report created on October 20, 2015 Economic Overview Long Island Created using: Contact: Lisa.Montiel@suny.edu DEMOGRAPHIC PROFILE...3 EMPLOYMENT TRENDS...5 UNEMPLOYMENT RATE...5 WAGE TRENDS...6 COST OF
ECONOMIC OVERVIEW DuPage County, Illinois
 ECONOMIC OVERVIEW DuPage County, Illinois DEMOGRAPHIC PROFILE... 3 EMPLOYMENT TRENDS... 5 UNEMPLOYMENT RATE... 5 WAGE TRENDS... 6 COST OF LIVING INDEX... 7 INDUSTRY SNAPSHOT... 8 OCCUPATION SNAPSHOT...
A Profile of the Working Poor, 2011
 Cornell University ILR School DigitalCommons@ILR Federal Publications Key Workplace Documents 4-2013 A Profile of the Working Poor, 2011 Bureau of Labor Statistics Follow this and additional works at:
Economic Overview. Lawrence, KS MSA
 Economic Overview Lawrence, KS MSA March 5, 2019 DEMOGRAPHIC PROFILE... 3 EMPLOYMENT TRENDS... 5 UNEMPLOYMENT RATE... 5 WAGE TRENDS... 6 COST OF LIVING INDEX... 7 INDUSTRY SNAPSHOT... 8 OCCUPATION SNAPSHOT...
Mid - City Industrial
 Minneapolis neighborhood profile October 2011 Mid - City Industrial About this area The Mid-City Industrial neighborhood is bordered by I- 35W, Highway 280, East Hennepin Avenue, and Winter Street Northeast.
Community Development with a Purpose. CDFI Certification: A Building Block of Community Finance
 Community Development with a Purpose CDFI Certification: A Building Block of Community Finance CDFI Fund CDFI Fund established by Congress in 1994 through the efforts of Federation and others in community
Economic Overview City of Tyler, TX. January 8, 2018
 Economic Overview City of Tyler, TX January 8, 2018 DEMOGRAPHIC PROFILE...3 EMPLOYMENT TRENDS...5 WAGE TRENDS...5 COST OF LIVING INDEX...6 INDUSTRY SNAPSHOT...7 OCCUPATION SNAPSHOT...9 INDUSTRY CLUSTERS...
Economic Overview Capital District
 August 29, 2017 Economic Overview Capital District Contact: Lisa.Montiel@suny.edu DEMOGRAPHIC PROFILE... 3 EMPLOYMENT TRENDS... 5 UNEMPLOYMENT RATE... 5 WAGE TRENDS... 6 COST OF LIVING INDEX... 6 INDUSTRY
Regional Data Snapshot
 Regional Data Snapshot Population, Economy & Education Features SET Civic Forum Forest Country Region (FCR), Texas Table of Contents 01 Overview 03 Human Capital 02 Demography 04 Labor Force 01 overview
June 9, Economic Overview Billings, MT MSA
 June 9, 2016 Economic Overview Billings, MT MSA DEMOGRAPHIC PROFILE... 3 EMPLOYMENT TRENDS... 5 UNEMPLOYMENT RATE... 5 WAGE TRENDS... 6 COST OF LIVING INDEX... 6 INDUSTRY SNAPSHOT... 7 OCCUPATION SNAPSHOT...
2016 Labor Market Profile
 2016 Labor Market Profile Prepared by The Tyler Economic Development Council Tyler Area Sponsor June 2016 The ability to demonstrate a regions availability of talented workers has become a vital tool
Appendix C-5 Environmental Justice and Title VI Analysis Methodology
 Appendix C-5 Environmental Justice and Title VI Analysis Methodology Environmental Justice Analysis SACOG is required by law to conduct an Environmental Justice (EJ) analysis as part of the MTP/SCS, to
PRIME COMMERCIAL LAND FOR SALE
 PRIME COMMERCIAL LAND AVENUE P-4 & 5 TH STREET WEST OUTSTANDING HWY. 14 EXPOSURE COMING SOON TRADE & COMMERCE CENTER HEART OF S RETAIL & BUSINESS CORRIDOR The depiction in the included photograph of any
Economic Overview Long Island
 Report created on August 29, 2017 Economic Overview Long Island Contact: Lisa.Montiel@suny.edu DEMOGRAPHIC PROFILE... 3 EMPLOYMENT TRENDS... 5 UNEMPLOYMENT RATE... 5 WAGE TRENDS... 6 COST OF LIVING INDEX...
University of Minnesota
 neighborhood profile October 2011 About this area The University neighborhood is bordered by 11th Avenue Southeast, University Avenue, 15th Avenue Southeast, the railroad tracks, Oak Street, and the Mississippi
Economic Overview Loudoun County, Virginia. October 23, 2017
 Economic Overview October 23, 2017 DEMOGRAPHIC PROFILE... 3 EMPLOYMENT TRENDS... 5 UNEMPLOYMENT RATE... 5 WAGE TRENDS... 6 COST OF LIVING INDEX... 6 INDUSTRY SNAPSHOT... 7 OCCUPATION SNAPSHOT... 9 INDUSTRY
DEMOGRAPHIC PROFILE...3 EMPLOYMENT TRENDS...5 UNEMPLOYMENT RATE...5 WAGE TRENDS...6 COST OF LIVING INDEX...6 INDUSTRY SNAPSHOT...7
 March 14, 2017 DEMOGRAPHIC PROFILE...3 EMPLOYMENT TRENDS...5 UNEMPLOYMENT RATE...5 WAGE TRENDS...6 COST OF LIVING INDEX...6 INDUSTRY SNAPSHOT...7 OCCUPATION SNAPSHOT...9 INDUSTRY CLUSTERS... 12 EDUCATION
Camden Industrial. Minneapolis neighborhood profile. About this area. Trends in the area. Neighborhood in Minneapolis.
 Minneapolis neighborhood profile October 2011 Camden Industrial About this area The Camden Industrial neighborhood is bordered by 48th Avenue North, the Mississippi River, Dowling Avenue North, Washington
Economic Overview Western New York
 Report created on August 29, 2017 Economic Overview Western New Contact: Lisa.Montiel@suny.edu DEMOGRAPHIC PROFILE... 3 EMPLOYMENT TRENDS... 5 UNEMPLOYMENT RATE... 5 WAGE TRENDS... 6 COST OF LIVING INDEX...
October 28, Economic Overview Yellowstone County, Montana
 October 28, 2016 Economic Overview Yellowstone DEMOGRAPHIC PROFILE...3 EMPLOYMENT TRENDS...5 UNEMPLOYMENT RATE...5 WAGE TRENDS...6 COST OF LIVING INDEX...6 INDUSTRY SNAPSHOT...7 OCCUPATION SNAPSHOT...9
Shingle Creek. Minneapolis neighborhood profile. About this area. Trends in the area. Neighborhood in Minneapolis. October 2011
 neighborhood profile October 2011 About this area The neighborhood is bordered by 53rd Avenue North, Humboldt Avenue North, 49th Avenue North, and Xerxes Avenue North. It is home to Olson Middle School.
Economic Overview Fairfax / Falls Church. October 23, 2017
 Economic Overview Fairfax / Falls Church October 23, 2017 DEMOGRAPHIC PROFILE... 3 EMPLOYMENT TRENDS... 5 UNEMPLOYMENT RATE... 5 WAGE TRENDS... 6 COST OF LIVING INDEX... 6 INDUSTRY SNAPSHOT... 7 OCCUPATION
Exploring the Geography of College Opportunity
 E D U C A T I O N P O L I C Y P R O G R A M Exploring the Geography of College Opportunity Data and Methodology Kristin Blagg and Victoria Rosenboom April 2018 Data Our analysis builds on the work we completed
Town of Mamakating Proposed Six Ward Map January 26, 2017
 Town of Mamakating Proposed Six Ward Map January 26, 2017 3050 Skyline Dr. Schenectady, NY 12306 716 870 1991 david@skylinepolitical.com Overview In the November 2015 Elections, voters in the town of Mamakating
Economic Overview Marlboro County Labor Shed. June 29, 2016
 Economic Overview Marlboro County Labor June 29, 2016 DEMOGRAPHIC PROFILE...3 EMPLOYMENT TRENDS...5 UNEMPLOYMENT RATE...5 WAGE TRENDS...6 COST OF LIVING INDEX...6 INDUSTRY SNAPSHOT...7 OCCUPATION SNAPSHOT...9
In 2012, according to the U.S. Census Bureau, about. A Profile of the Working Poor, Highlights CONTENTS U.S. BUREAU OF LABOR STATISTICS
 U.S. BUREAU OF LABOR STATISTICS M A R C H 2 0 1 4 R E P O R T 1 0 4 7 A Profile of the Working Poor, 2012 Highlights Following are additional highlights from the 2012 data: Full-time workers were considerably
Economic Overview Mohawk Valley
 Report created on August 29, 2017 Economic Overview Mohawk Valley Contact: Lisa.Montiel@suny.edu DEMOGRAPHIC PROFILE... 3 EMPLOYMENT TRENDS... 5 UNEMPLOYMENT RATE... 5 WAGE TRENDS... 6 COST OF LIVING INDEX...
Occupation Overview Criminal Justice Administration-Corrections Related Occupations in Kern
 Occupation Overview Criminal Justice Administration-Corrections Related Occupations in Kern EMSI Q2 2015 Data Set Taft College 29 Emmons Park Drive Taft, California 93268 661.763.7700 EMSI Q2 2015 Data
Palm Springs Districting 2018 D Crawford Modified 2
 Farrell Dr N Indian Canyon Dr San Rafael Dr Vista Chino N Sunrise Way 10 Palm Springs Districting 2018 D Crawford Modified 2 N Whitewater Club Dr Gene Autry Trail *Red outlines are intended to highlight
Exploring the Geography of College Opportunity
 E D U C A T I O N P O L I C Y P R O G R A M Exploring the Geography of College Opportunity Data and Methodology Kristin Blagg and Victoria Rosenboom April 2018 (updated May 2018) Data Our analysis builds
Economic Overview Prince William/Manassas. October 23, 2017
 Economic Overview Prince William/Manassas October 23, 2017 DEMOGRAPHIC PROFILE... 3 EMPLOYMENT TRENDS... 5 UNEMPLOYMENT RATE... 5 WAGE TRENDS... 6 COST OF LIVING INDEX... 6 INDUSTRY SNAPSHOT... 7 OCCUPATION
Economic Overview 45-Minute Commute From Airport Park. June 6, 2017
 Economic Overview 45-Minute Commute From Airport Park June 6, 2017 DEMOGRAPHIC PROFILE... 3 EMPLOYMENT TRENDS... 5 WAGE TRENDS... 5 COST OF LIVING INDEX... 6 INDUSTRY SNAPSHOT... 7 OCCUPATION SNAPSHOT...
Trend Analysis of Changes to Population and Income in Philadelphia, using American Community Survey (ACS) Data
 Data") OFFICE OF THE PRESIDENT FINANCE AND BUDGET TEAM City Council of Philadelphia 9.22.17 Trend Analysis of Changes to Population and Income in Philadelphia, using 2010-2016 American Community Survey (ACS)
OFFICE OF THE PRESIDENT FINANCE AND BUDGET TEAM City Council of Philadelphia 9.22.17 Trend Analysis of Changes to Population and Income in Philadelphia, using 2010-2016 American Community Survey (ACS)
Economic Overview Plant City Region. April 5, 2017
 Economic Overview Plant City Region April 5, 2017 DEMOGRAPHIC PROFILE... 3 EMPLOYMENT TRENDS... 5 WAGE TRENDS... 5 COST OF LIVING INDEX... 6 INDUSTRY SNAPSHOT... 7 OCCUPATION SNAPSHOT... 9 INDUSTRY CLUSTERS...
RIDGECREST TOWNE CENTER
 700-840 N. CHINA LAKE BLVD. RIDGECREST, CALIFORNIA 1,400SF, 1,750SF, 2,205SF, 2,633SF AND 6,620SF AVAILABLE CENTER OF TOWN LOCATION AND COMING SOON: N. China Lake Blvd. Anchored by Stater Brothers, Big
Occupation Overview Industrial Health & Safety Related Occupations in Kern
 Occupation Overview Industrial Health & Safety Related Occupations in Kern EMSI Q2 2015 Data Set Taft College 29 Emmons Park Drive Taft, California 93268 661.763.7700 EMSI Q2 2015 Data Set www.economicmodeling.com
REGIONAL SNAPSHOT. Foothills Region, North Carolina
 REGIONAL SNAPSHOT Foothills Region, North Carolina Table of contents 01 Overview 04 Labor force 02 Demography 05 Industry and occupation 03 Human capital 01 overview Foothills Region, NC What is a regional
REGIONAL SNAPSHOT. Indiana 15 Regional Planning Commission Region, Indiana
 REGIONAL SNAPSHOT Indiana 15 Regional Planning Commission Region, Indiana Table of contents 01 Overview 04 Labor force 02 Demography 05 Industry and occupation 03 Human capital 01 overview Indiana 15 Regional
Washington, DC. HFA Performance Data Reporting- Borrower Characteristics
 HFA Performance Data Reporting- Borrower Characteristics QTD Cumulative 1 Unique Borrower Count 2 Number of Unique Borrowers Receiving Assistance 19 767 3 Number of Unique Borrowers Denied Assistance 5
Town Profiles: Demographic, Economic, and Housing Statistics for De Smet City and Wall Town, SOuth Dakota
 South Dakota State University Open PRAIRIE: Open Public Research Access Institutional Repository and Information Exchange Census Data Center News Releases SDSU Census Data Center 12-7-2017 Town Profiles:
REGIONAL SNAPSHOT. Northern Shenandoah Valley Regional Partnership (NSVRP), Virginia
, Virginia") REGIONAL SNAPSHOT Northern Shenandoah Valley Regional Partnership (NSVRP), Virginia Table of contents 01 Overview 04 Labor force 02 Demography 05 Industry and occupation 03 Human capital 01 overview Northern
REGIONAL SNAPSHOT Northern Shenandoah Valley Regional Partnership (NSVRP), Virginia Table of contents 01 Overview 04 Labor force 02 Demography 05 Industry and occupation 03 Human capital 01 overview Northern
April 29, City of Turlock. Douglas Johnson. Brief descriptions of NDC Draft plans A, B and C
 April 29, 2014 To: Fr: Re: City of Turlock Douglas Johnson Brief descriptions of NDC Draft plans A, B and C Accompanying this memo are maps and demographic spreadsheets of NDC draft plans A, B and C. This
CITY OF CALISTOGA DOWN PAYMENT ASSISTANCE PROGRAM LOAN APPLICATION
 DOWN PAYMENT ASSISTANCE PROGRAM LOAN APPLICATION Date Applicant s Name Phone Residence Address Home City, State, Zip Code Phone Mailing Address (If different) FAMILY INFORMATION Applicant or Co-Applicant
TASK FORCE ON INCOME INEQUALITY. Public Meeting #1 Council Chambers in Sacramento City Hall July 29th, PM
 TASK FORCE ON INCOME INEQUALITY Public Meeting #1 Council Chambers in Sacramento City Hall July 29th, 2015 4-6 PM Meeting Agenda I. Welcome & Introductions II. Timeline and Other Dates III. Goal and Ground
REGIONAL SNAPSHOT. Eastern Shore Region, Virginia
 REGIONAL SNAPSHOT Eastern Shore Region, Virginia Table of contents 01 Overview 04 Labor force 02 Demography 05 Industry and occupation 03 Human capital 01 overview Eastern Shore Region, VA What is a regional
In Baltimore City today, 20% of households live in poverty, but more than half of the
 Building Economic Opportunity in Baltimore: A Data Profile Baltimore Highlights In Baltimore City today, 20% of households live in poverty, but more than half of the city s population 55% is financially
SELECTED INDICATORS FOR WOMEN AGES 15 TO 44 IN KITSAP COUNTY
 SELECTED INDICATORS FOR WOMEN AGES 15 TO 44 IN KITSAP COUNTY TABLE OF CONTENTS Introduction page 2 Data Details page 3 Demographic Indicators page 4 Pregnancy Indicators page 5 Socioeconomic Indicators
Chapter 10 Equity and Environmental Justice
 Chapter 10 Equity and Environmental Justice Introduction An important consideration for the 2040 Transportation Policy Plan is its impact on all populations in the Minneapolis-Saint Paul region, particularly
Florida: Demographic Trends
 Florida: Demographic Trends September 26, 2011 Presented by: The Florida Legislature Office of Economic and Demographic Research 850.487.1402 http://edr.state.fl.us Population Growth Recovering Population
Figure 2.1 The Longitudinal Employer-Household Dynamics Program
 Figure 2.1 The Longitudinal Employer-Household Dynamics Program Demographic Surveys Household Record Household-ID Data Integration Record Person-ID Employer-ID Data Economic Censuses and Surveys Census
REGIONAL SNAPSHOT. Crossing Borders Region (CBR), Oklahoma
, Oklahoma") REGIONAL SNAPSHOT Crossing Borders Region (CBR), Oklahoma Table of contents 01 Overview 04 Labor force 02 Demography 05 Industry and occupation 03 Human capital 01 overview Crossing Borders Region, OK
REGIONAL SNAPSHOT Crossing Borders Region (CBR), Oklahoma Table of contents 01 Overview 04 Labor force 02 Demography 05 Industry and occupation 03 Human capital 01 overview Crossing Borders Region, OK
What does your Community look like and how is it changing?
 What does your Community look like and how is it changing? Trends in the State population related to health and health determinants and where you can find this data to support your local work Who is Likely
REGIONAL SNAPSHOT. Partner for Progress Region, NE
 REGIONAL SNAPSHOT Partner for Progress Region, NE Table of contents 01 Overview 04 Labor force 02 Demography 05 Industry and occupation 03 Human capital 01 overview Partner for Progress Region, NE What
CITY COUNCIL. Agenda No. 10~ Key Words: District Elections Meeting Date: April12, 2016 SUMMARY REPORT
 Agenda No. 10~ Key Words: District Elections Meeting Date: April12, 2016 SUMMARY REPORT CITY COUNCIL PREPARED BY: Douglas Johnson, National Demographics Corporation Douglas L. White, City Attorney RECOMMENDATION
CHAPTER 16 POPULATION AND HOUSING, SOCIOECONOMICS, AND ENVIRONMENTAL JUSTICE 16.1 AFFECTED ENVIRONMENT/ENVIRONMENTAL SETTING
 CHAPTER 16 POPULATION AND HOUSING, SOCIOECONOMICS, AND ENVIRONMENTAL JUSTICE This chapter provides an overview of the existing social and economic conditions, demographics, and the characteristics of minority
AGENDA ITEM SUMMARY April 19, 2016 City Council
 Agenda Item 15 AGENDA ITEM SUMMARY April 19, 2016 City Council STAFF Rita Knoll, Chief Deputy City Clerk Wanda Winkelmann, City Clerk SUBJECT First Reading of Ordinance No. 055, 2016, Amending the City
ACS DEMOGRAPHIC AND HOUSING ESTIMATES American Community Survey 1-Year Estimates
 DP05 ACS DEMOGRAPHIC AND HOUSING ESTIMATES 2010 American Community Survey 1-Year s Supporting documentation on code lists, subject definitions, data accuracy, and statistical testing can be found on the
Utah. Demographic and Economic Profile. Metro and Nonmetro Counties in Utah
 Demographic and Economic Profile Utah Updated July 2006 Metro and Nonmetro Counties in Utah Based on the most recent listing of core based statistical areas by the Office of Management and Budget (December
American Community Survey 5-Year Estimates
 DP05 ACS DEMOGRAPHIC AND HOUSING ESTIMATES 2011-2015 American Community Survey 5-Year Estimates Supporting documentation on code lists, subject definitions, data accuracy, and statistical testing can be
American Community Survey 5-Year Estimates
 DP05 ACS DEMOGRAPHIC AND HOUSING ESTIMATES 2011-2015 American Community Survey 5-Year Estimates Supporting documentation on code lists, subject definitions, data accuracy, and statistical testing can be
2018 Trustee & Employee Diversity Update. June 2018
 2018 Trustee & Employee Diversity Update June 2018 Highlights at a Glance Established DEI Task Force & Steering Committee DEI Transparency: posted demographic data publicly Defined diversity, equity and
STANFORD PLAZA EAST FLORIDA AVE HEMET, CA. NICK EARLE License #
 Simon s Fish & Chips Helen Nails Chinese Food Coin Laundry Welch s Shoe & Repair Stanford Street Donut Shop Fast Auto and Payday Loans E. Florida Ave AVAILABILITY Unit # Size 41821 41855 4,064 SF Water
2. Demographics. Population and Households
 2. Demographics This analysis describes the existing demographics in. It will be used to identify the major demographic trends that may have an effect on public policy in in the next decade. Demographic
Contingent and Alternative Employment Arrangements, May U.S. BUREAU OF LABOR STATISTICS bls.gov
 Contingent and Alternative Employment Arrangements, May 2017 1 U.S. BUREAU OF LABOR STATISTICS bls.gov Gig economy No official BLS definition of gig economy or gig workers Researchers use many different
Employee Demographics
 Employee Demographics Employee Name Employee A# Gender Birthdate Date of Hire Social Security Number Mailing Address, City, State, Zip Campus Address (Department and Building/Room) Campus Email Campus
Economic Overview Charlotte-Concord-Gastonia, NC-SC MSA. October 27, 2017
 Economic Overview Charlotte-Concord-Gastonia, NC-SC MSA October 27, 2017 DEMOGRAPHIC PROFILE...3 EMPLOYMENT TRENDS...5 UNEMPLOYMENT RATE...5 WAGE TRENDS...6 COST OF LIVING INDEX...6 INDUSTRY SNAPSHOT...7
Distribution of Household Wealth in the U.S.: 2000 to 2011
 Cornell University ILR School DigitalCommons@ILR Federal Publications Key Workplace Documents 2014 Distribution of Household Wealth in the U.S.: Marina Vornovitsky U.S. Census Bureau Alfred Gottschalck
Tell us what you think. Provide feedback to help make American Community Survey data more useful for you.
 DP05 ACS DEMOGRAPHIC AND HOUSING ESTIMATES 2016 American Community Survey 1-Year Estimates Supporting documentation on code lists, subject definitions, data accuracy, and statistical testing can be found
Small Area Health Insurance Estimates from the Census Bureau: 2008 and 2009
 October 2011 Small Area Health Insurance Estimates from the Census Bureau: 2008 and 2009 Introduction The U.S. Census Bureau s Small Area Health Insurance Estimates (SAHIE) program produces model based
TABLE 1. PROFILE OF GENERAL DEMOGRAPHIC CHARACTERISTICS
 Waterloo city, Iowa TABLE 1. PROFILE OF GENERAL DEMOGRAPHIC CHARACTERISTICS Estimate Lower Bound Upper Bound Total population 66,659 64,093 69,225 SEX AND AGE Male 32,096 30,415 33,777 Female 34,563 33,025
Service and Fare Change Policies. Revised Draft
 Revised Draft June 19, 2013 1. INTRODUCTION It is the policy of the Sacramento Regional Transit District (RT) to provide quality service to all customers regardless of race, color, national origin, or
ACS DEMOGRAPHIC AND HOUSING ESTIMATES American Community Survey 1-Year Estimates
 DP05 ACS DEMOGRAPHIC AND HOUSING ESTIMATES 2012 American Community Survey 1-Year Estimates Supporting documentation on code lists, subject definitions, data accuracy, and statistical testing can be found
Employee Demographics
 Employee Demographics Employee Name Employee A# Gender Birthdate Date of Hire Social Security Number Mailing Address, City, State, Zip Campus Address (Department and Building/Room) Campus Email Campus
San Mateo County Community College District Enrollment Projections and Scenarios. Prepared by Voorhees Group LLC November 2014.
 San Mateo County Community College District Enrollment Projections and Scenarios Prepared by Voorhees Group LLC November 2014 Executive Summary This report summarizes enrollment projections and scenarios
California Dreaming or California Struggling?
 California Dreaming or California Struggling? 2017 Findings from the AARP study of California Adults Ages 36-70 in the Workforce #CADreamingOrStruggling https://doi.org/10.26419/res.00163.001 SURVEY METHODOLOGY
This is a PDF version of the 2019 Law survey. To complete the survey, follow this link to the online form.
 This is a PDF version of the 2019 Law360 400 survey. To complete the survey, follow this link to the online form. Welcome to the 2019 Law360 400 survey! The answers to these questions will be used for
Demographic and Economic Profile. Delaware. Updated December 2006
 Demographic and Economic Profile Delaware Updated December 2006 Metro and Nonmetro Counties in Delaware Based on the most recent listing of core based statistical areas by the Office of Management and
Demographic and Economic Profile. New Jersey. Updated December 2006
 Demographic and Economic Profile New Jersey Updated December 2006 Metro and Nonmetro Counties in New Jersey Based on the most recent listing of core based statistical areas by the Office of Management
Findings from Focus Groups: Select Populations in Dane County
 W ISCONSIN STATE PLANNING GRANT Briefing Paper 3, September 2001 Findings from Focus Groups: Select Populations in Dane County Wisconsin is one of 20 states that received a grant in 2000-01 from the Health
Policy for Tuition & Preschool Student Assignment
 TUITION FOR PRESCHOOL MILTON PUBLIC SCHOOLS MILTON, MASSACHUSETTS Policy for Tuition & Preschool Student Assignment 1. Families will pay tuition for preschool based on the sliding fee scale approved by
What America Is Thinking On Energy Issues January 2015
 What America Is Thinking On Energy Issues January 2015 South Carolina Offshore Drilling Presented by: Harris Poll Interviewing: January 13-15, 2015 Respondents: 604 Registered Voters Method: Telephone