SMALL AREA ESTIMATES OF HEALTH INSURANCE COVERAGE:
|
|
|
- Trevor Simpson
- 5 years ago
- Views:
Transcription

1 SMALL AREA ESTIMATES OF HEALTH INSURANCE COVERAGE: A LOCAL HEALTH DEPARTMENT PERSPECTIVE Sanaa Abedin, MPH sanaa.abedin@sdcounty.ca.gov Epidemiologist, Public Health Services Community Health Statistics Unit
2 Jun-2006 Jan-2007 Aug-2007 Mar-2008 Oct-2008 May-2009 Dec-2009 Jul-2010 Feb-2011 Sep-2011 Apr-2012 Nov-2012 Jun-2013 Jan-2014 Aug-2014 Mar-2015 Oct-2015 May-2016 Recipients WHAT WILL THIS PRESENTATION COVER OVERVIEW San Diego County Demographics Uninsured at Point in Time Insurance Coverage Distribution Sociodemographic Factors and the Uninsured 800, , , , , , , ,000 0 Medi-Cal Recipients in San Diego County, /06, 256,255 ACA Enacted Medi-Cal Expansion 08/16, 742,077 Changes in the rate of health insurance coverage reflect^: Economic trends Demographic shifts Policy changes, such as the Affordable Care Act (ACA) ^

3 THE VISION Building Better Health Living Safely Thriving 3
4 DATA SOURCES Regional and Subregional Trends American Community Survey 5-Year Data on Health Insurance Coverage San Diego County Trends American Community Survey 1-Year Data on Health Insurance Coverage San Diego County, California and US Trends U.S. Census Bureau, Small Area Health Insurance Estimates American Community Survey 1-Year Data on Health Insurance Coverage Health Access California Health Interview Survey Table S2701 ACS Table Contents/Data HEALTH INSURANCE COVERAGE STATUS: Age Group Sex Race/Ethnicity Nativity/Citizenship Educational Attainment Employment Status Work Experience Household Income Federal Poverty Level Health Coverage Type
5 San Diego County 2 nd most populous county in California and 5th most populous in the United States San Diego has: Close to 3.2 million residents. Majority minority population. Busiest land border crossing in the world 1 of every 13 people who enter US come through San Ysidro. 70 miles of Coastline. 16 naval and military installations. 18 federally recognized Indian reservations. A total area of 4,526 square miles, larger than Rhode Island and Delaware combined.
6 White Black Hispanic API Other Citizen Non-Citizen % 6% 4% 4% 10% 13% 14% 13% 11% 13% 23% 24% 17% 20% 11% 14% 19% 20% 47% 39% 33% 39% 52% 47% 63% 63% 89% 87% DEMOGRAPHICS SELECTED DEMOGRAPHIC CHARACTERISTICS OF THE SAN DIEGO COUNTY POPULATION, COMPARED TO CALIFORNIA OVERALL, 2015 San Diego County California Note: Data may not add to 100% due to rounding and data restrictions Asian & Pacific Islander Source: UCLA Center for Health Policy Research. California Health Interview Survey (CHIS), Prepared by: County of San Diego, Health & Human Services Agency, Public Health Services, Community Health Statistics Unit, 2016


7 HEALTH INSURANCE IN SAN DIEGO COUNTY
8 Percent Uninsured (%) Percent Uninsured US, STATE & COUNTY TRENDS IN THE UNINSURED Since 2010: San Diego County: percentage points California: percentage points US: percentage points Uninsured Among Civilian Noninstitutionalized Population by Age, to 64 years - California 18 to 64 years - San Diego County, CA Under 19 years - California Under 19 years - San Diego County, CA Under 65 years - California Under 65 years - San Diego County, CA 17.3 Uninsured Among Civilian Noninstitutionalized Population, % 30% 25% 20% 15% 10% 5% 0% United States 15.1% 15.5% 15.1% 14.8% 14.5% 11.7% 9.4% California 18.0% 18.5% 18.1% 17.9% 17.2% 12.4% 8.6% San Diego County 17.0% 17.6% 17.4% 17.0% 16.3% 12.3% 8.8% Since 2010: Generally, all age groups experienced a decline in the percent uninsured for both the county and state. The year age group experienced the greatest decline in number of people uninsured under the ACA.

9 ** Please Note: 2012 and 2015 San Diego County percentage of uninsured come from ACS 1-Year estimates; whereas, 2012 and 2015 San Diego County HHSA Region and Subregional estimates come from ACS 5-Year estimates. The sub-county estimates are underestimates of the actual percentage of uninsured for UNINSURED IN SAN DIEGO COUNTY 100% 80% 60% 40% 20% 0% Comparison of ACS 1-Year and 5-Year Estimates of San Diego County's Uninsured Population, % 16.8% 15.9% 14.1% 17.0% 16.3% 12.3% 8.8% County of San Diego 100.0% 90.0% 80.0% 70.0% 60.0% 50.0% 40.0% 30.0% 20.0% 10.0% (ACS 5-Year) (ACS 5-Year) (ACS 5-Year) (ACS 5-Year) 2012 (ACS 1-Year) 2013 (ACS 1-Year) 2014 (ACS 1-Year) 2015 (ACS 1-Year) 0.0% Uninsured San Diego County Residents by Health & Human Services Agency Region, (5-Year Est.) % 20.6% 15.8% 12.9% 11.1% 9.5% 16.2% 15.5% 12.7% 13.4% 20.7% 16.9% 2012 SDC % Uninsured 2015 SDC % Uninsured Central East North Central North Coastal North Inland South
10 Percentage (%) SOCIODEMOGRAPHICS BY HHSA REGION Poverty Among San Diego County Residents by HHSA Region, 2014 & 2015 (Pooled) 0-99% FPL % FPL % FPL 300% FPL and above North Coastal North Central Central South East North Inland San Diego County
11 SOCIODEMOGRAPHICS BY HHSA REGION % Type of Usual Source of Care by HHSA Region in San Diego County, (Pooled) 63.9% Doctor's office/hmo/kaiser Community clinic/government clinic/community hospital Emergency room/urgent care, Some other place/no one place No usual source of care 70.6% 50.3% 50.6% 61.4% 60.7% % 20.2% North Coastal 12.9% 11.9% North Central 28.2% 20.4% 29.6% 18.1% 17.4% 9.6% 25.0% Central South East North Inland 11.5% 23.3% 2.1% 13.9% San Diego County
12 Percentage (%) SOCIODEMOGRAPHICS BY HHSA REGION Delay in Care Experienced by San Diego County Residents by HHSA Region, (Pooled) Healthcare system/provider issues and barriers or Personal reasons Cost, lack of insurance, or other insurance-related reasons North Coastal North Central Central South East North Inland San Diego County
13 ** Please Note: 2012 and 2015 US, CA and San Diego County percentage of uninsured come from ACS 1-Year estimates; whereas, 2012 and 2015 San Diego County HHSA Region and Subregional estimates come from ACS 5-Year estimates. The sub-county estimates are underestimates of the actual percentage of uninsured for UNINSURED IN SAN DIEGO COUNTY US: 9.4% CA: 8.6% 2015: SAN DIEGO COUNTY: 8.8%


14 HEALTH CARE COVERAGE TYPE

15 UNINSURED UNINSURED BY CITIZENSHIP/NATIVITY
16 Percent Uninsured Percent Uninsured Percent Uninsured Percent Uninsured UNINSURED AMONG NATIVE BORN AND FOREIGN BORN Uninsured Among Native Born, Uninsured Among Foreign Born, % 45% 40% 35% 30% 25% 20% 15% 10% 5% 0% United States 12.5% 12.7% 12.4% 12.1% 11.9% 9.4% 7.4% California 12.8% 13.1% 12.9% 12.9% 12.4% 8.6% 5.5% San Diego County 13.0% 13.4% 12.9% 12.9% 12.2% 9.0% 5.9% 50% 45% 40% 35% 30% 25% 20% 15% 10% 5% 0% United States 33.6% 34.3% 33.6% 32.8% 32.1% 26.5% 22.2% California 32.0% 32.9% 32.0% 31.3% 30.1% 22.6% 16.7% San Diego County 30.4% 31.0% 31.8% 30.3% 29.0% 22.9% 17.5% Uninsured Among Foreign Born Naturalized Citizens, Uninsured Among Foreign Born Non-citizens, % 45% 40% 35% 30% 25% 20% 15% 10% 5% 0% United States 15.7% 16.4% 16.6% 16.2% 16.1% 11.4% 8.4% California 16.1% 16.9% 16.5% 16.2% 15.5% 9.6% 5.8% San Diego County 14.4% 16.4% 15.3% 14.9% 14.4% 10.3% 6.7% 50% 45% 40% 35% 30% 25% 20% 15% 10% 5% 0% United States 47.4% 48.3% 47.4% 46.7% 46.0% 40.0% 34.9% California 45.4% 46.4% 45.7% 45.1% 43.9% 35.2% 27.4% San Diego County 44.2% 43.1% 46.3% 44.6% 42.4% 35.2% 29.0%

17 UNINSURED BY CITIZENSHIP/NATIVITY

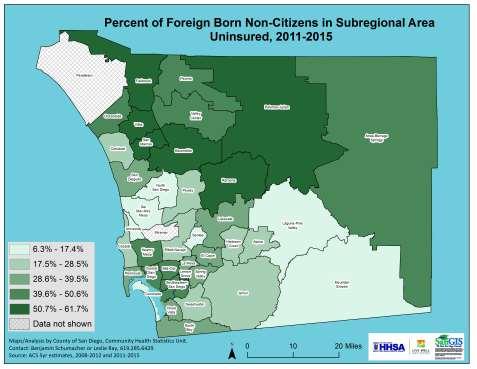
18 UNINSURED BY CITIZENSHIP/NATIVITY
19 SUMMARY OF ADDITIONAL SOCIODEMOGRAPHIC FACTORS Uninsured status was highest among adults (25 years and older) with less than high school education; however, this group saw the largest drop in uninsured status overall between (- 16.5% points) Particularly high among communities in Northern San Diego (Anza-Borrego Springs and San Marcos; 55.1% and 54.0% respectively) in Adults working part-time had a higher percentage of uninsured, when compared to full-time or adults who did not work, at 15.2% in Highest in Palomar-Julian (46.0%) and National City (43.8%) in Unemployed adults(18+ years) had the largest percentage of uninsured adults at 21.3% in 2015 compared to employed adults and those not in the labor force. Valley Center and National City had the highest percentage (54.4% and 54.8% respectively) in Households with incomes between $25,000 and under $50,000 had the largest percentage of uninsured at 14.0% in Especially high in National City and Central San Diego; 33.3% and 31.0%, respectively in
 Groups with the largest decreases in the uninsured in 2015 were: Unemployed (- 24.8%) Adults with less than high school graduation (- 16.5%) Hispanics (- 14.7%) Foreign born non-citizens (- 14.")
20 SUMMARY: IMPACTS OF THE ACA IN SAN DIEGO COUNTY Who Were More Likely to Remain Uninsured in San Diego County? Foreign born non-citizens (29%) Adults < HS Graduation (23.6%) Unemployed (21.3%) Groups with the largest decreases in the uninsured in 2015 were: Unemployed (- 24.8%) Adults with less than high school graduation (- 16.5%) Hispanics (- 14.7%) Foreign born non-citizens (- 14.1%) Households making <$25K (-12.9%) Adults ages years (- 11.3%) Individuals below 138% of FPL(16%) Adults year olds (15.4%) American Indian/Alaska Native (21.7%) and Hispanics (15.3%) Part-time workers (15.2%) Household making $25K-$49.9k (14%)


21 QUESTIONS? Soon to be Released Report from Community Health Statistics Unit: Sanaa Abedin, MPH Epidemiologist County of San Diego, Health & Human Services Agency, Public Health Services For more information, including data, resources and reports, from Public Health Services:
The Health of Jefferson County: 2010 Demographic Update
 The Health of : 2010 Demographic Update BACKGROUND How people live the sociodemographic context of their lives influences their health. People who have lower incomes may not have the resources to meet
MEMORANDUM. Gloria Macdonald, Jennifer Benedict Nevada Division of Health Care Financing and Policy (DHCFP)
") MEMORANDUM To: From: Re: Gloria Macdonald, Jennifer Benedict Nevada Division of Health Care Financing and Policy (DHCFP) Bob Carey, Public Consulting Group (PCG) An Overview of the in the State of Nevada
MEMORANDUM To: From: Re: Gloria Macdonald, Jennifer Benedict Nevada Division of Health Care Financing and Policy (DHCFP) Bob Carey, Public Consulting Group (PCG) An Overview of the in the State of Nevada
Low Income Health Program Performance Dashboard San Diego
 Low Income Health Program Performance Dashboard San Diego July 1, 2011 - December 31, 2013 About the Low Income Health Program The Low Income Health Program (LIHP), authorized under the 2010 Bridge to
Low Income Health Program Performance Dashboard San Mateo
 Low Income Health Program Performance Dashboard San Mateo July 1, 2011 - December 31, 2013 About the Low Income Health Program The Low Income Health Program (LIHP), authorized under the 2010 Bridge to
Low Income Health Program Performance Dashboard Santa Cruz
 Low Income Health Program Performance Dashboard Santa Cruz January 1, 2012 - December 31, 2013 About the Low Income Health Program The Low Income Health Program (LIHP), authorized under the 2010 Bridge
Low Income Health Program Performance Dashboard CMSP
 Low Income Health Program Performance Dashboard CMSP January 1, 2012 - December 31, 2013 About the Low Income Health Program The Low Income Health Program (LIHP), authorized under the 2010 Bridge to Reform
Independence, MO Data Profile 2015
 , MO Data Profile 2015 5 year American Community Survey (ACS) Jackson County, Missouri Data sources: U.S. Census Bureau, American Community Survey (ACS), 2011 2015 (released December 8, 2016), compared
Low Income Health Program Performance Dashboard Riverside
 Low Income Health Program Performance Dashboard Riverside January 1, 2012 - December 31, 2013 About the Low Income Health Program The Low Income Health Program (LIHP), authorized under the 2010 Bridge
Low Income Health Program Performance Dashboard Orange
 Low Income Health Program Performance Dashboard Orange July 1, 2011 - September 30, 2013 About the Low Income Health Program The Low Income Health Program (LIHP), authorized under the 2010 Bridge to Reform
The Affordable Care Act and Covered California. A Guide for Health Care Providers
 The Affordable Care Act and Covered California A Guide for Health Care Providers Brought to you by Loma Linda University Institute for Health Policy and Leadership Newest Institute at LLUH To provide the
White Pine County. Economic and Demographic Profile, 1999
 TECHNICAL REPORT UCED 99/2000-18 White Pine County Economic and Demographic Profile, 1999 UNIVERSITY OF NEVADA, RENO White Pine County Economic and Demographic Profile, 1999 Study Conducted by: Shawn W.
While one in five Californians overall is uninsured, the rate among those who work is even higher: one in four.
 : By the Numbers December 2013 Introduction California had the greatest number of uninsured residents of any state, 7 million, and the seventh largest percentage of uninsured residents under 65 in the
Low Income Health Program Performance Dashboard Tulare
 Low Income Health Program Performance Dashboard Tulare March 1, 2013 - December 31, 2013 About the Low Income Health Program The Low Income Health Program (LIHP), authorized under the 2010 Bridge to Reform
The Uninsured at the Starting Line in California: California findings from the 2013 Kaiser Survey of Low-Income Americans and the ACA
 The Uninsured at the Starting Line in California: California findings from the 2013 Kaiser Survey of Low-Income Americans and the ACA Rachel Garfield Kaiser Family Foundation February 19, 2014 Figure 1
Affordable Care Act and Covered CA: Where We are One Year Later. Wonha Kim, MD, MPH, CPH, FAAP
 Affordable Care Act and Covered CA: Where We are One Year Later Wonha Kim, MD, MPH, CPH, FAAP Senior Research Scholar, LLU Institute for Health Policy and Leadership Assistant Professor, Pediatrics, Preventive
SOUTHWEST. The Fleet and Family Support Center. Transition GPS (Goals, Plans, Success) Schedule
 Schedule") The SOUTHWEST Transition GPS (Goals, Plans, Success) Schedule The Transition Assistance Program (TAP) provides information and training to ensure Service Members leaving active duty are prepared for their
The SOUTHWEST Transition GPS (Goals, Plans, Success) Schedule The Transition Assistance Program (TAP) provides information and training to ensure Service Members leaving active duty are prepared for their
INDIVIDUAL SHARED RESPONSIBILITY PROVISION
 UNIVERSAL HEALTHCARE COUNCIL 2013 The Affordable Care Act s (ACA) shared responsibility provisions fall on two groups: individuals and employers. INDIVIDUAL SHARED RESPONSIBILITY PROVISION Overview The
Covered California Delivering on the Promise of Care. State of Reform Health Policy Conference Anne Price November 6, 2015
 Covered California Delivering on the Promise of Care State of Reform Health Policy Conference Anne Price November 6, 2015 Covered California s Promise: Better Care Healthier People Lower Cost How Covered
Commission District 4 Census Data Aggregation
 Commission District 4 Census Data Aggregation 2011-2015 American Community Survey Data, U.S. Census Bureau Table 1 (page 2) Table 2 (page 2) Table 3 (page 3) Table 4 (page 4) Table 5 (page 4) Table 6 (page
Special Report. Sources of Health Insurance and Characteristics of the Uninsured EBRI EMPLOYEE BENEFIT RESEARCH INSTITUTE
 January 1993 Jan. Feb. Sources of Health Insurance and Characteristics of the Uninsured Analysis of the March 1992 Current Population Survey Mar. Apr. May Jun. Jul. Aug. EBRI EMPLOYEE BENEFIT RESEARCH
Fact Sheet May 15, 2014
 Fact Sheet May 15, 2014 Gains and Gaps in Oregon Health Coverage A View of the State of Working Oregon Even before full implementation of the Affordable Care Act, Oregon made progress in assuring health
Northwest Census Data Aggregation
 Northwest Census Data Aggregation 2011-2015 American Community Survey Data, U.S. Census Bureau Table 1 (page 2) Table 2 (page 2) Table 3 (page 3) Table 4 (page 4) Table 5 (page 4) Table 6 (page 5) Table
FY CAO RECOMMENDED OPERATIONAL PLAN. May 2018
 FY 2018-19 CAO RECOMMENDED OPERATIONAL PLAN May 2018 1 AGENDA ECONOMY GOVERNOR S PROPOSED BUDGET FY 2018-19 CAO RECOMMENDED BUDGET NEXT STEPS 2 ECONOMY 3 ECONOMY UNEMPLOYMENT RATE 5.2% 5.2% 4.2% 3.9% 4.7%
Riverview Census Data Aggregation
 Riverview Census Data Aggregation 2011-2015 American Community Survey Data, U.S. Census Bureau Table 1 (page 2) Table 2 (page 2) Table 3 (page 3) Table 4 (page 4) Table 5 (page 4) Table 6 (page 5) Table
Zipe Code Census Data Aggregation
 Zipe Code 66101 Census Data Aggregation 2011-2015 American Community Survey Data, U.S. Census Bureau Table 1 (page 2) Table 2 (page 2) Table 3 (page 3) Table 4 (page 4) Table 5 (page 4) Table 6 (page 5)
Zipe Code Census Data Aggregation
 Zipe Code 66103 Census Data Aggregation 2011-2015 American Community Survey Data, U.S. Census Bureau Table 1 (page 2) Table 2 (page 2) Table 3 (page 3) Table 4 (page 4) Table 5 (page 4) Table 6 (page 5)
2018:IIIQ Nevada Unemployment Rate Demographics Report*
 2018:IIIQ Nevada Unemployment Rate Demographics Report* Department of Employment, Training & Rehabilitation Research and Analysis Bureau Dr. Tiffany Tyler-Garner, Director Dennis Perea, Deputy Director
AIDS Drug Assistance Program. Improving Health... Promoting Wellness
 AIDS Drug Assistance Program Improving Health... Promoting Wellness OUR MISSION To Provide Life-Saving Medications, Disease Management Training and Information to Our Clients in a Cost- Effective Way.
Small Area Health Insurance Estimates from the Census Bureau: 2008 and 2009
 October 2011 Small Area Health Insurance Estimates from the Census Bureau: 2008 and 2009 Introduction The U.S. Census Bureau s Small Area Health Insurance Estimates (SAHIE) program produces model based
2016 HEALTH INSURANCE COVERAGE ESTIMATES
 2016 HEALTH INSURANCE COVERAGE ESTIMATES SHADAC Webinar Featuring U.S. Census Bureau Experts September 19, 2017 1:00 PM EDT You will be connected to broadcast audio through your computer. You can also
The Impact of the Recession on Employment-Based Health Coverage
 May 2010 No. 342 The Impact of the Recession on Employment-Based Health Coverage By Paul Fronstin, Employee Benefit Research Institute E X E C U T I V E S U M M A R Y HEALTH COVERAGE AND THE RECESSION:
Unemployment Rate - Ottumwa, IA
 - Ottumwa, IA Report Area Ottumwa, IA Social & Economic Factors Economic and social insecurity often are associated with poor health. Poverty, unemployment, and lack of educational achievement affect access
XML Publisher Balance Sheet Vision Operations (USA) Feb-02
 Feb-02") Page:1 Apr-01 May-01 Jun-01 Jul-01 ASSETS Current Assets Cash and Short Term Investments 15,862,304 51,998,607 9,198,226 Accounts Receivable - Net of Allowance 2,560,786
Page:1 Apr-01 May-01 Jun-01 Jul-01 ASSETS Current Assets Cash and Short Term Investments 15,862,304 51,998,607 9,198,226 Accounts Receivable - Net of Allowance 2,560,786
Affordable Care Act: Susan F. Sterne Principal May 22, Selected Issues For
 Affordable Care Act: Selected Issues For Employers Susan F. Sterne Principal May 22, 2013 Susan F. Sterne, CPA is Oregon s largest single-office accounting firm, whose mission is to be a solution for clients
Part 1. Demographics, Socioeconomics, Community Safety
 The Health of 2014 Community Health Assessment Prepared by: Siri Kushner MPH, CPH Presented: February 21, 2014 Part 1. Demographics, Socioeconomics, Community Safety Section A: Population 1. Total Population
QUARTERLY REPORT AND CERTIFICATION OF THE COUNTY TREASURER For Quarter Ending June 30, 2009 COMPLIANCE CERTIFICATION
 QUARTERLY REPORT AND CERTIFICATION OF THE COUNTY TREASURER For Quarter Ending June 30, 2009 The Government Code requires the County Treasurer to render a Quarterly Report to the County Administrator, the
TASK FORCE ON INCOME INEQUALITY. Public Meeting #1 Council Chambers in Sacramento City Hall July 29th, PM
 TASK FORCE ON INCOME INEQUALITY Public Meeting #1 Council Chambers in Sacramento City Hall July 29th, 2015 4-6 PM Meeting Agenda I. Welcome & Introductions II. Timeline and Other Dates III. Goal and Ground
Don t Think Globally Act Locally. Micah Weinberg President, Bay Area Council Economic Institute
 Don t Think Globally Act Locally Micah Weinberg President, Bay Area Council Economic Institute March 2017 How do we drive growth, innovation, and equity in CA s economy during these uncertain times? Build
Partial Repeal of the ACA through Reconciliation Coverage Implications for Ohio Residents
 OH Partial Repeal of the ACA through Reconciliation Coverage Implications for Ohio Residents This fact sheet examines how a reconciliation bill similar to the one vetoed in January 2016 will affect health
Partial Repeal of the ACA through Reconciliation Coverage Implications for Arizona Residents
 AZ Partial Repeal of the ACA through Reconciliation Coverage Implications for Arizona Residents This fact sheet examines how a reconciliation bill similar to the one vetoed in January 2016 will affect
Tyler Area Economic Overview
 Tyler Area Economic Overview Demographic Profile. 2 Unemployment Rate. 4 Wage Trends. 4 Cost of Living Index...... 5 Industry Clusters. 5 Occupation Snapshot. 6 Education Levels 7 Gross Domestic Product
The Robert Wood Johnson Foundation Health Care Consumer Confidence Index
 The Robert Wood Johnson Foundation Health Care Consumer Confidence Index A monthly survey of Americans attitudes about health care Baseline Findings June 2009 Analysis provided by Robert Wood Johnson Foundation
The Robert Wood Johnson Foundation Health Care Consumer Confidence Index
 The Robert Wood Johnson Foundation Health Care Consumer Confidence Index A monthly survey of Americans attitudes about health care June Findings July 2009 Analysis provided by Robert Wood Johnson Foundation
Health Insurance and Children s Well-Being
 Health Insurance and Children s Well-Being Thomas DeLeire University of Wisconsin-Madison Presentation at the IRP Child Health and Well-Being Conference, October 12, 2010 1 What Do We Know? What Do We
UNBIASED AND UNFILTERED: THE REAL IMPACT OF THE AFFORDABLE CARE ACT ON INSURANCE COVERAGE, ATTITUDES AND OPINIONS
 UNBIASED AND UNFILTERED: THE REAL IMPACT OF THE AFFORDABLE CARE ACT ON INSURANCE COVERAGE, ATTITUDES AND OPINIONS JULY 10, 2014 Dan Witters Research Director, Gallup-Healthways Well-Being Index TODAY S
Spheria Australian Smaller Companies Fund
 29-Jun-18 $ 2.7686 $ 2.7603 $ 2.7520 28-Jun-18 $ 2.7764 $ 2.7681 $ 2.7598 27-Jun-18 $ 2.7804 $ 2.7721 $ 2.7638 26-Jun-18 $ 2.7857 $ 2.7774 $ 2.7690 25-Jun-18 $ 2.7931 $ 2.7848 $ 2.7764 22-Jun-18 $ 2.7771
3/25/2008 EMPLOYMENT TRENDS IN ILLINOIS. Nonfarm Employment Change in Nonfarm Employment by Decade
 Voices for Illinois Children Symposium, March 28, 28 Paul Kleppner, Ph.D. Office for Social Policy Research Northern Illinois University EMPLOYMENT TRENDS IN ILLINOIS 7 Nonfarm Employment 195-27 6 ployees
TENNESSEE S UNINSURED IN 2017
 DATA REPORT September 27, 2018 TENNESSEE S UNINSURED IN 2017 The U.S. Census Bureau released new data this month on health insurance coverage across the U.S. in 2017. Here are our top 3 takeaways for Tennessee.
Issue Brief. Characteristics of the Nonelderly with Selected Sources of Health Insurance and Lengths of Uninsured Spells
 June 1998 Jan. Characteristics of the Nonelderly with Selected Sources of Health Insurance and Lengths of Uninsured Spells by Craig Copeland, EBRI Feb. Mar. Apr. May Jun. Jul. Aug. EBRI EMPLOYEE BENEFIT
Getting Patients ACA Coverage, Access to Care, and Viral Suppression
 Georgia Southern University Digital Commons@Georgia Southern 6th Annual Rural HIV Research and Training Conference Sep 9th, 10:15 AM - 11:05 AM Getting Patients ACA Coverage, Access to Care, and Viral
2014 HEALTH INSURANCE COVERAGE ESTIMATES
 2014 HEALTH INSURANCE COVERAGE ESTIMATES SHADAC Webinar Featuring U.S. Census Bureau Experts September 22, 2015, 2:00 PM EDT You will be connected to broadcast audio through your computer. You can also
FOR RELEASE: MONDAY, MARCH 21 AT 4 PM
 Interviews with 1,012 adult Americans conducted by telephone by Opinion Research Corporation on March 18-20, 2011. The margin of sampling error for results based on the total sample is plus or minus 3
Since 2014, California implemented multiple program changes and expansions, bringing millions of uninsured Californians into coverage, including:
 Fact Sheet Revised and updated* April 25, 2018 California fully embraced the federal Affordable Care Act (ACA) with dramatic results. California s uninsured rate is currently at just 7 percent overall
University of Minnesota
 neighborhood profile October 2011 About this area The University neighborhood is bordered by 11th Avenue Southeast, University Avenue, 15th Avenue Southeast, the railroad tracks, Oak Street, and the Mississippi
Figure 1 Nearly 1 million Virginians lack health insurance coverage. Total Nonelderly
 Figure 1 Nearly 1 million Virginians lack health insurance coverage Total Nonelderly 984,000 uninsured nonelderly Figure 2 Over forty percent of all uninsured Virginians live below the poverty level Notes:
State of Ohio Workforce. 2 nd Quarter
 To Strengthen Ohio s Families through the Delivery of Integrated Solutions to Temporary Challenges State of Ohio Workforce 2 nd Quarter 2 0 1 2 Quarterly Report on the State of Ohio s Workforce Reference
Chartpack. Kaiser Health Tracking Poll: March 2011
 Chartpack Kaiser Health Tracking Poll: March 2011 March 2011 SLIDE 1 Half Still Say They Don t Understand Law s Personal Impact Do you feel you have enough information about the health reform law to understand
Mid - City Industrial
 Minneapolis neighborhood profile October 2011 Mid - City Industrial About this area The Mid-City Industrial neighborhood is bordered by I- 35W, Highway 280, East Hennepin Avenue, and Winter Street Northeast.
Camden Industrial. Minneapolis neighborhood profile. About this area. Trends in the area. Neighborhood in Minneapolis.
 Minneapolis neighborhood profile October 2011 Camden Industrial About this area The Camden Industrial neighborhood is bordered by 48th Avenue North, the Mississippi River, Dowling Avenue North, Washington
Shingle Creek. Minneapolis neighborhood profile. About this area. Trends in the area. Neighborhood in Minneapolis. October 2011
 neighborhood profile October 2011 About this area The neighborhood is bordered by 53rd Avenue North, Humboldt Avenue North, 49th Avenue North, and Xerxes Avenue North. It is home to Olson Middle School.
Health Insurance Coverage: 2001
 Health Insurance Coverage: 200 Consumer Income Issued September 2002 P60-220 Reversing 2 years of falling uninsured rates, the share of the population without health insurance rose in 200. An estimated
Active Membership An Evolving Picture. October 8, 2015
 Active Membership An Evolving Picture October 8, 2015 More Than Two Million Consumers Served by Covered California The majority of those served have continuous coverage and of those who have left Covered
THDA STIMULUS SECOND MORTGAGE PROGRAM REPORT
 January, 2011 STIMULUS SECOND MORTGE PROAM REPORT Hulya Arik, Ph.D., Research Coordinator DIVISION OF RESEARCH, PLANNING & TECHNICAL SERVICES Tennessee Housing Development Agency 404 James Robertson Parkway,
AFFORDABLE CARE ACT UPDATE. San Francisco Health Commission July 17, 2012
 1 AFFORDABLE CARE ACT UPDATE San Francisco Health Commission July 17, 2012 2 Patient Protection and Affordable Care Act (ACA) Goals Expand health insurance coverage Improve coverage for those with health
National Health Interview Survey Early Release Program
 N ATIONAL CENTER FOR HEA LTH STATISTICS National Health Interview Survey Early Release Program Problems Paying Medical Bills Among Persons Under Age 6: Early Release of Estimates From the National Health
The Robert Wood Johnson Foundation Health Care Consumer Confidence Index
 The Robert Wood Johnson Foundation Health Care Consumer Confidence Index A monthly survey of Americans attitudes about health care September Findings October 2009 Analysis provided by Robert Wood Johnson
VECTRA BANK 23 RD ANNUAL ECONOMIC FORECAST BREAKFAST START SMART IN 2016! Member FDIC VectraBank.com
 VECTRA BANK 23 RD ANNUAL ECONOMIC FORECAST BREAKFAST START SMART IN 2016! Member FDIC VectraBank.com Colorado s Economy and State Budget Office of State Planning and Budgeting April 26, 2016 Jason Schrock,
Charisma Hooda 1/13/14
 Charisma Hooda 1/13/14 Link the MCAH population to needed medical, mental, social, dental, and community services to promote equity in access to quality services, especially for those who are eligible
Health Insurance Coverage: Early Release of Estimates From the National Health Interview Survey, 2010
 Health Insurance Coverage: Early Release of Estimates From the National Health Interview Survey, 2010 by Robin A. Cohen, Ph.D., Brian W. Ward, Ph.D., and Jeannine S. Schiller, M.P.H. Division of Health
T R U S T E D A D V I S O R S. Providing Outstanding Client Service Boston /Cambridge/Newport / Providence / Waltham
 T R U S T E D A D V I S O R S Providing Outstanding Client Service Boston /Cambridge/Newport / Providence / Waltham www.kahnlitwin.com Health Care Reform Overview Applicable Large Employer Determination
MEDICAID FEDERAL SHARE OF MATCHING FUNDS
 MEDICAID FEDERAL SHARE OF MATCHING FUNDS revised by EDR based on FFIS Estimated for FFY 2019 August 3, 2017 Effective State Budget Year State adopted February 2017 State State FY real Difference in state
The ACA s Coverage Expansion in Michigan: Demographic Characteristics and Coverage Projections
 CENTER FOR HEALTHCARE RESEARCH & TRANSFORMATION Cover MichigaN 2013 JULY 2013 The ACA s Coverage in : Demographic Characteristics and Coverage Projections Introduction.... 2 Demographic characteristics
Health Coverage by Race and Ethnicity: Examining Changes Under the ACA and the Remaining Uninsured
 November 2016 Issue Brief Health Coverage by Race and Ethnicity: Examining Changes Under the ACA and the Remaining Uninsured Samantha Artiga, Petry Ubri, Julia Foutz, and Anthony Damico Executive Summary
Since 2008, California has experienced
 July 2013 Health Policy Brief The Effects of the Great Recession on Health Insurance: Changes in the Uninsured Population from 2007 to 2009 Shana Alex Lavarreda, Sophie Snyder, and E. Richard Brown SUMMARY:
CMSP Data Update: Tuolumne County - December 2009
 CMSP Data Update: Tuolumne County - December 2009 1. CMSP Enrollment Trends 2. Health Care Utilization Trends Data Definitions Eligibles, Enrollees, or Members: All individuals enrolled in CMSP regardless
Click to edit Master text styles
 For those dialing in: All phones are muted Second Submit questions level using the chat window at any time during Third the level webinar Troubleshooting: Call Readytalk s help line: (800) 843-9166 Ask
BLM Community Socioeconomic Workshop: Grand County, Utah. Moab, Utah June 27, 2012
 BLM Community Socioeconomic Workshop: Grand County, Utah Moab, Utah June 27, 2012 1970 1972 1974 1976 1978 1980 1982 1984 1986 1988 1990 1992 1994 1996 1998 2000 2002 2004 2006 2008 1970 1972 1974 1976
Health Status, Health Insurance, and Health Services Utilization: 2001
 Health Status, Health Insurance, and Health Services Utilization: 2001 Household Economic Studies Issued February 2006 P70-106 This report presents health service utilization rates by economic and demographic
Isle Of Wight half year business confidence report
 half year business confidence report half year report contents new company registrations closed companies (dissolved) net company growth uk company share director age director gender naming trends sic
Health Reform 201 The Road Ahead for Healthcare Reform in Utah. Who is UHPP?
 Health Reform 201 The Road Ahead for Healthcare Reform in Utah October 25, 2016 Who is UHPP? Utah Health Policy Project is a non-profit, non-partisan organization advancing sustainable health care solutions
OCTOBER 1999 HEALTH NEWS INTEREST INDEX. -- TOPLINE RESULTS October 8, 1999
 OCTOBER 1999 HEALTH NEWS INTEREST INDEX -- TOPLINE RESULTS October 8, 1999 job # 99050 n=1,033 national adults, 18 years and older Margin of error: plus or minus percentage points 3.5 (square root of design
Financial Statements For Seven Months Ended January 2014 (Unaudited)
") Financial Statements For Seven Months Ended January 2014 (Unaudited) Table of Contents Description Page Financial Statement Comments 1-5 Balance Sheet 6 Income Statement for the Month and YTD period Ended
Financial Statements For Seven Months Ended January 2014 (Unaudited) Table of Contents Description Page Financial Statement Comments 1-5 Balance Sheet 6 Income Statement for the Month and YTD period Ended
CHART BOOK: A PROFILE OF HEALTH COVERAGE FOR MISSISSIPPI CHILDREN
 CHART BOOK: A PROFILE OF HEALTH COVERAGE FOR MISSISSIPPI CHILDREN June 2018 Overview UNINSURED ADULTS Mississippi County-Level Data UPDATE PUBLISHED JULY 2017 Researchers from the State Health Access Data
Unemployment in Boston
 Unemployment in Boston Boston Redevelopment Authority Research Division September 2014 This report uses a variety of data sources from the U.S. Census Bureau, including the 2008-2012 and 2012 American
What does your Community look like and how is it changing?
 What does your Community look like and how is it changing? Trends in the State population related to health and health determinants and where you can find this data to support your local work Who is Likely
Poverty in the United Way Service Area
 Poverty in the United Way Service Area Year 4 Update - 2014 The Institute for Urban Policy Research At The University of Texas at Dallas Poverty in the United Way Service Area Year 4 Update - 2014 Introduction
Highlights from the 2004 Florida Health Insurance Study Telephone Survey
 Highlights from the 2004 Florida Health Insurance Study Telephone Survey In 1998, the Florida legislature created the Florida Health Insurance Study (FHIS) to provide reliable estimates of the percentage
Characteristics of Uninsured North Carolinians
 Characteristics North Carolinians North Carolina Institute Medicine 2011-2012 Data Snapshot Nearly one in five non-elderly North Carolinians were uninsured from 2011 to 2012. This represents a slight increase
California Budget Perspective
 calbudgetcenter.org California Budget Perspective 2019-20 @ChrisWHoene @CalBudgetCenter CHRIS HOENE, EXECUTIVE DIRECTOR A PRESENTATION TO: CALIFORNIA FOR ALL: WHAT S IN GOVERNOR NEWSOM S FIRST PROPOSED
Healthy Michigan Plan signing, September 2013
 Healthy Michigan Plan signing, September 2013 Richard Hirth, Ph.D. Professor & Chair Department of Health Management & Policy National Significance of Michigan Medicaid Expansion Model for compromise as
CALIFORNIA ALLIANCE FOR WOMEN S HEALTH LEADERSHIP
 CALIFORNIA ALLIANCE FOR WOMEN S HEALTH LEADERSHIP Data Brief: Health Insurance Coverage of Women Ages 18-64 in California, 1998 Introduction In a survey conducted by the California Alliance for Women s
Under the Patient Protection and Affordable
 October 2018 ACA Reduces Racial/Ethnic Disparities in Health Coverage Differences in the uninsured rate between white, African American, and Asian/Pacific Islander Californians have been eliminated; however,
Review of Registered Charites Compliance Rates with Annual Reporting Requirements 2016
 Review of Registered Charites Compliance Rates with Annual Reporting Requirements 2016 October 2017 The Charities Regulator, in accordance with the provisions of section 14 of the Charities Act 2009, carried
Health Insurance Coverage: Early Release of Estimates From the National Health Interview Survey, 2009
 Health Insurance Coverage: Early Release of Estimates From the National Health Interview Survey, 2009 by Robin A. Cohen, Ph.D., Michael E. Martinez, M.P.H., M.H.S.A., and Brian W. Ward, Ph.D., Division
Profile of Virginia s Uninsured, 2014
 Profile of Virginia s Uninsured, 2014 Michael Huntress Genevieve Kenney Nathaniel Anderson 2100 M Street NW Washington, D.C., 20037 Prepared for The Virginia Health Care Foundation 707 East Main Street,
Health Insurance Coverage in Oklahoma: 2008
 Health Insurance Coverage in Oklahoma: 2008 Results from the Oklahoma Health Care Insurance and Access Survey July 2009 The Oklahoma Health Care Authority (OHCA) contracted with the State Health Access
Presenters Marc J. Smith Mary-Michal Rawling
 Presenters Marc J. Smith Mary-Michal Rawling The Affordable Care Act (ACA) Starting in January 1, 2014 it will be Required that most U.S. citizens and legal residents obtain and maintain healthcare coverage
Health Insurance Coverage in California in 2013 and 2014, After Implementation of the Affordable Care Act, p. 2
 July 2016 Vol. 37, No.6 Health Insurance Coverage in California in 2013 and 2014, After Implementation of the Affordable Care Act, p. 2 A T A G L A N C E This EBRI Notes article presents data on health
SDs from Regional Peer Group Mean. SDs from Size Peer Group Mean
 Family: Population Demographics Population Entire MSA 602894 Central Cities (CC) 227,818 Outside Central Cities 375,076 Percent of Entire MSA 37.79% Population in CC Percent Change in Population from 1999
SDs from Regional Peer Group Mean. SDs from Size Peer Group Mean
 Family: Population Demographics Population Entire MSA 1187941 Central Cities (CC) 511,843 Outside Central Cities 676,098 Percent of Entire MSA 43.09% Population in CC Percent Change in Population from