Emergency Management. December 16, 2010
|
|
|
- Anis Miller
- 6 years ago
- Views:
Transcription


1 Applications of Hazus-MH for Emergency Management December 16, 2010

2 What is Hazus-MH? Free ArcGIS extension Facilitates a risk-based approach to mitigation Identifies and visually displays hazards and vulnerabilities Calculates scientifically-defensible damages, economic losses, and mitigation benefits


3 How does Hazus-MH Support Emergency Management? IDENTIFY vulnerable areas ASSESS level of readiness and preparedness to deal with a disaster before disaster occurs ESTIMATE potential losses from specific hazard events DECIDE on how to allocate resources for most effective and efficient response and recovery PRIORITIZE mitigation measures that need to be implemented to reduce future losses (what if)
4 How Hazus-MH Estimates Losses Produces maps, tables, and reports Analyzes social and economic impacts Considers what is at risk Identifies hazard Analyzes physical landscape


5 Damage/Loss Functions Assess damage and losses based on hazard conditions Example Hurricane model has 4,818 unique building categories 45 damage/loss functions for each building model Total of unique Total of 216,810 unique damage/loss curves
6 Hazus-MH Output Physical Impacts Physical Impacts Social Impacts Economic impacts Social Impacts Economic Impacts
7 Hazus-MH Output Direct Damage age General Building Stock Essential Facilities High Potential Loss Facilities Transportation Systems Utility Systems Induced Damage Fire Following Hazardous Materials Release Direct Losses Indirect Losses Earthquake Ground Shaking Ground Failure Flood Frequency Depth Discharge Velocity Hurricane Wind Pressure Missile Rain Debris Generation Cost of Repair Income Loss Crop Damage Casualties Shelter Needs Supply Shortages Sales Decline Opportunity Costs Economic Loss Generic Output


8 Results Formats Tables Maps Reports
9 Supported Hazards Hurricanes Riverine and Coastal Floods Earthquakes
10 User Levels Level 2 Level 3 Input hazard specific data Combinations of local and default hazard, building, and ddamage data Required User Effort and Sophistication Level 1 Default hazard, inventory, and damage information


 and")


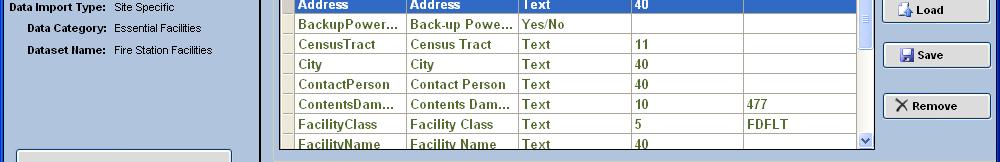
11 Inventory Components Aggregate Inventory Demographics General Building Stock broken down by type (how constructed) and occupancy (how used) Site-Specific Inventory Aggregate g Hazard Specific Inventory (both aggregate and site specific) Site Specific
12 Integrating glocal Data Comprehensive Data Management System
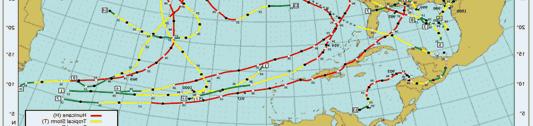
13 Hurricane Model Overview


14 Supported States Model includes 22 gulf and east coast states as well as Hawaii


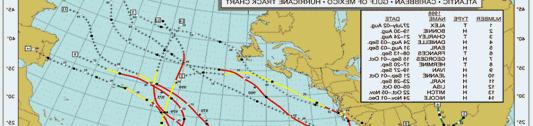
15 Scenario Options Individual storms User-defined Historical Probabilistic
16 Direct Physical Damage Essential Facilities Loss of Use (Days) Damage State Probability bilit


17 Debris Building Debris Wood and Masonry Steel and Concrete Tree Blowdown Tree Debris Eligible Tree Debris Building density, length of roads, and census block shapes Trees downed in close proximity to streets, highways, h or buildings make up the great majority of trees brought to the curb for collection and ddisposal


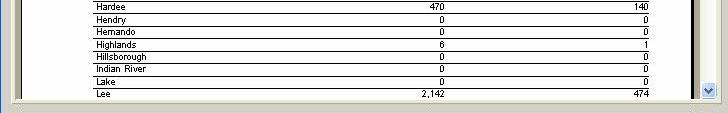
18 Direct Economic Losses General Building Stock Loss Building Losses Structural Non-structural Content Business Inventory Business Interruption Losses Wage Income Rental & Relocation Proprietor Economic Losses from a Hazus-MH Simulated Hurricane Scenario
19 Direct Social Losses Shelter Number of Displaced Households Temporary Housing Requirements Based on Demographic Considerations [Ethnicity, Income, Age, Ownership] Shelter Camp during the 1906 San Francisco Earthquake
20 Flood Model Overview
21 Scenario Options Return Period Discharge Value Flood Information Tool Input Quick Look Enhanced Quick Look User Provided Depth Grid HEC-RAS
22 Depth-Damage Curves Damage to buildings and infrastructure is estimated using depthdamage curves Damage as % of replacement cost 0% 50% 100% 0 ft 5 ft 10 ft 15 ft Depth of water
23 Results General Building Stock Results By Amount of Damage occupancy, building type (sq. ft.) by count By Dollar Losses full and depreciated replacement value building, content, t and inventory losses costs of relocation, wage, income, and rental losses direct employee output losses and employment loss (days)
24 Results Essential facilities Building and content losses Functionality assessment (yes/no) Restoration time to 100% functionality Lifeline losses (for selected components) Losses to structures and equipment Functionality assessment (yes/no)
25 Results Vehicle Losses Agriculture Losses Shelter Requirements Indirect Economic Losses Income and employment impact with Income and employment impact with and without aid by market sector
26 Earthquake Model Overview


27 Scenario Options User defined events Historic events Probabilistic events

28 Direct Physical Damage Structural and nonstructural damage estimates for buildings Damage state probability counts and losses Technical Manual chapter 5 describes the conditions that exist at each damage state by building type
29 Direct Physical Damage Essential Facilities Restoration Time to 100% Functionality Damage State t Probability bilit Damage states are described in chapters 5 and 6 of Technical Manual


30 U tility y D am ageg Pipeline and Facility Damages, Losses, and Functionality for Potable Water, Waste Water, Oil Systems and Natural Gas. Functionality at 1, 3, 7, 14, 30 and 90 days Number of households without Potable Water and Electricity


31 Transportation Damage Highway, Railway, Light Rail Bridge, Segment and Tunnel Losses, Damages and Functionality Bus, Port, and Ferry Facility Damage, Loss, and Functionality Airport Runway and Facility Damage, Loss and Functionality


32 Induced Physical Damage Fire Following Number of Ignitions Extent t of Burned Areas Debris Generation Wood and Masonry Steel and Concrete
33 Direct Economic Losses Building Losses (GBS) Structural Non-structural Content Business Inventory Business Interruption Wage Income Rental & Relocation Proprietor Lifelines Direct Cost of Repair
34 Social Losses - Casualties By severity level By time of day (2 am, 2 pm, 5 pm) Severity 1 - No Hospitalizations Severity 2 Hospitalization Severity 3 Life Threatening Severity 4 - Fatality


35 Social Losses - Shelter Number of Displaced Households Temporary Housing Requirements
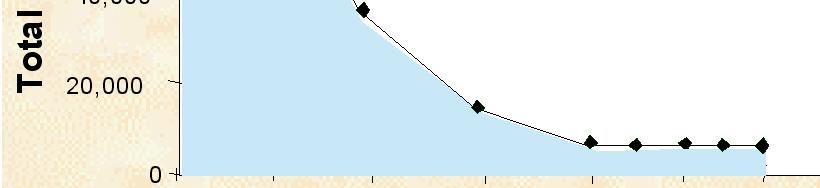
36 Indirect Economic Losses Modeling of 10-30,000 Economic Sectors -20,000 IMPLAN Data Income Changes vs. Time Employment Changes vs. Time e Million] [$ Inco Income Change Chang [$ Million] -10, ,000 20,000 30,000 Agriculture Construction Agriculture Construction 40, FIRE Government FIRE Government 50,000 Manufacturing Mining Manufacturing Mining 60,000 Miscellaneous Service Miscellaneous Service Trade Transportation Trade Transportation 70, Year 1 Year 2 Year 3 Year 4 Year 5 Economic Sectors Elapsed Time Modeled after Earthquake in Hazus
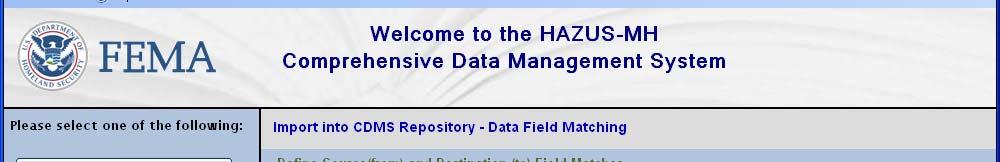
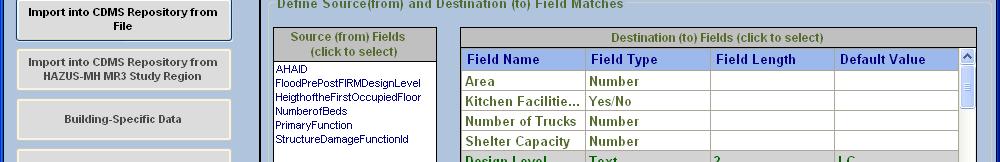
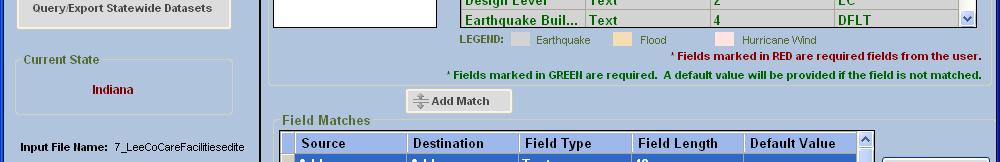
37 What is CDMS? CDMS is a tool developed by FEMA to support integration of locally developed inventory data into the Hazus-MH loss estimation process. Pi Primary functions Support transfer of data into and out of the master state databases Provide validation of user supplied data Allow users to query and export inventory information


38 User Groups Latest news User feedback User group contacts and
39 Training Classroom Courses ArcGIS for Emergency Managers Basic Hazus-MH Hazus-MH for Floods Hazus-MH for Earthquakes Hazus-MH for Hurricanes Using Hazus for Risk Assessment Comprehensive Data Management for Hazus-MH Hazus for Floodplain Managers Using Hazus for Disaster Operations Virtual Courses Seven courses now available on the ESRI Virtual Campus
40


41 Thanks for your attention! /prevent/hazus/
Survey of Hazus-MH: FEMA s Tool for Natural Hazard Loss Estimation
 Survey of Hazus-MH: FEMA s Tool for Natural Hazard Loss Estimation What is Hazus? Software tools and support system designed by FEMA for the purpose of providing communities with the means to identify
Overview of HAZUS for Earthquake Loss Estimation. September 6, 2012
 Overview of HAZUS for Earthquake Loss Estimation September 6, 2012 What is HAZUS? Risk assessment tool for analyzing potential losses from hurricane, flood, and earthquake Uses current scientific and engineering
Overview of HAZUS. December 6, 2011
 Overview of HAZUS December 6, 2011 What is HAZUS? Risk assessment tool for analyzing potential losses from hurricane, flood, and earthquake Uses current scientific and engineering concepts in a GIS to
Integrating Hazus into the Flood Risk Assessment
 Integrating Hazus into the Flood Risk Assessment GAFM Conference, March 22, 2016 Mapping Assessment Planning Agenda What is Hazus & Risk Assessment? Census Block vs. Site Specific Analysis User Defined
Mapping Flood Risk in the Upper Fox River Basin:
 Mapping Flood Risk in the Upper Fox River Basin: Vulnerable Populations and Adverse Health Effects Presented by: Angelina Hanson STUDY AREA: Wisconsin's Upper Fox River Basin Total Population 139,309.
National Capitol Region HAZUS User Group Call
 Listen to the recording here to follow along with the presentation: http://www.freeconferencecalling.com/recordings/recording.aspx?fileid=l AF3494_04252013070630062_1154707&bridge=697620&email=&account
Hazus: Estimated Damage and Economic Losses. South Carolina United States
 Hurricane Florence Advisory 61, 14 September 2018 1100 EST (1500Z) Hazus: Estimated Damage and Economic Losses United States Caution: Due to the level of uncertainty associated with the current advisory
Leveraging HAZUS for Risk Assessment Analysis within Risk MAP
 Leveraging HAZUS for Risk Assessment Analysis within Risk MAP Jen Meyer - FEMA Region X Shane Parson - RAMPP PTS Team (URS Corp.) 2010 HAZUS Conference - August 2010 The Paradigm Shift: Map Mod to Risk
Garfield County NHMP:
 Garfield County NHMP: Introduction and Summary Hazard Identification and Risk Assessment DRAFT AUG2010 Risk assessments provide information about the geographic areas where the hazards may occur, the value
ANNEX B: TOWN OF BLUE RIVER
 ANNEX B: TOWN OF BLUE RIVER B.1 Community Profile Figure B.1 shows a map of the Town of Blue River and its location within Summit County. Figure B.1. Map of Blue River Summit County (Blue River) Annex
Avon. Challenges. Estimated Damages from 100- Year Flood
 Avon Avon is a suburban town in north-central Connecticut with a population of about 18,000. It has an average elevation of about 350 ft. The Town encompasses 23.5 square miles, lying entirely within the
Use of FEMA Non regulatory Flood Risk Products in Planning
 Use of FEMA Non regulatory Flood Risk Products in Planning Georgia Association of Floodplain Managers Annual Conference March 24, 2016 What are the Non regulatory Flood Risk products? Go beyond the basic
BGC Project Memorandum
 Suite 500-1045 Howe Street, Vancouver, British Columbia, Canada. V6Z 2A9 Telephone (604) 684-5900 Fax (604) 684-5909 BGC Project Memorandum To: Attention: CANHUG Meeting Participants From: Kris Holm, BGC
National Capitol Region HAZUS User Group Call
 Click here to listen to the audio. National Capitol Region HAZUS User Group Call June 28, 2017 11:00 AM ET NCR HUG Call Details Conference Call Details: 1. Dial-in: 1-712-770-8023 2. Conference code: 926757
Multi-Jurisdictional Hazard Mitigation Plan. Data Collection Questionnaire. For Local Governments
 Multi-Jurisdictional Hazard Mitigation Plan Data Collection Questionnaire County: For Local Governments Jurisdiction: Return to: Marcus Norden, Regional Planner BRP&EC Please complete this data collection
VULNERABILITY ASSESSMENT
 SOUTHSIDE HAMPTON ROADS HAZARD MITIGATION PLAN VULNERABILITY ASSESSMENT INTRODUCTION The Vulnerability Assessment section builds upon the information provided in the Hazard Identification and Analysis
Seismic Benefit Cost Analysis
 Seismic Benefit Cost Analysis Presented by: Paul Ransom Hazard Mitigation Branch Overview of BCA Generally required for all FEMA mitigation programs: HMGP (404) and PA (406) FMA PDM Overview for BCA The
Risk Assessment Training Cape May County, NJ. FEMA REGION II December 13, :00 pm
 Risk Assessment Training Cape May County, NJ FEMA REGION II December 13, 2011 1:00 pm Agenda Welcome and Introductions Objectives NJ Disaster Recovery Efforts Risk MAP Non-Regulatory Products & Risk Assessment
Flood Risk Assessment in the
 Georgia Flood M.A.P. Program Flood Risk Assessment in the Upper Chattahoochee h h River Basin GAFM Annual Conference March 28, 2012 Agenda Map Mod to Risk MAP (Georgia Flood M.A.P.) transition Flood Risk
Economic Analysis of a Hurricane Event In Hillsborough County, Florida. Category 3 and 5 Hurricane Events
 Economic Analysis of a Hurricane Event In Hillsborough County, Florida Category 3 and 5 Hurricane Events February 2009 Economic Analysis of a Catastrophic Event In Hillsborough County, Florida Category
Multi-Hazard Damage and Loss Estimates to Buildings and Lifelines. M. Capozzo, A. Rizzi, A. Barbosa, G.P. Cimellaro
 Multi-Hazard Damage and Loss Estimates to Buildings and Lifelines M. Capozzo, A. Rizzi, A. Barbosa, G.P. Cimellaro 1 Introduction In this research we examine and compare the vulnerabilities of a community
APPENDIX 1 FEMA MITIGATION GRANT PROGRAMS
 APPENDIX 1 FEMA MITIGATION GRANT PROGRAMS 2016 FEMA FUNDING POSSIBILITIES FOR SCHOOL DISTRICTS IN WASHINGTON Overview For public entities in Washington, including school districts, FEMA mitigation funding
The Citadel. Multi-Hazard Mitigation Disaster Resistant University Plan
 The Citadel Multi-Hazard Mitigation Disaster Resistant University Plan Project Objective To Develop a Disaster Resistant University Hazard Mitigation Plan Identify Hazards Profile Hazards Inventory Assets
Flood Risk Products. New Techniques for Identifying and Communicating Flood Risk
 Flood Risk Products New Techniques for Identifying and Communicating Flood Risk Mark Zito, GISP, CFM GIS Specialist Amol Daxikar, GISP, CFM Project Manager March 28, 2012 1% Flood with 3 Feet Sea Level
Planning for SLR Resiliency in Virginia Beach
 Old Dominion University ODU Digital Commons May 18, 2016: The Economic Impacts of Sea-Level Rise in Hampton Roads Hampton Roads Intergovernmental Pilot Project: Meetings 5-18-2016 Planning for SLR Resiliency
Comparing HAZUS Flood Loss Estimates Across Hazard Identification Methods and Building Stock Inventory Data. Albion Township Dane County, Wisconsin
 Across Hazard Identification Methods and Building Stock Inventory Data Albion Township Dane County, Wisconsin Prepared for the Association of State Floodplain Managers September 1, 2010 Across Various
Challenges in Mitigation of NYU Langone Medical Center after Hurricane Sandy
 2016 GAFM Technical Conference Challenges in Mitigation of NYU Langone Medical Center after Hurricane Sandy Ranko S. Pudar, PE, CFM, PMP Institutional Use of BCA Benefit-Cost Analysis used by several federal
Non Regulatory Risk MAP Products Flood Depth and Probability Grids
 Non Regulatory Risk MAP Products Flood Depth and Probability Grids Virginia Floodplain Management Association 2015 Floodplain Management Workshop October 29th, 2015 Nabil Ghalayini, P.E., PMP, D.WRE, CFM
4 TH ANNUAL CAPE COASTAL CONFERENCE. Adaptation Planning, Environmental Economics and Community Engagement
 4 TH ANNUAL CAPE COASTAL CONFERENCE THE RESILIENT CAPE COD PROJECT Adaptation Planning, Environmental Economics and Community Engagement K r i s t y S e n a t o r i, Cape Cod Commission NOAA COASTAL RESILIENCY
Challenges in Mitigation of NYU Langone Medical Center after Hurricane Sandy
 2015 ASFPM National Conference Challenges in Mitigation of NYU Langone Medical Center after Hurricane Sandy Ranko S. Pudar, PE, CFM, PMP 2012 Hurricane Sandy Total death toll 285 (125 US) $62 billion in
Truckloads (at 25 tons/truck) of building debris 90
 of building debris 90") Marlborough Marlborough is a rural community in Hartford County covering a land area of 23.3 square miles and with an estimated population of 6,410. Elevation ranges from about 160 to 800 feet. The Town
Marlborough Marlborough is a rural community in Hartford County covering a land area of 23.3 square miles and with an estimated population of 6,410. Elevation ranges from about 160 to 800 feet. The Town
Findings/Debrief Meeting September 9, CDOT R4 Headquarters Big Thompson Conference Room W 10 th St. Greeley, CO 80634
 Findings/Debrief Meeting September 9, 2016 CDOT R4 Headquarters Big Thompson Conference Room 10601 W 10 th St. Greeley, CO 80634 Discovery Review & Outcome May 25 Discovery Meeting Summary Summarize Data
PHASE 2 HAZARD IDENTIFICATION AND RISK ASSESSMENT
 Prioritize Hazards PHASE 2 HAZARD IDENTIFICATION AND After you have developed a full list of potential hazards affecting your campus, prioritize them based on their likelihood of occurrence. This step
Simsbury. Challenges Capitol Region Natural Hazards Mitigation Plan Update - Page 356
 Simsbury Simsbury is a suburban community of about 23,600 located in the western portion of the Capitol Region. Its land area encompasses 33.9 square miles. Elevation in town generally ranges from about
Risk Assessment Training Union County, NJ. FEMA REGION II February 17, :00 am
 Risk Assessment Training Union County, NJ FEMA REGION II February 17, 2012 11:00 am Agenda Welcome and Introductions Objectives Risk MAP Non-Regulatory Products & Datasets FEMA s Coordinated Needs Management
Sussex County All Hazard Mitigation Plan. Plan Executive Summary
 Sussex County All Hazard Mitigation Plan Plan Executive Summary March 2010 SUSSEX COUNTY ALL HAZARD MITIGATION PLAN SUMMARY March 2010 For questions and to make comments on this document, contact: Joseph
HAZUS th Annual Conference
 HAZUS 2014 7 th Annual Conference Welcome 2 Nicky Hastings, Natural Resources Canada REFLECTING ON AN EARTHQUAKE ANALYSIS FOR A MID-SIZED URBAN COMMUNITY IN WESTERN CANADA Opportunity or Liability? Resilience
EVALUATING OPTIMAL STRATEGIES TO IMPROVE EARTHQUAKE PERFORMANCE FOR COMMUNITIES
 EVALUATING OPTIMAL STRATEGIES TO IMPROVE EARTHQUAKE PERFORMANCE FOR COMMUNITIES Anju GUPTA 1 SUMMARY This paper describes a new multi-benefit based strategy evaluation methodology to will help stakeholders
PART 3 LOCAL MITIGATION PLANS
 PART 3 LOCAL MITIGATION PLANS Local Mitigation Plan requirements in 44 CFR, Part 201.6 of the Interim Final Rule (the Rule) apply to both local jurisdictions and Tribal governments that elect to participate
Challenges. Estimated Damages from 100-Year Flood
 Newington Newington is a fully suburban town in central Connecticut with a population of about 30,562. The Town encompasses 13.2 square miles and ranges in elevation from 40-350 feet above sea level. The
ASFPM Partnerships for Statewide Mitigation Actions. Alicia Williams GIS and HMP Section Manager, Amec Foster Wheeler June 2016
 ASFPM Partnerships for Statewide Mitigation Actions Alicia Williams GIS and HMP Section Manager, Amec Foster Wheeler June 2016 Summary The Concept Leveraging Existing Data and Partnerships to reduce risk
Town of Montrose Annex
 Town of Montrose Annex Community Profile The Town of Montrose is located in the Southwest quadrant of the County, east of the Town of Primrose, south of the Town of Verona, and west of the Town of Oregon.
Delaware Bay / River Coastal Flood Risk Study. FEMA REGION II and III September 19, 2012
 Delaware Bay / River Coastal Flood Risk Study FEMA REGION II and III September 19, 2012 Agenda Risk MAP Program Overview Risk MAP Non-Regulatory Products & Datasets Region II New Jersey Coastal Flood Study
10/23/2014. Presented by: Erike Young, MPPA, CSP, ARM-E. Public Sector Disaster Planning/Emergency Response
 Presented by: Erike Young, MPPA, CSP, ARM-E 1 Public Sector Disaster Planning/Emergency Response 2 1 3 Disaster defined as an accidental or intentional event that causes significant disruption to an entity
The AIR Typhoon Model for South Korea
 The AIR Typhoon Model for South Korea Every year about 30 tropical cyclones develop in the Northwest Pacific Basin. On average, at least one makes landfall in South Korea. Others pass close enough offshore
According to the U.S. Geological
 Estimating economic losses in the Bay Area from a magnitude-6.9 earthquake Data from the BLS Quarterly Census of Employment and Wages are used to analyze potential business and economic losses resulting
A Multihazard Approach to Building Safety: Using FEMA Publication 452 as a Mitigation Tool
 Mila Kennett Architect/Manager Risk Management Series Risk Reduction Branch FEMA/Department of Homeland Security MCEER Conference, September 18, 2007, New York City A Multihazard Approach to Building Safety:
Effective Flood Risk Assessment Methodologies
 Flood Risk Management and Urban Resilience Workshop II May 28-29, 2013 Venue: COEX, Seoul, Republic of Korea Effective Flood Risk Assessment Methodologies National Disaster Management Institute, NDMI Tae
9.10 HEIDELBERG TOWNSHIP
 9.10 HEIDELBERG TOWNSHIP This section presents the jurisdictional annex for Heidelberg Township. A. HAZARD MITIGATION PLAN POINT OF CONTACT Name Title/ Department Address Telephone Fax Email Primary Point
Catastrophe Risk Engineering Solutions
 Catastrophe Risk Engineering Solutions Catastrophes, whether natural or man-made, can damage structures, disrupt process flows and supply chains, devastate a workforce, and financially cripple a company
New Tools for Mitigation & Outreach. Louie Greenwell Stantec
 New Tools for Mitigation & Outreach Louie Greenwell Stantec Our Discussion Today Background What is Risk MAP? FEMA Products Overview of RiskMAP Data Sets Changes Since Last FIRM Depth and Analysis Grids
G318 Local Mitigation Planning Workshop. Module 2: Risk Assessment. Visual 2.0
 G318 Local Mitigation Planning Workshop Module 2: Risk Assessment Visual 2.0 Unit 1 Risk Assessment Visual 2.1 Risk Assessment Process that collects information and assigns values to risks to: Identify
Kentucky Risk MAP It s not Map Mod II
 Kentucky Risk MAP It s not Map Mod II Risk Mapping Assessment and Planning Carey Johnson Kentucky Division of Water carey.johnson@ky.gov What is Risk MAP? Risk Mapping, Assessment, and Planning (Risk MAP)
in coordination with Peoria County, Planning and Zoning Department
 Prepared by Amec Foster Wheeler Environment & Infrastructure Hazard Mitigation and Emergency Management Program in coordination with Peoria County, Planning and Zoning Department The purpose of hazard
Wildfire and Flood Hazards, Using GIS Tools to Assess Risk
 Wildfire and Flood Hazards, Using GIS Tools to Assess Risk Floodplain Management Association Conference, Rancho Mirage, CA September 2015 Thoughts To Keep In Mind What advantages are there in looking at
SECTION 3: VULNERABILITY ASSESSMENT
 SECTION 3: VULNERABILITY ASSESSMENT This section provides an assessment the potential impact the various hazards to which Manatee County is vulnerable. The first objective this section is to identify the
C o p e r n i c u s E m e r g e n c y M a n a g e m e n t S e r v i c e f o r R i s k p l a n n i n g a n d R e c o v e r y
 C o p e r n i c u s E m e r g e n c y M a n a g e m e n t S e r v i c e f o r R i s k p l a n n i n g a n d R e c o v e r y Copernicus Service Copernicus EU Copernicus EU Copernicus EU www.copernicus.eu
Overview of Capabilities and Current Limitations
 Overview of Capabilities and Current Limitations Overview of the National Flood Risk Characterization Tool (NFRCT) Map based viewer of relative flood risk around the U.S., with supporting reports for more
Implementing risk-based asset management strategies
 Implementing risk-based asset management strategies 2018. 04. 17 Disaster Resilience by Design The challenge for local governments The Challenge for Local Governments Landslides Debris Flows Wildfire Wind
RISK MANAGEMENT NEXT GENERATION
 RISK MANAGEMENT NEXT GENERATION STATE UPDATE July 2014 Marc Stanard / John Dorman Risk Management Key Components and National Status Risk Monitoring No digital tracking Big Elephant to Track Not Tied to
Mitigation Success Publications
 The following publications are a sample of the many and varied documents that have been produced by States, associations and communities. MULTI-HAZARDS FEMA 294 Report on Costs and Benefits of Natural
9.2 ALBURTIS BOROUGH. This section presents the jurisdictional annex for Alburtis Borough. A. HAZARD MITIGATION PLAN POINT OF CONTACT
 9.2 ALBURTIS BOROUGH This section presents the jurisdictional annex for Alburtis Borough. A. HAZARD MITIGATION PLAN POINT OF CONTACT Name Title/ Department Address Telephone Fax Email Primary Point of
The AIR Coastal Flood Model for Great Britain
 The AIR Coastal Flood Model for Great Britain The North Sea Flood of 1953 inundated more than 100,000 hectares in eastern England. More than 24,000 properties were damaged, and 307 people lost their lives.
Vision to Action: Creating and Using a Flood Risk Assessment for Identifying Mitigation Options
 Vision to Action: Creating and Using a Flood Risk Assessment for Identifying Mitigation Options Lisa Graff, CFM, GISP Clayton Ballerine, CFM Brad McVay, CFM, GISP University of Illinois Prairie Research
Modeling Extreme Event Risk
 Modeling Extreme Event Risk Both natural catastrophes earthquakes, hurricanes, tornadoes, and floods and man-made disasters, including terrorism and extreme casualty events, can jeopardize the financial
Pre-Earthquake, Emergency and Contingency Planning August 2015
 RiskTopics Pre-Earthquake, Emergency and Contingency Planning August 2015 Regions that are regularly exposed to seismic events are well-known, e.g. Japan, New Zealand, Turkey, Western USA, Chile, etc.
Situation: the need for non-structural flood risk reduction measures
 Evaluating benefits of non-structural measures in flood risk management feasibility studies At left: Example of a house on an open foundation Source Asheville, NC (undated) By Steve Cowdin, CFM; Natalie
A GIS BASED EARTHQUAKE LOSSES ASSESSMENT AND EMERGENCY RESPONSE SYSTEM FOR DAQING OIL FIELD
 A GIS BASED EARTHQUAKE LOSSES ASSESSMENT AND EMERGENCY RESPONSE SYSTEM FOR DAQING OIL FIELD Li Li XIE, Xiaxin TAO, Ruizhi WEN, Zhengtao CUI 4 And Aiping TANG 5 SUMMARY The basic idea, design, structure
SECTION 4: HAZARD IDENTIFICATION AND RISK ASSESSMENT 156
 Figure 79: SECTION 4: HAZARD IDENTIFICATION AND RISK ASSESSMENT 156 Figure 80: SECTION 4: HAZARD IDENTIFICATION AND RISK ASSESSMENT 157 Figure 81: SECTION 4: HAZARD IDENTIFICATION AND RISK ASSESSMENT 158
Preface UPPER SPOKANE WATERSHED RISK REPORT KOOTENAI COUNTY, IDAHO
 Risk Report This Risk Report covers the Upper Spokane Watershed study area and is specific to Kootenai County and its participating communities: The Cities of Post Falls, Coeur d Alene, Hayden Lake, Hayden,
EXECUTIVE SUMMARY. Greater Greenburgh Planning Area Planning Process
 EXECUTIVE SUMMARY The Greater Greenburgh Planning Area All-Hazards Mitigation Plan was prepared in response to the Disaster Mitigation Act of 2000 (DMA 2000). DMA 2000 requires states and local governments
TERREBONNE PARISH HAZARD MITIGATION PLAN UPDATE
 TERREBONNE PARISH HAZARD MITIGATION PLAN UPDATE HAZARD MITIGATION PLAN UPDATE COMMITTEE KICK-OFF MEETING May 22, 2014 A World of Solutions 0 PRESENTATION AGENDA I. INTRODUCTIONS AND WELCOME II. PURPOSE,
APPENDIX H TOWN OF FARMVILLE. Hazard Rankings. Status of Mitigation Actions. Building Permit Data. Future Land Use Map. Critical Facilities Map
 APPENDIX H TOWN OF FARMVILLE Hazard Rankings Status of Mitigation Actions Building Permit Data Future Land Use Map Critical Facilities Map Zone Maps Hazard Rankings (From Qualitative Assessment and Local
Upper Joachim Creek Public Survey on Potential Flood Risk Reduction
 Upper Joachim Creek Public Survey on Potential Flood Risk Reduction This survey is intended to help the interagency planning committee to receive public feedback on specific flood risk reduction techniques,
10/5/2015. What Makes a Sound Floodplain Management Program? What are the Flood Problems in your Community?
 The Community Rating System (CRS) and Hazard Mitigation Planning Preparing Your Community Through Common Program Goals September 3, 2015 What Makes a Sound Floodplain Management Program? Know your community
*How Federal Policy. Causes Flood Disasters. Leslie A. Bond, CFM LA Bond Associates
 *How Federal Policy Causes Flood Disasters Leslie A. Bond, CFM LA Bond Associates *The high cost of flood disasters *We do not know what floods cost. *Published estimates do not include all costs of disasters.
7. Understand effect of multiple annual exposures e.g., 30-yr period and multiple independent locations yr event over 30 years 3%
 I. FLOOD HAZARD A. Definition 1. Hazard: probability of water height 2. At a Specific XY floodplain location; 3. Z can be expressed as elevation (NAVD88); gauge height; height above ground (depth). 4.
Flood Hazards & Infrastructure Risk in the Lower Mainland Towards a Regional Strategy for Risk Reduction
 Flood Hazards & Infrastructure Risk in the Lower Mainland Towards a Regional Strategy for Risk Reduction Fraser Basin Council Infrastructure Sector Workshop November 5, 2018 Lower Mainland Flood Management
TERRORISM MODELING. Chris Folkman, Senior Director, Product. Copyright 2015 Risk Management Solutions, Inc. All Rights Reserved.
 TERRORISM MODELING Chris Folkman, Senior Director, Product 1 What is a catastrophe model and why use one? AGENDA Terrorism modeling, and how it differs from natural catastrophe modeling The terrorism threat
Perspectives on Earthquake Risk Assessment and Management in Trinidad and Tobago
 Perspectives on Earthquake Risk Assessment and Management in Trinidad and Tobago Jacob Opadeyi Professor and Head Department of Geomatics Engineering and Land Management, The University of the West Indies,
CHAPTER THREE Natural Hazard Mitigation Strategy
 CHAPTER THREE Natural Hazard Mitigation Strategy Chapter 3 Section All Sections Updates to Section Revised Natural Hazards Introduction and all Sections to change Natural Hazards Subcommittee to Committee.
AIR Worldwide Analysis: Exposure Data Quality
 AIR Worldwide Analysis: Exposure Data Quality AIR Worldwide Corporation November 14, 2005 ipf Copyright 2005 AIR Worldwide Corporation. All rights reserved. Restrictions and Limitations This document may
Understanding CCRIF s Hurricane, Earthquake and Excess Rainfall Policies
 Understanding CCRIF s Hurricane, Earthquake and Excess Rainfall Policies Technical Paper Series # 1 Revised March 2015 Background and Introduction G overnments are often challenged with the significant
September Three Steps for Implementing a Complete Flood Management Plan
 September 2016 Three Steps for Implementing a Complete Flood Management Plan Copyright 2016 Esri All rights reserved. Printed in the United States of America. The information contained in this document
Risk Assessment Framework. Levee Ready Columbia
 Risk Assessment Framework Levee Ready Columbia November 23, 2015 Today s Discussion Level of Protection Levees and Risk Tolerable Risk Guidelines Applying Tolerable Risk Guidelines Levees and Level of
Proactive Location Identification for Emergency Response and 911 Purposes
 Proactive Location Identification for Emergency Response and 911 Purposes Identifying Commercial Properties, Certificates of Occupancies, and Boat Docks for 911 Purposes Victoria Ogaga E911 Coordinator
Michael Taylor, PE, CFM Project Manager, AECOM August 25, 2015
 Promoting FEMA s Flood Risk Products in the Lower Levisa Watershed Michael Taylor, PE, CFM Project Manager, AECOM August 25, 2015 Agenda Study Background Flood Risk Product Overview AOMI and Mitigation
East Hartford. Challenges
 East Hartford The Town of East Hartford is a suburban community of approximately 52,212 located east of the City of Hartford and west of the Town of Manchester. The Town covers slightly more than 18 square
Natural Hazard Mitigation Saves:
 Natural Hazard Mitigation Saves: 2018 Interim Report Summary of Findings BCRs for Mitigation Strategies Studied (from Highest to Lowest) Adopting Model Codes Saves $11 per $1 Spent Federal Mitigation Grants
PLANNING PROCESS. Table of Contents. List of Tables
 PLANNING PROCESS Table of Contents 1.1 Narrative Description of the Planning Process... 1-1 1.2 Steering Committee & Public Involvement... 1-7 1.2.1 Steering Committee Participant Solicitation... 1-7 1.2.2
SECTION 6 - RANGE OF ALTERNATIVE MITIGATION ACTIONS CONSIDERED
 SECTION 6 - RANGE OF ALTERNATIVE MITIGATION ACTIONS CONSIDERED For this hazard mitigation plan to be approved by FEMA, each participating jurisdiction was required to identify and analyze a comprehensive
Risk, Mitigation, & Planning
 Risk, Mitigation, & Planning Lessons from Flooding in the Houston Area Russell Blessing, Samuel Brody & Wesley Highfield CUMULATIVE FLOOD LOSS: 1972-2015 INSURED FLOOD LOSS: 1972-2015 THE HOUSTON-GALVESTON
Adaptation Practices and Lessons Learned
 Adaptation Practices and Lessons Learned Increased Flooding Risk Due To Sea Level Rise in Hampton Roads: A Forum to Address Concerns, Best Practices and Plans for Adaptation Nov. 16, 2012 Virginia Modeling,
ASFPM RECOMMENDED TASK FORCE ACTIONS
 Association of State Floodplain Managers, Inc. 2809 Fish Hatchery Road, Suite 204, Madison, WI 53713 Phone: 608-274-0123 Fax: 608-274-0696 Website: www.floods.org Email: asfpm@floods.org Federal Interagency
Chapter 10 Mitigation
 44.213 Emergency Management Fall 2015 Chapter 10 Mitigation School of Criminology and Justice Studies University of Massachusetts Lowell Understand the general concepts and purposes behind mitigation Know
Flood Risk Outreach Tools for Georgia Communities. GAFM 10 th Annual Conference Presented By: Jarrett Mattli
 Flood Risk Outreach Tools for Georgia Communities GAFM 10 th Annual Conference Presented By: Jarrett Mattli April 13, 2016 Presentation Overview Guidebooks Toolkits Templates Educational Videos Resource
T-318. Hazard Mitigation Section TDEM Recovery, Mitigation, and Standards
 T-318 Local Hazard Mitigation Plan Requirements Hazard Mitigation Section TDEM Recovery, Mitigation, and Standards Raymond Mejia, Lead Hazard Mitigation Planner Samantha Aburto, Hazard Mitigation Planner
National Capitol Region HAZUS User Group Call. December 19, :00 AM EST
 National Capitol Region HAZUS User Group Call December 19, 2013 10:00 AM EST NCR HUG Call Details Conference Call Details: 1. Dial-in: 1-267-507-0240 2. Conference code: 697620 Join the Meeting through
Hurricane Matthew. As of August 24, 2018, the County has received $76,596 in reimbursements from
 Matthew Cost Recovery Update #8 When a Federal disaster is declared, FEMA can reimburse affected entities a percent of their costs. President Obama signed an Emergency Declaration for Florida on October
Federal Grants Provide $6 Benefit for Each $1 Invested
 Federal Grants Provide $6 Benefit for Each $1 Invested Introduction Natural hazards present significant risks to many communities across the United States. Fortunately, there are measures governments,