APPENDIX 1 FEMA MITIGATION GRANT PROGRAMS
|
|
|
- Godwin Davidson
- 6 years ago
- Views:
Transcription
1 APPENDIX 1 FEMA MITIGATION GRANT PROGRAMS 2016
2 FEMA FUNDING POSSIBILITIES FOR SCHOOL DISTRICTS IN WASHINGTON Overview For public entities in Washington, including school districts, FEMA mitigation funding possibilities fall into two main categories: The post-disaster Public Assistance Program which covers at least 75% of eligible emergency response and restoration (repair) costs for public entities whose facilities suffer damages in a presidentially-declared disaster. The Public Assistance Program also may fund mitigation projects for facilities damaged in the declared event. Mitigation grant programs (either pre-disaster or post-disaster) which typically cover 75% of mitigation costs, although in some cases, FEMA mitigation grants provide 90% or 100% funding. These grants programs are summarized below. For more detailed information, see the references to FEMA publications in the narratives below. For the Ocosta School District, the sources of possible FEMA grant funds include the Public Assistance Program, the Hazard Mitigation Grant Program, and the Pre-Disaster Mitigation Program. FEMA Public Assistance Program The objective of the Federal Emergency Management Agency's (FEMA) Public Assistance (PA) Grant Program is to provide funding so that communities can quickly respond to, and recover from, major disasters or emergencies declared by the President. The PA program is sometimes referred to as the 406 program because it is authorized under Section 406 of the Stafford Act which established FEMA s disaster programs. Through the PA Program, FEMA provides supplemental Federal disaster grant assistance for debris removal, emergency protective measures, and the repair, replacement, or restoration of disaster-damaged, publicly-owned facilities and the facilities of certain private non-profit (PNP) organizations.
3 PA funding for school facilities is available only when: There is a presidentially-declared disaster in Washington State, A facility is located in a county included in the disaster declaration, and A facility had damage in the declared disaster event. The PA Program also encourages protection of these damaged facilities from future events by providing assistance for hazard mitigation measures during the recovery process. The PA Program s distinction between repairs and mitigation is important: Repairs restore a damaged facility to its pre-disaster condition, with the possible addition of code-mandated upgrades. Mitigation measures go beyond repairs to make the facility more resistant to damage in future disaster events. Under the PA Program, FEMA funding for repairs of damaged facilities and for the other categories of PA assistance are largely automatic, subject only to FEMA s eligibility criteria. However, mitigation measures under the PA Program and at the discretion of FEMA are not automatically funded. Mitigation measures under PA have to meet eligibility criteria very similar to those for the other FEMA mitigation grant programs, including having a benefit-cost ratio greater than 1.0. However, Public Assistance mitigation projects are automatically determined to be cost effective and a project-specific benefit-cost analysis is not required if the cost of mitigation is no more than the following percentages of the repair costs: 15% of the repair costs for any PA-eligible mitigation project, or 100% of the repair costs for categories of mitigation projects defined in the March 30, 2010 version of FEMA Recovery Policy RP Hazard Mitigation Funding Under Section 406 (Stafford Act). Further details of FEMA s PA programs are available on FEMA s website at: FEMA Mitigation Grant Programs The Federal Emergency Management Agency (FEMA) has three mitigation grant programs which provide federal funds to supplement local funds for specified types of mitigation activities.
4 For school districts, an important eligibility criterion for all FEMA mitigation grants is that a district must have a FEMA-approved hazard mitigation plan or be covered by a city or county FEMA-approved hazard plan for which the district participated in the planning process. There are two distinct types of FEMA mitigation grant programs: 1. The post-disaster Hazard Mitigation Grant Program (HMGP) for which funds are available in Washington State after each presidentially-declared disaster in Washington State. 2. Annual pre-disaster programs for which funds are available nationwide, including: The Pre-Disaster Mitigation (PDM) program which includes mitigation for all natural hazards, and The Flood Mitigation Assistance (FMA) program which includes mitigation for flood only, with a focus predominantly on facilities with flood insurance. Further details of these mitigation grant programs are provided in the following two FEMA publications: Hazard Mitigation Assistance Unified Guidance (July 2013), and Addendum to the Hazard Mitigation Unified Guidance (July 2013). Additional information is available on the FEMA website: Each of the FEMA mitigation grant programs has specific eligibility requirements, applications, and application deadlines, which may vary from year to year. These grant programs are not entitlement programs, but rather are competitive grant programs which require strict adherence to the eligibility and application requirements and robust documentation. All physical mitigation projects (but not mitigation planning) must be cost-effective, which for FEMA means a benefit-cost ratio >1.0. Therefore, most FEMA mitigation projects require completing a benefit-cost analysis using FEMA software and following FEMA s detailed benefitcost analysis guidance. However, there are three categories of mitigation projects which are automatically determined to be cost-effective and thus do not require a project-specific benefit-cost analysis for HMGP and FMA grant applications: Acquisition of properties within a Special Flood Hazard Area year, FEMAmapped floodplain when the structure is substantially damaged. Substantial damage is defined as: damage of any origin sustained by a structure whereby the cost of restoring the structure to its before damaged condition would equal or exceed 50% of the market value of the structure before the damage occurred.
5 Acquisition or elevation projects with a Special Flood Hazard Area that meet the cost limits established in the FEMA Memorandum Cost Effectiveness Determinations for Acquisitions and Elevations in Special Flood Hazard Areas, August 15, Acquisition or relocation of residential structures subject to landslide hazards that meet the criteria in the FEMA Memorandum Use of HMGP Funds for Acquisition or Relocation of Residential Structures Subject to Landslide Hazards, July 22, Hazard Mitigation Grant Program The Hazard Mitigation Grant Program (HMGP) is a post-disaster grant program. HMGP funds are generated following a Presidential Disaster Declaration for Washington State. Declared disasters for Washington are relatively common, often with one or more declarations in a given year for winter storms, floods, or other disasters. The amount of HMGP grant funding available after a given declared disaster is a percentage of total FEMA spending for various other FEMA programs such as the Individual and Family Assistance and Public Assistance programs. Thus, the total amount of HMGP mitigation funds available within Washington will vary from year to year and disaster event to disaster event. In some years, there may be no HMGP funding available. However, after a major disaster, such as the Nisqually earthquake in 2001, a large amount of HMGP funding may be available. The Washington Emergency Management Division (WA-EMD) of the Washington Military Department administers the HMGP in Washington State and sets the priorities and guidelines after each disaster. For HMGP mitigation grants, WA-EMD selects the mitigation projects for funding, with FEMA s only role being to verify that a submitted project meets FEMA s minimum eligibility criteria. HMGP is the most flexible grant program: grants may be possible for any natural hazard and may include hazard mitigation planning and risk assessments as well as physical mitigation projects. For HMGP applications, WA-EMD s application process has included the following steps after a declared disaster in Washington: Public announcement of HMGP funds availability and guidance re: priorities and grant award limits, Review of submitted NOIs and selection of projects for which full applications are requested, Review of submitted applications and requests for additional documentation. Selection of applications to be submitted to FEMA.
6 FEMA approval of grants, for applications that meet FEMA s minimum criteria for eligibility. In past disasters, Washington State has typically provided one-half of the applicants FEMArequired 25% local matching funds for HMGP grants. In this case, the FEMA grant covers 75% of the total project cost, with Washington State and the applicant each providing 12.5%. That is, the local match required has been only 12.5% of the total eligible project cost. However, continuation of the state s 12.5% match in future declared disasters is contingent upon legislative approval. Annual Pre-Disaster Grant Programs FEMA s annual pre-disaster grant programs Pre-Disaster Mitigation (PDM) and Flood Mitigation Assistance (FMA) are contingent upon future congressional approval. WA-EMD processes grant applications for these programs in a step-wise manner generally similar to that described above for HMGP grant applications. However, there are two important differences: For these programs WA-EMD forwards ranked applications to FEMA, but FEMA makes the grant determinations, which may or may not match WA-EMD s rankings. Thus, applications for these programs are competitive nationally, not just within Washington State, although there may be partial set-asides guaranteeing Washington some level of funding, if submitted applications meet FEMA s eligibility criteria. For these grant programs, Washington State does not provide any matching funds; thus, applicants must provide the full FEMA-required local match percentage. Pre-Disaster Mitigation (PDM) Grant Program The PDM grant program is a broad program which includes mitigation projects for any natural hazard as well as mitigation planning grants which must result in the development of a Local Hazard Mitigation Plan. PDM grants typically cover 75% of the costs of mitigation projects up to a maximum federal share of $3,000,000 per project. However, for eligible local government applicants in communities that meet FEMA s definition of small, impoverished community, the Federal share may be 90%.
7 Flood Mitigation Assistance (FMA) The FMA grant program funds only flood projects, with its predominant focus being on flood mitigation projects for properties with flood insurance. FMA special emphasis and priorities on properties which are on FEMA s national listing of Repetitive Flood Loss (RFL) and Severe Repetitive Loss (SRL) properties. FMA grants generally cover 75% of total eligible project costs, with 25% local match required. However, grants for Repetitive Loss properties provide 90% FEMA funding and grants for Severe Repetitive Loss properties provide 100% FEMA funding. General Guidance for FEMA Grant Applications All of FEMA s mitigation grant programs are competitive, either within a given state or nationally. Thus, successful grant applications must be complete, robust, and very well documented. The key elements for successful mitigation project grant applications include: Project locations within high hazard areas. Project buildings or infrastructure that have major vulnerabilities which pose substantial risk of damages, economic impacts, and (especially for seismic projects) deaths or injuries. Mitigation project scope is well defined with at least a conceptual design with enough detail to support a realistic engineering cost estimate for the project. The benefits of the project are carefully documented using FEMA benefit-cost software, with all inputs meticulously meeting FEMA s guidance and expectations. A benefit-cost analysis meeting FEMA s requirements is very often the most critical step in determining a mitigation project s eligibility and competitiveness for FEMA grants. Making sure that the proposed project is eligible for the specific FEMA grant program to which it is being submitted. Making sure that the application is 100% complete with credible information and easy for FEMA to understand. The effort required for developing a good mitigation project and completing a successful grant application varies with the size and complexity of the mitigation project. In some cases, a successful FEMA grant application requires technical expertise, which may be available on-staff within a given local government entity, or which may require outside consulting support. For example, technical expertise may be desired for: Understanding the level of hazard (flood, earthquake, tsunami, etc.) at a given location. Quantifying the vulnerability of the building(s) exposed to the hazard at the project site(s).
8 Developing a preliminary or conceptual engineering design for the mitigation project. Developing a realistic engineering cost estimate for the mitigation project. Completing the benefit-cost analysis in full conformance with FEMA s guidance and expectations, along with robust documentation of the credibility of the inputs into the benefit-cost analysis. Good mitigation projects which address high-risk situations are effective in reducing future damages and losses, with robust, well-documented applications have a reasonable chance of FEMA funding. Conversely, weakly conceived or poorly documented projects have little or no chance of FEMA funding. Guidance for FEMA grant applications is available on the FEMA website ( and in the FEMA guidance document referenced previously. Thorough review of this guidance is strongly encouraged before undertaking a FEMA grant application. Additional guidance is also available on Washington Emergency Management s website ( see Grants category, and from WA-EMD s mitigation staff.
9 APPENDIX 2 PRINCIPLES OF BENEFIT-COST ANALYSIS 2016
10 Introduction Benefit-cost analysis is required for nearly all FEMA mitigation project grant applications for all FEMA grant programs with only three exceptions: Acquisition or relocation of facilities located within FEMA-mapped 100-year floodplains that have been determined to be substantially damaged, and Public Assistance mitigation projects with costs less than 15% of repair costs, and Several types of Public Assistance mitigation projects that have costs less than 100% of repair costs. FEMA s definition of substantial damage is damage of any origin sustained by a structure whereby the cost of restoring the structure to its before damaged condition would equal or exceed 50% of the market value of the structure before the damage occurred. The categories of Public Assistance mitigation projects which do not require benefit-cost analysis are listed in FEMA Disaster Assistance Policy (March 30, 2010). For all FEMA-funded mitigation projects, other than the exceptions noted above, the benefit-cost ratio must be greater than 1.0 for a project to be eligible for FEMA funding. The benefit-cost ratio must be calculated using FEMA s benefit-cost analysis software, with all data inputs consistent with FEMA s guidance and expectations. The primary references for FEMA benefit-cost analysis are: BCA Reference Guide (June, 2009), and Supplement to the Benefit-Cost Analysis Reference Guide (June, 2011). In addition to the above monographs, there are numerous other FEMA publications related to benefit-cost analysis which are available on the FEMA website: Help is also available via: bchelpline@fema.dhs.gov and at What are Benefits? The benefits of a hazard mitigation project are the reduction in future damages and losses; that is, the avoided damages and losses that are attributable to a mitigation project. To conduct benefit-cost analysis of a specific mitigation project, the risk of damages and losses must be evaluated twice: before mitigation and after mitigation, with the benefits being the difference. 6-10
11 The categories of benefits included in FEMA benefit-cost analysis varies with the type of facility being mitigated, the hazard being addressed and the type of mitigation project. Common categories of benefits include the reductions in: building damages, contents damages, displacement costs for temporary quarters if a building is damaged, the economic impacts of loss of service from a damaged facility and casualties. The economic value of avoided deaths and injuries are calculated using FEMA s standard statistical values for deaths and injuries. Some mitigation projects, such as most flood mitigation projects, focus predominantly on reducing future damages and losses. Other mitigation projects, such as most earthquake mitigation projects, focus on reducing casualties as well as reducing damages and losses; in this case, life safety is often the primary motivation for the mitigation project. In some cases, such as tsunami vertical evacuation mitigation projects, life safety is the sole purpose of a mitigation project. More precisely, a benefit-cost ratio is calculated as the net present value of benefits divided by the mitigation project cost. Net present value means that the time value of money must be considered; benefits that accrue in the future are worth less than those that accrue immediately. The FEMA benefit-cost software discussed in the next section automatically calculates the net present value of benefits from data inputs, including the mitigation project useful lifetime, which varies depending on the type of facility and type of project, and the FEMA-mandated discount rate of 7%. Because the benefits of a hazard mitigation project accrue in the future, it is impossible to know exactly what they will be. For example, it cannot be known in advance when a future earthquake or other natural hazard event will occur in a given location or how severe the event will be. However, in most cases, it is possible to estimate the probability of future hazard events. Therefore, the benefits of mitigation projects must be evaluated statistically or probabilistically. Hazard events don t come in only one size. Rather, the severity of every type of natural hazard event can range from minimal to severe. A benefit-cost analysis always considers a range of severity for hazard events, such as the 10-, 50-, 100- and 500-year floods, and the analysis includes estimates of the expected damages and losses for each level of event. The FEMA benefit-cost software integrates such data to determine the average annual damages and losses considering the full range of hazard events. The term average annual damages and losses doesn t mean that such damage and losses occur every year, but rather represents the long term average from hazard events of many different severities and probabilities occurring. 6-11
12 FEMA Benefit-Cost Analysis Software The current version of FEMA s benefit-cost analysis software (Version 5.0) may be downloaded and installed from the FEMA website noted previously. There are seven benefit-cost modules applicable to different types of hazards and different types of mitigation projects: Floods, Hurricane Winds, Earthquake Structural Projects, Earthquake Nonstructural Projects, Tornado Safe Rooms, Wildfire, and Damage Frequency Assessment. The applicability of most of the above BCA modules is self-evident, with a couple of exceptions: The flood BCA module can be used only when a full set of quantitative flood hazard data is available, including first floor elevations of buildings, stream discharge and flood elevation data for four flood return periods (typically, the 10-, 50-, 100- and 500-year events) and stream bottom elevations. For coastal storm surge flooding, the above data are necessary, less the stream discharge and stream bottom elevation data. The Damage Frequency Assessment module is applicable for any natural hazard for which a damage-frequency relationship can be defined from historical data and/or engineering analysis/judgment. All of the BCA modules, except for the Damage Frequency Assessment module, have some built-in data which significantly simplifies the BCA process. However, all of the modules also require a considerable number of user-defined data inputs to complete a benefit-cost analysis. The Damage Frequency Assessment (DFA) module has no built-in data: all of the data inputs are user-defined. The DFA module is the most flexible module, but also the most difficult to use because it requires the most technical expertise to input FEMA-credible data. The Damage Frequency Assessment BCA module is used for the following types of hazards and facilities: Tsunamis, 6-12
13 Landslides, Flood projects where the quantitative flood hazard data necessary to use the flood BCA module are unavailable, Seismic projects for utility or transportation infrastructure, All other natural hazards for which a damage-frequency relationship can be defined, including snow storms, ice storms, erosion, avalanches, and others. Benefit-cost analysis of most hazard mitigation projects is unavoidably complex and requires at least a basic technical understanding of facilities, hazards, vulnerability, risk, and the economic parameters of benefit-cost analysis. For many types of mitigation projects, especially seismic projects, technical support from an engineer is almost always necessary. For some mitigation projects, technical support from subject matter experts with experience in making estimates of damages, casualties, and economic losses for benefit-cost analysis may also be helpful. Benefit-Cost Analysis: Use and Interpretation For FEMA mitigation grants, the immediate use of benefit-cost analysis is to determine whether a project has a benefit-cost ratio above 1.0 and thus meets FEMA s eligibility criterion. However, benefit-cost analysis can also play are larger role in the evaluation and prioritization of mitigation projects. Districts that are considering whether or not to undertake mitigation projects must answer questions that don t always have obvious answers, such as: What is the nature of the hazard problem? How frequent and how severe are hazard events? Do we want to undertake mitigation measures? What mitigation measures are feasible, appropriate, and affordable? How do we prioritize between competing mitigation projects? Are our mitigation projects likely to be eligible for FEMA funding? Benefit-cost analysis is a powerful tool that can help districts provide solid, defensible answers to these difficult socio-political-economic-engineering questions. As noted previously, benefit-cost analysis is required for all FEMA-funded mitigation projects 6-13
14 under both pre-disaster and post-disaster mitigation programs. However, regardless of whether or not FEMA funding is involved, benefit-cost analysis provides a sound basis for evaluating and prioritizing possible mitigation projects for any natural hazard. Overall, benefit-cost analysis provides answers to a central question for hazard mitigation projects: Is it worth it? That is, are the benefits large enough to justify the costs necessary to implement a mitigation project? Whether or not a mitigation project is worth it depends on many factors, including: The level of hazard at a given location, The value and importance of the facility being mitigated, The vulnerability of the facility to the hazard, The cost of the mitigation project, The effectiveness of the mitigation project in reducing future damages, economic losses, and casualties. The best mitigation projects address high risk situations: a high level of hazard for an important facility which has substantial vulnerability to the hazard. All well-designed mitigation projects reduce risk. However, just because a mitigation project reduces risk does not make it a good project. A $1,000,000 project that avoids an average of $100 per year in flood damages is not worth doing, while the same project that avoids an average of $200,000 per year in flood damages is worth doing. Benefit-Cost Analysis Example The principles of benefit-cost analysis are illustrated by the following simplified example. Consider a small building in the town of Acorn, located on the banks of Squirrel Creek. The building is a one story building; about 1500 square feet on a post foundation, with a replacement value of $60/square foot (total building value of $90,000). We have flood hazard data for Squirrel Creek (stream discharge and flood elevation data) and elevation data for the first floor of the house. For this BCA, the FEMA flood BCA module is used, because the necessary quantitative flood hazard data are available. The data built into the BCA module, along with user data inputs, allow the module to calculate the annual probability of flooding in one-foot increments, along with the resulting damages and losses shown in Table A
15 Table A2.1 Damages Before Mitigation Flood Depth Annual Probability Scenario Damages and Annualized Flood $6 400 $ $ $ $ $ $ $ $ $315 Total 5Expected Annual (Annualized) Damages $36and 300 Losses $123 $6 312 Flood depths shown above in Table A2.1 are in one foot increments of water depth above the lowest floor elevation. Thus, a 3" foot flood means all floods between 2.5 feet and 3.5 feet of water depth above the floor. We note that a 0" foot flood has, on average, damages because this flood depth means water plus or minus 6" of the floor; even if the flood level is a few inches below the first floor, there may be damage to flooring and other building elements because of wicking of water. The Scenario (per flood event) damages and losses include expected damages to the building, content, and displacement costs if occupants have to move to temporary quarters while flood damage is repaired. The Annualized (expected annual) damages and losses are calculated as the product of the flood probability times the scenario damages. For example, a 4 foot flood has slightly less than a 1% chance per year of occurring. If it does occur, we expect about $32,100 in damages and losses. Averaged over a long time, 4 foot floods are thus expected to cause an average of about $315 per year in flood damages. Note that the smaller floods, which cause less damage per flood event, actually cause higher average annual damages because the probability of smaller floods is so much higher than that for larger floods. With these data, the building is expected to average $6,312 per year in flood damages. This expected annual or annualized damage estimate does not mean that the building has this much damage every year. Rather, in 6-15
16 most years there will be no floods, but over time the cumulative damages and losses from a mix of relatively frequent smaller floods and less frequent larger floods is calculated to average $6,312 per year. The calculated results in Table A2.1 are the flood risk assessment for this building for the as-is, before mitigation situation. The table shows the expected levels of damages and losses for scenario floods of various depths and also the annualized damages and losses. The risk assessment shown in Table A2.2 shows a high flood risk, with frequent severe flooding which the owner deems unacceptable. The owner explores mitigation alternatives to reduce the risk: the example below is to elevate the house 4 feet. These results are shown in Table A2.2. Table A2.2 Damages After Mitigation Flood Depth (feet) Annual Probability of Flooding Scenario Damages and Losses Per Flood Event Annualized Flood Damages and Losses $0 $ $0 $ $0 $ $0 $ $6 400 $63 Total 5Expected Annual (Annualized) Damages $14 and 300 Losses $49 $112 By elevating the building 4 feet, the owner has reduced the expected annual (annualized) damages from $6,312 to $112 (a 98% reduction) and greatly reduced the probability or frequency of flooding affecting the building. The annualized benefits are the difference in the annualized damages and losses before and after mitigation or $6,312 - $112 = $6,
17 Is this mitigation project worth doing? Common sense says yes, because the flood risk appears high: the annualized damages before mitigation are high ($6,312). To answer this question more quantitatively, we complete our benefit-cost analysis of this project. One key factor is the cost of mitigation. A mitigation project that is worth doing at one cost may not be worth doing at a higher cost. Let s assume that the elevation costs $20,000. This $20,000 cost occurs once, up front, in the year that the elevation project is completed. The benefits, however, accrue statistically over the lifetime of the mitigation project. Following FEMA guidance for this type of project, we assume that this mitigation project has a useful lifetime of 30 years. Money (benefits) received in the future has less value than money received today because of the time value of money. The time value of money is taken into account with present value calculation. We compare the present value of the anticipated stream of benefits over 30 years in the future to the up-front outof-pocket cost of the mitigation project. A present value calculation depends on the useful lifetime of the mitigation project and on what is known as the discount rate. The discount rate may be viewed simply as the interest rate you might earn on the cost of the project if you didn t spend the money on the mitigation project. Let s assume that this mitigation project is to be funded by FEMA, which uses a 7% discount rate to evaluate hazard mitigation projects. With a 30-year lifetime and a 7% discount rate, the present value coefficient which is the value today of $1.00 per year in benefits over the lifetime of the mitigation project is $ That is, each $1.00 per year in benefits over 30 years is worth $12.41 now. The benefit-cost results are now as follows. Table A2.3 Benefit-Cost Results Annualized Benefits $6,200 Present Value Coefficient Net Present Value of Future Benefits $76,942 Mitigation Project Cost $20,000 Benefit-Cost Ratio
18 These results indicate a benefit-cost ratio of Thus, in FEMA s terms, the mitigation project is cost-effective and eligible for FEMA funding. Taking into account the time value of money (essential for a correct economic calculation), results in lower benefits than if we simply multiplied the annual benefits times the project s 30-year useful lifetime. Economically, simply multiplying the annual benefits times the project lifetime would ignore the time value of money and thus would yield an incorrect result. The above discussion of benefit-cost analysis of a flood hazard mitigation project illustrates the basic concepts. The actual FEMA BCA modules calculate each category of damage or loss separately and the specific built-in data and the specific user-input data vary from module to module, depending on the hazard, type of facility, and type of mitigation project. 6-18
 North Mason School District 71 E Campus Dr Belfair WA 98528")
19 HAZARD MITIGATION PLAN NORTH MASON SCHOOL DISTRICT Insert Date the Plan is Effective (Date of Board Adoption After FEMA Approval) North Mason School District 71 E Campus Dr Belfair WA
20 The 2016 North Mason School District s Hazard Mitigation Plan is a living document which will be reviewed and updated periodically. Comments, suggestions, corrections, and additions are enthusiastically encouraged from all interested parties. Please send comments and suggestions to: Cathie Seevers Executive Director of Business & Finance 71 E Campus Dr Belfair WA Cseevers@northmasonschools.org 6-20
21 EXECUTIVE SUMMARY The North Mason School District Hazard Mitigation Plan covers each of the major natural hazards that pose significant threats to the District. The mission statement of the N. Mason School District Hazard Mitigation Plan is to: Proactively facilitate and support district-wide policies, practices, and programs that make the N. MASON School District more disaster resistant and disaster resilient. Making the N. Mason School District more disaster resistant and disaster resilient means taking proactive steps and actions to protect life safety, reduce property damage, minimize economic losses and disruption, and shorten the recovery period from future disasters. This plan is an educational and planning document that is intended to raise awareness and understanding of the potential impacts of natural hazard disasters and to help the District deal with natural hazards in a pragmatic and cost-effective manner. Completely eliminating the risk of future disasters in the N. Mason School District is neither technologically possible nor economically feasible. However, substantially reducing the negative consequences of future disasters is achievable with the implementation of a pragmatic Hazard Mitigation Plan. Mitigation simply means actions that reduce the potential for negative consequences from future disasters. That is, mitigation actions reduce future damages, losses, and casualties. Effective mitigation planning will help the N. Mason School District deal with natural hazards realistically and rationally. That is, to identify where the level of risk from one or more hazards may be unacceptably high and then to find cost effective ways to reduce such risk. Mitigation planning strikes a pragmatic middle ground between unwisely ignoring the potential for major hazard events on one hand and unnecessarily overreacting to the potential for disasters on the other hand. This mitigation plan focuses on the hazards that pose the greatest threats to the District s facilities and people: Earthquake and Wildfire Urban Interface. Other natural hazards that pose lesser threats are addressed briefly. 6-21
22 TABLE OF CONTENTS Chapter One: Introduction 1.1 What is a Hazard Mitigation Plan? 1.2 Why is Mitigation Planning Important for the North Mason School District? 1.3 The North Mason School District Mitigation Plan 1.4 Key Concepts and Definitions 1.5 The Mitigation Process 1.6 The Role of Benefit-Cost Analysis in Mitigation Planning 1.7 Hazard Synopsis Chapter Two: North Mason School District Profile 2.1 District Location 2.2 District Overview 2.3 District Facilities Chapter Three: Mitigation Planning Process 3.1 Overview 3.2 Mitigation Planning Team 3.3 Mitigation Planning Team Meeting 3.4 Public Involvement In the Mitigation Planning Process 3.5 Review and Incorporation of Existing Plans, Studies, Reports and Technical Info. 3.6 Appendix: Meeting Minutes Chapter Four: Goals, Objective and Action Items 4.1 Overview 4.2 Mission Statement 4.3 Mitigation Plan Goals and Objectives 4.4 North Mason School District Hazard Mitigation Plan Action Items Chapter Five: Mitigation Plan Adoption, Implementation and Maintenance 6-22
23 5.1 Overview 5.2 Plan Adoption 5.3 Implementation 5.4 Plan Maintenance and Periodic Updating Chapter Six: Earthquakes 6.1 Introduction 6.2 Washington Earthquakes 6.3 Earthquake Concepts for Risk Assessments 6.4 Earthquake Hazard Maps 6.5 Site Class; Soil and Rock Types 6.6 Ground Failures and Other Aspects of Seismic Hazards 6.7 Seismic Risk Assessment for the North Mason School District s Facilities 6.8 Previous Earthquake Events 6.9 Earthquake Hazard Mitigation Plan Action Items Chapter Seven: Wildland/Urban Interface Fires: 7.1 Overview 7.2 Wildland/Urban Interface Fires 7.3 Wildland and Wildland/Urban Fire Hazard Mapping and Hazard Assessment 7.4 Wildland/Urban Interface Fire Hazard and Risk Assessments 7.5 Mitigation for Wildland/Urban Interface Fires Chapter Eight: Landslide 8.0 Landslide Overview 8.2 Landslide Hazard Mapping and Hazard Assessments 8.3 North Mason School District: Landslide Hazard and Risk Assessment 8.4 Mitigation of Landslide Risk Appendix A: FEMA MITIGATION GRANT PROGRAMS A-1.0 OVERVIEW A-2.0 FEMA Public Assistance Program A-3.0 FEMA Mitigation Grant Programs A-4.0 Hazard Mitigation Grant Program 6-23
24 A-5.0 Annual Pre-Disaster Grant Programs A-5.1 Pre-Disaster Mitigation (PDM) Grant Program A-5.2 Flood Mitigation Assistance (FMA) A-6.0 General Guidance for FEMA Grant Applications Appendix B; PRINCIPLES OF BENEFIT-COST ANALYSIS B-1.0 Introduction B-2.0 What are Benefits? B-3.0 FEMA Benefit-Cost Analysis Software B-4.0 Benefit-Cost Analysis: Use and Interpretation B-5.0 Benefit-Cost Analysis Example Appendix C: PLANNING TEAM PUBLIC INVOLVEMENT DOCUMENTATION 6-24
25 1.0 INTRODUCTION: 1.1 What is a Hazard Mitigation Plan? The North Mason School District Hazard Mitigation Plan covers each of the major natural hazards that pose significant threats to the District. The effects of potential future disaster events on the North Mason School District may be minor - a few inches of water in a street - or may be major - with widespread damages, deaths and injuries, and economic losses reaching millions of dollars. The effects of major disasters on a district and on the communities served by a district can be devastating: the total damages, economic losses, casualties, disruption, hardships, and suffering are often far greater than the physical damages alone. The mission statement of the North Mason School District Hazard Mitigation Plan is to: Proactively facilitate and support district-wide policies, practices, and programs that make the North Mason School District more disaster resistant and disaster resilient. Making the North Mason School District more disaster resistant and disaster resilient means taking proactive steps and actions to protect life safety, reduce property damage, minimize economic losses and disruption, and shorten the recovery period from future disasters. This plan is an educational and planning document that is intended to raise awareness and understanding of the potential impacts of natural hazard disasters and to help the District deal with natural hazards in a pragmatic and cost-effective manner. It is important to recognize that the Hazard Mitigation Plan is not a regulatory document and does not change existing District policies or zoning, building codes, or other ordinances that apply to the District. Completely eliminating the risk of future disasters in the North Mason School District is neither technologically possible nor economically feasible. However, substantially reducing the negative consequences of future disasters is achievable with the implementation of a pragmatic Hazard Mitigation Plan. Mitigation simply means actions that reduce the potential for negative consequences from future disasters. That is, mitigation actions reduce future damages, losses, and casualties. 6-25
26 The North Mason School District mitigation plan has several key elements: 1. Each hazard that may significantly affect the North Mason School District s facilities is reviewed to estimate the probability (frequency) and severity of likely hazard events. 2. The vulnerability of North Mason School District to each hazard is evaluated to determine the likely severity of physical damages, casualties, and economic consequences. 3. A range of mitigation actions are evaluated to identify those with the greatest potential to reduce future damages and losses to the North Mason School District and that are desirable from the community s political and economic perspectives. 1.2 Why is Mitigation Planning Important for the North Mason School District? Effective mitigation planning will help the North Mason School District deal with natural hazards realistically and rationally. That is, to identify where the level of risk from one or more hazards may be unacceptably high and then to find cost effective ways to reduce such risk. Mitigation planning strikes a pragmatic middle ground between unwisely ignoring the potential for major hazard events on one hand and unnecessarily overreacting to the potential for disasters on the other hand. Furthermore, the Federal Emergency Management Agency (FEMA) now requires each local government entity to adopt a multi-hazard mitigation plan to remain eligible for future pre- or post-disaster FEMA mitigation funding. Thus, an important objective in developing this plan is to maintain eligibility for FEMA funding and to enhance the North Mason School District s ability to attract future FEMA mitigation funding. Further information about FEMA mitigation grant programs is given in Appendix 1: FEMA Mitigation Grant Programs. 6-26
27 1.3 The North Mason School District Hazard Mitigation Plan This North Mason School District Hazard Mitigation Plan is built upon a quantitative assessment of each of the major hazards that may significantly affect the North Mason School District, including their frequency, severity, and the campuses most likely to be affected. This assessment draws heavily on statewide data collected for the development of the Washington State K 12 Facilities Hazard Mitigation Plan and on additional district-specific data. These reviews of the hazards and the vulnerability of North Mason School District to these hazards are the foundation of the District s mitigation plan. From these assessments, the greatest threats to the District s facilities are identified. These high risk situations then become priorities for future mitigation actions to reduce the negative consequences of future disasters affecting the North Mason School District. The North Mason School District Hazard Mitigation Plan deals with hazards realistically and rationally and also strikes a balance between suggested physical mitigation actions to eliminate or reduce the negative consequences of future disasters and planning measures which better prepare the community to respond to, and recover from, disasters for which physical mitigation actions are not possible or not economically feasible. 1.4 Key Concepts and Definitions The central concept of mitigation planning is that mitigation reduces risk. Risk is defined as the threat to people and the built environment posed by the hazards being considered. That is, risk is the potential for damages, losses, and casualties arising from the impact of hazards on the built environment. The essence of mitigation planning is to identify facilities in the North Mason School District that are at high risk from one or more natural hazards and to evaluate ways to mitigate (reduce) the effects of future disasters on these high risk facilities. The level of risk at a given location, building, or facility depends on the combination of hazard frequency and severity plus the exposure, as shown in Figure 1 below. 6-27
28 Figure 1.1 Hazard and Exposure Combine to Produce Risk HAZARD EXPOSURE RISK Frequency Value and Threat to the and Severity + Vulnerability of = Community: of Hazard Events Inventory People, Buildings and Infrastructure Risk is generally expressed in dollars (estimates of potential damages and other economic losses) and in terms of casualties (numbers of deaths and injuries). There are four key concepts that govern hazard mitigation planning: hazard, exposure, risk, and mitigation. Each of these key concepts is addressed in turn. HAZARD refers to natural events that may cause damages, losses or casualties, such as earthquakes, tsunamis, and floods. Hazards are characterized by their frequency and severity and by the geographic area affected. Each hazard is characterized differently, with appropriate parameters for the specific hazard. For example, earthquakes are characterized by the probable severity and duration of ground motions while tsunamis are characterized by the areas inundated and by the depth and velocity of the tsunami inundations. A hazard event, by itself, may not result in any negative effects on a community. For example, a flood-prone five-acre parcel may typically experience several shallow floods per year, with several feet of water expected in a 50-year flood event. However, if the parcel is wetlands, with no structures or infrastructure, then there is no risk. That is, there is no threat to people or the built environment and the frequent flooding of this parcel does not have any negative effects on the community. Indeed, in this case, the very frequent flooding (the high hazard) may be beneficial environmentally by providing wildlife habitat, recreational opportunities, and so on. 6-28
29 Figure 1.2 Hazard Alone Does Not Produce Risk HAZARD... The important point is that hazards do not necessarily produce risk to people and property unless there is vulnerable inventory exposed to the hazard. Risk to people, buildings, or infrastructure results only when hazards are combined with an exposure to the hazard. EXPOSURE is the quantity, value, and vulnerability of the built environment (inventory of people, buildings, and infrastructure) in a particular location subject to one or more hazards. Inventory is described by the number, size, type, use, and occupancy of buildings and by the infrastructure present. Infrastructure includes roads and other transportation systems, utilities (potable water, wastewater, natural gas, and electric power), telecommunications systems, and so on. For the North Mason School District, the built-environment inventory of concern is largely limited to the District s facilities. For planning purposes, schools are often considered critical facilities because they may be used as emergency shelters for the community after disasters and because communities often place a very high priority on providing life safety for children in schools. 6-29
30 For hazard mitigation planning, inventory must be characterized not only by the quantity and value of buildings or infrastructure present, but also by its vulnerability to each hazard under evaluation. For example, a given facility may or may not be particularly vulnerable to flood damages or earthquake damages, depending on the details of its design and construction. Depending on the hazard, different engineering measures of the vulnerability of buildings and infrastructure are used. Figure 1.3 Exposure (Quantity, Value and Vulnerability of Inventory) EXPOSURE... RISK is the threat to people and the built environment - the potential for damages, losses, and casualties arising from hazards. Risk results only from the combination of Hazard and Exposure as discussed above and as illustrated schematically in Figure 1.4 on the following page. 6-30
31 Figure 1.4 Risk Results from the Combination of Hazard and Exposure RISK... Risk is the potential for future damages, losses, or casualties. A disaster event happens when a hazard event is combined with vulnerable inventory (that is when a hazard event strikes vulnerable inventory exposed to the hazard). The highest risk in a community occurs in high hazard areas (frequent and/or severe hazard events) with large inventories of vulnerable buildings or infrastructure. However, high risk can also occur with only moderately high hazard if there is a large inventory of highly vulnerable inventory exposed to the hazard. Conversely, a high hazard area can have relatively low risk if the inventory is resistant to damages (such as strengthened to minimize earthquake damages). MITIGATION means actions to reduce the risk due to hazards. Mitigation actions reduce the potential for damages, losses, and casualties in future disaster events. Repair of buildings or infrastructure damaged in a disaster is not mitigation. Hazard mitigation projects may be initiated proactively - before a disaster, or after a disaster has already occurred. In either case, the objective of mitigation is always to reduce future damages, losses, or casualties. A few common types of mitigation projects are shown in Table 1.1 on the following page. 6-31
32 Table 1.1 Examples of Mitigation Projects Hazard Earthquake Structural retrofits for buildings Common Mitigation Projects Nonstructural retrofits for building elements and contents Replace existing building with new, current-code building Tsunami Enhance evacuation planning, including practice drills Build structure for vertical evacuation Volcanic Hazards Floods Wildland/Urban Interface Fires Landslides Multi-Hazard Enhance evacuation planning, including practice drills Flood barriers and other floodproofing measures Elevate at risk buildings Abandon campus at high risk (possible FEMA buyout) and build new campus outside of floodplain Enhance defensible space around buildings Fuel reduction measures near campus Improve fire resistance of existing buildings with non-flammable roofs and exterior finishes and other fire-safe measures Stabilize slopes with improved drainage and/or retaining walls. Replace vulnerable facility with new current-code facility, outside of high hazard zones when possible Obtain insurance to cover some damage/losses Enhance emergency planning, including drills Expand education/outreach to improve community understanding of natural hazards The mitigation project list above is not comprehensive; mitigation projects can encompass many other actions to reduce future damages, losses, and casualties. 6-32
33 1.5 The Mitigation Process The key element for all hazard mitigation projects is that they reduce risk. The benefits of a mitigation project are the reductions in risk (i.e., the avoided damages, losses, and casualties attributable to the mitigation project). Benefits are the difference in expected damages, losses, and casualties before mitigation (as-is conditions) and after mitigation. These important concepts are illustrated on the following page. Figure 1.5 Mitigation Projects Reduce Risk RISK BEFORE MITIGATION BENEFITS OF MITIGATION RISK AFTER MITIGATION REDUCTION IN RISK Quantifying the benefits of a proposed mitigation project is an essential step in hazard mitigation planning and implementation. Only by quantifying benefits is it possible to compare the benefits and costs of mitigation to determine whether or not a particular project is worth doing (i.e., whether it is economically feasible). Real world mitigation planning almost always involves choosing between a range of possible alternatives, often with varying costs, and varying effectiveness in reducing risk. Quantitative risk assessment is centrally important to hazard mitigation planning. When the level of risk is high, the expected levels of damages and losses are likely to be unacceptable to the community and mitigation actions have a high priority: the greater the risk, the greater the urgency of undertaking mitigation. Conversely, when risk is moderate both the urgency and the benefits of undertaking mitigation are reduced. It is neither technologically possible nor economically feasible to 6-33
34 eliminate risk completely. Therefore, when levels of risk are low and/or the cost of mitigation is high relative to the level of risk, the risk may be deemed acceptable (or at least tolerable). Therefore, proposed mitigation projects that address low levels of risk or where the cost of the mitigation project is large relative to the level of risk are generally poor candidates for implementation. The overall mitigation planning process is outlined in Figure 1.6 on the following page, which shows the major steps in hazard mitigation planning and implementation for the North Mason School District. 6-34
35 Figure 1.6 The Mitigation Planning Process Mitigation Planning Flowchart Risk Assessment Quantify the Threat to the Built Environment Is Level of Risk Acceptable? Risk Acceptable? Mitigation Not Necessary Risk Not Acceptable? Mitigation Desired Identify Mitigation Alternatives Find Solutions to Risk Prioritize Mitigation Alternatives Benefit-Cost Analysis and related tools Obtain Funding Implement Mitigation Measures Reduce Risk The first steps are quantitative evaluation of the hazards (frequency and severity) affecting the North Mason School District and of the inventory (people and facilities) exposed to these hazards. Together, these hazard and exposure data determine the level of risk for specific locations, buildings, or facilities in the North Mason School District. 6-35
36 The next key step is to determine whether or not the level of risk posed by each of the hazards affecting the North Mason School District is acceptable or tolerable. If the level of risk is deemed acceptable or at least tolerable, then mitigation actions are not necessary or at least not a high priority. There is no absolute universal definition of the level of risk that is tolerable or not tolerable. Each district has to make its own determination. If the level of risk is deemed not acceptable or tolerable, then mitigation actions are desired. In this case, the mitigation planning process moves on to more detailed evaluation of specific mitigation alternatives, prioritization, funding, and implementation of mitigation actions. As with the determination of whether or not the level of risk posed by each hazard is acceptable or not, decisions about which mitigation projects should be undertaken can only be made by the North Mason School District. 1.6 The Role of Benefit-Cost Analysis in Mitigation Planning Communities, such as the North Mason School District, that are considering whether or not to undertake mitigation projects must answer questions that don t always have obvious answers, such as: What is the nature of the hazard problem? How frequent and how severe are hazard events? Do we want to undertake mitigation actions? What mitigation actions are feasible, appropriate, and affordable? How do we prioritize between competing mitigation projects? 6-36
37 Are our mitigation projects likely to be eligible for FEMA funding? Benefit-cost analysis (BCA) is a powerful tool that can help communities provide solid, defensible answers to these difficult socio-political-economic-engineering questions. Benefit-cost analysis is required for all FEMA-funded mitigation projects, under both pre-disaster and post-disaster mitigation programs. However, regardless whether or not FEMA funding is involved, benefit-cost analysis provides a sound basis for evaluating and prioritizing possible mitigation projects for any natural hazard. Further details about benefit-cost analysis are given in the Appendix 2: Principles of Benefit-Cost Analysis. 6-37
38 1.7 Hazard Synopsis The following figure illustrates the relative level of hazard for the six major hazards at each of the District s campuses. These hazard levels are based on statewide GIS data and additional district-specific data entered into OSPI s ICOS PDM database. Figure 1.7 NORTH MASON School District: Major Hazards Matrix North Mason STATE OF WASHINGTON SUPERINTENDENT OF PUBLIC INSTRUCTION DISTRICT PDM HAZARD SUMMARY Earthquake Tsunami Volcanic Flood WUI Landslide Belfair Elementary School Very High None** None** Low None** Hawkins Middle School Very High None** None** Low None** Intrepretive Center Extremely High None** None** Low None** North Mason Senior High School Very High None** None** Low Moderate Sand Hill Elementary School Very High None** None** Low None** None** None** None** None** None** As shown in Figure 1.7, all five of the district s campuses have very high or extremely high levels of earthquake hazard. The current North Mason Senior High School has a moderate wildfire hazard level. The North Mason School District is not subject to volcanic hazards, except possibly for minor volcanic ash falls, because none of the campuses are in, or near, any of the mapped volcanic hazard zones for any of the active volcanoes in Washington State. The North Mason School District is not subject to tsunamis because the district is located many miles from the coast and at elevations far above any possible tsunami events 6-38

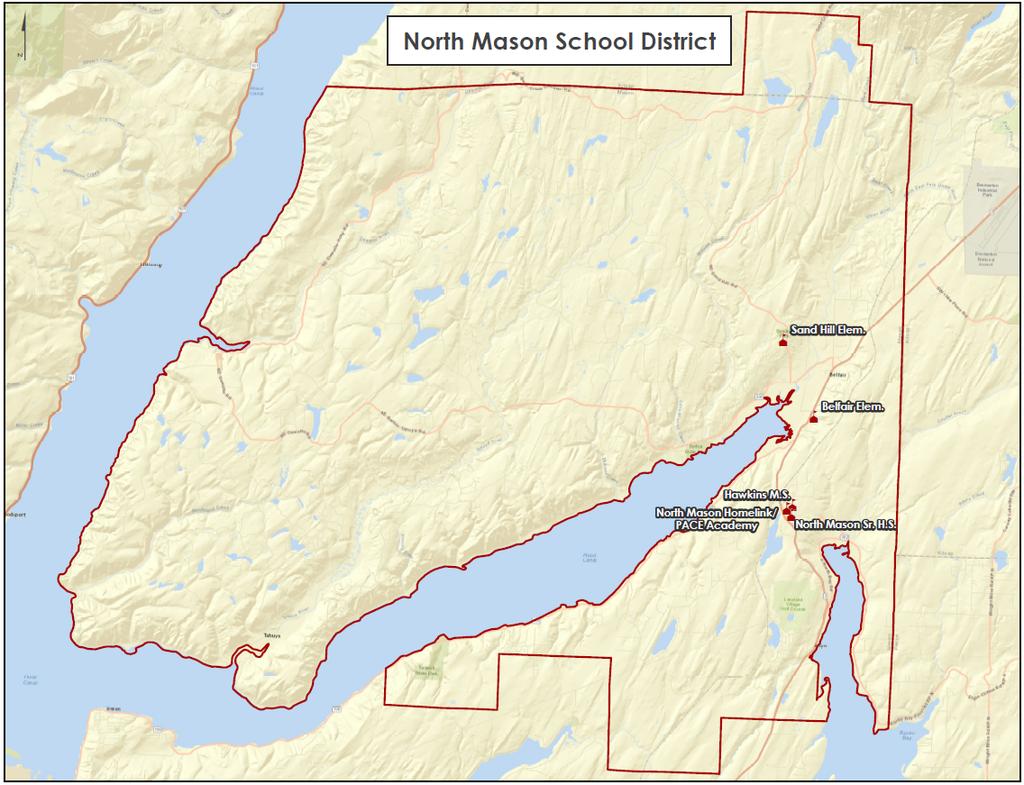
39 The North Mason School District does have a low flood hazard level due to having campuses within a half mile of a FEMA Flood Plain. There has not been any flood history directly impacting a school campus and any concerns from storm water. There are flood concerns from Hood Canal in the ability for the school district to safely transport students, which are addressed through set safety procedures. For these reasons flood risk is not addressed any further detail. Further details re: these hazards and the level of risk to District facilities and people are presented in the following chapters: Chapter 6: Earthquakes Chapter 8: Wildland/Urban Interface Fires Chapter 9: Landslide 2.0 NORTH MASON SCHOOL DISTRICT PROFILE: TEMPLATE April 17, District Location The North Mason School District is situated in Belfair The majority of the school district is contained within Mason County boundaries, but also includes a portion of Kitsap County near the tri-lakes area of Mission, Tiger and Panther Lakes. The total population within the district s boundaries is over 14,000. Figure 2.1 NORTH MASON School District Map 6-39
40 6-40
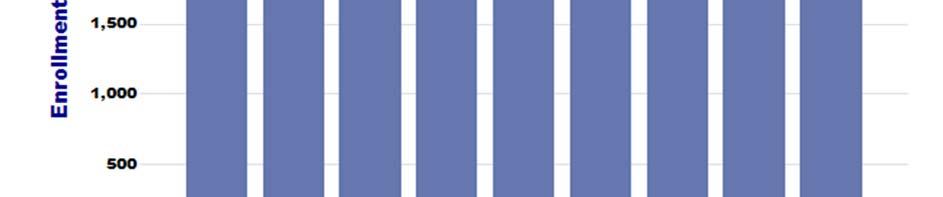
41 Figure 2.2 North Mason Public Schools and Vicinity 2.2 District Overview In the 1880 s the Allyn School was built and was still in use in The Allyn property was sold in In 1899 property was deeded to School District #37 of Mason County, and in 1902 and 1909 property was donated to School District #20 that specifies the land belongs to the district as long as a public school is maintained in that location. This was called the Tahuya School but was officially the Mason County School. In 1948, the same person quit-claimed land to the Tahuya School District #20, with the same stipulation. The deed includes that if the district doesn t use the land as a school for three years the land reverts back to the grantor, heirs and assigns. In 1929, a deed indicates the district was then called Mason County School District #56 and acquired property for what was known as the Dewatto School. A 1936 deed lists the district name as Belfair School District #45, and discusses the Belfair School. But a 1953 legal document lists the district as Mason County School District #45. Another recorded document dated 1963 states that School District # 56 is now known as School District # 20. Other legal documents dated 1958, 1960 & 1962 lists the district as North Mason Consolidated School District #403 and states Belfair School District #45 was consolidated into #403. Sometime between then and 1967, the district became known as North Mason School District # 403, and incorporated Tahuya, Dewatto, Allyn and Belfair of the past. The land the secondary campus and administration buildings sit on was acquired in 1956 through 1960 and was called the North Mason Junior-Senior High School Site. The Sand Hill Elementary property was acquired in In 1965 the community voted to build a new high school. At that time 7 th & 8 th graders attended the same school that housed high school students. 5th & 6 th graders were housed in the Chalet, a building that although very picturesque the fire marshals practically ordered school officials to do something about. In , Belfair Elementary was modernized and an addition built. 6-41
42 Per application for school building construction dated 1966, enrollment in 1950 was 237, 1960 was 578, by 1969 up to 677. Enrollment was projected to rise to 772 by The district continued to grow by leaps and bounds. In 1993 the district enrollment was The district owned 208 acres of land, had 85,010 square feet of classroom space, 26,996 square feet of indoor recreational facility space and 750,224 square feet of improved outdoor recreational space, 20,994 square feet of administration space, 7484 square feet of library space and 14,550 square feet of kitchen/lunchroom space. The school year headcount was up to 2363 students enrollment was at Graduating class of 1961, the first graduating class of North Mason School District, was 8 students. By 1970 the graduating class had grown to 54 students. This year s graduating class comprises over 150 students from North Mason High School and 28 students from James A Taylor High School. Our community passed a bond in 2013 to construct, equip and modernize its facilities. We now have a state of the arts high school and alternative high school, an almost complete renovated middle school, repairs made to our elementary schools and transportation garage, and will soon have a renovated administration building. The North Mason School District s mission statement is: The mission of North Mason School District is to educate, empower, inspire and prepare all students to graduate confident in their abilities to meet life s challenges and opportunity. 6-42
43 Student Demographics Enrollment October 2014 Student Count 2,147 May 2015 Student Count 2,149 Gender (October 2014) Male 1, % Female 1, % Race/Ethnicity (October 2014) Hispanic / Latino of any race(s) % American Indian / Alaskan Native % Asian % Black / African American % Native Hawaiian / Other Pacific Islander % White 1, % Two or More Races % Special Programs Free or Reduced-Price Meals (May 2015) 1, % Special Education (May 2015) % Transitional Bilingual (May 2015) % Migrant (May 2015) 8 0.4% Section 504 (May 2015) % Foster Care (May 2015) % Other Information (more info) Unexcused Absence Rate ( ) 1, % Adjusted 4-Year Cohort Graduation Rate (Class of 2014) 71.1% Adjusted 5-year Cohort Graduation Rate (Class of 2013) 80.9% College/University enrollment rates of graduates 6-43

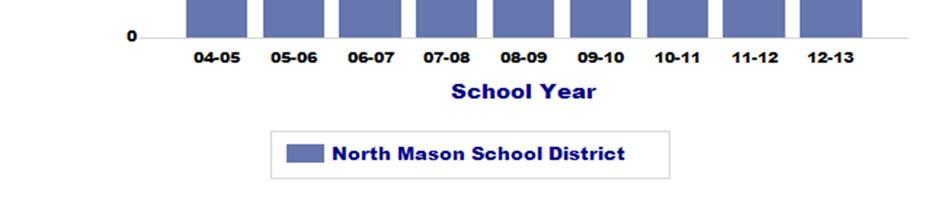
44 Selected Demographic Data Mason County Chart from US Census Bureau 6-44
45 2.3 District Facilities The North Mason School District has 4 campuses and several other facilities including a district office, transportation, maintenance, community center/classroom and several other buildings. District Pre-Disaster Mitigation Summary Table 2.2 District Facilities Campus / Building Building Condition Rating Number of Floors Building Area Year Built Gross Square Feet Structural System NORTH MASON SCHOOL DISTRICT Belfair Elementary School Covered Play Shed 64.66% Fair 1 Area ,200 S3 Gymnasium Building 82.40% Fair 1 Area ,655 RM1L Area ,815 RM1L Main Building 75.57% Fair ,856 W2 Lower Floor Area 4 Main Floor Area 1 Main Floor Area ,421 W ,471 RM1L ,900 RM1L Portable Building Ratings Not Started 1 Area ,771 W1 Hawkins Middle School Hawkins Middle School 72.70% Fair 1 1,2,2A & 2B ,127 RM1L 3,4, ,280 RM1L Hawkins Middle School Gym 69.12% Fair
46 Area ,947 W2 Area ,968 W2 Area W1 Portable 1/2 Ratings Not Started 1 Area ,771 W1 Interpretive Center Interpretive Center Ratings Not Started 1 Area ,771 W1 North Mason Senior High School High School Annex Building 81.56% Fair 1 Area ,652 PC1 North Mason High School 74.76% Fair 2 Area ,437 RM1L PACE Academy 1 Ratings Not Started 1 Area ,771 W1 PACE Academy 2 Ratings Not Started 1 Area ,771 W1 Portable 1/2 Ratings Not Started 1 Area ,771 W1 Portable 3/4 Ratings Not Started 1 Area ,771 W1 Portable 5/6 Ratings Not Started 1 Area ,771 W1 Portable 7/8 Ratings Not Started 1 Area ,771 W1 Stadium Ratings Not Started 1 Area ,030 PC2L New North Mason High School Not board accepted yet as complete Sand Hill Elementary School Back Portable Ratings Not Started 1 P ,792 W1 6-46
47 Front Portable Ratings Not Started 1 Area ,792 W1 Main Building 84.90% Good ,928 W2 Pump House Ratings Not Started 1 Area Water Tower Ratings Not Started 1 North Mason School District is currently updating/modernizing most of our campus buildings. The update of these facilities in this document is continuous until all projects are completed. Area 4.0 GOALS, OBJECTIVES, AND ACTION ITEMS: TEMPLATE April 17, Overview The purpose of the North Mason School District Hazard Mitigation Plan is to reduce the impacts of future natural disasters on the district s facilities, students, staff and volunteers. That is, the purpose is to make the North Mason School District more disaster resistant and disaster resilient, by reducing the vulnerability to disasters and enhancing the capability to respond effectively to, and recover quickly from, future disasters. Completely eliminating the risk of future disasters in the North Mason School District is neither technologically possible nor economically feasible. However, substantially reducing the negative impacts of future disasters is achievable with the adoption of this pragmatic Hazard Mitigation Plan and ongoing implementation of risk reducing action items. Incorporating risk reduction strategies and action items into the District's existing programs and decision making processes will facilitate moving the North Mason School District toward a safer and more disaster resistant future. The North Mason School District Hazard Mitigation Plan is based on a four-step framework that is designed to help focus attention and action on successful mitigation strategies: Mission Statement, Goals, Objectives, and Action Items. Mission Statement. The Mission Statement states the purpose and defines the primary function of the North Mason School District Hazard Mitigation Plan. The Mission Statement is an action-oriented summary that answers the question "Why develop a hazard mitigation plan?" 6-47
48 Goals. Goals identify priorities and specify how the North Mason School District intends to work toward reducing the risks from natural and humancaused hazards. The Goals represent the guiding principles toward which the District's efforts are directed. Goals provide focus for the more specific issues, recommendations, and actions addressed in Objectives and Action Items. Objectives. Each Goal has Objectives which specify the directions, methods, processes, or steps necessary to accomplish the North Mason School District Hazard Mitigation Plan's Goals. Objectives lead directly to specific Action Items. Action Items. Action Items are specific, well-defined activities or projects that work to reduce risk. That is, the Action Items represent the specific, implementable steps necessary to achieve the District s Mission Statement, Goals, and Objectives. 4.2 Mission Statement The mission statement for the North Mason School District Hazard Mitigation Plan is: To Educate, Empower, and Inspire All Students. Making the North Mason School District more disaster resistant and disaster resilient means taking proactive steps and actions to: Protect life safety, Reduce damage to district facilities, Minimize economic losses and disruption, and Shorten the recovery period from future disasters. 4.3 Mitigation Plan Goals and Objectives The following Goals and Objectives serve as guideposts and checklists to begin the process of implementing mitigation Action Items to reduce identified risks to the District s facilities, students, staff, and volunteers from natural disasters. The Goals and Objectives are consistent with those in the Washington State K 12 Facilities Hazard Mitigation Plan. However, the specific priorities, emphasis, and language in this mitigation plan are the North Mason School District s. These goals were developed with extensive input and priority setting by the North Mason District s hazard mitigation planning team, with inputs from district staff, volunteers, parents, students, and other stakeholders in the communities served by the District. 6-48
49 Goal 1: Reduce Threats to Life Safety Reducing threats to life safety is the highest priority for the North Mason School District. Objectives: A. Enhance life safety by retrofitting existing buildings or replacing them with new current-code buildings and by locating and designing new schools to minimize life safety risk from future disaster events. B. Develop robust disaster evacuation plans and conduct frequent practice drills. When evacuation is impossible in the anticipated warning time, consider vertical evacuation for tsunamis, other physical measures to shorten evacuation time, such as pedestrian bridges over rivers, or relocate campuses with extreme life safety risk to locations outside of hazard zones when possible. C. Enhance life safety by improving public awareness of earthquakes, tsunamis, volcanic events, and other natural hazards that pose substantial life safety risk to the District s facilities, students, staff, and volunteers. Goal 2: Reduce Damage to District Facilities, Economic Losses, and Disruption of the District s Services Objectives: A. Retrofit or replace existing buildings with a high vulnerability to one or more natural hazards to reduce damage, economic loss, and disruption in future disaster events. B. Ensure that new facilities are adequately designed for hazard events and located outside of mapped high hazard zones to minimize damage and loss of function in future disaster events, to the extent practicable. Goal 3: Enhance Emergency Planning, Disaster Response, and Post-Disaster Recovery Objectives: A. Enhance collaboration and coordination between the District, local governments, utilities, businesses, and citizens to prepare for, and recover from, future natural disaster events. B. Enhance emergency planning to facilitate effective response and rapid recovery from future natural disaster events. 6-49
50 Goal 4: Increase Awareness and Understanding of Natural Hazards and Mitigation Objectives: A. Implement education and outreach efforts to increase awareness of natural hazards throughout the North Mason School District, including staff, parents, teachers, and the entire communities served by the District. B. Maintain and publicize a natural hazards section in the high school library with FEMA and other publications and distribute FEMA and other brochures and other educational materials regarding natural hazards. 4.4 North Mason School District Hazard Mitigation Plan Action Items Mitigation Action Items may include a wide range of measures such as: refinement of policies, studies, and data collection to better characterize hazards or risk, education, or outreach activities, enhanced emergency planning, partnership building activities, as well as retrofits to existing facilities or replacement of vulnerable facilities with new current-code buildings. The 2016 North Mason School District s Hazard Mitigation Plan Action Items are summarized on the following pages: 6-50
51 Table 4.1 North Mason School District Mitigation Action Items Hazard Action Item Timeline Source of Funds Responsible Party Life Safety Plan Goals Addre Protect Facilities Enhance Emergency Multi-Hazard Mitigation Action Items Long-Term #1 Integrate the findings and action items in the mitigation plan into ongoing programs and practices for the district. Ongoing District or Grants Supt. X X X Long-Term #2 Review emergency and evacuation planning to incorporate hazard and risk information from the mitigation plan. Ongoing District or Grants Supt. X X X Long-Term #3 Consider natural hazards whenever siting new facilities and locate new facilities outside of high hazard areas. Ongoing District or Grants Supt. X X X Long-Term #4 Ensure that new facilities are adequately designed to minimize risk from natural hazards. Ongoing District or Grants Supt. X X X Long-Term #5 Maintain, update and enhance facility data and natural hazards data in the ICOS database. Ongoing District or Grants Supt. X X X Long-Term #6 Develop and distribute educational materials regarding natural hazards, vulnerability and risk for K-12 facilities. Ongoing District or Grants Supt. X X Long-Term #7 Seek FEMA funding for repairs if district facilities suffer damage in a FEMA declared disaster. Ongoing District or Grants Supt. X X Long-Term #8 Pursue pre- and post-disaster mitigation grants from FEMA and other sources. Ongoing District or Grants Supt. X X Long-Term #9 Post the district's mitigation plan on the website and encourage comments stakeholders for the ongoing review and periodic update of the mitigation plan. Ongoing District or Grants Supt. X 6-51
52 Table 4.2 Continued North Mason School District Mitigation Action Items Hazard Action Item Timeline Source of Funds Responsible Party Life Safety Plan Goals Add Protect Facilities Enhance Emergency Earthquake Mitigation Action Items Short- Term #1 Complete ASCE Tier 1 evaluations of Belfair Elementary School. 1-5 Years District or Grants Supt. X X Short- Term #2 Complete seismic evaluations of the foundations of the District's portables. 1-5 Years District or Grants Supt X X Short- Term #3 Assess the evaluation results from Action Items #1 and #2 and select buildings that have the greatest vulnerability for more detailed evaluations. 1-5 years District or Grants Supt X X Short- Term #4 Evaluate nonstructural seismic vulnerabilities in the District's buildings from building elements and contents that pose significant life safety risk (falling hazards) and mitigate by bracing, anchoring or replacing identified high risk items. Ongoing District or Grants Supt X X Long-Term #1 Prioritize and implement structural seismic retrofits or replacements based on the results of the seismic evaluations completed under the Short-Term Action Items #1 to #4 listed above, as funding becomes available. Ongoing District or Grants Supt X X Long-Term #2 Maintain and update building data for seismic risk assessments in the OSPI ICOS PDM database. Ongoing District or Grants Supt X X Long-Term #3 Enhance emergency planning for earthquakes including duck and cover and evacuation drills. Ongoing District or Grants Supt X X 6-52
53 Plan Table 4.2 Continued Hazard Action Item Timeline Source of Funds Lead Life Safety Protect Facilities Wildland/Urban Interface Fire Mitigation Action Items Short- Term #1 Consult with local fire agency regarding level of fire risk for the District's campus. 1-2 Years Local, Bond or Grant Superintendent X X Short- Term #2 Enhance emergency evacuation planning for all campuses for which wildland/urban fires are possible. 1 year Local, Bond or Grant Superintendent X Long- Term #1 Evaluate and consider implementing fire risk reduction measures including improving defensible space and upgrading building elements such as roofs with materials designed to be fire-resistant and covering vent openings with wire mesh to prevent embers from entering. Ongoing Local, Bond or Grant Superintendent X X North Mason School District Mitigation Action Items 6-53
54 Table 4.2 Continued North Mason School District Mitigation Action Items Hazard Action Item Timeline Source of Funds Responsible Party Life Safety Plan Goals Addr Protect Facilities Enhance Landslide Mitigation Action Items Short- Term #1 Consult with a geologist or geotechnical engineer regarding landslide risk for the Belfair Elementary School. 1-5 Years District or Grants X X X Long-Term #1 Evaluate and implement landslide mitigation measures for the Belfair Elementary School if recommended by the geologist or geotechnical engineer, as funding becomes available. Ongoing District or Grants X X X 5.0 MITIGATION PLAN ADOPTION, IMPLEMENTATION AND MAINTENANCE: 5.1 Overview For a hazard mitigation plan to be effective, it has to be implemented gradually over time, as resources become available. An effective plan must also be continually evaluated and periodically updated. The mitigation Action Items included in the North Mason School District s Hazard Mitigation Plan will be accomplished effectively only through a process which routinely incorporates logical thinking about hazards and costeffective mitigation into ongoing decision making and capital improvement spending. The following sections depict how the North Mason School District has adopted and will implement and maintain the vitality of the District s Hazard Mitigation Plan. 5.2 Plan Adoption This is the North Mason School District s first Hazard Mitigation Plan, which became effective on June 16, 2016, the date of adoption by the North Mason School District s Board. The Board adopted the District s Hazard Mitigation Plan following FEMA s approval of the District s submitted plan. The Board s adoption resolution is shown on the following page. 6-54
55 Board of Directors Resolution Adopting the North Mason School District Hazard Mitigation Plan Resolution Number 2014-X A Resolution Adopting the 2016 North Mason School District Hazard Mitigation Plan The North Mason School District resolves as follows: Whereas, the North Mason School District has determined that it is in the best interest of the District to have an active hazard mitigation planning effort to reduce the long term risks from natural hazards to school facilities, and Whereas, the North Mason School District recognizes that the Federal Emergency Management Agency (FEMA) requires the district to have an approved hazard mitigation plan as a condition of applying for and receiving FEMA mitigation project grant funding. Now, therefore, be it resolved by the North Mason School District as follows: The North Mason School District adopts the 2016 North Mason School District Hazard Mitigation Plan. Passed by the School Board on the XXth day of Month, Insert signature(s) and title(s) below. Note: the school board s resolution is best done after FEMA approves the submitted plan because FEMA may require changes to be made to the submitted plan. With adoption after FEMA approval, the district s plan becomes active as of the adoption date and the plan must then be updated by the 5 th anniversary of the adoption date. A plan update requires much less effort than creating the initial hazard mitigation plan. 6-55
56 5.3 Implementation The Maintenance/Facilities Director will have the lead responsibility for implementing the NORTH MASON School District Hazard Mitigation Plan, with ongoing support from the Facilities Committee Existing Authorities, Policies, Programs, Resources and Capabilities The North Mason School District and all school districts in Washington have much narrower domains of authorities than do cities and counties. The district s responsibilities are limited to constructing and maintaining its facilities and providing educational services for the district s students. The district s authorities are limited to these two areas. The district s policies and programs related to hazard mitigation planning are limited to the criteria for siting new schools, design of new school buildings, maintenance of buildings and periodic modernization of buildings. The district s resources for these programs include district staff involved with siting, construction, maintenance and modernization of schools, supplemented by contractor and consultants when needed. The completion of the North Mason District s Hazard Mitigation Plan has substantially raised the district s awareness and knowledge of natural hazards. Consideration of natural hazards will be included in siting of new schools, the design of new school buildings. Furthermore, mitigation measures to reduce risks from natural hazards will be incorporated into maintenance and modernization of buildings whenever possible. The North Mason School District has the necessary human resources to ensure that the North Mason School District Hazard Mitigation Plan continues to be an actively used planning document. District staff has been active in the preparation of the Plan, and have gained an understating of the process and the desire to integrate the Plan into ongoing capital budget planning. Through this linkage, the District s Hazard Mitigation Plan will be kept active and be a working document. District staff has broad experience with planning and facilitation of community inputs. This broad experience is directly applicable to hazard mitigation planning and to implementation of mitigation projects. If specialized expertise is necessary for a particular project, the District will contract with a consulting firm on an as-needed basis. Furthermore, recent earthquake and tsunami disasters worldwide serve as a reminder of need to maintain a high level of interest in evaluating and mitigating risk from natural disasters of all types. These events have kept the interest in hazard mitigation planning and implementation alive among the North Mason School District Board, District staff and in the communities served by the District. 6-56
57 To ensure efficient, effective and timely implementation of the identified mitigation action items, the North Mason School District will use the full range of its capabilities and resources and those of the community. The district s goal is to implement as many of the elements of its mitigation strategy (Action Items) over the next five years as possible, commensurate with the extent of funding that becomes available. This effort will be led by the Superintendent with the full support of the School Board, and with outreach and cooperation with the community, the region and the state, especially with the Office of Superintendent of Public Instruction. Regulatory Tools (Ordinances and Codes) RCW 28A Common School Provisions WAC Title 392 Office of Superintendent of Public Instruction Administrative Tools (Departments, Organizations, Programs) NORTH MASON School District Resources School Board Superintendent Parent Teacher Association Teachers Association/Union Safety committee Regional and State Resources Office of Superintendent of Public Instruction Washington State School Directors Association - WSSDA Washington Association of School Administrators - WASA Washington Association of School Business Officials WASBO Washington Association of Maintenance and Operation Administrators - WAMOA Mason County, including Emergency Management, Public Works and GIS, Planning Department and Building Officials. Fire Departments/Districts - North Mason Regional Fire Authority 2 and Central Mason Fire District 5 Mason County Sheriff Dept. 6-57
58 Technical Tools (Plans and Others) North Mason School District Capabilities District Website School Closure Telephone Plan Evacuation Plan Lockdown Plan Fire Drills Earthquake Drills Bomb Threat Assessment Guide Emergency Response Plan Capital Facilities Plan Strategic Plan Policies and Procedures Student Rights and Responsibilities District Safety Plan Fiscal Tools (Taxes, Bonds, Funds and Fees) North Mason School District Capabilities Authority to Levy Taxes Authority to Issue Bonds Funds o General Fund o Capital Project Funds o Debt Service Fund o Transportation Vehicle Fund External Funds o OSPI School Construction Assistance Program Modernization / New in Lieu o FEMA Grants o HUD CDBG Grants o Foundation Grants o Legislative Funding/Grants 6-58
59 5.3.2 Integration into Ongoing Programs As noted above, the North Mason School District s ongoing programs are more narrowly defined than those for cities and counties. An important aspect of the Plan s integration into ongoing programs will be the inclusions of the mitigation plan s hazard, vulnerability and risk evaluations and mitigation Action Items, into ongoing capital improvement planning and other district activities, such as building maintenance, periodic remodeling or modernization of facilities and future siting and construction of new facilities. For example, in evaluating a possible remodeling or modernization of buildings, the district will consider include retrofits to reduce the vulnerability to natural hazards as well as considering other alternatives such as replacement with a new building, when the retrofit is very expensive or a site has substantial risks from natural hazards that cannot be mitigated on the existing site Prioritization of Mitigation Projects Prioritization of future mitigation projects within the North Mason School District requires flexibility because of varying types of projects, District needs and availability funding sources. Prioritized mitigation Action Items developed during the mitigation planning process are summarized in Chapter 4. Additional mitigation Action Items or revisions to the initial Action Items are likely in the future. The North Mason School District Board will make final decisions about implementation and priorities with inputs from district staff, the mitigation planning team, the public and other stakeholders. The North Mason School District s prioritization of mitigation projects will include the following factors: 1. The mission statement and goals in the North Mason School District Hazard Mitigation Plan including: Goal 1: Reduce Threats to Life Safety, Goal 2: Reduce Damage to District Facilities, Economic Losses and Disruption of the District s Services, Goal 3: Enhance Emergency Planning, Disaster Response and Disaster Recovery, and Goal 4: Increase Awareness and Understanding of Natural Hazards and Mitigation 2. Benefit-cost analysis to ensure that mitigation projects are cost effective, with benefit exceeding the costs. 6-59
60 3. The STAPLEE process to ensure that mitigation Action Items under consideration for implementation meet the needs and objectives of the District, its communities, and citizens, by considering the social, technical, administrative, political, economic and environmental aspects of potential projects. Cost Effectiveness of Mitigation Projects As the North Mason School District considers whether or not to undertake specific mitigation projects or evaluate how to decide between competing mitigation projects, they must address questions that don't always have obvious answers, such as: What is the nature of the hazard problem? How frequent and how severe are the hazard events of concern? Do we want to undertake mitigation measures? What mitigation measures are feasible, appropriate, and affordable? How do we prioritize between competing mitigation projects? Are our mitigation projects likely to be eligible for FEMA funding? The North Mason School District recognizes that benefit-cost analysis is a powerful tool that can help provide solid, defensible answers to these difficult socio-politicaleconomic-engineering questions. Benefit-cost analysis is required for all FEMA-funded mitigation projects, under both pre-disaster and post-disaster mitigation programs. However, regardless of whether or not FEMA funding is involved, benefit-cost analysis provides a sound basis for evaluating and prioritizing possible mitigation projects for any natural hazard. Thus, the district will use benefit-cost analysis and related economic tools, such as cost-effectiveness evaluation, to the extent practicable in prioritizing and implementing mitigation actions. STAPLEE Process The North Mason School District will also use the STAPLEE methodology to evaluate projects based on the Social, Technical, Administrative, Political, Legal, Economic, and Environmental (STAPLEE) considerations and opportunities for implementing particular mitigation action items in the district. The STAPLEE approach is helpful for doing a quick analysis of the feasibility of proposed mitigation projects. The following paragraphs outline the district s STAPLEE Approach 6-60
61 Social: Is the proposed action socially acceptable to the community? Are there equity issues involved that would mean that one segment of the community is treated unfairly? Will the action cause social disruption? Technical: Will the proposed action work? Will it create more problems than it solves? Does it solve a problem or only a symptom? Is it the most useful action in light of other goals? Administrative: Is the action implementable? Is there someone to coordinate and lead the effort? Is there sufficient funding, staff, and technical support available? Are there ongoing administrative requirements that need to be met? Political: Is the action politically acceptable? Is there public support both to implement and to maintain the project? Legal: Include legal counsel, land use planners, and risk managers in this discussion. Who is authorized to implement the proposed action? Is there a clear legal basis or precedent for this activity? Will the district be liable for action or lack of action? Will the activity be challenged? Economic: What are the costs and benefits of this action? Do the benefits exceed the costs? 6-61
62 Are initial, maintenance, and administrative costs taken into account? Has funding been secured for the proposed action? If not, what are the potential funding sources (public, non-profit, and private)? How will this action affect the fiscal capability of the district? What burden will this action place on the tax base or economy? What are the budget and revenue effects of this activity? Environmental: How will the action impact the environment? Will the action need environmental regulatory approvals? Will it meet local and state regulatory requirements? Are endangered or threatened species likely to be affected? 5.4 Plan Maintenance and Periodic Updating Periodic Monitoring, Evaluating and Updating Monitoring the North Mason School District Hazard Mitigation Plan is an ongoing, long-term effort. An important aspect of monitoring is a continual process of ensuring that mitigation Action Items are compatible with the goals, objectives, and priorities established during the development of the District s Mitigation Plan. The District has developed a process for regularly reviewing and updating the Hazard Mitigation Plan. As noted previously, Superintendent, will have the lead responsibility for implementing the North Mason School District s Hazard Mitigation Plan and for periodic monitoring, evaluating and updating of the Plan. There will be ample opportunities to incorporate mitigation planning into ongoing activities and to seek grant support for specific mitigation projects. The North Mason School District Hazard Mitigation Plan will be reviewed annually as well as after any significant disaster event affecting the District. These reviews will determine whether there have been any significant changes in the understanding of hazards, vulnerability and risk or any significant changes in goals, objectives and Action Items. These reviews will provide opportunities to incorporate new information into the Mitigation Plan, remove outdated items and document completed Action Items. This will also be the time to recognize the success of the District in implementing Action Items contained in the Plan. Annual reviews will also focus on identifying potential funding sources for the implementation of mitigation Action Items. The periodic monitoring, evaluation and updating will assess whether or not, and to what extent, the following questions are applicable: 6-62
63 1. Do the plans goals, objectives and action items still address current and future expected conditions? 2. Do the mitigation Action Items accurately reflect the District s current conditions and mitigation priorities? 3. Have the technical hazard, vulnerability and risk data been updated or changed? 4. Are current resources adequate for implanting the District s Hazard Mitigation Plan? If not are there other resources that may be available? 5. Are there any problems or impediments to implementation? If so, what are the solutions? 6. Have other agencies, partners, and the public participated as anticipated? If no, what measures can be taken to facilitate participation? 7. Have there been changes in federal and/or state laws pertaining to hazard mitigation in the District? 8. Have the FEMA requirements for the maintenance and updating of hazard mitigation plans changed? 9. What can the District learn from declared federal and/or state hazard events in other Washington school districts that share similar characteristics to the North Mason School District, such as vulnerabilities to earthquakes and tsunamis? 10. How have previously implemented mitigation measures performed in recent hazard events? This may include assessment of mitigation Action Items similar to those contained in the District s Mitigation Plan, but where hazard events occurred outside of the District. The Superintendent, in conjunction with the Facilities Committee, will review the results of these mitigation plan assessments, identify corrective actions and make recommendations, if necessary, to the North Mason School Board for actions that may be necessary to bring the Hazard Mitigation Plan back into conformance with the stated goals and objectives. Any major revisions of the Hazard Mitigation Plan will be taken to the Board for formal approval as part of the District s ongoing mitigation plan maintenance and implementation program. The Superintendent, in conjunction with the Facilities Committee, will have lead responsibility for the formal updates of the Hazard Mitigation Plan every five years. The formal update process will be initiated at least one year before the five-year anniversary of FEMA approval of the North Mason School District Hazard Mitigation Plan, to allow ample time for robust participation by stakeholders and the public and for updating data, maps, goals, objectives and Action Items. 6-63
64 5.4.2 Continued Public Involvement and Participation Implementation of the mitigation actions identified in the Plan must continue to engage the entire community. Continued public involvement will be an integral part of the ongoing process of incorporating mitigation planning into land use planning, zoning, and capital improvement plans and related activities within the communities served by the District. In addition, the District will expand communications and joint efforts between the District and emergency management activities in the cities of Mason County. The 2016 North Mason School District Hazard Mitigation Plan will be available on the District s website and hard copies will be placed in the administration building. The existence and locations of these hard copies will be posted on the District s website along with contact information so that people can direct comments, suggestions and concerns to the appropriate staff. The North Mason School District is committed to involving the public directly in the ongoing review and updating of the Hazard Mitigation Plan. This public involvement process will include public participation in the monitoring, evaluation and updating processes outlined in the previous section. Public involvement will intensify as the next 5-year update process is begun and completed. A press release requesting public comments will be issued after each major update and also whenever additional public inputs are deemed necessary. The press release will direct people to the website and other locations where the public can review proposed updated versions of the North Mason School District s Hazard Mitigation Plan. This process will provide the public with accessible and effective means to express their concerns, opinions, ideas about any updates/changes that are proposed to the Mitigation Plan. The District will ensure that the resources are available to publicize the press releases and maintain public participation through web pages, social media, newsletters and newspapers. 6-64
65 6.0 EARTHQUAKES: 6.1 Introduction Every location in Washington State has some level of earthquake hazard, but the level of earthquake hazard varies widely by location within the state. Historically, awareness of seismic risk in Washington has generally been high, among both the public and public officials. This awareness in based to a great extent on the significant earthquakes that occurred within the Puget Sound area in 1949 (Olympia earthquake), 1965 (Tacoma earthquake) and 2001(Nisqually earthquake), as well as on other smaller earthquakes in many locations throughout the state. The awareness of seismic risk in Washington has also increased in recent years due to the devastating earthquakes and tsunamis in Indonesia in 2004 and Japan in The geologic settings for the Indonesia and Japan earthquakes are very similar to the Cascadia Subduction Zone along the Washington Coast. The technical information in the following sections provides a basic understanding of earthquake hazards, which is an essential foundation for making well-informed decisions about earthquake risks and mitigation Action Items for K-12 facilities. 6.2 Washington Earthquakes Earthquakes are described by their magnitude (M), which is a measure of the total energy released by an earthquake. The most common magnitude is called the moment magnitude, which is calculated by seismologists from two factors 1) the amount of slip (movement) on the fault causing the earthquake and 2) the area of the fault surface that ruptures during the earthquake. Moment magnitudes are similar to the Richter magnitude, which was used for many decades but has now been replaced. The moment magnitudes for the largest earthquakes recorded worldwide and in Washington are shown below. Table 6.1 Largest Recorded Earthquakes 1,2 Worldwide Magnitude Washington Magnitude 1960 Chile Chelan 6.8 a 1964 Prince William Sound, Alaska Olympia Sumatra, Indonesia Nisqually Japan Tacoma Kamchatka, Russia Bremerton Chile Walla Walla Ecuador Friday Harbor 6.0 a Estimated magnitude. 6-65

66 Figure 6.1 Epicenters of Historic Earthquakes in Washington with Magnitudes of 3.0 or Higher
67 Table 6.1 and Figure 6.1 do not include the January 26, 1700 earthquake on the Cascadia Subduction Zone which has been identified by tsunami records in Japan and paleoseismic investigations along the Washington Coast. The estimated magnitude of the 1700 earthquake is approximately 9.0. This earthquake is not shown in Table 6.1 because it predates modern seismological records. However, this earthquake is among the largest known earthquakes worldwide and the largest earthquake affecting Washington over the past several hundred years. The closest analogy to this earthquake and its effects, including tsunamis, is the 2011 Japan earthquake. Earthquakes in Washington, and throughout the world, occur predominantly because of plate tectonics the relative movement of plates of oceanic and continental rocks that make up the rocky surface of the earth. Earthquakes can also occur because of volcanic activity and other geological processes. The Cascadia Subduction Zone is a geologically complex area off the Pacific Northwest coast that ranges from Northern California to British Columbia. In simple terms, several pieces of oceanic crust (the Juan de Fuca Plate and other smaller pieces) are being subducted (pushed under) the crust of the North American Plate. This subduction process is responsible for most of the earthquakes in the Pacific Northwest and for creating the chain of volcanoes in the Cascade Mountains. Figure 6.2 on the following page shows the geologic (plate-tectonic) setting of the Cascadia Subduction Zone. There are three main types of earthquakes that affect Washington State: 1) Interface earthquakes on the boundary between the subducting Juan de Fuca Plate and the North American Plate, 2) Intraplate earthquakes within the subducting oceanic plates, and 3) Crustal earthquakes within the North American Plate. Interface earthquakes on the Cascadia Subduction Zone occur on the boundary between the subducting Juan de Fuca plate and the North American Plate. These earthquakes may have magnitudes up to 9.0 or perhaps 9.2, with average return periods (the time period between earthquakes) of about 250 to 500 years. These are the great Cascadia Subduction Zone earthquake events that have received attention in the popular press. The last major interface earthquake on the Cascadia Subduction Zone occurred on January 26, These earthquakes occur about 40 miles offshore from the Pacific Ocean coastline. Ground shaking from such earthquakes would be the strongest near the coast and strong ground shaking would be felt throughout much of western Washington, with the level of shaking decreasing further inland from the coast. 6-67

68 Figure 6.2 Cascadia Subduction Zone 4 Paleoseismic investigations, which look at geologic sediments and rocks, for signs of ancient earthquakes, have identified 41 Cascadia Subduction Zone interface earthquakes over the past 10,000 years, which corresponds to one earthquake about every 250 years. Of these 41 earthquakes, about half are M9.0 or greater earthquakes that represent a full rupture of the fault zone from Northern California to British Columbia. The other half of the interface earthquakes represents M8+ earthquakes that rupture only the southern portion of the subduction zone. The 300+ years since the last major Cascadia Subduction Zone earthquake is longer than the average timeframe of about 250 years for M8 or greater and is shorter than some of the intervals between M9.0 earthquakes. The time history of these major interface earthquakes is shown in Figure 6.3 on the following page. 6-68

69 Figure 6.3 Time History of Cascadia Subduction Zone Interface Earthquakes 5 Intraplate earthquakes occur within the subducting Juan de Fuca Plate. These earthquakes may have magnitudes up to about 6.5, with probable return periods of about 500 to 1000 years at any given location. These earthquakes can occur anywhere along the Cascadia Subduction Zone. The 1949, 1965 and 2001 earthquakes listed in Table 1 are examples of intraplate earthquakes. These earthquakes occur deep in the earth s crust, about 20 to 30 miles below the surface. They generate strong ground motions near the epicenter, but have damaging effects over significantly smaller areas than the larger magnitude interface earthquakes discussed above. Crustal earthquakes occur within the North American Plate. Crustal earthquakes are shallow earthquakes, typically within the upper 5 or 10 miles of the earth s surface, although some ruptures may reach the surface. In Western Washington crustal earthquakes are mostly related to the Cascadia Subduction Zone. Crustal earthquakes are known to occur not only on faults mapped as active or potentially active, but also on unknown faults. Many significant earthquakes in the United States have occurred on previously unknown faults. Based on the historical seismicity in Washington State and on comparisons to other geologically similar areas, small to moderate crustal earthquakes up to about M5 or M5.5 are possible almost any place in Washington. There is also a possibility of larger crustal earthquakes in the M6+ range on unknown faults, although, the probability of such events is likely to be low. 6-69
70 6.3 Earthquake Concepts for Risk Assessments Earthquake Magnitudes In evaluating earthquakes, it is important to recognize that the earthquake magnitude scale is not linear, but rather logarithmic (based on intervals corresponding to orders of magnitude). For example, each one step increase in magnitude, such as from M7 to M8, corresponds to an increase in the amount of energy released by the earthquake of a factor of about 30, based on the mathematics of the magnitude scale. Thus, a M7 earthquake releases about 30 times more energy than a M6, while a M8 releases about 30 times more energy than a M7 and so on. Thus, a great M9 earthquake releases nearly 1,000 times (30 [M7] x 30 [M8]) more energy than a large earthquake of M7 and nearly 30,000 times more energy than a M6 earthquake (30 [M6] x 30 [M7] x 30 [M8]). The public often assumes that the larger the magnitude of an earthquake, the worse it is. That is, the big one is a M9 earthquake and smaller earthquakes such as M6 or M7 are not the big one. However, this is true only in very general terms. Higher magnitude earthquakes do affect larger geographic areas, with much more widespread damage than smaller magnitude earthquakes. However, for a given site, the magnitude of an earthquake is not a good measure of the severity of the earthquake at that site. For most locations, the best measure of the severity of an earthquake is the intensity of ground shaking. However for some sites, ground failures and other possible consequences of earthquakes, which are discussed later in this chapter (Section 6.6), may substantially increase the severity. For any earthquake, the severity and intensity of ground shaking at a given site depends on four main factors: Earthquake magnitude, Earthquake epicenter, which is the location on the earth s surface directly above the point of origin of an earthquake, Earthquake depth, and Soil or rock conditions at the site, which may amplify or deamplify earthquake ground motions. An earthquake will generally produce the strongest ground motions near the epicenter (the point on the ground above where the earthquake initiated) with the intensity of ground motions diminishing with increasing distance from the epicenter. The intensity of ground 6-70
71 shaking at a given location depends on the four factors listed above. Thus, for any given earthquake there will be contours of varying intensity of ground shaking vs. distance from the epicenter. The intensity will generally decrease with distance from the epicenter, and often in an irregular pattern, not simply in perfectly shaped concentric circles. This irregularity is caused by soil conditions, the complexity of earthquake fault rupture patterns, and possible directionality in the dispersion of earthquake energy. The amount of earthquake damage and the size of the geographic area affected generally increase with earthquake magnitude. Below are some qualitative examples: Earthquakes below about M5 are not likely to cause significant damage, even locally very near the epicenter. Earthquakes between about M5 and M6 are likely to cause moderate damage near the epicenter. Earthquakes of about M6.5 or greater (e.g., the 2001 Nisqually earthquake) can cause major damage, with damage usually concentrated fairly near the epicenter. Larger earthquakes of M7+ cause damage over increasingly wider geographic areas with the potential for very high levels of damage near the epicenter. Great earthquakes with M8+ can cause major damage over wide geographic areas. A mega-quake M9 earthquake on the Cascadia Subduction Zone could affect the entire Pacific Northwest from British Columbia, through Washington and Oregon, and as far south as Northern California, with the highest levels of damage near the coast Intensity of Ground Shaking There are many measures of the severity or intensity of earthquake ground motions. The Modified Mercalli Intensity scale (MMI) was widely used beginning in the early 1900s. MMI is a descriptive, qualitative scale that relates severity of ground motions to the types of damage experienced. MMIs range from I to XII. More accurate, quantitative measures of the intensity of ground shaking have largely replaced the MMI. These modern intensity scales are used in the North Mason School District Hazard Mitigation Plan. Modern intensity scales use terms that can be physically measured with seismometers (instruments that measure motions of the ground), such as acceleration, velocity, or displacement (movement). The intensity of earthquake ground motions may also be measured in spectral (frequency) terms, as a function of the frequency of earthquake waves 6-71
72 propagating through the earth. In the same sense that sound waves contain a mix of low-, moderate- and high-frequency sound waves, earthquake waves contain ground motions of various frequencies. The behavior of buildings and other structures depends substantially on the vibration frequencies of the building or structure vs. the spectral content of earthquake waves. Earthquake ground motions also include both horizontal and vertical components. A common physical measure of the intensity of earthquake ground shaking, and the one used in this mitigation plan, is Peak Ground Acceleration (PGA). PGA is a measure of the intensity of shaking, relative to the acceleration of gravity (g). For example, an acceleration of 1.0 g PGA is an extremely strong ground motion that may occurs near the epicenter of large earthquakes. With a vertical acceleration of 1.0 g, objects are thrown into the air. With a horizontal acceleration of 1.0 g, objects accelerate sideways at the same rate as if they had been dropped from the ceiling. 10% g PGA means that the ground acceleration is 10% that of gravity, and so on. Damage levels experienced in an earthquake vary with the intensity of ground shaking and with the seismic capacity of structures. The following generalized observations provide qualitative statements about the likely extent of damages from earthquakes with various levels of ground shaking (PGA) at a given site: Ground motions of only 1% g or 2% g are widely felt by people; hanging plants and lamps swing strongly, but damage levels, if any, are usually very low. Ground motions below about 10% g usually cause only slight damage. Ground motions between about 10% g and 30% g may cause minor to moderate damage in well-designed buildings, with higher levels of damage in more vulnerable buildings. At this level of ground shaking, some poorly designed buildings may be subject to collapse. Ground motions above about 30% g may cause significant damage in welldesigned buildings and very high levels of damage (including collapse) in poorly designed buildings. Ground motions above about 50% g may cause significant damage in many buildings, including some buildings that have been designed to resist seismic forces. 6.4 Earthquake Hazard Maps The current scientific understanding of earthquakes is incapable of predicting exactly where and when the next earthquake will occur. However, the long term probability of earthquakes is well enough understood to make useful estimates of the probability of various levels of earthquake ground motions at a given location. 6-72
73 The current consensus estimates for earthquake hazards in the United States are incorporated into the 2014 USGS National Seismic Hazard Maps. These maps are the basis of building code design requirements for new construction, per the International Building Code adopted in Washington State. The earthquake ground motions used for building design are set at 2/3rds of the 2% in 50 year ground motion. The following maps show contours of Peak Ground Acceleration (PGA) with 10% and 2% chances of exceedance over the next 50 years to illustrate the levels of seismic hazard. The ground shaking values on the maps are expressed as a percentage of g, the acceleration of gravity. For example, the 10% in 50 year PGA value means that over the next 50 years there is a 10% probability of this level of ground shaking or higher. In very qualitative terms, the 10% in 50 year ground motion represents a likely earthquake while the 2% in 50 year ground motion represents a level of ground shaking close to but not the absolute worst case scenario. Figure 6.4 on the following page, the statewide 2% in 50 year ground motion map, is the best statewide representation of the variation in the level of seismic hazard in Washington State by location: The dark red, pink and orange areas have the highest levels of seismic hazard. The tan, yellow and blue areas have intermediate levels of seismic hazard. The bright green and pale green areas have the lowest levels of seismic hazard. The detailed geographical patterns in the maps reflect the varying contributions to seismic hazard from earthquakes on the Cascadia Subduction Zone and crustal earthquakes within the North American Plate. The differences in geographic pattern between the 2% in 50 year maps and the 10% in 50 year maps reflect different contributions from Cascadia Subduction Zone earthquakes and crustal earthquakes. These maps are generated by including earthquakes from all known faults, taking into account the expected magnitudes and frequencies of earthquakes for each fault. The maps also include contributions from unknown faults, which are statistically possible anywhere in Washington. The contributions from unknown faults are included via area seismicity which is distributed throughout the state. 6-73
74 An important caveat for interpreting these maps is that the 2014 USGS seismic hazard maps show the level of ground motions for rock sites. Ground motions on soil sites, especially soft soil sites will be significantly higher than for rock sites. Thus, for earthquake hazard analysis at a given site it is essential to include consideration of the site s soil conditions. The ground motions shown in the following figures represent ground motions with the specified probabilities of occurrence. At any given site, earthquakes may be experienced with ground motions over the entire range of levels of ground shaking from just detectible with sensitive seismometers to higher than the 2% in 50 year ground motion. 6-74

75 Figure USGS Seismic Hazard Map: Washington State6 PGA value (%g) with a 2% Chance of Exceedance in 50 years 6-75

76 Figure USGS Seismic Hazard Map: Washington State6 PGA value (%g) with a 10% Chance of Exceedance in 50 years 6-76

77 Figure USGS Seismic Hazard Map: Puget Sound Area PGA value (percent g) with a 2% Chance of Exceedance in 50 years 6-77

78 Figure USGS Seismic Hazard Map: Puget Sound Area PGA value (percent g) with a 10% Chance of Exceedance in 50 years 6-78
79 6.5 Site Class: Soil and Rock Types As discussed previously, the soil or rock type at a given location substantially affects the level of earthquake hazard because the soil or rock type may amplify or de-amplify ground motions. In general, soil sites, especially soft soil sites amplify ground motions. That is, for a given earthquake, a soil site immediately adjacent to a rock site will experience higher levels of earthquake ground motions than the rock site. In simple terms, there are six soil or rock site classes: A Hard Rock B Rock C Very Dense Soil and Soft Rock D Firm Soil E Soft Soil F Very Soft Soil Site classes for each campus in the North Mason School District are included in the campus-level report in Section 6.7. These estimates are from DNR or from site-specific determinations if such are entered into the OSPI ICOS PDM database. 6.6 Ground Failures and Other Aspects of Seismic Hazards Much of the damage in earthquakes occurs from ground shaking that affects buildings and infrastructure. However, there are several other consequences of earthquakes that can result in substantially increased levels of damage in some locations. These consequences include: surface rupture; subsidence or elevation; liquefaction; settlement; lateral spreading; landslides; dam, reservoir or levee failures; tsunamis and seiches. Any of these consequences can result in very severe damage to buildings, up to and including complete destruction, and also a high likelihood of casualties Surface Rupture Surface rupture occurs when the fault plane along which rupture occurs in an earthquake reaches the surface. Surface rupture may be horizontal and/or vertical displacement between the sides of the rupture plane. For a building subject to surface rupture the level of damage is typically very high and often results in the destruction of the building. Surface rupture does not occur with interface or intraplate earthquakes on the Cascadia Subduction Zone and does not occur with all crustal earthquakes. Faults in Washington State where surface rupture is likely include the Seattle Fault System and the Tacoma Fault System. 6-79
80 6.6.2 Subsidence Large interface earthquakes on the Cascadia Subduction Zone are expected to result in subsidence of up to several feet or more along Washington s Pacific Coast. For facilities located very near sea level, co-seismic subsidence may result in the facilities being below sea level or low enough so that flooding becomes very frequent. Subsidence may also impede egress by blocking some routes and thus increase the likelihood of casualties from tsunamis Liquefaction, Settlement and Lateral Spreading Liquefaction is a process where loose, wet sediments lose bearing strength during an earthquake and behave similar to a liquid. Once a soil liquefies, it tends to settle vertically and/or spread laterally. With even very slight slopes, liquefied soils tend to move sideways downhill (lateral spreading). Settling or lateral spreading can cause major damage to buildings and to buried infrastructure such as pipes and cables. Estimates of liquefaction potential for each campus in the North Mason School District are included in the campus-level report in Section 6.7. These estimates are from DNR or from site-specific determinations, if such determinations were entered into the OSPI ICOS PDM database by the District. 6.7 Seismic Risk Assessment for the North Mason School District s Facilities The potential impacts of future earthquakes on the North Mason District include damage to buildings and contents, disruption of educational services, displacement costs for temporary quarters if some buildings have enough damage to require moving out while repairs are made, and possible deaths and injuries for people in the buildings. The magnitude of potential impacts in future earthquakes can vary enormously from none in earthquakes that are felt but result in neither damages nor casualties to very substantial for larger magnitude earthquakes with epicenters near a given campus. 6-80
81 The vulnerability of the North Mason District s facilities varies markedly from building to building, depending on each building s structural system and date of construction (which governs the seismic design provisions). The level of risk on a building by building level is summarized in the building-level earthquake risk tables later in this chapter. The initial seismic risk assessment for the District s facilities at both the campus level and the building-level is largely automated from the data in the OSPI ICOS PDM database. The data used include GIS data for the location of each campus and district-specific data entered into the OSPI ICOS PDM database. The three step hazard and risk assessment approach, outlined below, uses data in the OSPI ICOS PDM database for screening and prioritization of more detailed evaluations which usually require inputs from an engineer experienced with seismic assessments of buildings. The auto-generated reports help to minimize the level of effort required by districts and to reduce costs by prioritizing more detailed seismic evaluations, enabling the District to focus on the buildings most likely to have the most substantial seismic deficiencies. The three steps include: 1. An auto-generated campus-level earthquake report that summarizes earthquake hazard data including ground shaking, site class, and liquefaction potential and classifies the combined earthquake hazard level from these data. The campus-level report also includes priorities for building-level risk assessments and geotechnical evaluations of site conditions. 2. An auto-generated building-level earthquake report that is based on the ASCE seismic evaluation methodology. The building-level report contains the data necessary to determine whether a building is pre- or post-benchmark year for life safety. If a building is post-benchmark it is generally deemed to provide adequate life safety and no further evaluation is necessary. If not, completing an ASCE Tier 1 evaluation is recommended. The auto-generated report includes suggested priorities for Tier 1 evaluations. 3. The third step includes completion and interpretation of the ASCE Tier 1 evaluations and: a. More detailed evaluation of one or more buildings that are determined to have the highest priority for retrofit or replacement from the previous step. b. Design of seismic retrofits for buildings for which a retrofit is the preferred alternative. c. Implementation of retrofits or replacement of buildings, as funding becomes available. Examples of the OSPI ICOS PDM database campus-level and building-level reports are shown on the following pages. 6-81
82 Table 6.2 Campus-Level Earthquake Report Earthquake Campus Level Hazard and Risk Report: Preliminary¹ Campus Earthquake Ground Shaking 2% in 50 Years² (% g) Site Class Earthquake Ground Shaking Hazard Level Liquefaction Potential Combined Earthquake Hazard Level Building Level Risk Assessment Recommendations Geotechnical Evaluation Yes/No³ Priority Yes/No Priority NORTH MASON SCHOOL DISTRICT Belfair Elementary School 61.00% C D Very High Very Low to Low Very High Yes Very High No N/A Hawkins Middle School 60.14% C D Very High Low Very High Yes Very High No N/A Intrepretive Center 61.00% C D Very High Moderate to High Extremely High Yes Extremely High Yes High North Mason Senior High School 60.05% C D Very High None Very High Yes Very High No N/A Other District Facilities 60.02% C D Very High Very Low Very High Yes Very High No N/A Sand Hill Elementary School 61.65% C Very High Very Low Very High Yes Very High No N/A ¹ Campus level risk is generally proportional to the combined earthquake hazard, but depends very strongly on the seismic vulnerability of buildings which must be evaluated at the building level. Thus, earthquake risk cannot be defined meaningfully at the campus level, except by doing building level evaluations and then aggregating building results to provide campus level risk. ² Earthquake ground motion measured as peak ground acceleration (PGA) relative to the "g", the acceleration of gravity. ³ "Limited" applies only to campuses with low ground shaking hazard level (2% in 50 year PGA less than 20% g) and means building level risk assessments are recommended only for the most vulnerable building types. The six site classes are identified as follows: A Hard Rock, B Rock, C Very Dense Soil and Soft Rock, D Firm Soil, E Soft Soil and F Very Soft Soil. Estimates by DNR also include intermediate classes such as D E, where the data is not sufficient to distinguish between D and E, as well as G Unknown, when data is missing DISCLAIMER: The information provided in this report is collected from various sources and may change over time without notice. The Office of Superintendent of Public Instruction (OSPI) and its officials and employees take no responsibility or legal liability for the accuracy, completeness, reliability, timeliness, or usefulness of any of the information provided. The information has been developed and presented for the sole purpose of developing school district mitigation plans and to assist in determining where to focus resources for additional evaluations of natural hazard risks. The reports are not intended to constitute in depth analysis or advice, nor are they to be used as a substitute for specific advice obtained from a licensed professional regarding the particular facts and circumstances of the natural hazard risks to a particular campus or building. 6-82
83 Building Level Earthquake Report Table 6.3 Building-Level Earthquake Report Building Area Year Built Seismic Design Criteria UBC or IBC Code Year Post Benchmark (Yes/No) Building Type Seismic Design Basis ASCE Tier 1 Evaluation Recommended¹ Yes /No Risk Level and Priority² ³ ASCE Tier 1 Evaluationª Completed (Yes/No) ASCE Compliant (Yes/No) Further Eval Desired Mitigation Desired (Yes/No) Mitigation Type Mitigation Complete (Yes/No) NORTH MASON SCHOOL DISTRICT Belfair Elementary School Facility Covered Play Shed Area No S3 Low Code Yes Moderate to High Gymnasium Building Area No RM1L Low Code Yes High Gymnasium Building Area No RM1L Moderate Code Yes High Main Building Yes W2 Moderate Code No Low Main Building Lower Floor Area Yes W1 Moderate Code No Low Main Building Main Floor Area 1 Main Building 1970 No RM1L Low Code Yes High 1970 No RM1L Low Code Yes High 6-83
84 Main Floor Area 2 Table 6.3 Cont. Building-Level Earthquake Report Building Level Earthquake Report Seismic Design Criteria ASCE Tier 1 Evaluation Recommended¹ ASCE Tier 1 Evaluationª Building Area Year Built UBC or IBC Code Year Post Benchmark (Yes/No) Building Type Seismic Design Basis Yes /No Risk Level and Priority² ³ Completed (Yes/No) ASCE Compliant (Yes/No) Further Eval Desired Mitigation Desired (Yes/No) Mitigation Type Mitigation Complete (Yes/No) 1980 Yes No Low Hawkins Middle School Facility Hawkins Middle School 1,2,2A & 2B 1967 No RM1L Low Code Yes High Hawkins Middle School 3,4, No RM1L Moderate Code Yes Moderate to High Hawkins Middle School Gym Area 1 Hawkins Middle School Gym Area No W2 Low Code Yes 1967 No W2 Low Code Yes Low to Moderate Low to Moderate Hawkins Middle School Gym Area Yes W1 Moderate Code No Low Portable 1/2 Area Yes W1 Moderate Code No Low 6-84
85 Table 6.3 Cont. Building-Level Earthquake Report Building Level Earthquake Report Building Area Year Built Seismic Design Criteria UBC or IBC Code Year Post Benchmark (Yes/No) Building Type Seismic Design Basis ASCE Tier 1 Evaluation Recommended¹ Yes /No Risk Level and Priority² ³ ASCE Tier 1 Evaluationª Completed (Yes/No) ASCE Compliant (Yes/No) Further Eval Desired Mitigation Desired (Yes/No) Mitigation Type Mitigation Complete (Yes/No) Interpretive Center Facility Interpretive Center Area Yes W1 Moderate Code No Low North Mason Senior High School Facility High School Annex Building Area No PC1 Moderate Code Yes High North Mason High School Area No RM1L Moderate Code Yes High PACE Academy 1 Area Yes W1 PACE Academy 2 Area Yes W1 Portable 1/2 Area Yes W1 Portable 3/4 Area Yes W1 Portable 5/6 Area Yes W1 High Code Moderate Code High Code High Code High Code No Low No Low No Low No Low No Low 6-85
86 Portable 7/8 Area Yes W1 Stadium Area No PC2L High Code Moderate Code No Low Yes Moderate Table 6.3 Cont. Building-Level Earthquake Report Building Level Earthquake Report Building Area Year Built Seismic Design Criteria UBC or IBC Code Year Post Benchmark (Yes/No) Building Type Seismic Design Basis ASCE Tier 1 Evaluation Recommended¹ Yes /No Risk Level and Priority² ³ ASCE Tier 1 Evaluationª Completed (Yes/No) ASCE Compliant (Yes/No) Further Eval Desired Mitigation Desired (Yes/No) Mitigation Type Mitigation Complete (Yes/No) Other District Facilities Facility District Administration Building Main Area District Kitchen Building Area Missing Data Missing Data Sand Hill Elementary School Facility Back Portable P Yes W1 Front Portable Area Yes W1 Main Building Yes W2 High Code Moderate Code Moderate Code No Low No Low No Low 6-86
87 ¹ ASCE seismic evaluations are recommended for buildings that were not designed to a "benchmark" seismic code deemed adequate to provide life safety. However, ASCE recommends that post benchmark code buildings be evaluated by an engineer to verify that the as built seismic details conform to the design drawings. Most such buildings should be compilant, unless poor construction quality degrades the expected seismic performance of the building. ² The priority for evaluations is based on the building type, the combined earthquake hazard level (ground shaking and liquefaction potential), the seismic design basis, and whether a building as been identified as having substantial vertical or horizontal irregularities. These priorities recoginize that many districts have limited funding for evaluations. Districts with adequate funding may wish to complete evaluations on all pre benchmark year buildings. ³ The earthquake risk level is low for all buildings for which an ASCE evaluation is not recommended as necessary. For other buildings, the preliminary risk level and the priority for evaluation are based on the earthquake hazard level, the building structural type, the seismic design level and whether a building has vertical and horizontal irregularities. ª The final determination of priorities for retrofit are based on whether a building is compliant with the life safety criteria. If not, the priorities should be set in close consultation with the engineer who completed the evaluation. DISCLAIMER: The information provided in this report is collected from various sources and may change over time without notice. The Office of Superintendent of Public Instruction (OSPI) and its officials and employees take no responsibility or legal liability for the accuracy, completeness, reliability, timeliness, or usefulness of any of the information provided. The information has been developed and presented for the sole purpose of developing school district mitigation plans and to assist in determining where to focus resources for additional evaluations of natural hazard risks. The reports are not intended to constitute in depth analysis or advice, nor are they to be used as a substitute for specific advice obtained from a licensed professional regarding the particular facts and circumstances of the natural hazard risks to a particular campus or building. 6-87
88 Every campus is at least a very high earthquake hazard level. The Interpretative Center has an extremely high earthquake hazard level and a moderate to high liquefaction potential due in part to softer soils (side class C-D). Other school campuses with liquefaction potential include Belfair Elementary (very low to low), Hawkins Middle (low) and Sand Hill Elementary (very low). Most of the school campuses have at least one building a high risk from earthquakes. This includes Belfair Elementary (gymnasium building, main building area 1 & 2), Hawkins Middle (1-2) and North Mason Senior High (annex building and high school) Sand Hill Elementary and the Interpretative Center only have low risk buildings. 6.8 Previous Earthquake Events During the February 28, 2001 Nisqually Magnitude 6.8 earthquake) that affected the district there was moderate damage to Sand Hill Elementary involving minor cracking of a wall. Repair was performed for the wall. An inspection was performed prior to the reopening of all school campuses to ensure student and staff safety. 6.9 Earthquake Hazard Mitigation Measures for K-12 Facilities Typical Seismic Mitigation Measures There are several possible earthquake mitigation Action Items for the District s facilities, including: Replacement of seismically vulnerable buildings with new buildings that meet or exceed the seismic provisions in the current building code, Structural retrofits for buildings, Nonstructural retrofits for buildings and contents, Installation of emergency generators for buildings with critical functions, including designated emergency shelters, and Enhanced emergency planning, including earthquake exercises and drills. Of these potential earthquake Action Items, FEMA mitigation grants, which typically provide 75% of total project costs, may be available for structural or nonstructural retrofits and for emergency generators. Recently North Mason School District has passed a facilities bond that will address seismic risk at a number of facilities. This includes a new high school campus that will be built to the latest seismic code. The existing high school seismic will be modernized and brought up to the latest seismic code so it can serve as a new middle school. Hawkins Middle School will be torn down with the exception of the gymnasium. Earthquake Action Items for the North Mason School District are given in Table 6.4 on the following page. 6-88
89 Table 6.4 North Mason School District: Earthquake Action Items Hazard Action Item Timeline Source of Funds Responsible Party Life Safety Plan Goals Addressed Protect Facilities Enhance Emergency Planning Enhance Awareness and Education Earthquake Mitigation Action Items Short- Term #1 1-5 Years District or Grants Supt. X X X Short- Term #2 Complete seismic evaluations of the foundations of the District's portables. 1-5 Years District or Grants Supt. X X X Short- Term #3 Assess the evaluation results from Action Items #1 and #2 and select buildings that have the greatest vulnerability for more detailed evaluations. 1-5 years District or Grants Supt. X X X Short- Term #4 Evaluate nonstructural seismic vulnerabilities in the District's buildings from building elements and contents that pose significant life safety risk (falling hazards) and mitigate by bracing, anchoring or replacing identified high risk items. Ongoing District or Grants Supt. X X X Long- Term #1 Prioritize and implement structural seismic retrofits or replacements based on the results of the seismic evaluations completed under the Short-Term Action Items #1 to #4 listed above, as funding becomes available. Ongoing District or Grants Supt. X X X Long- Term #2 Maintain and update building data for seismic risk assessments in the OSPI ICOS PDM database. Ongoing District or Grants Supt. X X X Long- Term #3 Enhance emergency planning for earthquakes including duck and cover and evacuation drills. Ongoing District or Grants Supt. X X X 10-89
90 6.10 References 1. United States Geological Survey (2013). Largest Earthquakes in the World since University of Washington (2002). Map and List of Significant Quakes in WA and OR, The Pacific Northwest Seismograph Network. University of Washington Department of Earth Sciences. 3. Washington State Department of Natural Resources (2013) Cascadia Region Earthquake Working Group (2005): Cascadia Subduction Zone Earthquakes: A Magnitude 9.0 Earthquake Scenario. 5. Oregon Seismic Safety Policy Advisory Commission (2013). The Oregon Resilience Plan. 6. Washington State Department of Natural Resources (2004). Liquefaction Susceptibility and Site Class Maps of Grays Harbor County, Washington. Open File Report
91 7.0 WILDLAND/URBAN INTERFACE FIRES: 7.1 Overview Fire has posed a threat to mankind since the dawn of civilization. Fires often cause substantial damage to property and may also result in deaths and injuries. For the purposes of mitigation planning, we define three types of fires: Structure fires and other localized fires, Wildland fires, and Wildland/urban interface fires. Structure fires are fires where structures and contents are the primary fuel. In dealing with structure fires, fire departments typically have three primary objectives: 1) minimize casualties, 2) prevent a structure fire from spreading to other structures, and 3) minimize damage to the structure and contents. Structure fires and the other common types of fires, such as vehicle or trash fires are most often limited to a single structure or location, although in some cases they may spread to adjacent structures. Wildland fires are fires where vegetation (grass, brush, trees) is the primary fire fuel and with few or no structures involved. For wildland fires, the most common suppression strategy is to contain the fire at its boundaries and then to let the fire burn itself out. Fire containment typically relies heavily on natural or manmade fire breaks. Water and chemical fire suppressants are used primarily to help make or defend a fire break, rather than to put out an entire fire, as would be the case with a structure fire. For wildland fires, fire suppression responsibility is generally with state and federal fire agencies, although local agencies may also participate. Wildland/urban interface fires are fires where the fire fuel includes both structures and vegetation. The defining characteristic of the wildland/urban interface area is that structures are built in or immediately adjacent to areas with essentially continuous vegetative fuel loads. When wildland fires occur in such areas, they often spread quickly and structures in these areas may, unfortunately, simply become additional fuel sources. Fire suppression efforts for wildland/urban interface fires focus first on savings lives and then on protecting structures to the extent possible. Local fire agencies have primary fire suppression responsibility for most wildland/urban interface fires, although state and federal agencies may also contribute. This chapter focuses on wildland/urban interface fires that pose a substantial threat to districts with K-12 facilities in locations subject to wildland/urban interface fires
92 7.2 Wildland/Urban Interface Fires Many urban or suburban areas have a significant amount of landscaping and other vegetation. However, in most areas the fuel load of flammable vegetation is not continuous, but rather is broken by paved areas, open space and areas of mowed grassy areas with low fuel loads. In these areas, most fires are single structure fires. The combination of separations between buildings, fire breaks, and generally low total vegetative fuel loads make the risk of fire spreading much lower than in wildland areas. Furthermore, most developed areas in urban and suburban areas have water systems with good capacities to provide water for fire suppression and fire departments that respond quickly to fires, with sufficient personnel and apparatus to control fires effectively. Thus, the likelihood of a single structure fire spreading to involve multiple structures is generally quite low. Areas subject to wildland/urban interface fires have very different fire hazard characteristics which are more similar to those for wildland fires. The level of fire hazard for wildland/urban interface fires depends on: Vegetative fuel load, Topography, Climate and weather conditions, Ignition sources and frequency of fire ignitions, and Fire suppression resources (fire agency response time and resources of crews and apparatus, access and water supplies). High vegetative fuel loads, especially brush and trees, increase the level of wildland/urban fire hazard. Steep topography increases the level of fire risk by exacerbating fire spread and impeding fire suppression efforts by making access more difficult. The level of fire hazard in areas prone to wildland/urban interface fires is also substantially increased when weather conditions including high temperatures, low humidity, and high winds greatly accelerate the spread of wildland fires and make containment difficult or impossible. Fire suppression resources are typically much lower in wildland/urban interface fire areas than in more highly developed areas. Fire stations are more widely spaced, with fewer resources of crews and apparatus and longer response times because of distance and/or limited access routes. Water resources for fire suppression are typically lower in these areas, which are often 10-92
93 predominantly residential and may be served by pumped pressure zones with limited water storage or by individual wells which provide no significant water supply for fire suppression. These reduced fire suppression resources make it more likely that a small wildland fire or a single structure fire in an urban/wildland interface area will spread before it can be extinguished. The level of risk from wildland/urban interface fires for K-12 facilities depends on: Level of fire hazard as outlined above, Value and importance of buildings and infrastructure, Vulnerability of inventory at risk, including whether fire-safe construction practices and defensible space measures have been implemented, and Population at risk and the efficacy of evacuations. Life safety risk in wildland/urban interface fires arises in large part from delays in evacuations, once a fire has started. For K-12 facilities with significant risk from wildland/urban interface fires, a well-defined, practical and practiced evacuation plan is essential to minimize potential life safety risk. 7.3 Wildland and Wildland/Urban Fire Hazard Mapping and Hazard Assessment The three maps on the following pages present different measures of wildland and wildland/urban interface fire hazards in Washington. There are important caveats regarding these maps when making wildland/urban interface fire mitigation decisions for K-12 facilities within mapped fire hazard areas: The DNR rankings of Wildland/Urban Interface Communities of extreme, high, moderate or low risk should be interpreted as qualitative or semi-quantitative indicators of the relative level of risk. Facilities identified as being located in communities with extreme or high levels of risk may not have extreme or high risk as generally understood for mitigation planning purposes. Some of the extreme or high risk interface communities have long burn return periods (the average time interval between fire events) per the USGS Landfire map. The USGS Landfire Return Period values should also be interpreted as semiquantitative indicators of the relative level of risk. The numerical estimates of the burn return period and the corresponding probabilities over a 50-year time period should not be interpreted literally. The DNR rankings and the USGS Landfire Return Periods are based on analysis of fire regime characteristics such as vegetative fuel loads, topography, climate and fire suppression resources. The USGS Landfire Return Periods may indicate higher levels of fire risk than suggested by historical fire data. Furthermore, most of the acreage burned has been wildland with relatively few structures and very few, if any, K-12 facilities

94 Figure 7.1 Wildland/Urban Interface Communities Identified by Washington Department of Natural Resources 10-94

95 Figure 7.2 Washington Wildland/Urban Interface High Risk Communities and Statewide Assessment High and Moderate Risk Areas 1 1 Washington State Department of Natural Resources, Fire Risk Map,

96 Figure7.3 United States Geological Survey Landfire Fire Return Period Map 10-96
97 7.4 Wildland/Urban Interface Fire Hazard and Risk Assessments The potential impacts of future wildland/urban interface fires on the North Mason District are primarily damage to buildings and contents (include possible complete destruction), disruption of educational services, and displacement costs for temporary quarters if some buildings have enough damage to require moving out while repairs are made. The likelihood of deaths or injuries is generally low, because schools will be evacuated whenever fire warnings are issued. However, in events where evacuation is not timely, there may a substantial risk of deaths and injuries. The vulnerability of the North Mason District s facilities to wildland/urban interface fires varies from campus to campus. The approximate levels of wildland/urban interface fire hazards and vulnerability are identified at the campus level in the following sections. There was a small wildfire immediately adjacent to the current Senior High School s parking lot and playfields during the Fall of The fire was quickly extinguished by local firefighters and was less than an acre in size. The school district has been proactive in addressing fire risk at school facilities by developing and maintaining defensible space. Fire risk assessments have been conducted by local firefighters, with which the district has continuous regular interactions with. The campus-level wildland/urban interface fire hazard and risk report for the North Mason School District is shown on the following page. The fire hazard and risk levels are generated within the OSPI ICOS Pre-Disaster Mitigation database, by combining the DNR Wildland Interface Community rankings, the Landfire fire return periods and the campus-specific information entered into the database. For campuses where the hazard and risk level is moderate or higher, the recommendation is to consult with the local fire agency regarding the level of risk at each campus and to determine whether fire mitigation measures may be appropriate. However, regardless of risk levels, all campuses in a wildland/urban interface should have evacuation plans for wildland/urban interface fire events
98 More accurate evaluation of wildland/urban interface fire risk for a campus or a building starts with the fire hazard factors listed previously, but also requires higher-resolution, campus-level and building-level information, including: Vegetative fuel loads on, adjacent and near the campus, including fuel types, fuel density, and proximity of high fuel load areas to the campus, Extent to which campus buildings have fire-safe construction details and defensible space. The number of available evacuation routes and the effectiveness of evacuation plans. Locations with only one or two evacuation routes, which might be blocked by a given fire event, have much higher life safety risk than locations with multiple possible evacuation routes. Evaluation of the above characteristics may require technical advice and support from fire professionals, including local fire agency staff or other fire experts. Such professional advice is beneficial for any campus in a wildland/urban interface. The Campus Level report for wildland/urban interface fires are shown on the next page
99 Table 7.1 NORTH MASON School District Campus Level Wildland/Urban Interface Hazard and Risk Assessment Report Wildland and Urban Interface (Fire) Campus-Level Hazard and Risk Report Campus WUI Community DNR Rating USGS Landfire Return Period Range¹ (Years) High Fuel Load Areas Near Campus² History of WUI Fires Affecting or Near Campus Fire Agency Concern about WUI Fires WUI Hazard Level and Preliminary Risk Level³ Recommendation Consult with Local Fire Agency About Risk and Mitigation NORTH MASON SCHOOL DISTRICT North Mason Senior High School Not Applicable Yes Yes No High Yes ¹ USGS Landfire estimates of fire return periods have very short returns for many locations, with correspondingly high probabilities in 50 years. Historical fire data suggest longer return periods and lower probabilities. These estimates are best interpreted as indicating relative fire risk, not absolute fire risk. ² Within 0.5 mile. ³ The WUI preliminary risk level characterized as the same as WUI hazard level. Building-level assessments required to determine risk more accurately. DISCLAIMER: The information provided in this report is collected from various sources and may change over time without notice. The Office of Superintendent of Public Instruction (OSPI) and its officials and employees take no responsibility or legal liability for the accuracy, completeness, reliability, timeliness, or usefulness of any of the information provided. The information has been developed and presented for the sole purpose of developing school district mitigation plans and to assist in determining where to focus resources for additional evaluations of natural hazard risks. The reports are not intended to constitute in-depth analysis or advice, nor are they to be used as a substitute for specific advice obtained from a licensed professional regarding the particular facts and circumstances of the natural hazard risks to a particular campus or building. The wildland/urban interface fire evaluation above is based on the Landfire fire return period estimates. For the North Mason District's campuses, this data doesn't appear to accurately represent the level of WUI risk. All of the District's facilities have heavily forested areas in close or relatively close proximity to buildings. Although the risk is lowed by the generally high rainfall, the WUI fire risk appears significant for all or most of the district's buildings, especially during periods of drought and on days with high winds and high temperatures. Therefore, consultation with local fire agencies is recommended and mitigation measures such as fuel reduction and improving defensible space may be warranted for some of the facilities
100 7.7 Mitigation for Wildland/Urban Interface Fires Common goals for reducing wildland/urban interface fire risk include: 1) reduce the probability of fire ignitions, 2) reduce the probability that small fires will spread, 3) minimize property damage, and 4) minimize life safety risk. School districts are not responsible for fire suppression or community-wide mitigation measures for wildland/urban interface fires, which are the responsibility of cities, counties and fire agencies. For districts with campuses determined to be at significant risk from wildland/urban interface fires, there are three types of practical mitigation measures: For life safety, develop and practice effective evacuation plans for wildland/urban interface fires, For existing facilities with significant risk: o Maintain the maximum possible defensible space around buildings and reduce vegetative fuel loads adjacent to a campus, o Implement fire-safe improvements such as non-flammable roofs, covering vent openings and overhangs with wire mesh to prevent entry and trapping of embers and others, and Whenever possible, site new facilities outside of areas with high risk of wildland/urban interface fires, include fire-safe features in the design and ensure the maximum possible defensible space around new buildings. Some types of mitigation projects for wildland/urban interface fire may be eligible for FEMA and other grant funding, including: Defensible space activities, Hazardous fuel reduction activities, and Ignition resistant construction activities. For existing buildings, implementing many ignition resistant building upgrades may be most cost-effective when done incrementally. For example, replacing an old roof covering with a non-flammable roof covering may be done at the time the existing roof has reached the end of its useful life and is scheduled for replacement. The North Mason School Districts mitigation Action Items for wildland/urban interface fires are shown in the table on the following page
101 Table 7.3 North Mason School District: Wildland/Urban Interface Fire Mitigation Action Items Hazard Action Item Timeline Source of Funds Responsible Party Wildland/Urban Interface Fire Mitigation Action Items Short- Term #1 Consult with local fire agency regarding level of fire risk for the District's campus. 1-2 Years Local, Bond or Grant Superintendent X Short- Term #2 Enhance emergency evacuation planning for all campuses for which wildland/urban fires are possible. 1 year Local, Bond or Grant Superintendent X Long-Term #1 Evaluate and consider implementing fire risk reduction measures including improving defensible space and upgrading building elements such as roofs with materials designed to be fire-resistant and covering vent openings with wire mesh to prevent embers from entering. Ongoing Local, Bond or Grant Superintendent X 8-101


102 8.0 LANDSLIDES: TEMPLATE 8.1 Landslide Overview and Definitions The term landslide refers to a variety of slope instabilities that result in the downward and outward movement of slope-forming materials, including rocks, soils, and vegetation. Many types of landslides are differentiated based on the types of materials involved and the mode of movement. The descriptive nomenclature for landslides is summarized in the following figure. Figure 8.1 Landslide Nomenclature 1 Debris flows and mudslides (mudflows) are often differentiated from the other types of landslides, for which the sliding material is predominantly soil and/or rock. Debris flows and mudslides typically have high water content and may behave similarly to floods. However, debris flows may be much more destructive than floods because of their higher densities, high debris loads, and high velocities. There are three main factors that determine the susceptibility (potential) for landslides at a given location: 1) Slope, 2) Soil/rock characteristics, and 3) Water content

103 Figure 8.2 Major Types of Landslides
104 Steeper slopes are more prone to all types of landslides. Loose, weak rock or soil is more prone to landslides than are competent rocks or dense, firm soils. Water saturated soils or rocks with a high water table are much more prone to landslides because the water pore pressure decreases the shear strength of the soil or rock and thus increases the probability of sliding. Most landslides occur during rainy months when soils are saturated with water. As noted previously, the water content of soils or rock is a major factor in determining the likelihood of sliding for any given landslide-prone location. However, landslides may occur at any time of year, in dry months as well as in rainy ones. Landslides are also commonly initiated by earthquakes. Areas prone to seismically triggered landslides are exactly the same as those prone to ordinary (non-seismic) landslides. As with ordinary landslides, seismically triggered landslides are more likely from earthquakes that occur when soils are saturated with water. Any type of landslide may result in damages or complete destruction of buildings in their path, as well as deaths and injuries for building occupants. Landslides frequently cause road blockages by depositing debris on road surfaces or road damage if the road surface itself slides downhill. Utility lines and pipes are also prone to breakage in slide areas. The destructive power of major landslides was demonstrated by the devastating March 2014 landslide in Oso, Washington which resulted in in several dozen deaths as well as extreme damage to buildings and infrastructure. This landslide is illustrated on the following page. The following figures show examples of landslides in Washington State


")
105 Figure 8.3 Oso Landslide Before and After the Landslide Landslide Type: Debris Flow (Mudslide) 8-105


106 Figure 8.4 Road 170 Near Basin City Landslide Type: Debris Flow Figure 8.5 Highway 410 Near Town of Nile Landslide Type: Translational 8-106


107 Figure 8.6 Rolling Bay, Bainbridge Island Landslide Type: Debris Flow 8-107
108 8.2 Landslide Hazard Mapping and Hazard Assessment There are two approaches to landslide hazard mapping and hazard assessment: Mapping historical landslides, which also provides an indication of the potential for future landslides, and Landslide studies by geotechnical engineers to estimate the potential for future landslides. Maps of areas within Washington with moderate or high landslide incidence and landslide potential are shown in Figures 8.7 and 8.8. A more accurate understanding of the landslide hazard for a given campus requires a more detailed landslide hazard evaluation by a geotechnical engineer. Such sitespecific studies evaluate the slope, soil/rock, and groundwater characteristics at specific sites. Such assessments often require drilling to determine subsurface soil/rock characteristics. An important caveat for landslide hazard assessments is that, even with detailed sitespecific evaluations by a geotechnical engineer, there is inevitably considerable uncertainty. That is, it is very difficult to make quantitative predictions of the likelihood or the size of future landslide events. In some cases, landslide hazard assessments by more than one geotechnical engineer may reach conflicting opinions. These limitations and uncertainties notwithstanding, a detailed site-specific landslide hazard assessment does provide the best available information about the likelihood of future landslides. For example, such studies can provide enough information to determine that the landslide risk is higher at one location than another location and thus provide meaningful guidance for siting future development. Given the above considerations, landslide hazard and risk assessments are generally qualitative or semi-quantitative in nature

109 Figure 8.7 Landslide Incidence and Potential 2 High Incidence: >15% of area involved Moderate Incidence: 1.5% to 15% of area involved Low Incidence: <1.5% of area involved High Susceptibility Moderate Susceptibility 8-109


110 Figure 8.8 Department of Natural Resources Landslide Potential Map
HAZARD MITIGATION PLAN NORTH MASON SCHOOL DISTRICT
 HAZARD MITIGATION PLAN NORTH MASON SCHOOL DISTRICT North Mason School Board North Mason School District 71 E Campus Dr Belfair WA 98528 The 2017 North Mason School District s Hazard Mitigation Plan is
HAZARD MITIGATION PLAN SNOHOMISH SCHOOL DISTRICT
 HAZARD MITIGATION PLAN SNOHOMISH SCHOOL DISTRICT 2017 Snohomish School District 1601 Avenue D Snohomish, Washington 98290 The 2017 Snohomish School District s Hazard Mitigation Plan is a living document
School District Mitigation Planning 101 April 28 th 30 th 2014
 School District Mitigation Planning 101 April 28 th 30 th 2014 Kenneth A. Goettel Goettel & Associates Inc. 1732 Arena Drive Davis, CA 95618 (530) 750-0440 KenGoettel@aol.com What is Hazard Mitigation?
Hazard Mitigation Grants. Technical Assistance Session Middlesex County, NJ December 7, 2011
 Hazard Mitigation Grants Technical Assistance Session Middlesex County, NJ December 7, 2011 Outline Purpose of Hazard Mitigation Hazard Mitigation Projects Hazard Mitigation Assistance Grant Programs Using
MONROE COUNTY 2015 LMS STEP TWO: CHARACTERIZATION FORM
 MONROE COUNTY 2015 LMS STEP TWO: CHARACTERIZATION FORM This form is used to submit information necessary for the LMS Work Group to score and prioritize an initiative relative to other initiatives and projects.
Mitigation Measures: Sound Investments in Disaster Recovery
 ISSUE 14 EDITOR S NOTE While FEMA is best known for emergency assistance after a disaster, the agency s support of mitigation programs to help identify and reduce risks to life and property before a disaster
Seismic Benefit Cost Analysis
 Seismic Benefit Cost Analysis Presented by: Paul Ransom Hazard Mitigation Branch Overview of BCA Generally required for all FEMA mitigation programs: HMGP (404) and PA (406) FMA PDM Overview for BCA The
Hazard Mitigation Planning
 Hazard Mitigation Planning Mitigation In order to develop an effective mitigation plan for your facility, residents and staff, one must understand several factors. The first factor is geography. Is your
HAZARD MITIGATION PLAN ABERDEEN SCHOOL DISTRICT. Aberdeen School District 216 North G Street Aberdeen, WA 98520
 HAZARD MITIGATION PLAN ABERDEEN SCHOOL DISTRICT Aberdeen School District 216 North G Street Aberdeen, WA 98520 The 2017 Aberdeen School District s Hazard Mitigation Plan is a living document which will
Mitigation 101. KAMM Regional Training. February March Esther White, Speaker
 Mitigation 101 KAMM Regional Training February March 2014 Esther White, Speaker 1 2 Mitigation 101 Outline Intro to Mitigation Mitigation Grant Overview Benefit Cost Analysis (BCA) Methods CHAMPS Disasters
G318 Local Mitigation Planning Workshop. Module 2: Risk Assessment. Visual 2.0
 G318 Local Mitigation Planning Workshop Module 2: Risk Assessment Visual 2.0 Unit 1 Risk Assessment Visual 2.1 Risk Assessment Process that collects information and assigns values to risks to: Identify
TS18 Mitigation Grant Application and Benefit Cost Analysis Development - Support Documentation - Governor s Hurricane Conference 2017
 TS18 Mitigation Grant Application and Benefit Cost Analysis Development - Support Documentation - Governor s Hurricane Conference 2017 Name Entity Your role with mitigation projects Your expectations /
ADVISORY BASE FLOOD ELEVATIONS (ABFEs)
") The Department of Homeland Security s Federal Emergency Management Agency is committed to helping communities that were impacted by Hurricanes Katrina and Rita rebuild safer and stronger. Following catastrophic
The Department of Homeland Security s Federal Emergency Management Agency is committed to helping communities that were impacted by Hurricanes Katrina and Rita rebuild safer and stronger. Following catastrophic
Federal Grants Provide $6 Benefit for Each $1 Invested
 Federal Grants Provide $6 Benefit for Each $1 Invested Introduction Natural hazards present significant risks to many communities across the United States. Fortunately, there are measures governments,
VULNERABILITY ASSESSMENT
 SOUTHSIDE HAMPTON ROADS HAZARD MITIGATION PLAN VULNERABILITY ASSESSMENT INTRODUCTION The Vulnerability Assessment section builds upon the information provided in the Hazard Identification and Analysis
Hazard Mitigation Overview
 Hazard Mitigation Overview Yahara Lakes Advisory Group April 28, 2011 1 Discussion Topics Recent flood losses and damages Hazard mitigation programs Project opportunities 2 Recent Flood Losses* Date May
T-318. Hazard Mitigation Section TDEM Recovery, Mitigation, and Standards
 T-318 Local Hazard Mitigation Plan Requirements Hazard Mitigation Section TDEM Recovery, Mitigation, and Standards Raymond Mejia, Lead Hazard Mitigation Planner Samantha Aburto, Hazard Mitigation Planner
PHASE 2 HAZARD IDENTIFICATION AND RISK ASSESSMENT
 Prioritize Hazards PHASE 2 HAZARD IDENTIFICATION AND After you have developed a full list of potential hazards affecting your campus, prioritize them based on their likelihood of occurrence. This step
Key Fundamentals of Flood Insurance in the NFIP!
 a Welcome to Key Fundamentals of Flood Insurance in the NFIP! A Before and After approach for Housing Counselors Presented by: 1 Before the Flood Presenter Melanie Graham After the Flood Presenter Erin
Section 2. Introduction and Purpose of the LMS
 Section 2. Introduction and Purpose of the LMS 2.1 Introduction The Disaster Mitigation Act of 2000 (DMA 2000), signed into law by the President of the United States on October 30, 2000 (P.L. 106-390),
Mitigation Strategies
 Mitigation Strategies Introduction Michigan State University Mitigation Goals Identification and Analysis of Mitigation Actions Recommendation and Prioritization of Mitigation Actions Potential Funding
Launch a Vulnerability Assessment. Building Regional Disaster Resilience
 Launch a Vulnerability Assessment Building Regional Disaster Resilience Overall Process Building Regional Disaster Resilience How is this process different? Goals and values-driven rather than checklist-driven
Natural Hazards Mitigation Plan Kankakee County, Illinois Executive Summary
 1. Introduction Natural Hazards Mitigation Plan Kankakee County, Illinois Executive Summary Kankakee County is subject to natural hazards that threaten life, safety, health, and welfare and cause extensive
FEMA s Non-Disaster Grant Programs
 FEMA s Non-Disaster Grant Programs KAMM Conference August 24, 2016 UK Hazard Mitigation Grants Program 1 Non-Disaster Grant Programs Pre-Disaster Mitigation (PDM) Flood Mitigation Assistance (FMA) 2 Non-Disaster
SECTION 1 INTRODUCTION
 SECTION 1 INTRODUCTION This section provides a general introduction to the Mississippi Emergency Management Agency (MEMA) District 9 Regional Hazard Mitigation Plan. It consists of the following five subsections:
1.1. PURPOSE 1.2. AUTHORITIES 1. INTRODUCTION
 1. INTRODUCTION This section briefly describes hazard mitigation planning requirements, associated grants, and this Standard State Hazard Mitigation Plan (SHMP) update s composition. HMPs define natural
Facts & Info regarding the NFIP in Mathews County VA And the Mathews County Floodplain Management Ordinance
 Facts & Info regarding the NFIP in Mathews County VA And the Mathews County Floodplain Management Ordinance As of 05-31-2014: Current NFIP policies in Mathews County = 1687 NFIP Claims= 1127, for a total
Sources of FEMA Funding
 ASFPM Nonstructural/Floodproofing Workshops Sources of FEMA Funding ASFPM Nonstructural/Floodproofing Committee Gene Barr, CFM Principal Project Manager Nonstructural Specialist Sources of FEMA Funding
Appendix C: Economic Analysis of Natural Hazard Mitigation Projects
 Appendix C: Economic Analysis of Natural Hazard Mitigation Projects This appendix was developed by the Oregon Partnership for Disaster Resilience at the University of Oregon s Community Service Center.
ANNEX B: TOWN OF BLUE RIVER
 ANNEX B: TOWN OF BLUE RIVER B.1 Community Profile Figure B.1 shows a map of the Town of Blue River and its location within Summit County. Figure B.1. Map of Blue River Summit County (Blue River) Annex
Article 23-6 FLOODPLAIN DISTRICT
 AMENDING THE CODE OF THE CITY OF PITTSFIELD CHAPTER 23, ZONING ORDINANCE SECTION I That the Code of the City of Pittsfield, Chapter 23, Article 23-6 Floodplain District, shall be replaced with the following:
Garfield County NHMP:
 Garfield County NHMP: Introduction and Summary Hazard Identification and Risk Assessment DRAFT AUG2010 Risk assessments provide information about the geographic areas where the hazards may occur, the value
Strategies for Increasing Flood Resiliency
 Strategies for Increasing Flood Resiliency Flood Hazard Mitigation Steve Ferryman, CFM Mitigation Branch Chief Ohio Emergency Management Agency Ohio EMA Mitigation Branch The mission of the Mitigation
FREQUENTLY ASKED QUESTION ABOUT FLOODPLAINS Michigan Department of Environmental Quality
 FREQUENTLY ASKED QUESTION ABOUT FLOODPLAINS Michigan Department of Environmental Quality WHAT IS A FLOOD? The National Flood Insurance Program defines a flood as a general and temporary condition of partial
Town of Montrose Annex
 Town of Montrose Annex Community Profile The Town of Montrose is located in the Southwest quadrant of the County, east of the Town of Primrose, south of the Town of Verona, and west of the Town of Oregon.
Sussex County All Hazard Mitigation Plan. Plan Executive Summary
 Sussex County All Hazard Mitigation Plan Plan Executive Summary March 2010 SUSSEX COUNTY ALL HAZARD MITIGATION PLAN SUMMARY March 2010 For questions and to make comments on this document, contact: Joseph
FEMA Leverages Building Codes and Standards to Advance Resiliency
 FEMA Leverages Building Codes and Standards to Advance Resiliency The goal of emergency management policy should be not just to respond but also to change the outcomes of natural hazards, and to do that,
Michael Taylor, PE, CFM Project Manager, AECOM August 25, 2015
 Promoting FEMA s Flood Risk Products in the Lower Levisa Watershed Michael Taylor, PE, CFM Project Manager, AECOM August 25, 2015 Agenda Study Background Flood Risk Product Overview AOMI and Mitigation
Dade County Natural Hazard Mitigation Plan
 Introduction to Mitigation Definition of Mitigation Mitigation is defined by FEMA as "...sustained action that reduces or eliminates longterm risk to people and property from natural hazards and their
Skagit County Natural Hazards Mitigation Plan
 Skagit County Natural Hazards Mitigation Plan A MULTI-JURISDICTIONAL PLAN DEVELOPED FOR THE BENEFIT OF ALL GOVERNMENTAL JURISDICTIONS WITHIN SKAGIT COUNTY AS WELL AS THE SWINOMISH INDIAN TRIBAL COMMUNITY
SECTION 6 - RANGE OF ALTERNATIVE MITIGATION ACTIONS CONSIDERED
 SECTION 6 - RANGE OF ALTERNATIVE MITIGATION ACTIONS CONSIDERED For this hazard mitigation plan to be approved by FEMA, each participating jurisdiction was required to identify and analyze a comprehensive
a) Ensure public safety through reducing the threats to life and personal injury.
 Ensure public safety through reducing the threats to life and personal injury.") SECTION VII: FLOODPLAIN DISTRICT 7-1 Statement Of Purpose The purposes of the Floodplain District are to: a) Ensure public safety through reducing the threats to life and personal injury. b) Eliminate
SECTION VII: FLOODPLAIN DISTRICT 7-1 Statement Of Purpose The purposes of the Floodplain District are to: a) Ensure public safety through reducing the threats to life and personal injury. b) Eliminate
Role of Disaster Insurance in Improving Resilience: An Expert Meeting The Resilient America Roundtable
 Role of Disaster Insurance in Improving Resilience: An Expert Meeting The Resilient America Roundtable National Academy of Science Washington, DC July 9, 2015 Roseville Demographics Primary population
York County Hazard Mitigation Plan. 1. Disaster Mitigation Act of 2000
 1. Disaster Mitigation Act of 2000 PUBLIC LAW 106 390 OCT. 30, 2000 DISASTER MITIGATION ACT OF 2000 VerDate 11-MAY-2000 04:55 Dec 06, 2000 Jkt 089139 PO 00390 Frm 00001 Fmt 6579 Sfmt 6579 E:\PUBLAW\PUBL390.106
CHAPTER THREE Natural Hazard Mitigation Strategy
 CHAPTER THREE Natural Hazard Mitigation Strategy Chapter 3 Section All Sections Updates to Section Revised Natural Hazards Introduction and all Sections to change Natural Hazards Subcommittee to Committee.
California Building Code and the NFIP. John Ingargiola, Senior Engineer FEMA Building Science Branch
 California Building Code and the NFIP John Ingargiola, Senior Engineer FEMA Building Science Branch CA Major Disaster Declarations and Federal Assistance $21 $21 $76 $78 7 declarations, 2004-2016, total
Emergency Management. Alden Graybill, Recovery / Mitigation Division Manager, OEM
 Emergency Management Alden Graybill, Recovery / Mitigation Division Manager, OEM Our Mission To minimize the effects of all disasters and emergencies upon the people of Oklahoma through mitigation, preparedness,
APPENDIX H TOWN OF FARMVILLE. Hazard Rankings. Status of Mitigation Actions. Building Permit Data. Future Land Use Map. Critical Facilities Map
 APPENDIX H TOWN OF FARMVILLE Hazard Rankings Status of Mitigation Actions Building Permit Data Future Land Use Map Critical Facilities Map Zone Maps Hazard Rankings (From Qualitative Assessment and Local
Floodplain Management Annual Conference Atlanta, Georgia April 2017
 Floodplain Management 2017 Annual Conference Atlanta, Georgia April 2017 Floodplain Mapping and Flood Zones Zone Deisgnations: Zone A: No base flood elevations have been determined it is an approximated
Upper Joachim Creek Public Survey on Potential Flood Risk Reduction
 Upper Joachim Creek Public Survey on Potential Flood Risk Reduction This survey is intended to help the interagency planning committee to receive public feedback on specific flood risk reduction techniques,
SOUTH CENTRAL REGION MULTI-JURISDICTION HAZARD MITIGATION PLAN. Advisory Committee Meeting September 12, 2012
 SOUTH CENTRAL REGION MULTI-JURISDICTION HAZARD MITIGATION PLAN Advisory Committee Meeting September 12, 2012 AGENDA FOR TODAY Purpose of Meeting Engage All Advisory Committee Members Distribute Project
Challenges in Mitigation of NYU Langone Medical Center after Hurricane Sandy
 2016 GAFM Technical Conference Challenges in Mitigation of NYU Langone Medical Center after Hurricane Sandy Ranko S. Pudar, PE, CFM, PMP Institutional Use of BCA Benefit-Cost Analysis used by several federal
A Flood Mitigation Plan for the Non-Tidal N.J. Section of the Delaware River Basin. Warren County Planning Workshop (2 nd Meeting) March 7, 2007
 March 7, 2007") A Flood Mitigation Plan for the Non-Tidal N.J. Section of the Delaware River Basin Warren County Planning Workshop (2 nd Meeting) March 7, 2007 Study Area Participation: Hunterdon: 16 Eligible Municipalities
A Flood Mitigation Plan for the Non-Tidal N.J. Section of the Delaware River Basin Warren County Planning Workshop (2 nd Meeting) March 7, 2007 Study Area Participation: Hunterdon: 16 Eligible Municipalities
Village of Blue Mounds Annex
 Village of Blue Mounds Annex Community Profile The Village of Blue Mounds is located in the southwest quadrant of the County, north of the town of Perry, west of the town of Springdale, and south of the
Gerard S. Mallet, Local Mitigation Strategy Coordinator FLOODPLAIN MANAGEMENT PLAN PROGRESS REPORT
 Date: September 10, 2009 To: From: Subject: Charlotte County Board of County Commissioners Gerard S. Mallet, Local Mitigation Strategy Coordinator FLOODPLAIN MANAGEMENT PLAN PROGRESS REPORT Resolution
ECONOMIC EVALUATION OF FLOODPLAIN MANAGEMENT AND FLOOD MITIGATION
 ECONOMIC EVALUATION OF FLOODPLAIN MANAGEMENT AND FLOOD MITIGATION CITY OF BIRMINGHAM, ALABAMA EDWIN REVELL, CFM FLOOD PLAIN ADMINISTRATOR DENISE PRUITT, CFM PROJECT PLANNER PRESENTATION OUTLINE 1. BACKGROUND/LOCATION
Planning Process---Requirement 201.6(b): An open public involvement process is essential to the development of an effective plan.
: An open public involvement process is essential to the development of an effective plan.") Section 3 Capability Identification Requirements Planning Process---Requirement 201.6(b): An open public involvement process is essential to the development of an effective plan. Documentation of the Planning
Section 3 Capability Identification Requirements Planning Process---Requirement 201.6(b): An open public involvement process is essential to the development of an effective plan. Documentation of the Planning
10/5/2015. What Makes a Sound Floodplain Management Program? What are the Flood Problems in your Community?
 The Community Rating System (CRS) and Hazard Mitigation Planning Preparing Your Community Through Common Program Goals September 3, 2015 What Makes a Sound Floodplain Management Program? Know your community
Survey of Hazus-MH: FEMA s Tool for Natural Hazard Loss Estimation
 Survey of Hazus-MH: FEMA s Tool for Natural Hazard Loss Estimation What is Hazus? Software tools and support system designed by FEMA for the purpose of providing communities with the means to identify
Floodplain Management 101. Mississippi Emergency Management Agency Floodplain Management Bureau
 Floodplain Management 101 Mississippi Emergency Management Agency Floodplain Management Bureau Stafford Act The Stafford Disaster Relief and Emergency Assistance Act (Stafford Act) (Public Law 100-707)
Flood Insurance THE TOPIC OCTOBER 2012
 Flood Insurance THE TOPIC OCTOBER 2012 Because of frequent flooding of the Mississippi River during the 1960s and the rising cost of taxpayer funded disaster relief for flood victims, in 1968 Congress
Hillsborough County Local Mitigation Strategy and the Community Rating System
 Hillsborough County Local Mitigation Strategy and the Community Rating System Presented By Hillsborough County s Hazard Mitigation Section Eugene Henry, Manager Hazard Mitigation Contributing Team Members:
Simsbury. Challenges Capitol Region Natural Hazards Mitigation Plan Update - Page 356
 Simsbury Simsbury is a suburban community of about 23,600 located in the western portion of the Capitol Region. Its land area encompasses 33.9 square miles. Elevation in town generally ranges from about
COMMUNITY SUMMARY LINN COUNTY MULTI-JURISDICTIONAL HAZARD MITIGATION PLAN CITY OF LISBON
 COMMUNITY SUMMARY LINN COUNTY MULTI-JURISDICTIONAL HAZARD MITIGATION PLAN CITY OF LISBON This document provides a summary of the hazard mitigation planning information for the City of Lisbon that will
Integrating Hazard Mitigation into Local Planning to Support Community Resilience on the Mississippi Gulf Coast
 Integrating Hazard Mitigation into Local Planning to Support Community Resilience on the Mississippi Gulf Coast MASGP-13-020 This publication was supported by the U.S. Department of Commerce s National
COMMUNITY SUMMARY LINN COUNTY MULTI-JURISDICTIONAL HAZARD MITIGATION PLAN CITY OF CENTRAL CITY
 COMMUNITY SUMMARY LINN COUNTY MULTI-JURISDICTIONAL HAZARD MITIGATION PLAN CITY OF CENTRAL CITY This document provides a summary of the hazard mitigation planning information for the City of Central City
LOCAL HAZARD MITIGATION PLAN UPDATE CHECKLIST
 D LOCAL HAZARD MITIGATION PLAN UPDATE CHECKLIST This section of the Plan includes a completed copy of the Local Hazard Mitigation Checklist as provided by the North Carolina Division of Emergency Management.
In 1993, spring came in like a lion, but refused
 36 UNIVERSITIES COUNCIL ON WATER RESOURCES ISSUE 130, PAGES 36-40, MARCH 2005 FEMA and Mitigation: Ten Years After the 1993 Midwest Flood Norbert Director of Federal Insurance and Mitigation Division Federal
Floodplain Development Permits A Technical Guidance Document
 Floodplain Development Permits A Technical Guidance Document To Prevent Loss of Life, Reduce Property Damage and to Protect and Enhance the Natural and Beneficial Functions of Floodplains Iredell County
Planning Process---Requirement 201.6(b): An open public involvement process is essential to the development of an effective plan.
: An open public involvement process is essential to the development of an effective plan.") Section 3 Capability Identification Requirements Planning Process---Requirement 201.6(b): An open public involvement process is essential to the development of an effective plan. Documentation of the Planning
Section 3 Capability Identification Requirements Planning Process---Requirement 201.6(b): An open public involvement process is essential to the development of an effective plan. Documentation of the Planning
Chapter 7 Appendix B: National Flood Insurance Program Summary for Kaua'i County, 2015 Update
 Chapter 7 Appendix B: National Flood Insurance Program Summary for Kaua'i County, 2015 Update Topic Considerations Description INSURANCE SUMMARY STAFF RESOURCES How many NFIP policies are in Kaua i County?
Volusia County Floodplain Management Plan 2012
 Volusia County Floodplain Management Plan 2012 Introduction The National Flood Insurance Program (NFIP) provides federally supported flood insurance in communities that regulate development in floodplains.
ANNEX P HAZARD MITIGATION
 ANNEX P HAZARD MITIGATION City of Conroe APPROVAL & IMPLEMENTATION Annex P Hazard Mitigation Webb Melder, Mayor Date Ken Kreger, Emergency Management Coordinator Date P-i RECORD OF CHANGES Annex P Hazard
M1015 Lord Hoole Fema 6/2012
 Hazard Mitigation Breaking the Damage Repair Damage Cycle 2012 Highway School Presentation Objectives Encourage Mitigation Actions / Projects Benefits of Preparing a Hazard Mitigation Plan Benefits of
County of Kaua'i Multi-Hazard Mitigation and Resilience Plan, 2015 Update
 Executive Summary: County of Kaua'i Multi-Hazard Mitigation and Resilience Plan Introduction to the Mitigation and Resilience Plan In this third plan, the longer term needs for sustaining mitigation efforts
National Flood Insurance Program, Biggert-Waters 2012, and Homeowners Flood Insurance Affordability Act 2014
 National Flood Insurance Program, Biggert-Waters 2012, and Homeowners Flood Insurance Affordability Act 2014 Janice Mitchell, Insurance Specialist Floodplain Management and Insurance Branch FEMA Region
COASTAL HAZARD MITIGATION TOOLS AND TECHNIQUES
 COASTAL HAZARD MITIGATION TOOLS AND TECHNIQUES Beach Nourishment Responsible Agency/Party: Mitigation for: Management Effort: Federal and/or State sponsored projects Long- and short-term erosion Flood
Hazard Mitigation FAQ
 Hazard Mitigation FAQ What is Hazard Mitigation? Actions taken to reduce or eliminate the long-term risk to people, property, or the environment from hazards and their effects. Examples: Hazardous Area
Executive Summary. Introduction and Purpose. Scope
 Executive Summary Introduction and Purpose This is the first edition of the Los Angeles Unified School District All-Hazard Mitigation Plan, and through completion of this plan the District continues many
INTRODUCTION TO NATURAL HAZARD ANALYSIS
 INTRODUCTION TO NATURAL HAZARD ANALYSIS November 19, 2013 Thomas A. Delorie, Jr. CSP Managing Director Natural Hazards Are Global and Include: Earthquake Flood Hurricane / Tropical Cyclone / Typhoon Landslides
Flood Mitigation Assistance (FMA) Grants
 Grants") Flood Mitigation Assistance (FMA) Grants KAMM Conference August 29, 2017 Esther White, Project Grants Manager UK Hazard Mitigation Grants Program Hazard 57 1 Throughout the presentation, please take note
Flood Mitigation Assistance (FMA) Grants KAMM Conference August 29, 2017 Esther White, Project Grants Manager UK Hazard Mitigation Grants Program Hazard 57 1 Throughout the presentation, please take note
Emergency Management. December 16, 2010
 Applications of Hazus-MH for Emergency Management December 16, 2010 What is Hazus-MH? Free ArcGIS extension Facilitates a risk-based approach to mitigation Identifies and visually displays hazards and
Justification for Floodplain Regulatory Standards in Illinois
 Justification for Floodplain Regulatory Standards in Illinois Office of Water Resources Issue Paper April, 2015 Proactive Illinois floodplain and floodway regulatory standards have prevented billions of
HAZARD MITIGATION PLAN POINT OF CONTACT MUNICIPAL PROFILE
 HAZARD MITIGATION PLAN POINT OF CONTACT northcatasauquaema@yahoo.com scheirerg@gmail.com MUNICIPAL PROFILE MUNICIPAL PARTICIPATION Compliance with the National Flood Insurance Program (NFIP) Identify source
CHAPTER 20. WHITMAN COUNTY FIRE DISTRICT #2 ANNEX
 CHAPTER 20. WHITMAN COUNTY FIRE DISTRICT #2 ANNEX 20.1 HAZARD MITIGATION PLAN POINT OF CONTACT Gaylon Hergert, President P.O. Box 221 St. John, Washington 99171-0221 Phone: (509) 648-4015 Cell #: (509)
LMS TIMES. Director s Corner. This Issue:
 P a l m B e a c h C o u n t y L o c a l M i t i g a t i o n S t r a t e g y D i v i s i o n o f E m e r g e n c y M a n a g e m e n t LMS TIMES Volume 6, Issue 3 Special points of interest: Director s
Implementing risk-based asset management strategies
 Implementing risk-based asset management strategies 2018. 04. 17 Disaster Resilience by Design The challenge for local governments The Challenge for Local Governments Landslides Debris Flows Wildfire Wind
Requirements for Mapping Levees Complying with Section of the NFIP Regulations
 FACT SHEET Requirements for Mapping Levees Complying with Section 65.10 of the NFIP Regulations As part of a mapping project, it is the levee owner s or community s responsibility to provide data and documentation
Vocabulary of Flood Risk Management Terms
 USACE INSTITUTE FOR WATER RESOURCES Vocabulary of Flood Risk Management Terms Appendix A Leonard Shabman, Paul Scodari, Douglas Woolley, and Carolyn Kousky May 2014 2014-R-02 This is an appendix to: L.
Q1 Do you...(check all that apply).
.") Q1 Do you...(check all that apply). Live in the City of... Work in the City of... Visit the City of Hesperia... Live in the City of Hesperia Work in the City of Hesperia Visit the City of Hesperia but
Q1 Do you...(check all that apply). Live in the City of... Work in the City of... Visit the City of Hesperia... Live in the City of Hesperia Work in the City of Hesperia Visit the City of Hesperia but
Chapter 10 Mitigation
 44.213 Emergency Management Fall 2015 Chapter 10 Mitigation School of Criminology and Justice Studies University of Massachusetts Lowell Understand the general concepts and purposes behind mitigation Know
Community Rating System. National Flood Insurance Program
 National Flood Insurance Program Community Rating System A Local Official s Guide to Saving Lives Preventing Property Damage Reducing the Cost of Flood Insurance FEMA B-573 / May 2015 How the Community
SECTION 9: MAPS AND DATA
 SECTION 9: MAPS AND DATA Contents 9.1. NFIP Maps and Data... 9-2 9.1.1. Adopting and enforcing NFIP floodplain maps and data... 9-2 9.1.2. Adopting and enforcing more restrictive data... 9-2 9.1.3. Annexations...
CATASTROPHE RISK MODELLING AND INSURANCE PENETRATION IN DEVELOPING COUNTRIES
 CATASTROPHE RISK MODELLING AND INSURANCE PENETRATION IN DEVELOPING COUNTRIES M.R. Zolfaghari 1 1 Assistant Professor, Civil Engineering Department, KNT University, Tehran, Iran mzolfaghari@kntu.ac.ir ABSTRACT:
Mitigation Success Publications
 The following publications are a sample of the many and varied documents that have been produced by States, associations and communities. MULTI-HAZARDS FEMA 294 Report on Costs and Benefits of Natural
Discovery Meeting: Middle Potomac- Catoctin Watershed. FEMA REGION III September 26, 2012 Rockville, MD and Fairfax, VA
 Discovery Meeting: Middle Potomac- Catoctin Watershed FEMA REGION III September 26, 2012 Rockville, MD and Fairfax, VA Agenda Introductions Purpose of This Meeting Discovery Process Community Rating System
SECTION 6: MITIGATION STRATEGIES
 SECTION 6: MITIGATION STRATEGIES This section presents mitigation actions for Somerset County to reduce potential exposure and losses identified as concerns in the Risk Assessment portion of this plan.
CITY OF PLANTATION ENGINEERING DEPARTMENT INTEROFFICE MEMORANDUM NO
 CITY OF PLANTATION ENGINEERING DEPARTMENT INTEROFFICE MEMORANDUM NO. 2013-003 DATE: October 22, 2012 TO: Mayor and Members of City Council FROM: Brett W. Butler, PE, CFM City Engineer SUBJECT: CRS Program
Truckloads (at 25 tons/truck) of building debris 90
 of building debris 90") Marlborough Marlborough is a rural community in Hartford County covering a land area of 23.3 square miles and with an estimated population of 6,410. Elevation ranges from about 160 to 800 feet. The Town
Marlborough Marlborough is a rural community in Hartford County covering a land area of 23.3 square miles and with an estimated population of 6,410. Elevation ranges from about 160 to 800 feet. The Town
VULNERABILITY FLOOD STANDARDS. VF-1 Derivation of Residential Structure Flood Vulnerability Functions
 VULNERABILITY FLOOD STANDARDS VF-1 Derivation of Residential Structure Flood Vulnerability Functions A. Development of the residential structure flood vulnerability functions shall be based on at least