National and Regional Economic Update
|
|
|
- Aubrie Hunter
- 5 years ago
- Views:
Transcription
1 National and Regional Economic Update Philadelphia Chapter of the Financial Planning Association May 11, 2016 Gary A. Wagner, Ph.D.* FEDERAL RESERVE BANK OF PHILADELPHIA * The views expressed today are my own and not necessarily those of the Federal Reserve Bank of Philadelphia or the Federal Reserve System.
2 PRESENTATION OUTLINE GDP growth and consumer borrowing trends (8 slides) Employment conditions (9 slides) Labor markets and income growth (5 slides) Inflation and monetary policy (7 slides)
3 GROWTH AND FORECAST FOR U.S. REAL GDP Quarterly (SAAR): 2005:Q1-2017:Q1 Annualized quarterly growth rate (SAAR) 4% 2% 0% 2016:Q1 = 0.5% -2% -4% -6% -8% Date 2016:Q2 2016:Q3 2016:Q4 2017:Q1 Forecast 2.5% 2.3% 2.5% 2.4% Jan 2006 Jan 2008 Jan 2010 Jan 2012 Jan 2014 Jan 2016 GDP SPF Forecast Source: BEA via Haver Analytics Quarters plotted: 2005:Q1-2017:Q1
4 GDP GROWTH BY SECTOR OVER LAST 4 QUARTERS Black lines indicate historical averages from 1980:Q1 to 2016:Q1 Annualized quarterly growth (SAAR) 6% 5.4% 5.9% 4% 4.1% 2% 2.6% 2.9% 1.7% 0% -2% -4% Real GDP Consumption Investment Exports Imports Government Source: BEA via Haver Analytics Last quarter included: 2016:Q1 Black lines indicate sector averages from 1980:Q1 to 2016:Q1
5 CONSUMPTION GROWTH OVER LAST 4 QUARTERS Black lines indicate historical averages from 1980:Q1 to 2016:Q1 Annualized quarterly growth (SAAR) 8% 6% 5.7% 4% 2% 2.9% 3.3% 2.2% 2.8% 0% -2% Consumption Goods Durable Goods Source: BEA via Haver Analytics Last quarter included: 2016:Q1 Black lines indicate sector averages from 1980:Q1 to 2016:Q1 Non- Durable Goods Services
6 INVESTMENT GROWTH OVER LAST 4 QUARTERS Black lines indicate historical averages from 1980:Q1 to 2016:Q1 Annualized quarterly growth (SAAR) 15% 10% 5% 0% 4.1% 4.0% 0.9% 5.1% 6.2% 2.4% -5% -10% Investment Non- Residential Structures Equipment Intellectual Property Residential Source: BEA via Haver Analytics Last quarter included: 2016:Q1 Black lines indicate sector averages from 1980:Q1 to 2016:Q1
7 TOTAL DEBT BURDEN OF U.S. HOUSEHOLDS Trillions of Dollars 2008:Q1 = $12.67 Trillion 2013:Q Mortgage HELOC Auto Credit Cards Student Loans Other Source: FRB New York Equifax Panel Quarters plotted: 2003:Q1-2015:Q4 Jan 2004 Jan 2006 Jan 2008 Jan 2010 Jan 2012 Jan 2014 Jan 2016
8 HOUSEHOLD DEBT-TO-INCOME RATIOS Maximum and most recent values are labeled Share of disposable income (seasonally adjusted) 20% 18.1% 15% Financial Obligations Ratio (FOR) = (debt service + rent + auto leases + others) / (after-tax income) 13.2% 15.4% 10% 10.1% Debt Service Ratio (DSR) = (minimum debt payments) / (after-tax income) 5% 0% Financial Obligations Ratio Debt Service Ratio Jan 1980 Jan 1990 Jan 2000 Jan 2010 Source: Board of Governors via Haver Analytics Quarters plotted: 1980:Q1-2015:Q4
9 STUDENT LOAN BALANCES BY AGE GROUP Billions of Dollars 1,400 1,200 1, Age Group: 236% increase Age Group: 322% increase Age Group: 340% increase Under Shares of Total 5% 12% 18% Shares of Total 2% 9% 14% 33% 33% 32% 0 42% Source: FRB New York Consumer Credit Panel/Equifax
10 STUDENT LOAN BALANCES BY INSTITUTION 2000 versus 2014 Source: Looney and Yannelis (2015)

11 STUDENT LOAN BALANCES BY INSTITUTION 2000 versus 2014 Source: Looney and Yannelis (2015)
12 Employment conditions
13 CHANGE IN MONTHLY U.S. PAYROLL EMPLOYMENT Black lines indicate annual averages (in thousands) Change in payroll employment (thousands, SA) 350 Revision for Feb 2016: jobs Revision for Mar 2016: jobs Apr 2016: Jan 2011 Jan 2012 Jan 2013 Jan 2014 Jan 2015 Jan 2016 Source: BLS via Haver Analytics Months plotted: Jan Apr 2016 Black lines indicate annual averages.
14 RECENT U.S. AND TRI-STATE EMPLOYMENT GROWTH Total payroll employment (seasonally adjusted) Annualized growth rate (seasonally adjusted) 3.7% 3% 2.6% 2% 1.9% 1.9% 1.7% 1.7% 1.9% 1.9% 1.6% 1.6% 1.4% 1% 0% -0.4% US DE NJ PA 12 Months 6 Months 3 Months Source: BLS via Haver Analytics Last month included: US (Apr 2016): States (Mar 2016)
 Source: Originally referenced from: The Shale Gas and Tight Oil Boom: U.S. States Economic Gains and Vulnerabilities, by Stephen P.A. Brown and Mine K.")
15 EMPLOYMENT EFFECTS OF AN OIL PRICE DROP FRB Dallas, Economic Letter, April 2015 (vol. 10, no. 3) Source: Originally referenced from: The Shale Gas and Tight Oil Boom: U.S. States Economic Gains and Vulnerabilities, by Stephen P.A. Brown and Mine K. Yücel, Council on Foreign Relations, Energy Brief, October 2013.
16 NEAR-TERM OIL PRICE FORECAST (WTI) Monthly price per barrel (grey shading = NYMEX 95% confidence interval) Dollars per barrel (monthly average, seasonally adjusted) $100 $80 $60 $40 $20 $0 WTI Actual EIA Forecast NYMEX Futures Price Jan 2015 Jul 2015 Jan 2016 Jul 2016 Jan 2017 Jul 2017 Source: Energy Information Administration Short-Term Energy Outlook, April 2016 Months plotted: Jan 2015 to Jun New York Mercantile Exchange (NYMEX) 95% confidence interval in grey.

17 TRI-STATE METRO AREA EMPLOYMENT GROWTH Year-over-year percentage change (3-month moving average) A = Allentown-Bethlehem-Easton MSA B = Altoona MSA C = Atlantic City-Hammonton MSA D = Bloomsburg-Berwick MSA E = Camden Metro Division F = Chambersburg-Waynesboro MSA G = Dover MSA H = East Stroudsburg MSA I = Erie MSA J = Gettysburg MSA K = Harrisburg-Carlisle MSA L = Johnstown MSA M = Lancaster MSA N = Lebanon MSA O = Montgomery-Bucks-Chester County MD P = Newark Metro Division Q* = New York-New Jersey-White Plains MD R = Ocean City MSA S = Philadelphia-Delaware County MD T = Pittsburgh MSA U = Reading MSA V* = Salisbury MSA W = Scranton-Wilkes-Barre-Hazelton MSA X = State College MSA Y = Trenton MSA Z = Vineland-Bridgeton MSA AA = Williamsport MSA AB* = Wilmington Metro Division AC = York-Hanover MSA AD* = Youngstown-Warren MSA * Also includes counties not shown on map. Source: Calculations from BLS data via Haver Analytics.
18 YOY EMPLOYMENT GROWTH BY SECTOR U.S. AND Philadelphia MSA Total Total Private Mining, Logging & Construction Manufacturing Trade, Trans & Utilities Financial Prof & Bus Services Education & Health Services Leisure & Hospitality Government 0% 1% 2% 3% 4% 5% 6% US Philadelphia MSA Source: Calculations from BLS via Haver Analytics. Last month included: US (Apr 2016); Phil MSA (Mar 2016)
19 TRADE-WEIGHTED U.S. DOLLAR INDEXES (Nominal, not seasonally adjusted) Trade-Weighted Indexes (January 1997 = 100) Broad Major Jan 2000 Jan 2005 Jan 2010 Jan 2015 Source: Federal Reserve Board via Haver Analytics Months plotted: Jan Apr 2016
20 THIRD DISTRICT MANUFACTURING BUSINESS OUTLOOK Current and last year's values are labeled Diffusion index (% reporting increase less % reporting decrease) Current Activity Future Activity Jan 2000 Jan 2005 Jan 2010 Jan 2015 Source: FRB Philadelphia via Haver Analytics Months plotted: Jan Apr 2016
21 TRI-STATE AREA MANUFACTURING CONCENTRATION Share of area's total employment relative to U.S. (> 1 more concentrated) PA = 111.9% NJ = 70.6% DE = 66.5% A = Allentown-Bethlehem-Easton MSA B = Altoona MSA C = Atlantic City-Hammonton MSA D = Bloomsburg-Berwick MSA E = Camden Metro Division F = Chambersburg-Waynesboro MSA G = Dover MSA H = East Stroudsburg MSA I = Erie MSA J = Gettysburg MSA K = Harrisburg-Carlisle MSA L = Johnstown MSA M = Lancaster MSA N = Lebanon MSA O = Montgomery-Bucks-Chester County MD P = Newark Metro Division Q* = New York-New Jersey-White Plains MD R = Ocean City MSA S = Philadelphia-Delaware County MD T = Pittsburgh MSA U = Reading MSA V* = Salisbury MSA W = Scranton-Wilkes-Barre-Hazelton MSA X = State College MSA Y = Trenton MSA Z = Vineland-Bridgeton MSA AA = Williamsport MSA AB* = Wilmington Metro Division AC = York-Hanover MSA AD* = Youngstown-Warren MSA * Also includes counties not shown on map. Source: Calculations from BLS data via Haver Analytics Calculations are the mean of figures over past 12 months.
22 Labor market conditions and household income growth
23 U.S. UNEMPLOYMENT RATE Monthly, seasonally adjusted (most recent and last year's values labeled) Percent (seasonally adjusted) 16% 12% 10.9 % 9.8 % 8% 5.5 % 4% 5.0 % 0% U3 U6 Jan 2000 Jan 2005 Jan 2010 Jan 2015 Source: BLS via Haver Analytics Months plotted: Jan 2000 to Mar 2016 Dotted lines indicate average from
24 LABOR MARKET CONDITIONS INDEX VARIABLES Estimated by the Federal Reserve Bank of Kansas City Unemployment rate (U3) Hires rate Broad unemployment rate (U6) Percent of firms planning to increase employment (NFIB) Unemployment forecast (Blue Chip) Average hourly earnings Job flows from U to E Initial claims Quits rate Private nonfarm payroll employment Employment-population ratio Aggregate weekly hours Working part-time for economic reasons Temporary help employment Job leavers Expected job availability (U of Michigan) Job availability index (Conference Board) Labor force participation rate Unemployed 27 or more weeks Manufacturing employment index (ISM) Percent of firms with positions not able to fill right now (NFIB) Announced job cuts (Challenger-Gray-Christmas) Job losers Expected job availability (Conference Board) Source: FRB Kansas City For more information see
25 LABOR MARKET CONDITIONS INDEX Monthly, seasonally adjusted (most recent and last year's values labeled) Relative to long-run trend (> 0 above historical trend) 2 Above Zero Conditions Are Better Than Historical Norms Below Zero Conditions Are Worse Than Historical Norms Source: FRB Kansas City Months plotted: Jan 1992 to Mar 2016 Jan 1995 Jan 2000 Jan 2005 Jan 2010 Jan 2015
26 FRB ATLANTA WAGE TRACKER From the Current Population Survey (3-month moving average) Year-over-year percentage change 4% 3.5 % 3.2 % 2% 0% Overall Prime Age (25-54) Jan 2000 Jan 2005 Jan 2010 Jan 2015 Source: FRB Atlanta via Haver Analytics Months plotted: Jan 2000 to Mar 2016
 Source: Calculations using Census Bureau")
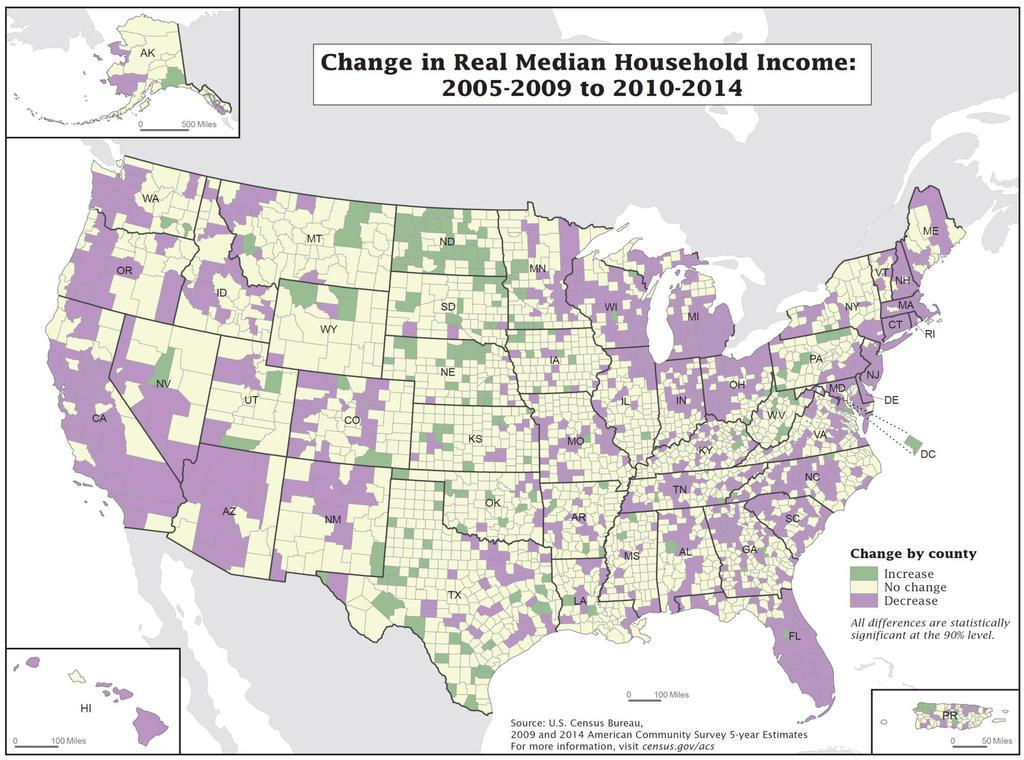
27 REAL MEDIAN HOUSEHOLD INCOME GROWTH, State Labels Are Rankings Out of 50 (1 = highest % increase; 50 = lowest % increase) Source: Calculations using Census Bureau data.
28
29 Inflation & Monetary Policy
30 U.S. PCE INFLATION Year-over-year (seasonally adjusted) Year-over-year percent change (seasonally adjusted) 6% 4% 2% 2.0 % 1.7 % 1.0 % 0% -2% PCE PCE Core FOMC Target Jan 2000 Jan 2005 Jan 2010 Jan 2015 Source: BEA via Haver Analytics Months plotted: Jan Feb 2016
31 U.S. PCE INFLATION Year-over-year (seasonally adjusted) Year-over-year percent change (seasonally adjusted) 25% 20% 15% 10% 5% 0% -5% -10% -15% -20% -25% -30% 2.0 % 1.7 % 1.0 % % PCE PCE Core Energy Goods & Services FOMC Target Jan 2000 Jan 2005 Jan 2010 Jan 2015 Source: BEA via Haver Analytics Months plotted: Jan Feb 2016
32 Basis Point Increase WHAT HAS HAPPENDED IN PAST TIGHTENING CYCLES? Pace = 50 basis points every 3 months Number of Months From Start of Tightening Cycle Average Last 3 Cycles
33 DOT PLOT COMPARISON December 2015 vs March 2016 Percent Dec 2015 Projections Mar 2016 Projections Source: FOMC Projections, December 2015 and March 2016
34 MARKET-IMPLIED PROBABILITY OF A RATE HIKE Using Federal Funds Rate Futures Contract Prices (as of April 25, 2016) 100% 90% 80% 70% 60% 50% 40% 30% 20% 63.52% 51.72% 47.38% 34.87% 23.04% 10% 0% 1/1/2016 1/27/2016 2/22/2016 3/17/2016 4/12/2016 June Rate Hike July Rate Hike September Rate Hike November Rate Hike Dec. Rate Hike Source: Bloomberg
35 SUMMARY Overall, national outlook remains solid Private forecasters expect a slight uptick in growth in 2016 Consumer spending remains solid and household balance sheets are relatively healthy Oil price boost is projected to continue until mid-2017 With labor markets firming, I am looking for wages and household income growth to accelerate in 2016 Inflation remains the key for future interest rate decisions


36 Questions? Gary A. Wagner, Ph.D. Request a Fed Speaker: Follow us on Twitter Like us
 Source: Calculations from Core Logic Last month included:")
37 YEAR-OVER-YEAR STATE HOME PRICE GROWTH Core Logic Index, 3-month moving average (nominal) Source: Calculations from Core Logic Last month included: Feb 2016


38 TRI-STATE AREA HOME PRICE GROWTH Year-over-year, Core Logic index (3-month moving average) Source: Calculations from Core Logic data. Last month included: Feb 2016
National and Regional Economic Update
 National and Regional Economic Update Greater Northeast Philadelphia Chamber of Commerce July 12, 2016 Gary A. Wagner, Ph.D.* FEDERAL RESERVE BANK OF PHILADELPHIA * The views expressed today are my own
Banking Trends & Supervisory Update
 Gladwyne Banking Trends & Supervisory Update William Spaniel Senior Vice President and Lending Officer Overview Banking Trends Regulatory Updates Regulatory Relief Resources Banking Trends Third District
71 st Annual Field Meeting
 71 st Annual Field Meeting Delaware FEDERAL RESERVE BANK OF PHILADELPHIA Welcome Speakers: Keith Morales Cybersecurity John Munera Banking Trends and Supervisory Update Elif Sen Economic Outlook Lunch
71 st Annual Field Meeting
 71 st Annual Field Meeting Williamsport FEDERAL RESERVE BANK OF PHILADELPHIA Banking Trends and Supervisory Update William Spaniel Senior Vice President and Lending Officer Overview Third District Banking
71 st Annual Field Meeting
 71 st Annual Field Meeting Hershey FEDERAL RESERVE BANK OF PHILADELPHIA Banking Trends and Supervisory Update William Spaniel Senior Vice President and Lending Officer Overview Third District Banking Conditions
U.S. DEPARTMENT OF HUD 05/2016 STATE: PENNSYLVANIA HOUSING TRUST FUND PROGRAM RENTS
 STATE: PENNSYLVANIA --------- 2016 HOUSING TRUST FUND PROGRAM RENTS --------------- Allentown-Bethlehem-Easton, PA-NJ MSA Allentown-Bethlehem-Easton, PA HMFA HOUSING TRUST FUND RENT 362 388 504 659 814
Economic Conditions and Outlook
 Economic Conditions and Outlook Directors College Monroeville October 4, 18 Alexander Gilchrist Regional Economist Division of insurance and Research Disclaimer The views expressed in this presentation
The Economic Outlook
 The Economic Outlook Loretta J. Mester* Executive Vice President and Director of Research 8 th Annual Temple University Fox School of Business Leadership and Professional Development Seminar February 21,
5.7% 5,895,200 13,778
 PA MONTHLY WORKSTATS LABOR FORCE JOBS UNEMPLOYMENT COMPENSATION PA Monthly WorkStats presents the most up-to-date labor market highlights and happenings in the commonwealth. Information herein is produced
WORKFORCE INFORMATION NEWS RELEASE
 651 Boas Street Room 220 Harrisburg, PA 17121 www.paworkstats.state.pa.us WORKFORCE INFORMATION NEWS RELEASE A-B-E UNEMPLOYMENT RATE ROSE TO 8.4% IN MAY EMBARGOED 12:01 A.M. TUESDAY, JUNE 28, 2011 CONTACT:
Report on Economic and Financial Developments
 Report on Economic and Financial Developments Loretta J. Mester Executive Vice President and Director of Research June 1, 1 *The views expressed here are those of the author and do not necessarily reflect
WORKFORCE INFORMATION NEWS RELEASE
 651 Boas Street Room 220 Harrisburg, PA 17121 www.paworkstats.state.pa.us WORKFORCE INFORMATION NEWS RELEASE EMBARGOED 12:01 A.M. WEDNESDAY, DECEMBER 29, 2010 CONTACT: WILLIAM SHOLLY INDUSTRY & BUSINESS
4.8% 6,004,600 61,300
 PA MONTHLY WORKSTATS LABOR FORCE JOBS UNEMPLOYMENT COMPENSATION PA Monthly WorkStats presents the most up-to-date labor market highlights and happenings in the commonwealth. Information herein is produced
4.8% 6,005,900 60,000
 PA MONTHLY WORKSTATS LABOR FORCE JOBS UNEMPLOYMENT COMPENSATION PA Monthly WorkStats presents the most up-to-date labor market highlights and happenings in the commonwealth. Information herein is produced
4.6% 5,976,00 77,720
 PA MONTHLY WORKSTATS LABOR FORCE JOBS UNEMPLOYMENT COMPENSATION PA Monthly WorkStats presents the most up-to-date labor market highlights and happenings in the commonwealth. Information herein is produced
4.1% 6,035,600 39,690
 PA MONTHLY WORKSTATS LABOR FORCE JOBS UNEMPLOYMENT COMPENSATION PA Monthly WorkStats presents the most up-to-date labor market highlights and happenings in the commonwealth. Information herein is produced
4.8% 5,987, ,100
 PA MONTHLY WORKSTATS LABOR FORCE JOBS UNEMPLOYMENT COMPENSATION PA Monthly WorkStats presents the most up-to-date labor market highlights and happenings in the commonwealth. Information herein is produced
4.7% 5,994,700 99,110
 PA MONTHLY WORKSTATS LABOR FORCE JOBS UNEMPLOYMENT COMPENSATION PA Monthly WorkStats presents the most up-to-date labor market highlights and happenings in the commonwealth. Information herein is produced
Report on Economic and Financial Developments
 Report on Economic and Financial Developments Loretta J. Mester Executive Vice President and Director of Research July, 1 *The views expressed here are those of the author and do not necessarily reflect
US & PA Construction Spending, Labor and Materials Outlook
 US & PA Construction Spending, Labor and Materials Outlook PCBE, Philadelphia September 7, 2018 Ken Simonson Chief Economist, AGC of America simonsonk@agc.org 2 Headline Forecast The US economy is strong
Emerging Trends in the U.S. and Colorado Economies
 Emerging Trends in the U.S. and Colorado Economies Sam Chapman Associate Economist Federal Reserve Bank of Kansas City Denver Branch The views expressed are those of the presenter and do not necessarily
Economic Conditions and Outlook and Consumer Credit Conditions
 Economic Conditions and Outlook and Consumer Credit Conditions NACM-CFDD Kansas City Kansas City, MO Kelly D. Edmiston Senior Economist Disclaimer This presentation reflects the views of the speaker and
4.5% 6,014,400 53,080
 PA MONTHLY WORKSTATS LABOR FORCE JOBS UNEMPLOYMENT COMPENSATION PA Monthly WorkStats presents the most up-to-date labor market highlights and happenings in the commonwealth. Information herein is produced
National Economic Indicators. May 7, 2018
 National Economic Indicators May 7, 18 Table of Contents GDP Release Date Latest Period Page Table: Real Gross Domestic Product Apr-7-18 8:31 Q1-18 Real Gross Domestic Product Apr-7-18 8:31 Q1-18 5 Decomposition
4.6% 5,852,000 23,941
 PA MONTHLY WORKSTATS LABOR FORCE JOBS UNEMPLOYMENT COMPENSATION PA Monthly WorkStats presents the most up-to-date labor market highlights and happenings in the commonwealth. Information herein is produced
A View from the Fed: Slouching toward 2016
 A View from the Fed: Slouching toward 2016 28 th Annual Economic Outlook Conference, University of Alabama Culverhouse College of Commerce Montgomery, AL January 14, 2016 The views expressed are those
Trends and Transitory Shocks
 EMBARGOED UNTIL WEDNESDAY, SEPTEMBER 27 AT 7:00 P.M.; OR UPON DELIVERY Trends and Transitory Shocks Eric S. Rosengren President & CEO Federal Reserve Bank of Boston September 27, 2017 The Money Marketeers
Plunging Oil Prices: Impact on the U.S. and State Economies
 Plunging Oil Prices: Impact on the U.S. and State Economies Mine Yücel Senior Vice President and Director of Research November 17, 216 Nominal price, weekly 16 14 Oil and gas prices volatile 12 1 Oil price
- US LEI & CEI - Yardeni Research, Inc.
 - US LEI & CEI - 11 1 Figure. LEADING & COINCIDENT ECONOMIC INDICATORS (=, ratio scale) 11 1 Leading Economic Indicators recovering rapidly. Coincident Economic Indicators recovering slowly. 9 9 9 9 7
U.S. and Regional Economic Conditions and Outlook
 U.S. and Regional Economic Conditions and Outlook CFA Society of Nebraska Omaha, NE January 14, 215 Kelly D. Edmiston Federal Reserve Bank of Kansas City Outline Structure and Role of the Federal Reserve
U.S. Economic Activity. Federal Reserve Bank of Dallas
 U.S. Economic Activity Federal Reserve Bank of Dallas 2018 Contents 1 Economic Activity 2 Wages and Prices 3 Financial Activity Economic Activity Economic Activity 1 month % change 1.0 Real Personal Consumption
U.S. Economic Activity. Federal Reserve Bank of Dallas
 U.S. Economic Activity Federal Reserve Bank of Dallas 2018 Contents 1 Economic Activity 2 Wages and Prices 3 Financial Activity Economic Activity Economic Activity Initial Claims for Unemployment and Unemployment
U.S. Economic Activity. Federal Reserve Bank of Dallas
 U.S. Economic Activity Federal Reserve Bank of Dallas 2018 Contents 1 Economic Activity 2 Wages and Prices 3 Financial Activity Economic Activity Economic Activity New Orders for Durable Goods Billions
U.S. Economic Activity. Federal Reserve Bank of Dallas
 U.S. Economic Activity Federal Reserve Bank of Dallas 2018 Contents 1 Economic Activity 2 Wages and Prices 3 Financial Activity Economic Activity Economic Activity Initial Claims for Unemployment and Unemployment
The President s Report to the Board of Directors
 The President s Report to the Board of Directors April 4, 214 Current Economic Developments - April 4, 214 Data released since your last Directors' meeting show the economy was a bit stronger in the fourth
Will the Recovery Ever End? Certified Financial Planners
 Will the Recovery Ever End? Certified Financial Planners Place cover image here Richard Wobbekind Senior Economist and Associate Dean for Business and Government Relations January 25, 219 Attention: This
The Outlook for the U.S. Economy National Association of Credit Union Supervisory and Auditing Committees Annual Conference and Expo Louisville, KY
 The Outlook for the U.S. Economy National Association of Credit Union Supervisory and Auditing Committees Annual Conference and Expo Louisville, KY Kevin L. Kliesen Business Economist and Research Officer
Economic Update Adrienne C. Slack March 2017
 Economic Update Adrienne C. Slack March 2017 The views expressed are mine, and not necessarily those of the Atlanta Fed or the Federal Reserve System. 2 The Fed s Dual Mandate The Fed is pursuing two objectives
BBVA Research U.S. Economic Outlook August 2018 / 1. U.S. Economic Outlook August 2018
 BBVA Research U.S. Economic Outlook August 2018 / 1 U.S. Economic Outlook August 2018 Economic Outlook Incoming data consistent with baseline of high growth and inflation in 2018 & 2019 There was no change
National Economic Indicators. December 11, 2017
 National Economic Indicators December 11, 17 Table of Contents GDP Release Date Latest Period Page Table: Real Gross Domestic Product Nov-9-17 8:3 Q3-17 Real Gross Domestic Product Nov-9-17 8:3 Q3-17 5
Economic Conditions and Outlook for the U.S., Kansas, and the Midwest
 Economic Conditions and Outlook for the U.S., Kansas, and the Midwest Midwest Regional Public Finance Conference Wichita, KS April 25, 2014 Kelly D. Edmiston Federal Reserve Bank of Kansas City Overview
One Policymaker s Wait for Better Economic Data
 EMBARGOED UNTIL MONDAY, JUNE 1, 2015 AT 9:00 A.M. EASTERN TIME OR UPON DELIVERY One Policymaker s Wait for Better Economic Data Eric S. Rosengren President & CEO Federal Reserve Bank of Boston June 1,
ECONversations. Economic and Policy Briefing Webcast Dave Altig, Research Director November 19, :00 p.m. ET
 ECONversations Economic and Policy Briefing Webcast Dave Altig, Research Director November 9, 4 : p.m. ET Questions for Dave: events@atl.frb.org Technical issues: james.dooley@atl.frb.org Information received
ECONOMIC AND FINANCIAL HIGHLIGHTS
 ECONOMIC AND FINANCIAL HIGHLIGHTS LABOR MARKET Contributions to Change in Nonfarm Payrolls 2 Unemployment and Labor Force Participation Rate 3 MANUFACTURING ISM Manufacturing Index 4 CONSUMERS Light Vehicle
The Oil Market: From Boom to Gloom
 The Oil Market: From Boom to Gloom Mine Yücel Senior Vice President and Director of Research February 12, 216 The views expressed are those of the speaker and should not be attributed to the or the Federal
Emerging Trends in the U.S. and Colorado Economies
 Emerging Trends in the U.S. and Colorado Economies Alison Felix Economist and Branch Executive Federal Reserve Bank of Kansas City Denver Branch The views expressed are those of the presenter and do not
Economic Conditions and Outlook for the U.S. and Greater Kansas City Area
 Economic Conditions and Outlook for the U.S. and Greater Kansas City Area Mid-America Planned Giving Council Kansas City, MO January 9, 215 Kelly D. Edmiston Federal Reserve Bank of Kansas City Economic
Will the Recovery Ever End? Boulder Economic Forecast
 Will the Recovery Ever End? Boulder Economic Forecast Place cover image here Richard Wobbekind Senior Economist and Associate Dean for Business and Government Relations January 17, 219 #COBizOutlook Real
The U.S. Economy s Current Performance and Outlook
 Delta Associates Spring Seminar The U.S. and Washington Area Economies: Current Performance and Outlook: 24-29 Stephen S. Fuller, Ph.D. Dwight Schar Faculty Chair and University Professor Director, Center
HOME ENERGY CONSUMPTION EXPENDITURES BY INCOME (PENNSYLVANIA) May Prepared For: Pennsylvania Utility Law Project (PULP Harrisburg, Pennsylvania
 May Prepared For: Pennsylvania Utility Law Project (PULP Harrisburg, Pennsylvania") HOME ENERGY CONSUMPTION EXPENDITURES BY INCOME (PENNSYLVANIA) May 2009 Prepared For: Pennsylvania Utility Law Project (PULP Harrisburg, Pennsylvania May 2009 HOME ENERGY CONSUMPTION AND EXPENDITURES BY
HOME ENERGY CONSUMPTION EXPENDITURES BY INCOME (PENNSYLVANIA) May 2009 Prepared For: Pennsylvania Utility Law Project (PULP Harrisburg, Pennsylvania May 2009 HOME ENERGY CONSUMPTION AND EXPENDITURES BY
U.S. Economic Update and Outlook. Laurel Graefe, REIN Director Federal Reserve Bank of Atlanta October 2, 2013
 1 U.S. Economic Update and Outlook Laurel Graefe, REIN Director Federal Reserve Bank of Atlanta October 2, 213 Following the deepest recession since the 193s, the economic recovery is well under way, though
U.S. & District Economic Outlook
 U.S. & District Economic Outlook Nebraska LEAD Program February 5, 2015 Jason Brown Senior Economist The views expressed are those of the presenter and do not necessarily reflect the positions of the Federal
ECONOMIC AND FINANCIAL HIGHLIGHTS
 ECONOMIC AND FINANCIAL HIGHLIGHTS FEDERAL RESERVE BALANCE SHEET Assets and Liabilities 2-3 REAL ESTATE Construction Spending 4 CoreLogic Home Price Index 5 Mortgage Rates and Applications 6-7 CONSUMER
Ahmad Ijaz Center for Business and Economic Research Culverhouse College of Commerce The University of Alabama
 US Economic Outlook Ahmad Ijaz Center for Business and Economic Research Culverhouse College of Commerce The University of Alabama Composite Can and Tube Institute Annual Meeting Point Clear, Alabama May
Staff GDP Forecast Summary
 Staff GDP Forecast Summary Real growth: about ¾% (Q/Q) in 8 and ½% in 9. Forecast for 8 stronger than that presented at April 7 EAP. Forecasts for 8 and 9 similar to Blue Chip consensus. Outlook reflects
NAHEFFA March 26, The views expressed are my own and do not necessarily reflect official positions of the Federal Reserve System.
 NAHEFFA March 26, 219 The views expressed are my own and do not necessarily reflect official positions of the Federal Reserve System. National Economy Growing Strongly Jobs grew 1.8% in 218 the fastest
Outlook for the Texas Economy. Luis Bernardo Torres Ruiz, Ph.D. August 26, 2016
 Outlook for the Texas Economy Luis Bernardo Torres Ruiz, Ph.D. August 26, 2016 Research Economist Texas Society of Architects Contents 1. U.S. Economic Outlook 2. Texas Economic Outlook 3. Challenges and
Plunging Crude Prices: Impact on U.S. and State Economies
 Plunging Crude Prices: Impact on U.S. and State Economies Mine Yücel Senior Vice President and Director of Research August 7, 215 Oil and gas prices plunge Nominal price, $, weekly 16 14 12 Oil Price 1
The U.S. Economic Outlook
 The U.S. Economic Outlook Gering/Scottsbluff Economic Forum August 23, 216 George A. Kahn Vice President and Economist The views expressed are those of the author and do not necessarily reflect the opinions
Monthly Economic Indicators And Charts
 Monthly Economic Indicators And Charts June Richard F. Moody- Chief Economist Steve Pfitzer Investor Relations Information contained herein is based on data obtained from recognized sources believed to
Single-family home sales and construction are not expected to regain 2005 peaks
 Single-family home sales and construction are not expected to regain 25 peaks Millions of units 8. 7. 6. 5. Housing starts (right axis) 4. Home sales (left axis) 3. 2. 1. 198 1985 199 1995 2 25 21 215
U.S. and Oklahoma Economic Update. Megan Williams Associate Economist and Manager, Oklahoma City Branch. The U.S. Economy and Monetary Policy
 U.S. and Oklahoma Economic Update Megan Williams Associate Economist and Manager, Oklahoma City Branch The U.S. Economy and Monetary Policy GDP growth was relatively strong in the second half of Growth
The Outlook for the U.S. Economy: Sunny Skies But Developing Storm Clouds? The Financial Executives Networking Group Des Peres, MO
 The Outlook for the U.S. Economy: Sunny Skies But Developing Storm Clouds? The Financial Executives Networking Group Des Peres, MO Kevin L. Kliesen Business Economist and Research Officer March 28, 2018
The U.S. Economic Outlook
 The U.S. Economic Outlook November, Economic Club of Sheboygan George A. Kahn Vice President and Economist Federal Reserve Bank of Kansas City Outlook themes Growth has rebounded following a soft first
The Keystone Research Center 412 N. Third Street, Harrisburg PA Unemployment Claims Rising in Pennsylvania
 Briefing Paper The Keystone Research Center 412 N. Third Street, Harrisburg PA 17101 www.keystoneresearch.org Unemployment Claims Rising in Pennsylvania David H. Bradley and Stephen A. Herzenberg November
2016 Texas Economic Outlook: Riding the Energy Roller Coaster Keith Phillips Assistant Vice President and Senior Economist
 216 Texas Economic Outlook: Riding the Energy Roller Coaster Keith Phillips Assistant Vice President and Senior Economist The views expressed in this presentation are strictly those of the presenter and
Dothan Rotary Club. Economic Update. Lesley McClure Federal Reserve Bank of Atlanta October 2, 2013
 Economic Update Dothan Rotary Club The views expressed here are not necessarily those of the FOMC, the Federal Reserve Bank of Atlanta or the Federal Reserve System. Lesley McClure Federal Reserve Bank
Economic Highlights. ISM Purchasing Managers Index 1. Sixth District Payroll Employment by Industry 2. Contributions to Real GDP Growth 3
 December 1, 2010 Economic Highlights Manufacturing ISM Purchasing Managers Index 1 Employment Sixth District Payroll Employment by Industry 2 Economic Activity Contributions to Real GDP Growth 3 Prices
The Federal Reserve, Monetary Policy, and Economic Indicators
 The Federal Reserve, Monetary Policy, and Economic Indicators Megan Williams Associate Economist Federal Reserve Bank of Kansas City, Oklahoma City Branch The Creation of the Fed The first two national
The Federal Reserve has set the target range for the federal
 NationalEconomicTrends October Monetary Policy Stance: The View from Consumption Spending The Federal Reserve has set the target range for the federal funds at to 5 percent and intends to keep this near
Economic Data and Interest Rate Forecast
 Economic Data and Interest Rate Forecast February 2018 (Data through February 14, 2018) Monthly highlights Nonfarm Payroll off to solid start in 2018 Year over year wage growth jumps Manufacturing sector
Moving On Up Today s Economic Environment
 Moving On Up Today s Economic Environment Presented by PFM Asset Management LLC Gray Lepley, Senior Analyst, Portfolio Strategies November 8, 2018 PFM 1 U.S. ECONOMY Today s Agenda MONETARY POLICY GEOPOLITICAL
Washington Building Congress. The U.S. and Washington Area Economic Performance and Outlook
 Washington Building Congress The U.S. and Washington Area Economic Performance and Outlook Stephen S. Fuller, Ph.D. Dwight Schar Faculty Chair and University Professor Director, Center for Regional Analysis
Economic Overview. Academic Advisory Council May 6, Spencer Krane Senior Vice President Federal Reserve Bank of Chicago
 Economic Overview Academic Advisory Council May 6, 6 Spencer Krane Senior Vice President Federal Reserve Bank of Chicago The views expressed are my own and not those of the Federal Reserve Bank of Chicago
The Breakfast Group. The Outlook for the U.S. and Washington Area Economies In 2013 and Beyond
 The Breakfast Group The Outlook for the U.S. and Washington Area Economies In 2013 and Beyond Stephen S. Fuller, Ph.D. Dwight Schar Faculty Chair and University Professor Director, Center for Regional
The U.S. Macro Outlook: Reasons for Optimism and Concern MARISA DI NATALE, DIRECTOR
 The U.S. Macro Outlook: Reasons for Optimism and Concern MARISA DI NATALE, DIRECTOR Fiscal Headwinds Are Set to Fade Contribution to real GDP growth, % 5 4 3 2 1 0-1 -2-3 -4-5 -6 Private economy Fiscal
Lending and Foreclosure in NJ
 Lending and Foreclosure in NJ Kathe Newman, Associate Professor and Director with Ben Teresa, Mirabel Chen, Michael D Orazio Research Associates Ralph W. Voorhees Center for Civic Engagement Urban Planning
COMMUNITY REINVESTMENT ACT PERFORMANCE EVALUATION
 PUBLIC DISCLOSURE Date of Evaluation: FEBRUARY 2, 2009 COMMUNITY REINVESTMENT ACT PERFORMANCE EVALUATION Name of Depository Institution: SUSQUEHANNA BANK Institution s Identification Number: 682611 Address:
The Federal Reserve, Monetary Policy, and Economic Indicators
 The Federal Reserve, Monetary Policy, and Economic Indicators Megan Williams Associate Economist Federal Reserve Bank of Kansas City, Oklahoma City Branch The Creation of the Fed The first two national
Consumer Price Index, Jobless Claims, Housing Starts Each of These Reports Have Favorable Aspects to Note
 Consumer Price Index, Jobless Claims, Housing Starts Each of These Reports Have Favorable Aspects to Note January 19, Asha G. Bangalore agb3@ntrs.com The Consumer Price Index (CPI) held steady in December,
Nonfarm Payroll Employment
 PRESIDENT'S REPORT TO THE BOARD OF DIRECTORS, FEDERAL RESERVE BANK OF BOSTON Current Economic Developments - June 10, 2004 Data released since your last Directors' meeting show the economy continues to
Decline in Economic Activity Larger Than Advance GDP Estimate February 27, 2009
 Northern Trust Global Economic Research 5 South LaSalle Chicago, Illinois 663 northerntrust.com Asha G. Bangalore agb3@ntrs.com Decline in Economic Activity Larger Than Advance GDP Estimate February 27,
National and Virginia Economic Outlook
 National and Virginia Economic Outlook Association of Electric Cooperatives September 29, 215 Sonya Ravindranath Waddell Regional Economist Research Department The views and opinions expressed herein are
Michigan s January Unemployment Rate Moves Up Seasonally
 Labor Market News Michigan s March 2016 Vol. 72, Issue No. 1 Percent Michigan s January Unemployment Rate Moves Up Seasonally Michigan s unemployment rate (not seasonally adjusted) increased by 0.6 of
Pennsylvania Economic Insights August 2018
 Pennsylvania Economic Insights August 2018 Mark Vitner Senior Economist (704) 410-3277 mark.vitner@wellsfargo.com Michael Pugliese Economist (212) 214-5058 michael.d.pugliese@wellsfargo.com August 21,
2018 Texas Economic Outlook: Firing on All Cylinders
 218 Texas Economic Outlook: Firing on All Cylinders Keith Phillips Assistant Vice President and Senior Economist 4/5/218 The views expressed in this presentation are strictly those of the presenter and
Economic Indicators For Manufacturing Executives
 Economic Indicators For Manufacturing Executives Valuable Data for a Complex World Presented by: Cliff Waldman Chief Economist, MAPI Foundation cwaldman@mapi.net Today s Presentation The Value of Economic
U.S. & Missouri Economic Outlook
 U.S. & Missouri Economic Outlook Missouri Government Finance Officers Association Jason Brown Economist The views expressed are those of the presenter and do not necessarily reflect the positions of the
U.S. Economic Outlook and Monetary Policy
 U.S. Economic Outlook and Monetary Policy March 26, 21 Craig S. Hakkio Senior Vice President and Special Advisor on Economic Policy Overview U.S. growth remains strong, though temporary factors are likely
National and Regional Update Charlotte Chapter of American Association of Individual Investors, Sept. 14, Rick Kaglic Senior Regional Economist
 National and Regional Update Charlotte Chapter of American Association of Individual Investors, Sept. 14, 2013 Rick Kaglic Senior Regional Economist A Quick Disclaimer 2 Real Gross Domestic Product 2012
CALHOUN COUNTY CHAMBER OF COMMERCE AND VISITORS CENTER
 2017 Economic Forum CALHOUN COUNTY CHAMBER OF COMMERCE AND VISITORS CENTER Information provided by School of Business and Industry THANK YOU to our SPONSORS Calhoun County Economy Forum National Update
Texas Economic Outlook: Strong Growth Continues
 Texas Economic Outlook: Strong Growth Continues Keith Phillips Assistant Vice President and Senior Economist 1/23/18 The views expressed in this presentation are strictly those of the presenter and do
Economic Update. Air & Waste Management Association. Georgia Chapter. Michael Chriszt Federal Reserve Bank of Atlanta October 4, 2013
 1 Economic Update Air & Waste Management Association Georgia Chapter The views expressed here are not necessarily those of the FOMC, the Federal Reserve Bank of Atlanta, or the Federal Reserve System.
The U.S. Economy s Current Performance and Outlook
 /3/4 Board of Directors, Northern Virginia Association of Realtors The Current Economic Outlook & Area Housing Market Conditions Stephen S. Fuller, Ph.D. Dwight Schar Faculty Chair and University Professor
Michigan s July Unemployment Rate Moves Up Seasonally
 Labor Market News Michigan s September 2016 Vol. 72, Issue No. 7 Percent Michigan s July Unemployment Rate Moves Up Seasonally Michigan s unemployment rate (not seasonally adjusted) increased by 0.5 of
Current Employment Statistics
 Current Employment Statistics October 2017 If you have any questions or seek additional information, please contact: Vermont Department of Labor Economic and Labor Market Information Division 802-828-4202
With the tax filing season in full swing, these summary
 NationalEconomicTrends March Income Taxes: Who Pays and How Much? With the tax filing season in full swing, these summary figures may provide some perspective on the issue of who is paying federal individual
Current Employment Statistics
 Current Employment Statistics December 2017 If you have any questions or seek additional information, please contact: Vermont Department of Labor Economic and Labor Market Information Division 802-828-4202
Washington Area Economy: Performance and Outlook
 Washington Area Economy: Performance and Outlook Center for Regional Analysis Schar School of Policy and Government George Mason University August 22, 218 6. U.S. Gross Domestic Product Quarterly Change
US Macro Overview March 8, 2018
 US Macro Overview March 8, 8 Overview Growth in the US has firmed in recent quarters as the shocks that hit the economy in mid dollar appreciation and falling commodity prices have largely run their course.