COMMUNITY REINVESTMENT ACT PERFORMANCE EVALUATION
|
|
|
- Cathleen Robertson
- 5 years ago
- Views:
Transcription
1 PUBLIC DISCLOSURE Date of Evaluation: FEBRUARY 2, 2009 COMMUNITY REINVESTMENT ACT PERFORMANCE EVALUATION Name of Depository Institution: SUSQUEHANNA BANK Institution s Identification Number: Address: 26 NORTH CEDAR STREET LITITZ, PENNSYLVANIA FEDERAL RESERVE BANK OF PHILADELPHIA TEN INDEPENDENCE MALL PHILADELPHIA, PENNSYLVANIA NOTE: This document is an evaluation of this institution s record of meeting the credit needs of the entire community, including low- and moderate-income neighborhoods, consistent with the safe and sound operation of the institution. This evaluation is not, nor should it be construed as, an assessment of the financial condition of this institution does not represent an analysis, conclusion or opinion of the Federal Reserve Bank of Philadelphia concerning the safety and soundness of this financial institution.
2 Table of Contents INSTITUTION S RATING...1 INSTITUTION S CRA RATING... 1 TABLE OF PERFORMANCE TEST RATINGS... 1 SUMMARY OF MAJOR FACTORS CONTRIBUTING TO THIS RATING... 1 INSTITUTION...2 DESCRIPTION OF INSTITUTION... 2 DESCRIPTION OF ASSESSMENT AREAS... 4 SCOPE OF EXAMINATION... 5 CONCLUSIONS WITH RESPECT TO PERFORMANCE TESTS... 6 COMPLIANCE WITH FAIR LENDING LAWS... 9 MULTI-STATE METROPOLITAN AREA...9 PHILADELPHIA-CAMDEN-WILMINGTON, PA-NJ-DE-MD, METROPOLITAN STATISTICAL AREA CRA RATING... 9 SUMMARY OF MAJOR FACTORS SUPPORTING RATING... 9 PHILADELPHIA-CAMDEN-WILMINGTON METROPOLITAN STATISTICAL AREA CONCLUSIONS WITH RESPECT TO PERFORMANCE TESTS MULTI-STATE METROPOLITAN AREA...23 HAGERSTOWN-MARTINSBURG, MD-WV METROPOLITAN STATISTICAL AREA CRA RATING CONCLUSIONS WITH RESPECT TO PERFORMANCE TESTS STATE OF PENNSYLVANIA...34 PENNSYLVANIA CRA RATING SUMMARY OF MAJOR FACTORS SUPPORTING RATING SCOPE OF EXAMINATION FULL REVIEW ASSESSMENT AREA CONCLUSIONS...36 LANCASTER, PA METROPOLITAN STATISTICAL AREA CONCLUSIONS WITH RESPECT TO PERFORMANCE TESTS NORTH CENTRAL PENNSYLVANIA: NORTHUMBERLAND, SCHUYLKILL, SNYDER, AND UNION COUNTIES NON-METROPOLITAN AREA CONCLUSIONS WITH RESPECT TO PERFORMANCE TESTS HARRISBURG-CARLISLE, PA, METROPOLITAN STATISTICAL AREA CONCLUSIONS WITH RESPECT TO PERFORMANCE TESTS YORK-HANOVER-GETTYSBURG CONSOLIDATED STATISTICAL AREA CONCLUSIONS WITH RESPECT TO PERFORMANCE TESTS LIMITED REVIEW ASSESSMENT AREA CONCLUSIONS...83 STATE OF MARYLAND...93 MARYLAND CRA RATING BALTIMORE-TOWSON, MD METROPOLITAN STATISTICAL AREA CONCLUSIONS WITH RESPECT TO PERFORMANCE TESTS... 97
3 LIMITED REVIEW ASSESSMENT AREA CONCLUSIONS ALLEGANY COUNTY, MD (CUMBERLAND METROPOLITAN STATISTICAL AREA)105 WORCESTER COUNTY, MD GARRETT COUNTY, MARYLAND, NON-METROPOLITAN AREA STATE OF NEW JERSEY NEW JERSEY CRA RATING SUMMARY OF MAJOR FACTORS SUPPORTING RATING SCOPE OF EXAMINATION FULL REVIEW ASSESSMENT AREA CONCLUSIONS VINELAND-MILLVILLE-BRIDGETON, NJ, METROPOLITAN STATISTICAL AREA CONCLUSIONS WITH RESPECT TO PERFORMANCE TESTS LIMITED REVIEW ASSESSMENT AREA CONCLUSIONS ATLANTIC CITY, NJ, METROPOLITAN STATISTICAL AREA CRA APPENDICES CRA APPENDIX A: GLOSSARY CRA APPENDIX B: HMDA LOAN DISTRIBUTION TABLES CRA APPENDIX C: ASSESSMENT AREA MAPS
4 INSTITUTION S CRA RATING Susquehanna Bank is rated SATISFACTORY. INSTITUTION S RATING TABLE OF PERFORMANCE TEST RATINGS The following table indicates the performance level of Susquehanna Bank with respect to the lending, investment, and service tests. PERFORMANCE TEST MATRIX Performance Levels Lending Test* Investment Test Service Test Outstanding X High Satisfactory X X Low Satisfactory Needs to Improve Substantial Noncompliance *Note: The lending test is weighted more heavily than the investment and service tests in determining the overall rating. SUMMARY OF MAJOR FACTORS CONTRIBUTING TO THIS RATING Major factors contributing to the rating include the following. A substantial majority of the bank s loans were made inside its assessment areas. The geographic distribution of loans reflects good penetration throughout the bank s assessment areas. The distribution of borrowers, given the product lines offered by the bank, reflects excellent penetration among retail customers of different income levels and good penetration among business customers of different sizes. The bank has a good record of serving the credit needs of the most economically disadvantaged areas of its assessment areas, low-income individuals, and very small businesses, consistent with safe and sound banking practices. The bank is a leader in making community development loans. The bank has an excellent level of qualified community development investments and grants. The bank provides a relatively high level of community development services. 1
5 DESCRIPTION OF INSTITUTION INSTITUTION Susquehanna Bank (Susquehanna), headquartered in Lititz, Pennsylvania, is a multi-state bank providing consumer and commercial banking services through 236 branches in Pennsylvania, New Jersey, Maryland, and West Virginia. The bank is a wholly-owned subsidiary of Susquehanna Bancshares, Inc. (SBI), a financial holding company with assets of $13.7 billion as of December 31, Susquehanna is the successor to the October 11, 2008 merger of SBI s three subsidiary banks: Susquehanna Bank PA, Lititz, PA; Susquehanna Bank DV, Bryn Mawr, PA; and Susquehanna Bank, Hagerstown, MD. The combined bank, renamed Susquehanna Bank, is based out of SBI s Pennsylvania headquarters in Lititz, PA. As of December 31, 2008, Susquehanna reported total loans of $9.6 billion, or 72% of bank assets. On a dollar volume basis, commercial loans, which include commercial mortgages and commercial and industrial loans, is the most material product offered by the bank. The second most significant product is loans secured by residential property. The following table details Susquehanna s loan portfolio: LOANS as of 12/31/2008 $000 % Construction & Land Development 1,313, Open-end Loans Secured by Residential Properties 353, Closed-end Loans Secured by Residential Property 1,742, Secured by Multifamily Residential Property 203, Loans Secured by Farmland 178, Loans to Finance Agricultural Production 18, Commercial Mortgages 2,697, Commercial and Industrial 1,921, Consumer Loans 314, Obligations of States and Political Subdivisions 203, Other Loans 26, Lease Financing Receivables 678, TOTAL LOANS $9,649, % Source: Consolidated Reports of Condition and Income, Schedule RC-C 2
6 The table below details the locations of Susquehanna s branches. Metropolitan Area County Number of Branches Philadelphia MSA Chester County, PA 5 Philadelphia MSA Delaware County, PA 3 Philadelphia MSA Montgomery County, PA 6 Philadelphia MSA Camden County, NJ 9 Philadelphia MSA Gloucester County, NJ 4 Philadelphia MSA Burlington County, NJ 5 Reading MSA Berks County, PA 8 Allentown-Bethlehem-Easton MSA Lehigh County, PA 5 Allentown-Bethlehem-Easton MSA Northampton County, PA 3 Vineland-Millville-Bridgeton MSA Cumberland County, NJ 7 Atlantic City MSA Atlantic County, NJ 6 Lancaster MSA Lancaster County, PA 40 York-Hanover-Gettysburg CSA York County, PA 24 York-Hanover-Gettysburg CSA Adams County, PA 3 Williamsport MSA Lycoming County, PA 7 North Central PA Non-MSA Northumberland County, PA 8 North Central PA Non-MSA Schuylkill County, PA 7 North Central PA Non-MSA Snyder County, PA 3 North Central PA Non-MSA Union County, PA 1 Scranton-Wilkes Barre MSA Luzerne County, PA 3 Harrisburg-Carlisle MSA Cumberland County, PA 4 Harrisburg-Carlisle MSA Dauphin County, PA 12 South Central PA Non-MSA Bedford County, PA 4 South Central PA Non-MSA Franklin County, PA 6 Hagerstown-Martinsburg MSA Washington County, MD 11 Hagerstown-Martinsburg MSA Berkeley County, WV 4 Baltimore-Towson MSA Baltimore City, MD 2 Baltimore-Towson MSA Anne Arundel County, MD 2 Baltimore-Towson MSA Baltimore County, MD 12 Baltimore-Towson MSA Carroll County, MD 6 Baltimore-Towson MSA Harford County, MD 2 Baltimore-Towson MSA Howard County, MD 3 Cumberland MSA Allegany County, MD 8 Non-MSA Garrett County, MD 2 Non-MSA Worcester County, MD 1 Total Branches 236 3
7 DESCRIPTION OF ASSESSMENT AREAS For purposes of CRA, Susquehanna has designated the following 17 assessment areas: 1. The Lancaster assessment area consists of Lancaster County, Pennsylvania, which encompasses the entire Lancaster MSA. 2. The Harrisburg assessment area includes Cumberland and Dauphin Counties in the Harrisburg-Carlisle, PA, MSA. 3. The Philadelphia assessment area consists of Chester, Delaware, Montgomery, and Philadelphia Counties in Pennsylvania and Camden, Burlington, and Gloucester Counties in New Jersey. All seven counties are located in the Philadelphia-Camden-Wilmington, PA- NJ-DE-MD MSA. 4. The York assessment area consists of York and Adams Counties, encompassing the entire York-Hanover-Gettysburg combined statistical area. 5. The North Central Pennsylvania assessment area includes the non-metropolitan counties of Northumberland, Schuylkill, Snyder, and Union. 6. The Reading assessment area consists of Berks County, Pennsylvania, which encompasses the entire Reading MSA. 7. The Allentown assessment area consists of Lehigh and Northampton Counties in the Allentown-Bethlehem-Easton, PA-NJ MSA. 8. The Williamsport assessment area consists of Lycoming County, Pennsylvania, encompassing the entire Williamsport MSA. 9. The South Central Pennsylvania assessment area includes the non-metropolitan counties of Bedford, Franklin, Fulton and Huntingdon. 10. The Scranton assessment area consists of Luzerne County, Pennsylvania, located in the Scranton-Wilkes-Barre, PA, MSA. 11. The Vineland assessment area consists of Cumberland County, New Jersey, which encompasses the entire Vineland-Millville-Bridgeton, NJ, MSA. 12. The Atlantic City assessment area consists of Atlantic County, New Jersey, which encompasses the entire Atlantic City, NJ, MSA. 13. The Hagerstown assessment area includes Washington County in Maryland and Berkeley County in West Virginia, in the Hagerstown-Martinsburg, MD-WV, MSA. 14. The Baltimore assessment area consists of Baltimore City and the counties of Anne Arundel, Baltimore, Carroll, Harford and Howard, all located in the Baltimore-Towson MSA in Maryland. 15. The Garrett County assessment area is located in a non-metropolitan area of Maryland. 4
8 16. The Allegany County assessment area consists of the Maryland portion of the Cumberland MD-WV, MSA. 17. The Worcester County assessment area is located in a non-metropolitan area of Maryland. The bank s assessment areas were determined to comply with the requirements of the Community Reinvestment Act (CRA) and do not arbitrarily exclude low- and moderate-income census tracts. The bank's asset size and financial condition indicate that it has the ability to meet the credit needs of its assessment areas effectively. The bank has no legal or other impediments that would hamper its ability to meet community credit needs. SCOPE OF EXAMINATION Susquehanna s CRA performance was evaluated for the period from October 3, 2006 through February 2, The lending, investment, and service tests were applied in assessing the bank s performance under the CRA, in accordance with the Interagency Procedures and Guidelines for Large Retail Institutions. Under the lending test, loan products evaluated included home purchase and home-improvement loans and refinancing of such loans [collectively titled Home Mortgage Disclosure Act (HMDA) loans], small business and small farm loans, and other loans that qualified as community development. The HMDA and small business loan data reviewed for purposes of this evaluation covered the period from January 1, 2007 through September 30, Community development loans, investments and services reviewed covered the entire evaluation period. Susquehanna s HMDA and small business loans were compared to the aggregate of all lenders in the bank s assessment areas reporting HMDA loans and small business loans. These data are reported annually and the most recent year for which information is available is For purposes of evaluating the geographic distribution of loans, census tracts were classified on the basis of 2000 U.S. Census data. The distribution of loans to borrowers of different income levels was evaluated based on 2008 adjusted median family income data made available by the U.S. Department of Housing and Urban Development (HUD). All other demographic indices and statistics presented throughout this evaluation are based on 2000 U.S. Census data unless otherwise noted. A substantial majority of the bank s lending and operations are in the following assessment areas: Lancaster, PA, York-Hanover-Gettysburg CSA, Harrisburg, PA, Philadelphia-Camden, North Central Pennsylvania, Hagerstown MSA, Baltimore, MD, and Vineland, NJ. Accordingly, a full review of the bank s performance in these assessment areas was performed. Limited reviews of the bank s CRA performance were conducted for five assessment areas in Pennsylvania (Reading, Allentown, Williamsport, South Central Pennsylvania, and Scranton), three assessment areas in Maryland (Garrett, Allegany, and Worchester Counties), and one assessment area in New Jersey (Atlantic City). Written documentation of interviews conducted with community representatives, prepared by the Federal Reserve and other regulatory agencies, were reviewed during the course of the evaluation. 5
9 CONCLUSIONS WITH RESPECT TO PERFORMANCE TESTS LENDING TEST Performance under the lending test is assessed as high satisfactory. Lending Activity Bank lending levels reflect good responsiveness to assessment area credit needs. As of December 31, 2008, net loans represented 71% of assets. The bank s national peer group average was 66% 1. Susquehanna s loan-to-deposit ratio measured 105% as of December 31, 2008, compared to a peer group average of 93%. Susquehanna s HMDA, small business and small farm lending activity during the period evaluated is summarized in the following table. Susquehanna Bank Summary of Lending Activity Loan Type # % $(000s) % Total Consumer related 0 0 $0 0 Home Improvement 3, $182, Home Purchase 2, $396, Multi-Family Housing $98, Refinancing 3, $380, Total HMDA related 9, $1,058, Small Business 10, $1,500, Total Small Business related 10, $1,500, Small Farm $72, Total Small Farm related $72,706 3 TOTAL LOANS 20, $2,631, Note: Affiliate loans include only loans originated or purchased within the bank s assessment areas. Assessment Area Concentration An analysis was performed to determine the volume of loans (HMDA, small business and small farm loans) extended inside and outside of the bank s assessment areas. As the following table illustrates, a substantial majority of the bank s loans (94% of the number and 91% of the dollars) were made within its assessment areas. 1 Susquehanna s peer group includes all insured commercial banks having assets in excess of $3 billion. 6
10 Susquehanna Bank Lending Inside and Outside the Assessment Areas Inside Outside # % $(000s) % # % $(000s) % Home Improvement 3, $174, $7, Home Purchase - Conventional 1, $322, $47, Home Purchase FHA $21, $1, Home Purchase VA $3, $ Multi-Family Housing $90, $8, Refinancing 3, $353, $27, Total HMDA related 8, $965, $93, Small Business 9, $1,375, $125, Total Small Business related 9, $1,375, $125, Small Farm $63, $9, Total Small Farm related $63, $9, TOTAL LOANS 19, $2,403, , $227, Note: Affiliate loans not included in this table. Geographic Distribution of Lending and Borrower Characteristics The geographic distribution of loans reflects good penetration throughout the bank s assessment areas. The overall distribution of loans among borrowers of different income levels, especially low- and moderate-income families, shows excellent penetration given the economics and demographics of the assessment areas. The distribution of loans among businesses of different sizes, including small businesses, also reflects good penetration. To enhance its efforts in addressing the credit needs of small businesses in its assessment areas, Susquehanna participates as a U.S. Small Business Administration (SBA) lender. In addition, Susquehanna s participation in innovative and flexible lending programs, which address the specific credit needs of low- and moderate-income borrowers and small businesses in its assessment areas, enhances its home mortgage and small business lending profiles. Community Development Loans Susquehanna is a leader in making community development loans. During the review period, the bank originated 83 community development loans aggregating $136 million. A large majority of the community development loan dollars (81%, aggregating $110 million) support economic development initiatives. In addition, 17% of loan dollars aggregating $23 million support affordable housing, and the remaining 2% totaling $3 million support the provision of community development services. Of the 83 loans made, 80 loans were inside the bank s assessment areas. 7
11 Community development loans by assessment area are detailed in the following table: Assessment Area CD Loans (#) CD Loans ($) STATE OF PENNSYLVANIA Lancaster MSA 13 $12,978,079 North Central PA 7 $835,000 York-Hanover-Gettysburg CSA 3 $265,000 Harrisburg 3 $2,700,000 Reading MSA 2 $21,820,000 South Central PA 3 $2,271,113 Scranton MSA 0 $0 Allentown MSA 2 $280,000 Williamsport MSA 4 $6,186,750 STATE OF NEW JERSEY Vineland MSA 4 $9,713,464 Atlantic City MSA 1 $1,773,000 STATE OF MARYLAND Baltimore-Towson MSA 11 $6,367,322 Cumberland MSA 1 $50,000 Garrett County, MD 1 $200,000 Worchester County, MD 0 $0 MULTI-STATE MSA Philadelphia-Camden 16 $65,063,458 MULTI-STATE MSA Hagerstown-Martinsburg 9 $2,520,000 Loans Outside Assessment Areas 3 $3,000,000 TOTAL CD LOANS 83 $136,023,186 INVESTMENT TEST Susquehanna has an excellent level of qualified community development investments and grants throughout its assessment areas. Investments totaling $80.4 million primarily support affordable housing initiatives in the bank s assessment areas. For the state of Pennsylvania, qualified investments total $36.5 million, or 45% of Susquehanna s total investments. For the state of Maryland, qualified investments total $14.7 million, or 18% of the bank s total investments. For the state of New Jersey, qualified investments total $3.3 million, or 4% of total investments. Qualified community development investments in the Hagerstown-Martinsburg MD-WV multistate MSA total $4.3 million, or 6% of Susquehanna s total investments. Qualified investments in the Philadelphia-Camden PA-NJ multi-state MSA total $21.6 million, or 27% of total investments. SERVICE TEST Branch delivery systems, as well as alternative delivery systems such as ATMs, telephone and Internet banking, are accessible to essentially all portions of the bank s assessment areas. Banking services do not vary in a way that inconveniences certain portions of the bank s assessment areas, particularly low- and moderate-income census tracts or low- or moderateincome individuals. Susquehanna is a leader in providing community development services. Numerous bank officers and employees serve in various capacities on boards and committees of community development organizations across the assessment areas. In addition, the bank provides deposit accounts that provide greater access to banking services for low- and moderate-income individuals and small businesses. 8
12 COMPLIANCE WITH FAIR LENDING LAWS A review of the bank s credit practices did not reveal any violations of the substantive provisions of anti-discrimination laws, including the Equal Credit Opportunity Act, which is implemented through Regulation B, the Home Mortgage Disclosure Act, which is implemented through Regulation C, the Fair Housing Act, or any other relevant law or regulation prohibiting discrimination of similarly situated credit applicants. MULTI-STATE METROPOLITAN AREA PHILADELPHIA-CAMDEN-WILMINGTON, PA-NJ-DE-MD, METROPOLITAN STATISTICAL AREA CRA RATING 2 Performance Test Lending Investment Service Overall Performance Level High Satisfactory Outstanding Outstanding Outstanding SUMMARY OF MAJOR FACTORS SUPPORTING RATING Major factors contributing to this rating include the following: The geographic distribution of loans reflects good penetration throughout the assessment areas. The distribution of borrowers, given the product lines offered by the bank, reflects excellent penetration among retail customers of different income levels and good penetration among business customers of different sizes. The bank exhibits a good record of serving the credit needs of the most economically disadvantaged areas of its assessment areas, low-income individuals, and very small businesses, consistent with safe and sound banking practices. The bank is a leader in making community development loans. The bank has an excellent level of qualified community development investments and grants. The bank is a leader in providing community development services. SCOPE OF EXAMINATION The Philadelphia-Camden-Wilmington, PA-NJ-DE-MD MSA (Philadelphia MSA) includes three metropolitan divisions (MD): the Philadelphia MD, the Camden MD and the Wilmington MD. For purposes of this CRA evaluation, Susquehanna has designated the Camden MD (Camden, Burlington and Gloucester counties in New Jersey) and a portion of the Philadelphia MD (Delaware, Chester, Montgomery and Philadelphia counties in Pennsylvania) as its assessment area. Loan products evaluated in this assessment area include HMDA loans, small business loans, and other loans that qualified as community development. 2 This rating reflects overall performance within the multi-state metropolitan area. The statewide evaluations are adjusted and do not reflect performance in the parts of those states contained within the multi-state metropolitan area. 9
13 PHILADELPHIA-CAMDEN-WILMINGTON METROPOLITAN STATISTICAL AREA DESCRIPTION OF ASSESSMENT AREA The bank s Philadelphia assessment area consists of Chester, Delaware, Montgomery, and Philadelphia Counties in Pennsylvania, and Camden, Burlington and Gloucester Counties in New Jersey. The assessment area has 1,169 census tracts, 140 of which are low-income and 230 moderate-income. The substantial majority of low-income tracts are located in the cities of Philadelphia (109 tracts, or 78%) and Camden (18 tracts, or 13%). An additional 11 low-income tracts are in Delaware County, one in Montgomery County, and one in Burlington County. Twelve percent of the assessment area s population resides in these low-income census tracts. Of the 230 moderate-income census tracts, more than half (140, or 61%) are located in the city of Philadelphia, and 3 tracts, or 1%, are in the city of Camden. An additional 41 moderate-income tracts are in Pennsylvania (22 in Delaware County, 11 in Montgomery County, and 8 in Chester County). In New Jersey, 18 moderate-income tracts are in Burlington County and 6 are in Gloucester County. Almost 21% of the assessment area s population resides in the moderateincome census tracts. Susquehanna s performance was evaluated in terms of the demographic and business context in which it operates. According to the FDIC s Summary of Deposits, as of June 30, 2008, 120 depository institutions operate in this seven county region of the Philadelphia MSA. These institutions maintain a total of 1,499 branches holding $115 billion in deposits. Susquehanna, with 29 branches in the market, ranked 12 th, with $1.3 billion, or 1% of the retail deposit market. The Philadelphia assessment area branches hold approximately 14% of Susquehanna s total deposits. The Philadelphia assessment area is a highly competitive marketplace in which large superregional banks compete with numerous community banks, savings and loan associations, credit unions and non-financial institutions. Susquehanna s major competitors include Wachovia Bank, TD Bank, N.A., and Citizens Bank of Pennsylvania. As of June 30, 2008, Wachovia Bank held the largest share of deposits with 19% of the market. Susquehanna s home mortgage loans were compared to the aggregate of all lenders in the market reporting HMDA loans. These data are reported annually, and 2007 is the most recent year for which information was available. The bank ranks 100 th with a market share of less than 1%, in a market with 845 HMDA reporters. No single financial institution dominates the market. Commerce Bank (now TD Bank), headquartered in Camden County, was the highest ranked local bank at 9 th, holding 2% of the market. Among small business lenders, Susquehanna ranks 23 rd in the assessment area with less than 1% of the market. American Express Bank FSB ranked 1 st with 31% of the market, although this bank s small business lending includes corporate credit cards. Commerce Bank is the highest ranked area bank at 16 th, holding less than 1% of the market. In 2007, the assessment area had a total of 189 small business reporters. 10
14 ECONOMIC CHARACTERISTICS Philadelphia is the largest city in Pennsylvania and the sixth-largest city in the nation with a population of 1.5 million, according to the 2000 Census. The Philadelphia metropolitan area, with a population of 5.8 million, is the fifth-largest in the nation. The local work force is primarily service-oriented, with education and healthcare services as the most active segment of the economy, accounting for 21% of employment. The top five private sector employers in the Philadelphia MSA are Jefferson Health System, the University of Pennsylvania, Merck and Co., Children s Hospital of Pennsylvania, Boeing Corporation, and The Vanguard Group of Investments. The strengths of the Philadelphia MSA continue to be a concentration of well-regarded educational institutions, its position as a center for health services and medical research, relatively affordable housing and living costs, and a well developed port. However, the area has a lower per capita income than other large northeastern metropolitan areas, an old and aging infrastructure, and weak population growth. Within Camden County, New Jersey, is the city of Camden, one of the poorest cities in the nation. Of the city s 21 census tracts, 18 are designated as low-income and three are moderateincome. The median family income for the city is $24,653, with 81% of families designated as low- or moderate-income. Families living below the poverty level represented 33% of total families. The city s November 2008 unemployment rate was 12.5%, compared to 6.3% for the state of New Jersey. The city s total population is 79,904 as of the 2000 census. City strengths include an industrial diversity, a prime waterfront area situated directly across the Delaware River from Philadelphia, and affordable housing compared to the rest of New Jersey. Continued weaknesses include the high crime and poverty rates in downtown Camden and a low per capita income relative to both the state and the region. The largest employers in the Camden MD include the McGuire Air Force Base, VIRTUA Health, TD Bank, Lockheed Martin, and Kennedy Health Systems. Unemployment rates for the assessment area are presented in the following table. Philadelphia and Camden Counties have the highest unemployment rates of the seven counties in the assessment area. Location November 2008 November 2007 Chester County Delaware County Montgomery County Philadelphia County Philadelphia MD Pennsylvania Location November 2008 November 2007 Camden County 6.4% 4.3% Burlington County 5.2% 3.5% Gloucester County 5.7% 3.9% Camden MD 5.9% 3.9% State of New Jersey 6.3% 4.4% 11
15 Community contacts throughout the assessment area agreed that affordable housing has been a pressing need. The high cost of housing in the suburban counties significantly limits homeownership opportunities for low- and moderate-income families in the assessment area. Workforce housing for middle-income families is also an issue, particularly in Chester County, PA. The disparity between incomes and housing costs, either owned or rented, suggests a need for loan programs for low- and moderate-income families and first-time homebuyers. In addition, local community groups have all expressed the need to replace traditional funding sources. Many regular donors, including banks, have cut back or discontinued giving. HOUSING According to the 2000 Census, the assessment area contains 1.8 million housing units, 64% of which are owner-occupied. Single family units comprise 73% of the assessment area s housing units, while multi-family units comprise 16%. Two-to-four family units comprise 10% of the housing units and mobile homes 1%. Thirty-seven percent of all housing units in the assessment area are located in the City of Philadelphia. The 2000 Census data indicate that the median housing value is $112,449 in the bank s assessment area. There is a significant disparity between the median housing value in the area s upper-income census tracts ($184,677) and that in low-income ($34,269) and moderate-income ($60,284) tracts. The median value in middle-income tracts is $108,754. A state comparison shows that the median housing value in Pennsylvania ($94,800) is significantly lower than in New Jersey ($167,900). Moody s Economy.com, Inc., estimates that the average existing home price in the Philadelphia MD decreased to $227,800 in 2008, compared to $231,800 in 2007 (-2%). Moody s estimates that the average existing home price in the Camden MD decreased 5% to $220,500 in 2008, compared to $231,100 in Median gross rent in the bank s assessment area is $640 per month, with 39% of renters paying more than 30% of their income for housing. Median rent in Pennsylvania is lower at $531, with 35% of renters paying more than 30% of income for housing. In New Jersey, median rent is high at $751, with 37% of renters paying more than 30% of income for housing. Overall, housing is most affordable in the urban areas of Philadelphia and Camden. The suburban areas have higher housing costs, significantly limiting homeownership opportunities for low- and moderate-income families throughout the assessment area. Pennsylvania Counties Median Housing Value Median Gross Rent Chester County $178,900 $754 Delaware County $127,000 $662 Montgomery County $158,900 $757 Philadelphia County $61,000 $569 Philadelphia MD $119,551 $641 Pennsylvania $94,800 $531 New Jersey Counties Median Housing Value Median Gross Rent Burlington County $134,000 $758 Camden County $110,200 $635 Gloucester County $118,200 $645 Camden MD $119,811 $675 New Jersey $167,900 $751 12
16 Owner-occupancy in low- and moderate-income census tracts is 43% and 53%, respectively. This lagged the owner-occupancy levels in middle- and upper-income census tracts of 68% and 77%, respectively. The statewide owner-occupancy rates are 65% for Pennsylvania and 61% for New Jersey. The distribution of owner-occupied housing units throughout the assessment area is used as a proxy to estimate demand for residential mortgage lending. In the bank s assessment area, 8% of owner-occupied units are located in low-income census tracts, 18% are in moderate-income tracts, 40% are in middle-income tracts, and 34% are in upper-income tracts. Of the 303 thousand owner-occupied units located in low- and moderate-income tracts, 77% are located in the City of Philadelphia. BORROWER INCOME DATA For purposes of evaluating the distribution of loans to borrowers of different income levels, incomes were classified based upon annually adjusted median family income data made available by HUD. According to 2000 Census data, the median family income for the bank s assessment area was $56,719, higher than $49,184 for the state of Pennsylvania, but lower than the $65,370 for New Jersey. In 2008, the adjusted median family income for the Philadelphia MD, as reported by HUD, increased to $72,400. The median family income for the Camden MD increased to $78,300. Of the total families in the assessment area, 23% are designated as low-income and 18% are moderate-income. Families living below the poverty level represent 9% of the total families in the bank s assessment area. In Pennsylvania, 8% of families live below the poverty level, compared to 6% in New Jersey. GEOGRAPHIC BUSINESS DATA The percentage of businesses located within designated census tracts is used as a proxy to estimate demand for small business credit within such census tracts. According to Dun and Bradstreet, 7% of businesses in the assessment area are located in low-income census tracts and 15% of businesses are located in moderate-income tracts. The majority of businesses are located in middle- (36%) and upper-income (41%) tracts. 13
17 The demographics used to assess the performance context in which Susquehanna operates are detailed in the following table. Income Categories Tract Distribution Susquehanna Bank Assessment Area Demographics Philadelphia-Camden, PA-NJ Families by Tract Income Families < Poverty Level as % of Families by Tract Families by Family Income # % # % # % # % Low-income , , , Moderate-income , , , Middle-income , , , Upper-income , , , Unknown-income Total Assessment Area 1, ,119, , ,119, Housing Housing Types by Tract Units by Tract Owner-occupied Rental Vacant # % % # % # % Low-income 225,001 96, , , Moderate-income 391, , , , Middle-income 673, , , , Upper-income 505, , , , Unknown-income Total Assessment Area 1,796,187 1,150, , , Businesses by Tract & Revenue Size Total Businesses by Less Than or = $1 Tract Over $1 Million Revenue Not Reported Million # % # % # % # % Low-income 11, , , Moderate-income 23, , , Middle-income 58, , , , Upper-income 65, , , , Unknown-income 1, Total Assessment Area 160, , , , Percentage of Total Businesses: CONCLUSIONS WITH RESPECT TO PERFORMANCE TESTS LENDING TEST The lending test evaluates an institution s lending activities based on the following characteristics: geographic distribution of loans, including loans originated in low- and moderate-income census tracts; borrowers profile, including the distribution of loans to low- and moderate-income borrowers and small businesses; overall responsiveness to credit needs of highly economically disadvantaged census tracts, low-income persons, and very small businesses; and community development lending activities. Performance under the lending test is rated high satisfactory in the Philadelphia assessment area. 14
18 Geographic Distribution of Loans Home Mortgage Lending The geographic distribution of loans was analyzed to determine the dispersion of the bank's loans among different census tracts within the Philadelphia assessment area. The analysis reflected adequate penetration throughout the assessment area, including low- and moderate-income tracts. Susquehanna originated 698 home mortgage loans, aggregating $89.3 million in the Philadelphia assessment area. The percentage of owner-occupied housing units contained within designated census tracts is used as a proxy to estimate demand for residential mortgage lending within such tracts. A lower level of owner-occupied units limits lending opportunities in these census tracts. According to 2000 Census data, 8% of all owner-occupied housing units are located in lowincome census tracts and 18% are in moderate-income tracts. By comparison, 6% of Susquehanna s home mortgage loans were originated in low-income census tracts and 6% were in moderate-income tracts. Susquehanna s home mortgage lending was compared to all other lenders operating in the Philadelphia assessment area. An analysis of this data showed that 6% of all home mortgage loans made in the assessment area were made in low-income census tracts and 18% were made in moderate-income tracts. Although bank lending in low-income census tracts is below owner-occupied housing levels, it is the same as aggregate lending and considered good given the limited amount of owner-occupied housing available in these tracts. In moderate-income census tracts, Susquehanna s lending is substantially below both aggregate and housing levels. However, owner-occupied housing in the assessment area s low- and moderate-income census tracts is concentrated in the City of Philadelphia. Because Susquehanna does not maintain any branch presence in Philadelphia, the bank s ability to lend in these areas is limited. However, for purposes of CRA the bank includes the city in its assessment area. 3 Participation in community development initiatives and services that address the specific credit needs of low- and moderate-income areas enhanced Susquehanna s home mortgage lending profile in this assessment area, including the City of Philadelphia. For a discussion of these efforts, see the Community Development Lending (page 18) and the SERVICE TEST (page 19) sections of this evaluation. Small Business Lending The geographic distribution of small business loans was analyzed to determine the dispersion of these loans among different census tracts within the assessment area. The analysis reflects excellent penetration throughout the assessment area, including low- and moderate-income census tracts. 3 During the evaluation period, 4% of Susquehanna s total home mortgage loans were originated in the City of Philadelphia. 15
19 Susquehanna originated 1,061 small business loans in the Philadelphia assessment area, aggregating $190 million. A comparison of the number of small business loans originated in each type of census tract to the number of businesses located in those tracts demonstrates the bank s commitment to making credit available to its entire community. The bank s extension of credit to these businesses shows that low-income census tracts received 2% of small business loans, while 7% of businesses are located in these tracts. Moderate-income census tracts received 16% of small business loans, while 15% of businesses are located in these tracts. Middle-income census tracts received 44% of small business loans for their 36% share of businesses. Upper-income census tracts received 38% of small business loans for their 41% share of businesses. Susquehanna s small business lending was compared to all lenders operating in the Philadelphia assessment area. Aggregate data show that 4% of all small business loans were made in the lowincome census tracts and 12% were made in moderate-income tracts. This level of lending activity by Susquehanna is considered excellent given the demographics of the assessment area, particularly the modest small business lending opportunities in the lowincome census tracts and Susquehanna s strong performance in moderate-income tracts where lending is higher than both aggregate lending and business demographic levels. Overall, 18% of Susquehanna s small business loans were originated in low- and moderate-income census tracts, compared to 16% for all lenders. Distribution of Loans by Borrower Income Level and Revenue Size of the Business Home mortgage and small business lending data were analyzed, in conjunction with a review of the demographic and economic characteristics of the assessment area, to determine the extent of lending to borrowers of different income levels and to businesses of different sizes. Lending to Borrowers of Different Income Levels Of the 1.1 million families in the Philadelphia assessment area, 23% are designated as lowincome and 18% are moderate-income. By comparison, 10% of Susquehanna s home mortgage loans were originated to low-income borrowers and 21% to moderate-income borrowers. This distribution of bank loans reflects excellent penetration among retail customers of different income levels, particularly moderate-income borrowers. Susquehanna s home mortgage lending was compared to all lenders operating in the assessment area. An analysis of aggregate loan data show that just 8% of all home mortgage loans were made to low-income borrowers and 20% were made to moderate-income borrowers. Although Susquehanna s lending to low-income borrowers is below the proxy of low-income families, the bank performed above aggregate lending levels. Further, Susquehanna s lending to moderateincome borrowers exceeded both the proxy of moderate-income families and the aggregate lending levels and is considered excellent given the obstacles to home ownership that exist for both low- and moderate-income families. Overall, 31% of Susquehanna s home mortgage loans were originated to low- and moderate-income borrowers, compared to 24% for all lenders. 16
20 Susquehanna s participation in innovative and flexible lending programs that address the specific credit needs of these borrowers enhanced its home mortgage lending profile. Most notably, the bank offers the Home Start Loan Program, a mortgage product developed to provide low- and moderate-income borrowers with the ability to purchase a home. The product allows for flexible underwriting standards and the use of alternative credit when no credit score exists. During the evaluation period, Susquehanna originated 279 loans under the program, aggregating $29.9 million. In the Philadelphia assessment area, the bank originated 29 of these loans, aggregating $3.3 million. The bank also provides a $750 thousand line of credit to The Collaborative Lending Initiative (CLI). CLI is a subsidiary of The Reinvestment Fund, a community development financial institution that provides financial and technical assistance to community development initiatives throughout the Philadelphia assessment area. The line of credit supports a loan pool operated by CLI to increase the flow of conventional credit into affordable housing projects in southeastern Pennsylvania. Susquehanna is a member of the Federal Home Loan Bank of Pittsburgh (FHLBP) and a participant in its First Front Door Program. This Program is designed to provide low- and moderate-income homebuyers with down payment and closing cost assistance. Homebuyers are eligible to receive three dollars for every one dollar paid towards closing costs. Through Susquehanna, 41 homebuyers in its assessment areas received more than $215 thousand in matching funds through this program. Twenty-one homebuyers in the Philadelphia assessment area received $98 thousand in matching funds through this program. The bank also offers the Fannie Mae Flexible 100 Mortgage product for single-family, owneroccupied residences. The primary benefit of this product is the no down payment feature. The Flexible 100 is targeted to first-time home buyers and primarily serves low- and moderateincome homebuyers. The product enables Susquehanna to originate loans to borrowers who would not qualify for mortgages under the bank s traditional underwriting criteria. During the evaluation period, Susquehanna originated eight mortgages under the program, aggregating $1.2 million. In the Philadelphia assessment area, Susquehanna originates loans through lending programs offered by the Pennsylvania Housing Finance Agency (PHFA). Borrowers must be first-time homebuyers, or homebuyers in targeted areas, with incomes less than 100% of the area median and purchasing a home priced below an amount set by PHFA. Income guidelines set by the PHFA ensure that loans are originated to primarily low- and moderate-income borrowers. Susquehanna originated 34 loans aggregating $3.3 million under the PHFA program, during the period examined. Two of these loans, aggregating $101,000, were originated in the Philadelphia assessment area. Lending to Businesses of Different Sizes Small business lending data were analyzed to determine the extent of lending to businesses of different sizes, especially small businesses. The analysis reflected a good dispersion of commercial loans among small businesses. A small business is defined as a business with gross annual revenues of $1 million or less. 17
21 Of the 1,061 small business loans originated by the bank during the examination period, 55% were extended in an amount of $100 thousand or less. The number of small business loans originated in smaller amounts is significant because smaller size loans are generally commensurate with the borrowing needs of small businesses. Susquehanna s lending activity therefore demonstrates that the bank is meeting the credit needs of small businesses. The bank s small business lending is further quantified to determine whether loans were made to businesses with gross annual revenues of $1 million or less. Of the 1,061 loans originated, 40% were originated to small businesses. By comparison, a review of all lenders in the market shows that 35% of all commercial loans made in the Philadelphia assessment area were to small businesses. Susquehanna s participation in innovative and flexible lending programs which address the specific credit needs of small businesses enhanced its small business lending profile. Most notably, Susquehanna participates as a U.S. Small Business Administration (SBA) lender. The bank received SBA s Preferred Lender status and qualified for the SBAExpress lending program developed by the SBA to increase the number of small loans approved by the agency. During the period evaluated, the bank originated 154 SBA loans, aggregating $37.4 million. Community Development Lending Susquehanna is a leader in making community development loans in the Philadelphia-Camden assessment area. During the time period evaluated, the bank originated 16 community development loans totaling $65.1 million. The large majority of these loans (ten), totaling $59.6 million, supports economic development projects in Pennsylvania and New Jersey. Six loans, aggregating $5.5 million, support affordable housing initiatives in both states. Responsiveness to Credit Needs Susquehanna exhibits an excellent record of serving the credit needs of the most economically disadvantaged areas of the Philadelphia-Camden assessment area, including low-income borrowers and very small businesses, consistent with safe and sound banking practices. The bank achieved this strong record primarily through its community development lending and the use of innovative and flexible lending practices in order to serve assessment area credit needs. INVESTMENT TEST The investment test evaluates a financial institution s level of qualified community development investments that serve low- or moderate-income census tracts or individuals. The test also considers the innovativeness and complexity of these investments. Qualified investments made prior to the previous evaluation, which are still outstanding, are considered under the test. For purposes of CRA, the term qualified investment includes a lawful investment, deposit, membership share, or grant that has as its primary purpose community development. Performance under the investment test is outstanding in the Philadelphia-Camden assessment area. Of Susquehanna s total current investments, 27% are attributed to this assessment area. 18
22 Volume of Investment and Grant Activity A review of investment activity revealed that Susquehanna has an excellent level of qualified community development investments and grants in the assessment area. Overall, investments aggregate $21.6 million. These investments almost exclusively (98%) support affordable housing initiatives. The remaining 2% of investments support both the provision of community development services and economic development in the assessment area. Of the bank s investments, $16.4 million are targeted mortgage-backed securities containing residential mortgage loans originated to low- and moderate-income borrowers, or inside low- and moderate-income census tracts. The bank also holds $750 thousand in equity investments in rental housing for low-and moderate-income senior citizens, and a $3.6 million share in Pennsylvania Housing Finance Agency Single Family Mortgage Revenue Bonds financing homes for low-and moderate-income families within the assessment area, or a larger regional area, which includes the assessment area. Susquehanna has a $201 thousand commitment to a community development financial institution that uses capital to finance affordable housing, small businesses, community facilities, and workforce projects that create economic opportunities for low- and moderate-income individuals and small businesses. In addition, Susquehanna holds a $38 thousand share in an investment in the Business in Our Sites Program targeted to the redevelopment of brownfield sites around Pennsylvania. In addition to investments, the bank made grants and contributions to various organizations that routinely provide affordable housing and community development services that benefit low- and moderate-income individuals and areas. During the period evaluated, the bank made $659 thousand in qualified grants and donations that benefit the Philadelphia-Camden assessment area. Responsiveness to Credit and Community Development Needs Susquehanna exhibits good responsiveness to credit and community economic development needs. Qualified investments were tailored to the needs of particular geographic areas. The bank's investments primarily support affordable housing in an area with high housing costs and a significant number of low- and moderate-income families. SERVICE TEST The service test evaluates the financial services provided by a financial institution using the following characteristics. the accessibility of delivery mechanisms within an assessment area, including the distribution of an institution s branch offices and alternative delivery mechanisms; the impact of changes in branch locations upon low- and moderate-income census tracts or low- and moderate-income persons in the assessment area; the reasonableness of business hours and services in meeting assessment area needs; and the extent to which an institution provides community development services. The bank s performance under the service test is rated outstanding in the Philadelphia assessment area. 19
23 Accessibility of Delivery Systems The bank s delivery systems are reasonably accessible to essentially all portions of its assessment area. The bank currently operates 33 branches in the Philadelphia assessment area. Eighteen branches are located in New Jersey (9 in Camden County, 5 in Burlington County, and 4 in Gloucester County). Fourteen branches are located in Pennsylvania (3 in Delaware County, 5 in Chester County, and 6 in Montgomery County). The bank does not operate any branches in Philadelphia County, but includes the county in its assessment area. Of the 33 branches in the assessment area, just three branches, or 9%, are located in low- or moderate-income census tracts. By comparison, 33% of the assessment area population resides in low- and moderate-income tracts. The following table details the locations of the bank s branches in the Philadelphia assessment area compared to the distribution of the population: Census Tract Number of Branches Percent Branches Population Percent Population Low-income , Moderate-income , Middle-income ,657, Upper-income ,328, TOTALS % 4,439, % Alternative Retail Banking Services and Alternative Methods of Delivering Retail Banking Services To supplement traditional banking services, Susquehanna offers Internet banking on By accessing Susquehanna s Internet Banker, customers can view account balances, transfer funds between accounts, pay bills, open new accounts and issue stop payments. In addition, customers can bank by phone through a toll-free automated system which allows customers to access account information, open new accounts, renew CDs, apply for loans, or transfer funds. Changes in Branch Locations To the extent changes have been made, Susquehanna s record of opening and closing branches has improved the accessibility of its delivery systems in low-income census tracts and to lowand moderate-income individuals. Since the previous evaluation, Susquehanna opened four new branches; one in a low-income census tract and three in upper-income tracts. The bank has not closed any branches in this assessment area since the last evaluation. Census Tract Street City State Low-income One Market Street Camden NJ Upper-income 301 West Lancaster Avenue Wayne PA Upper-income 76 East Lancaster Avenue Ardmore PA Upper-income 1856 South Collegeville Collegeville PA 20
24 Reasonableness of Business Hours and Services in Meeting Assessment Area Needs Services, including business hours, do not vary in a way that inconveniences certain portions of the assessment area, particularly low- and moderate-income census tracts or individuals. Banking services are offered in a uniform and consistent manner among all branches. Community Development Services Susquehanna Bank is a leader in providing community development services in the Philadelphia assessment area. Numerous bank officers and employees serve in various capacities on boards of many community development organizations, participate on loan and finance committees, make presentations for small business development, homeownership, and financial literacy programs, and provide credit counseling and technical expertise. The organizations include: Alliance for the Revitalization of Camden Burlington County First-Time Homebuyers Grant Program Camden County Workforce Investment Board Gloucester County Habitat For Humanity Goodwill Industries of Southern New Jersey Habitat For Humanity Camden The Latin American Economic Development Association Neighborhood Housing Services of Camden People 4 People Foundation St. Joseph Carpenter Society The Borough of Pottstown Home Ownership Initiative Program Montgomery County Partners for Home Ownership Open Hearth, Inc. Montgomery County Habitat For Humanity Coatesville Homeownership Fair City of Chester Housing Authority Genesis Housing Corporation Camden County Council on Economic Opportunity Camden Lutheran Housing Consumer Credit Counseling Services of Delaware Valley Creditworthy of Gloucester County Phoenixville Community Services Heart of Camden Bank Products Susquehanna issued two commercial letters of credit in the Philadelphia assessment area. These letters of credit qualify as a community development service because the letters provided necessary credit support for community development initiatives inside the assessment area. The letters of credit were issued to a for-profit company for the revitalization and stabilization of the community. 21
25 Susquehanna Bank also offers bank products that provide greater access to banking services for low- and moderate-income customers and small businesses, including: A free checking account that offers unlimited check writing, no minimum daily balance requirement and no monthly service fee. Internet Banker and telephone banking are free of charge with this account. The account provides greater access to banking services for lowand moderate-income consumers. A business checking account with no monthly service fees or minimum balance requirements for businesses that generate 150 or fewer checks or deposited items per month. Internet Banker for Business with bill payment is offered free with this account. The account provides greater access to banking services for small businesses. A NJ Consumer Checking account, for its New Jersey customers, that offers a low-cost account designed for consumers who write eight or fewer checks per month. The account has a $1 minimum balance requirement and a $3.00 monthly service fee. There is an additional charge of $0.50 per check for all checks written in excess of eight. In Pennsylvania, Susquehanna has partnered with the United Way of Southeastern Pennsylvania and Family Services of Montgomery County to offer the Home Savings Plus Individual Development Account (IDA). The program is funded by the Pennsylvania Department of Economic and Community Development. Clients generally save $10 per week for two years and, at the end of that period, account holders use the accumulated savings, plus a 50% match from the state, for a specific use (home-ownership, advanced education, small business funding, or auto purchase). The participating bank opens FSA accounts, waives standard fees and provides participant account balance reports to account holders and Open Hearth. To qualify for the program, depositors must meet income guidelines that effectively reserve the program for low- and moderate-income clients. Susquehanna provides additional matched funding for clients in Chester and Montgomery counties. Since the inception of the program, the bank has opened 55 FSA accounts in its Philadelphia assessment area. 22
26 MULTI-STATE METROPOLITAN AREA HAGERSTOWN-MARTINSBURG, MD-WV METROPOLITAN STATISTICAL AREA CRA RATING 4 Performance Test Lending Investment Service Overall Performance Level High Satisfactory Outstanding Outstanding Outstanding SUMMARY OF MAJOR FACTORS SUPPORTING RATING Major factors contributing to this rating include the following. The geographic distribution of loans reflects good penetration throughout the assessment area. The distribution of borrowers, given the product lines offered by the bank, reflects excellent penetration among retail customers of different income levels and adequate penetration among business customers of different sizes. The bank exhibits a good record of serving the credit needs of the most economically disadvantaged areas of its assessment areas, low-income individuals and very small businesses, consistent with safe and sound banking practices. The bank made a relatively high level of community development loans in the assessment area. The bank has an excellent level of qualified community development investments and grants. The bank is a leader in providing community development services in this assessment area. SCOPE OF EXAMINATION The Hagerstown-Martinsburg, MD-WV MSA (Hagerstown MSA) includes Washington County in Maryland and Berkeley and Morgan Counties in West Virginia. For purposes of this CRA evaluation, Susquehanna has designated only Washington and Berkeley Counties as its assessment area. Loan products evaluated in the Hagerstown assessment area include HMDA loans, small business and small farm loans, and other loans that qualified as community development. DESCRIPTION OF ASSESSMENT AREA The Hagerstown MSA is situated in north central Maryland and northeastern West Virginia. According to 2000 Census data, the total population of the bank s portion of the Hagerstown MSA is 207,828. The assessment area consists of 43 census tracts of which one is low-income and nine are moderate-income. The one low-income tract and six moderate-income tracts are located in the city of Hagerstown, MD. Three moderate-income tracts are in Martinsburg, WV. Eighteen percent of the assessment area s population resides within these tracts. 4 This rating reflects overall performance within the multi-state metropolitan area. The statewide evaluations are adjusted and do not reflect performance in the parts of those states contained within the multi-state metropolitan area. 23
27 Susquehanna s performance in the Hagerstown assessment area was evaluated in terms of the demographic and business context in which it operates. The assessment area is a fairly competitive market with a few large regional banking organizations and numerous community banks. Based on deposits reported to the FDIC as of June 30, 2008, Susquehanna operates 14 branches in its Hagerstown assessment area and these branches hold $710 million in deposits, or 8% of the bank s total deposits. Susquehanna ranks 1 st in the assessment area, with 24% of the retail deposit market. A local bank, Hagerstown Trust Company, is ranked 2 nd in this market with 13% of deposits. Regarding HMDA loans, Susquehanna ranks 12 th in the assessment area with 2% of all such loan originations and purchases, ranking highest of all local banks. Additionally, Susquehanna Mortgage Corp. ranks 47 th originating less than 1% of loans. Countrywide ranks 1 st, with 9% of HMDA loans reported in the assessment area. Among small business lenders operating in the assessment area, Susquehanna ranks 7 th controlling 6% of the market. There were 52 lenders reporting 8,197 small business loans in Susquehanna is ranked highest of all local banks. ECONOMIC CHARACTERISTICS The Hagerstown economy is struggling through the current recession. Industrial production decreased significantly last year and, although service-producing employment increased, this growth is being undermined by the continued contraction among goods-producing industries. In addition, reduced household wealth resulting from falling house prices and loss of equity-derived wealth is apparent from layoffs among local retailers. Housing prices in the Hagerstown MSA continue to fall. Moody s Economy.com shows that the average existing house price fell 16% over the past 3 years, from its peak of $222,900 in 2006, to $187,300 in The overall housing slowdown has had a pronounced effect on the broader Hagerstown economy. Housing related employment growth was a key driver for the economy in the past; as such, the drop-off in the housing industry s job growth has dampened overall employment growth. Assessment area strengths include Hagerstown s proximity to Washington, DC and Baltimore, MD, easy access to major transportation routes, and its position as the retail outlet center for western Maryland and southeastern Pennsylvania. Continued weaknesses include a low educational attainment level and the area s high exposure to manufacturing industries that are sensitive to business cycle fluctuations. The state of the financial markets lends considerable risk to Hagerstown s outlook. Citigroup is one of the metro area s top employers. Other major employers in the MSA include Washington County Health Services, First Data Corporation, Volvo Powertrain North America and the Staples Distribution Center. Susquehanna s local banking competitors include Hagerstown Trust Company and First United Bank and Trust. Super-regionals M&T Bank and Sovereign Bank are also strong in this market. 24
28 The following table presents unemployment rates for the assessment area and the state. Locations November 2008 November 2007 Washington County, MD 6.7% 3.9% Berkeley County, WV 5.4% 4.0% Hagerstown-Martinsburg MSA 6.1% 4.0% State of West Virginia 4.3% 4.4% State of Maryland 5.4% 3.6% Interviews with community leaders and local bankers noted the following credit needs in the assessment area: (1) financing for area businesses of all sizes; (2) operating capital for non-profit community groups; and (3) loans and technical support for small businesses. HOUSING The bank s Hagerstown assessment area contains 85,885 housing units, of which 64% are owner-occupied, 29% are rental units and 8% are vacant. According to 2000 Census data, in the low-income census tract the level of owner-occupancy is just 13%, while rental units account for 73% of all housing. In moderate-income census tracts, owner-occupancy is 41%, while rental units account for 51% of housing. Single-family units comprise 71% of total housing units, while multi-family units comprise 11% of units, mobile homes 10%, and two-to-four family units 8%. According to 2000 Census data, the median housing value in the assessment area was $104,301, significantly lower than the median housing value of $143,300 for the state of Maryland, but higher than $66,000 in West Virginia. A significant disparity exists between the median housing value in the assessment area s upper-income census tracts ($130,228) and in the low-income ($66,552) and moderate-income ($78,291) census tracts. Moody s Economy.com estimates that the average existing house price in the Hagerstown MSA in 2008 was $187,300, down 11% from $207,200 in Although housing prices have fallen, prices are still high, limiting homeownership opportunities for low- and moderate-income families throughout the assessment area. Housing in Hagerstown is still more affordable than in the neighboring metropolitan areas of Washington, DC and Baltimore, and migration to Hagerstown from those areas continues to occur. BORROWER INCOME DATA According to 2000 Census data, the median family income for the Hagerstown MSA was $47,065, compared to $61,876 for the state of Maryland and $36,484 for the state of West Virginia. HUD has reported that the adjusted median family income for the Hagerstown MSA in 2008 increased to $62,600. For the state of Maryland, median family income increased to $66,200 and West Virginia increased to $41,100. Of the 55,081 families in the Hagerstown assessment area, 18% are designated as low-income and 19% are moderate-income, according to 2000 Census data. Families living below the poverty level represented 8% of the total families in the assessment area. In the state of Maryland, 6% of families live below the poverty level compared to 14% in West Virginia. 25
29 GEOGRAPHIC BUSINESS DATA The percentage of businesses located within designated census tracts is used as a proxy to estimate demand for business credit within such census tracts. According to business demographics, 7,319 businesses are located in the Hagerstown assessment area. Of these businesses, 5% are located in the low-income census tract and 21% are in the moderate-income tracts. The majority of businesses (55%) are in middle-income tracts and 19% are in upperincome tracts. Business demographic data also revealed that of the 7,319 businesses in the assessment area, 89% are small businesses. A small business is defined as a business with gross annual revenues of $1 million or less. The demographics used in rating Susquehanna under the performance tests are detailed in the following table. Income Categories Tract Distribution Susquehanna Bank Assessment Area Demographics Hagerstown-Martinsburg Families by Tract Income Families < Poverty Level as % of Families by Tract Families by Family Income # % # % # % # % Low-income , Moderate-income , , , Middle-income , , , Upper-income , , Unknown-income Total Assessment Area , , , Housing Units by Tract Housing Types by Tract Owner-occupied Rental Vacant # % % # % # % Low-income 1, Moderate-income 16,003 6, , , Middle-income 53,773 37, , , Upper-income 14,748 10, , Unknown-income Total Assessment Area 85,885 54, , , Total Businesses by Tract Businesses by Tract & Revenue Size Less Than or = $1 Revenue Not Over $1 Million Million Reported # % # % # % # % Low-income Moderate-income 1, , Middle-income 4, , Upper-income 1, , Unknown-income Total Assessment Area 7, , Percentage of Total Businesses: Income Categories Farms by Tract & Revenue Size Total Farms Less Than or = $1 Revenue Not By Tract Over $1 Million Million Reported # % # % # % # % Low-income Moderate-income Middle-income Upper-income Unknown income Total Assessment Area Percentage of Total Farms:
30 CONCLUSIONS WITH RESPECT TO PERFORMANCE TESTS LENDING TEST The lending test evaluates an institution s lending activities based on the following characteristics: geographic distribution of loans, including loans originated in low- and moderate-income census tracts; borrowers profile, including the distribution of loans to low- and moderate-income borrowers and small businesses; overall responsiveness to credit needs of highly economically disadvantaged census tracts, low-income persons, and very small businesses; and community development lending activities. Performance under the lending test is high satisfactory in the Hagerstown assessment area. Geographic Distribution of Loans Home Mortgage Lending The geographic distribution of loans was analyzed to determine the dispersion of the bank's loans among different census tracts within the Hagerstown assessment area. The analysis reflected good penetration throughout the assessment area, including low- and moderate-income census tracts. Susquehanna originated 530 home mortgage loans, aggregating $66.5 million, in the Hagerstown assessment area. The percentage of owner-occupied housing units contained within designated census tracts is used as a proxy to estimate demand for residential mortgage lending within such tracts. A lower level of owner-occupied units limits lending opportunities in these census tracts. According to 2000 Census data, only 0.3% of all owner-occupied housing units are located in the low-income census tract and 12% are in moderate-income census tracts. By comparison, 1% of Susquehanna s home mortgage loans were originated in the low-income census tract and 12% were in the moderate-income tracts. Susquehanna s home mortgage lending was compared to all other lenders operating in the Hagerstown assessment area. An analysis of this data showed that 0.3% of all home mortgage loans made in the assessment area were made in the low-income tract and 14% were made in moderate-income tracts. This comparison shows that Susquehanna performed below the market in moderate-income census tracts, but its lending was the same as the percentage of owneroccupied units located in these census tracts. There were limited lending opportunities for any banks in the assessment area s one low-income census tract. 27
31 Small Business Lending The geographic distribution of small business loans was analyzed to determine the dispersion of these loans among different census tracts within the assessment area. The analysis reflects good penetration throughout the assessment area, including low- and moderate-income census tracts. Susquehanna originated 1,010 small business loans in the Hagerstown assessment area, aggregating $107 million. A comparison of the number of small business loans originated in each type of census tract to the number of businesses located in those tracts demonstrates the bank s commitment to making credit available to its entire community. The bank s extension of credit to these businesses shows that the low-income census tract received 3% of small business loans, while 5% of businesses are located in these tracts. Moderate-income census tracts received 11% of small business loans, while 21% of businesses are located in these tracts. Susquehanna s small business lending was compared to all lenders operating in the Hagerstown assessment area. Aggregate data show that 3% of all small business loans were made in the lowincome tract and 16% of loans were originated in moderate-income tracts. This comparison shows Susquehanna performed about the same as the market and business demographic levels in the low-income census tract. In moderate-income census tracts, Susquehanna performed below both the market and business demographic levels. However, aggregate lending levels are also below business demographic levels. This level of lending activity by the bank supports an overall satisfactory performance by Susquehanna. Susquehanna also originated 18 small farm loans, aggregating $1.6 million, in the Hagerstown assessment area. Of these loans, 67% were originated in middle-income census tracts and 33% were in upper-income tracts. Ninety-eight percent of the farms are located in middle- and upperincome census tracts. Aggregate loan data showed just 71 small farm loans were originated in the assessment area overall in Distribution of Loans by Borrower Income Level and Revenue Size of the Business Home mortgage and small business lending data were analyzed, in conjunction with a review of the demographic and economic characteristics of the assessment area, to determine the level of lending to borrowers of different income levels and to businesses of different sizes. The analysis reflected an excellent dispersion of HMDA loans among borrowers of different income loans and adequate dispersion of small business loans among businesses of different sizes. Lending to Borrowers of Different Income Levels Home mortgage lending was analyzed to determine the dispersion of the bank's loans among borrowers of different income levels within the Hagerstown assessment area. The analysis reflected excellent dispersion, including lending to low- and moderate-income borrowers. Of the 55,081 families in the Hagerstown assessment area, 18% are designated as low-income and 19% are moderate-income. By comparison, 7% of Susquehanna s home mortgage loans were originated to low-income borrowers and 19% were to moderate-income borrowers. 28
32 Susquehanna s home mortgage lending was also compared to all other lenders operating in the Hagerstown assessment area. An analysis of aggregate loan data show that just 4% of all home mortgage loans were made to low-income borrowers and 15% were to moderate-income borrowers. This comparison shows that Susquehanna performed better than the market with both low- and moderate-income borrowers. The distribution of bank loans reflects excellent penetration among retail customers of different income levels, even though the distribution of loans to low-income borrowers does not correspond to the percentage of low-income families in the assessment area. The bank s level of penetration to these borrowers is considered good given the credit needs of the low-income segment of the population can be difficult to address through conventional loan products, presenting a significant obstacle to home ownership. In particular, 29% of renters in the assessment area pay more than 30% of their income for housing, making it difficult to save for a down payment on a house. In addition, housing prices in the assessment area remain high, limiting homeownership opportunities for low-and moderate-income income families throughout the assessment area. Housing prices jumped between 2000 and 2007 as a result of migration from neighboring metropolitan areas of Washington, DC and Baltimore where housing is more expensive. Obstacles to home ownership also exist for moderate-income families; however, Susquehanna s distribution of loans to moderate-income borrowers in the assessment area is excellent. The bank s participation in innovative and flexible lending programs that address the specific credit needs of low- and moderate-income borrowers enhances its home mortgage lending profile. Most notably, the bank developed its Home Start Loan Program, a mortgage product developed to provide low- and moderate-income borrowers with the ability to purchase a home. The products allow for flexible underwriting standards and the use of alternative credit when no credit score exists. During the evaluation period, Susquehanna originated 279 loans under the program, aggregating $29.9 million. In the Hagerstown assessment area, Susquehanna originated 9 loans, aggregating $1.2 million under the program. Susquehanna participates in the USDA Rural Development Agency guaranteed loan program. The loans are primarily used to help low- and moderate-income individuals or households purchase homes in rural areas. Susquehanna originated four loans aggregating $531 thousand through the program. Two of these loans, aggregating $212 thousand, were originated in the Hagerstown assessment area. The bank also offers the Fannie Mae Flexible 100 Mortgage product for single-family, owneroccupied principal residences. The primary benefit of this product is the no down payment feature. The Flexible 100 is targeted to first-time home buyers and primarily serves low- and moderate-income homebuyers. The product enables Susquehanna to originate loans to borrowers who would not qualify for mortgages under the bank s traditional underwriting criteria. During the evaluation period, Susquehanna originated eight mortgages under the programs, aggregating $1.2 million. 29
33 Lending to Businesses of Different Sizes Small business lending data were analyzed to determine the extent of lending to businesses of different sizes, especially small businesses. The analysis reflected an adequate dispersion of commercial loans among small businesses. A small business is defined as a business with gross annual revenues of $1 million or less. Susquehanna originated 1,010 small business loans during the examination period, aggregating $107 million. Twenty-six percent of these loans were originated to small businesses. A review of all lenders reporting small business loans in the Hagerstown assessment area shows that 38% of all small business loans were to small businesses. Of the 1,010 small business loans originated by the bank during the examination period, 78% were extended in an amount of $100 thousand or less. The number of small business loans originated in smaller amounts is significant because smaller size loans are generally commensurate with the borrowing needs of small businesses. Susquehanna s lending activity, therefore, demonstrates that the bank is meeting the credit needs of small businesses. Susquehanna s participation in innovative and flexible lending programs that address the specific credit needs of small businesses enhanced its small business lending profile. Most notably, Susquehanna participates as a U.S. Small Business Administration (SBA) lender. The bank received SBA s Preferred Lender status and qualified for the SBAExpress lending program developed by the SBA to increase the number of small loans approved by the agency. During the period evaluated, the bank originated 154 SBA loans, aggregating $37.4 million. Susquehanna also originated 18 small farm loans during the examination period. A small farm is defined as a farm with gross annual revenues of $1 million or less. Susquehanna s distribution of loans reflects good penetration among farms of different sizes. Of the loans originated by the bank, 94% were originated to small farms. By comparison, a review of all lenders in the market shows that 72% of all small farm loans made in the assessment area were to small farms. Furthermore, 78% of Susquehanna s small farm loans were extended in an amount of $100 thousand or less. Susquehanna s lending activity demonstrates that it is meeting the credit needs of small farms. Community Development Lending Susquehanna made a relatively high level of community development loans in the Hagerstown assessment area. During the time period evaluated, the bank originated nine community development loans totaling $2.5 million. Two loans totaling $1.0 million, support affordable housing initiatives. Seven loans aggregating $1.5 million, support community development service providers in the assessment area. Responsiveness to Credit Needs Susquehanna exhibits a good record of serving the credit needs of the most economically disadvantaged areas of the Hagerstown assessment area, including low-income borrowers and very small businesses, consistent with safe and sound banking practices. The bank achieved this record primarily through its community development lending and the use of innovative and flexible lending practices in order to serve assessment area credit needs. 30
34 INVESTMENT TEST The investment test evaluates a financial institution s level of qualified investments that serve low- or moderate-income census tracts or individuals. The test also considers the innovativeness and complexity of these investments. Qualified investments made prior to the previous evaluation, which are still outstanding, are considered under the test. For purposes of the CRA, the term qualified investment includes a lawful investment, deposit, membership share, or grant that has as its primary purpose community development. Performance under the investment test is outstanding in the Hagerstown assessment area. Of Susquehanna s total current investments, 6% are attributed to this assessment area. Volume of Investment and Grant Activity A review of investment activity revealed that Susquehanna has an excellent level of qualified community development investments and grants in the Hagerstown assessment area. Overall, investments aggregate $4.3 million. These investments almost exclusively (99%) support affordable housing initiatives. The remaining 1% of investments supports community development services and economic development. Of the bank s investments, $3.6 million are targeted mortgage-backed securities containing residential mortgage loans originated to low- and moderate-income borrowers, or inside low- and moderate-income census tracts. This assessment area also has a share, totaling $681 thousand, in Susquehanna s investment in Maryland Multi-Family Housing Revenue Bonds issued by the State Department of Housing and Community Development. In addition to these investments, the bank made grants and contributions to various organizations that routinely provide affordable housing and community development services that benefit lowand moderate-income individuals and areas. During the period evaluated, the bank made $32 thousand in qualified grants and donations that benefit the Hagerstown assessment area. Responsiveness to Credit and Community Development Needs Susquehanna exhibits good responsiveness to credit and community economic development needs through the use of investments. The bank's investments predominantly support affordable housing in an area with a low per capita income and higher housing costs. Although housing prices have fallen recently, prices remain high, limiting homeownership opportunities for lowand moderate-income families in Hagerstown. SERVICE TEST The service test evaluates the financial services provided by a financial institution using the following characteristics. 31
35 the accessibility of delivery mechanisms within an assessment area, including the distribution of an institution s branch offices and alternative delivery mechanisms; the impact of changes in branch locations upon low- and moderate-income census tracts or low- and moderate-income persons in the assessment area; the reasonableness of business hours and services in meeting assessment area needs; and the extent to which an institution provides community development services. Performance under the service test is rated outstanding in the Hagerstown assessment area. Accessibility of Delivery Systems The bank s delivery systems are readily accessible to all portions of its assessment area. The bank currently operates 15 branches in the Hagerstown MSA with six of those branches, or 40%, located in low- or moderate-income census tracts. By comparison, 18% of the assessment area population resides in low- and moderate-income tracts. In addition, all of the bank s 15 branches in the assessment area operate ATMs and have late evening hours and weekend hours. The following table details the locations of the bank s branches and the population served. Geography Number of Branches Percent Branches Population Percent Population Low-income 1 7 2,307 1 Moderate-income , Middle-income , Upper-income , Unknown income 0 0 6,938 3 TOTALS % 207, % Alternative Retail Banking Services and Alternative Methods of Delivering Retail Banking Services To supplement traditional banking services, Susquehanna offers Internet banking on By accessing Susquehanna s Internet Banker, customers can view account balances, transfer funds between accounts, pay bills, open new accounts and issue stop payments. In addition, customers can bank by phone through a toll-free automated system which allows customers to access account information, open new accounts, renew CDs, apply for loans, or transfer funds. Customer service representatives are available daily and Saturdays. Changes in Branch Locations Susquehanna s record of opening and closing branches in the Hagerstown MSA has not adversely affected the accessibility of its delivery systems in low- and moderate-income census tracts or to low- and moderate-income individuals. Susquehanna has not opened or closed any branches in this assessment area since the last evaluation. 32
36 Reasonableness of Business Hours and Services in Meeting Assessment Area Needs Services, including business hours, do not vary in a way that inconveniences certain portions of the assessment area, particularly low- and moderate-income census tracts or individuals. Banking services are offered in a uniform and consistent manner among all branches. Community Development Services Susquehanna is a leader in providing community development services in the Hagerstown assessment area. Numerous bank officers and employees serve in various capacities on boards of local community development organizations, participate on loan and finance committees, make presentations for small business, homeownership, and financial literacy programs, provide credit counseling and technical expertise. These organizations include: Hagerstown Neighborhood Development Corporation Tri-County Council for Western Maryland Boonsboro Economic Development Commission Boonsboro Downtown Development Association Boonsboro Development Committee Hagerstown Redevelopment Authority STAR Community Hagerstown Community College s Technical Information Center Hagerstown, Washington County Economic Development Commission Housing Authority of Washington County The Martinsburg Housing Authority Bank Products Susquehanna offers bank products that provide greater access to banking services for low- and moderate-income customers and small businesses. These products include: A free checking account that offers unlimited check writing, no minimum daily balance requirement and no monthly service fee. Internet Banker and telephone banking are free of charge with this account. The account provides greater access to banking services for lowand moderate-income consumers. A business checking account with no monthly service fees or minimum balance requirements for businesses that generate 150 or fewer checks or deposited items per month. Internet Banker for Business with bill payment is offered free with this account. The account provides greater access to banking services for small businesses. 33
37 PENNSYLVANIA CRA RATING 5 STATE OF PENNSYLVANIA Performance Test Lending Investment Service Overall Performance Level High Satisfactory Outstanding High Satisfactory High Satisfactory SUMMARY OF MAJOR FACTORS SUPPORTING RATING Major factors contributing to the rating include the following: The geographic distribution of loans reflects good penetration throughout the assessment areas. The distribution of borrowers, given the product lines offered by the bank, reflects excellent penetration among retail customers of different income levels and good penetration of business customers of different sizes. The bank exhibits a good record of serving the credit needs of the most economically disadvantaged areas of its assessment areas, low-income individuals, and very small businesses, consistent with safe and sound banking practices. Susquehanna is a leader in making community development loans in Pennsylvania. The bank has an excellent level of qualified community development investments and grants. The bank provides a significant level of community development services. SCOPE OF EXAMINATION Susquehanna s CRA performance in Pennsylvania was evaluated for the period from October 3, 2006 through February 2, The lending, investment, and service tests were applied in assessing the bank s performance under the CRA, pursuant to the Interagency Procedures and Guidelines for Large Retail Institutions. Under the lending test, loan products evaluated included home purchase and home-improvement loans and refinancing of such loans (collectively titled HMDA loans), small business and small farm loans, and other loans that qualified as community development. For purposes of evaluating the geographic distribution of loans, geographies were classified on the basis of 2000 U.S. Census data. The state rating for Pennsylvania is comprised of the evaluation of Susquehanna s CRA performance in the following nine assessment areas: 5 The statewide evaluation is adjusted for institutions with branches in two or more states in a multi-state metropolitan area, and does not reflect performance in the parts of those states contained within the multi-state metropolitan area. 34
38 1. Lancaster MSA 2. York-Hanover-Gettysburg CSA 3. North Central Pennsylvania assessment area (Northumberland, Schuylkill, Snyder and Union Counties); 4. Harrisburg assessment area (Dauphin and Cumberland Counties); 5. Williamsport MSA; 6. South Central Pennsylvania assessment area (Bedford, Franklin, Fulton and Huntingdon Counties); 7. Scranton assessment area (Luzerne County); 8. Reading MSA; and 9. Allentown assessment area. A substantial majority of Susquehanna s lending and operations in Pennsylvania are in the following assessment areas: Lancaster MSA, York-Hanover-Gettysburg CSA, North Central Pennsylvania; and Harrisburg. Accordingly, a full review of the bank s performance in these assessment areas was performed. Limited reviews of the bank s CRA performance were conducted for the following assessment areas: Reading MSA, Allentown, Williamsport MSA, Scranton, and South Central Pennsylvania. 35
39 FULL REVIEW ASSESSMENT AREA CONCLUSIONS LANCASTER, PA METROPOLITAN STATISTICAL AREA DESCRIPTION OF ASSESSMENT AREA The bank s assessment area includes the entire Lancaster MSA, which comprises Lancaster County in its entirety. This assessment area consists of 94 census tracts, of which five are designated as low-income and 11 are moderate-income. All five low-income tracts and eight of the moderate-income tracts are located in the city of Lancaster. The three remaining moderateincome census tracts are located in Columbia Borough (2) and Paradise (1). Twelve percent of the assessment area s population resides within these low- and moderate-income census tracts. Susquehanna s performance in the Lancaster assessment area was evaluated in the demographic and business context in which it operates. According to the Federal Deposit Insurance Corporation s (FDIC) Summary of Deposits as of June 30, 2008, 6 19 depository institutions operate in Lancaster County. These institutions maintained a total of 205 branches, holding $8.8 billion in deposits. During the evaluation period, Susquehanna operated 43 of these branches with $1.7 billion in deposits, or 19% of the market s total deposits. Fulton Bank, headquartered in Lancaster, ranked first with 20% of market deposits. Lancaster County accounted for 19% of Susquehanna s total bank deposits. Susquehanna s HMDA loans were compared to the aggregate of all lenders in the assessment area reporting real estate loans pursuant to HMDA. These data are reported annually, and the most recent year for which information is available is 2007, when a total of 377 institutions reported HMDA loans in Lancaster County. Susquehanna ranked 11 th in Lancaster County with 2% of all such loan originations and purchases. Affiliate Susquehanna Mortgage Corporation ranked 40 th, with 1% of originations and purchases. Three local financial institutions ranked in the top ten HMDA loan originators in 2007: Fulton Bank (6% of the market), Bank of Lancaster County (4%), and Sovereign Bank (3%). Lenders originating loans nationally such as Countrywide, Wells Fargo, and CitiMortgage, were also in the top ten, but originated only 24% of HMDA reportable loans in the assessment area, demonstrating that community and regional banks in the area are competing successfully with those national lenders. A total of 78 lenders reported small business loans in Lancaster County in Susquehanna ranked 8 th among small business lenders with 3% of the market. Since business credit cards are included in CRA Small Business reporting, national lenders such as American Express Bank FSB, Chase Bank USA, Citibank USA, and Capital One dominate the market, but local lenders, especially Fulton Bank with 9% of the market, are capturing a relatively large segment of the market in Lancaster County. 6 June 30, 2008 is the most recent date for which FDIC deposit data is available. 36
40 ECONOMIC CHARACTERISTICS Lancaster County in southeastern Pennsylvania is advantageously situated close to three metropolitan areas (Harrisburg and Philadelphia in Pennsylvania and Wilmington in Delaware). Economic mainstays include agriculture, business and light industry, and tourism. In addition, eight major institutions of higher learning also make their homes here, including Franklin and Marshall College and Millersville University. Lancaster s economy has been relatively well-insulated from the broad based slowdown that has dragged the nation into recession. Although both homebuilders and housing-related manufacturers were battered by the housing market correction, other industries such as education/health services, government, and trade, transportation, and utilities have propped up the Lancaster economy, adding jobs at a steady pace. The manufacturing sector is a key driver in the Lancaster economy accounting for one out of every five jobs in the metropolitan area. Housing-related manufacturing such as furniture and wood products manufacturers are mainly responsible for the sector s struggles. However, the relatively large food manufacturing industry has held up due to its non-cyclical nature. Lancaster s population continues to grow, increasing by 6% between 2001 and The MSA s relatively affordable cost of living continues to draw migrants from higher-cost neighboring areas like Harrisburg, Philadelphia, and Wilmington. Moody s Economy.com estimates that the average existing home price in the Lancaster MSA was $172,900 in 2008, down from $173,700 in 2007 (0.5%). Major private sector employers in the area include Lancaster General Hospital, Manheim Auto Auction, Armstrong Holdings (flooring), and Ephrata Community Hospital. The county government and school districts are also major employers. Chief bank competitors in the area include Fulton Bank, Bank of Lancaster County and Sovereign Bank. Area unemployment rates are increasing, but remain below those of Pennsylvania and the nation as reflected in the following table: Locations November 2008 November 2007 Lancaster MSA 4.8% 3.2% Pennsylvania 6.2% 4.4% United States 6.8% 4.7% Information and insight into the perceived credit needs and opportunities in the Lancaster MSA was obtained from interviews and contacts with bankers, community organizations and local government officials. The most frequently mentioned credit needs were: (1) loans for first-time and low- and moderate-income homebuyers; (2) home improvement loans to preserve the older housing base, and (3) financing for small businesses. 37
41 HOUSING According to the 2000 Census, the Lancaster MSA contains 179,990 housing units, of which 68% are owner-occupied and 28% are rental units. In low-income census tracts, 26% of housing units are owner-occupied, and in moderate-income tracts 46% are owner-occupied. The overall owner-occupancy rate for Pennsylvania is 65%. The percentage of owner-occupied housing units contained within designated census tracts is used as a proxy to estimate demand for residential mortgage lending within such tracts. An analysis of owner-occupied units, compared to the number of total available housing units for each geographic designation, shows that just 1% of all owner-occupied units are located in the assessment area s low-income census tracts and 6% are in moderate-income tracts. The large majority of owner-occupied units (82%) are located in middle-income tracts and 11% are in upper-income income tracts. Demographics reveal that single-family houses comprise 75% of all housing units in the Lancaster MSA, while multi-family units comprise 11%, two-to-four family units 9%, and mobile homes 5%. The median age of the housing stock is 34 years, lower than the state at 43 years. However, the median age of housing stock in the city of Lancaster is much older at 48 years. Median rent in the assessment area is $572, with 31% of renters paying more than 30% of their income for housing. Rent is slightly lower in the city of Lancaster at $536, with 37% of renters paying more than 30% of income for housing. Census data also indicate that the median housing value in the Lancaster MSA in 2000 was $118,290. A large disparity exists between median housing values in the upper-income ($150,609) and middle-income ($118,693) census tracts and the values in the moderate-income ($70,482) and low-income ($57,960) tracts. However, since 82% of the low- and moderateincome families reside in middle- and upper-income tracts, housing costs are out of their reach. Of the total owner-occupied housing units, just 34% are valued at less than $100 thousand, indicating that housing in this assessment area is less affordable than housing in Pennsylvania as a whole, where 54% of housing units are valued at less than $100 thousand. BORROWER INCOME DATA For purposes of evaluating the distribution of loans to borrowers of different income levels, incomes were classified based upon annually adjusted median family income data made available by HUD. According to 2000 Census data, the median family income for the Lancaster MSA was $52,442, compared to $49,184 for the state. In 2008, the adjusted median family income for the Lancaster MSA, as reported by HUD, increased to $64,200. According to 2000 Census data, 16% of families in the assessment area are designated as lowincome and 20% are moderate-income. Families living below the poverty level represent 5% of total families in the assessment area, compared to 8% in Pennsylvania as a whole. 38
42 GEOGRAPHIC BUSINESS DATA The percentage of businesses and farms located within designated census tracts was used as a proxy to estimate demand for small business and small farm credit within such tracts. According to Dun and Bradstreet, the Lancaster MSA has 17,958 businesses, of which 4% are located in low-income census tracts and 8% in moderate-income tracts. The large majority of businesses (78%) are located in middle-income census tracts and 10% are in upper-income tracts. In addition, 1,104 farms operate in the Lancaster MSA, less than 1% of which are located in lowincome census tracts and 2% in moderate-income tracts. The large majority of farms (96%) are located in middle-income census tracts, with just 2% in upper-income tracts. The demographics used to assess the performance context in which Susquehanna operates in the Lancaster MSA are detailed in the following table. Income Categories Tract Distribution Susquehanna Bank Assessment Area Demographics Lancaster, PA, MSA Families by Tract Income Families < Poverty Level as % of Families by Tract Families by Family Income # % # % # % # % Low-income , , , Moderate-income , , , Middle-income , , , Upper-income , , Unknown-income Total Assessment Area , , , Housing Housing Types by Tract Units by Tract Owner-occupied Rental Vacant # % % # % # % Low-income 5,519 1, , Moderate-income 17,065 7, , , Middle-income 140, , , , Upper-income 17,001 12, , Unknown-income Total Assessment Area 179, , , , Total Businesses by Tract Less Than or = $1 Million Businesses by Tract & Revenue Size Over $1 Million Revenue Not Reported # % # % # % # % Low-income Moderate-income 1, , Middle-income 14, , , Upper-income 1, , Unknown-income Total Assessment Area 17, , , Percentage of Total Businesses: Farms by Tract & Revenue Size Total Farms by Less Than or = $1 Revenue Not Tract Over $1 Million Million Reported # % # % # % # % Low-income Moderate-income Middle-income 1, , Upper-income Unknown-income Total Assessment Area 1, , Percentage of Total Farms:
43 CONCLUSIONS WITH RESPECT TO PERFORMANCE TESTS LENDING TEST The lending test evaluates an institution s lending activities based on the following characteristics: geographic distribution of loans, particularly loans originated in low- and moderate-income census tracts; borrowers profile, particularly distribution of loans to low- and moderate-income borrowers and small businesses; overall responsiveness to credit needs of highly economically disadvantaged census tracts, low-income persons, and very small businesses; and community development lending activities. The bank s performance under the lending test is assessed as high satisfactory in the Lancaster assessment area. Geographic Distribution of Lending The geographic distribution of loans in the Lancaster assessment area was analyzed to determine the dispersion of loans among different census tracts. The analysis reflects good penetration throughout the assessment area, including low- and moderate-income census tracts. Home Mortgage Lending Susquehanna originated 1,551 home mortgage loans, aggregating $170 million, in the Lancaster assessment area. The percentage of owner-occupied housing units contained within designated census tracts is used as a proxy to estimate demand for residential mortgage lending within such tracts. A lower level of owner-occupied units limits the bank s lending opportunities in these tracts. A review of Susquehanna s mortgage lending activity reflects good penetration throughout the assessment area. In Lancaster County, the substantial majority of owner-occupied housing units (82%) are located in middle-income census tracts, with only 1% located in low-income tracts and 6% in moderateincome tracts. By comparison, 1% of Susquehanna s home mortgage loans were made in lowincome census tracts and 7% were in moderate-income tracts. Susquehanna s home mortgage lending was compared to all lenders operating in Lancaster County. According to aggregate HMDA data, 1% of all home mortgage loans made in the assessment area were made in lowincome tracts, indicating there were few lending opportunities for banks operating in these tracts. Further, 8% of home mortgage loans were made in moderate-income tracts. Overall, Susquehanna performed at about the same level as the market in both low- and moderate-income tracts. 40
44 Small Business Lending An analysis of the geographic distribution of small business loans was conducted to determine the dispersion of these loans among different census tracts within the bank's Lancaster assessment area. The analysis reflects good penetration given the economic characteristics of the assessment area. During the period evaluated, Susquehanna originated 1,658 small business loans in the Lancaster MSA, in an aggregate amount of $255 million. A comparison of the number of small business loans originated in each type of census tract to the number of businesses located in those tracts demonstrates the bank s commitment to making credit available to its entire community. Business demographics revealed a total of 17,958 businesses located within the assessment area. Susquehanna s extension of credit to these businesses shows that low-income census tracts received 2% of small business loans, while 4% of small businesses are located in these tracts. Moderate-income census tracts received 6% of small business loans, while 8% of small businesses are located in these tracts. Middle-income census tracts, with 78% of small businesses, received 83% of small business loans and upper-income tracts received 10% of small business loans for their 10% share of small businesses. Susquehanna s small business lending was compared to all lenders operating in Lancaster County. Aggregate data showed that 2% of all small business loans were made in low-income census tracts and 6% were made in moderate-income tracts. Overall, Susquehanna performed the same as the market in both low- and moderate-income areas, although both bank and aggregate lending levels were below the proxy for small businesses. Small Farm Lending The geographic distribution of small farm loans was analyzed to determine the dispersion of these loans among different census tracts. The bank s lending reflects excellent penetration throughout the Lancaster assessment area. Susquehanna originated 267 small farm loans aggregating $23 million in Lancaster County. A comparison of the number of small farm loans originated in each type of census tract to the number of farms located in those tracts demonstrates the bank s commitment to making credit available to its entire community. Business demographics revealed a total of 1,104 farms located within the assessment area. Susquehanna s extension of credit to small farms shows no loans were originated in low-income census tracts; however, less than 1% of farms are located in these tracts. Moderate-income census tracts received 6% of small farm loans, while just 2% of farms are located in these tracts. Aggregate data show that no banks, including Susquehanna, made small farm loans in the assessment area s low-income census tracts. However, 4% of all small farm loans were made in moderate-income tracts, while Susquehanna originated 6% of its small farm loans in these tracts, demonstrating slightly better performance than the market. 41
45 Distribution of Loans by Borrower Income Level and Revenue Size of Business HMDA and small business lending data were analyzed in conjunction with a review of the demographic and economic characteristics of the assessment area to determine the extent of lending to borrowers of different income levels and to businesses of different sizes. The analysis revealed good penetration with both low- and moderate-income borrowers and small businesses. Lending to Borrowers of Different Income Levels An analysis of the distribution of home mortgage loans among retail customers of different income levels, including low- and moderate-income customers, reflects good penetration in the Lancaster assessment area. The demographics of the assessment area show that of the 124,865 families in the assessment area, 16% are designated as low-income and 20% are moderateincome. By comparison, the distribution of Susquehanna s home mortgage loans to these borrowers shows that 8% of loans were to low-income borrowers and 23% were to moderateincome borrowers. Susquehanna s home mortgage lending was compared to all lenders operating in the assessment area. The 2007 aggregate data show that 7% of all home mortgage loans made in the assessment area were to low-income borrowers and 23% were to moderate-income borrowers. Overall, Susquehanna performed about the same as the market with both low- and moderate-income borrowers. The distribution of loans to low-income families in comparison to the demographics of the assessment area shows that lending levels do not correspond to the percentage of low-income families in the assessment area. However, the bank s level of penetration is considered good in light of the inherent obstacles in lending to low-income borrowers. In particular, about 31% of the assessment area s renters expend more than 30% of gross income for housing, making it difficult to save the customary down payment and closing costs necessary to purchase a home. This problem has been exacerbated by dramatic increases in home prices in the MSA. Statistics from Moody s Economy.com show that the average home price in the Lancaster MSA increased 51% between 2001 and 2008, from $114,200 to 172,900. The largest increases took place between 2001 and The average home price decreased only slightly (0.5%) from 2007 to Obstacles to home ownership also exist for moderate-income families; however, Susquehanna s distribution of loans to moderate-income borrowers in the assessment area is good. The bank s participation in innovative and flexible lending programs that address the specific credit needs of low- and moderate-income borrowers enhanced its home mortgage lending profile. Most notably, the bank offers the Home Start Loan Program, a mortgage product developed to provide low- and moderate-income borrowers with the ability to purchase a home. The products allow for flexible underwriting standards and the use of alternative credit when no credit score exists. During the evaluation period, Susquehanna originated 279 loans under the program, aggregating $29.9 million. In the Lancaster assessment area, the bank originated 81 of these loans, aggregating $9.1 million. 42
46 Susquehanna is a member of the Federal Home Loan Bank of Pittsburgh (FHLBP) and a participant in its First Front Door Program. This Program is designed to provide low- and moderate-income homebuyers with down payment and closing cost assistance. Homebuyers are eligible to receive three dollars for every one dollar paid towards closing costs. Through Susquehanna, 41 homebuyers in its assessment areas received more than $215 thousand in matching funds. Four homebuyers in the Lancaster assessment area received more than $15,344 in matching funds through this program. The bank also offers the Fannie Mae Flexible 100 Mortgage product for single-family, owneroccupied residences. The primary benefit of this product is the no down payment feature. The Flexible 100 is targeted to first time homebuyers and primarily serves low- and moderate-income homebuyers. The product enables Susquehanna to originate loans to borrowers who would not qualify for mortgages under the bank s traditional underwriting criteria. During the evaluation period, Susquehanna originated eight mortgages under the program, aggregating $1.2 million. Susquehanna originates loans through lending programs offered by the Pennsylvania Housing Finance Agency (PHFA). Borrowers must be first-time homebuyers or homebuyers in targeted areas, with incomes less than 100% of the area median and purchasing a home priced below an amount set by PHFA. Income guidelines set by PHFA ensure that loans are primarily originated to low- and moderate-income borrowers. Susquehanna originated 34 loans aggregating $3.3 million under the PHFA program, during the period examined. In the Lancaster assessment area, Susquehanna originated one loan, aggregating $138,510. Lending to Businesses Different Sizes Small business lending data were analyzed to determine the extent of lending to businesses of different sizes, including small businesses. A small business is defined as a business with gross annual revenues of $1 million or less. Susquehanna s distribution of loans reflects excellent penetration among business customers of different sizes. Susquehanna originated 1,658 small business loans, aggregating $255 million. Of these loans, 882, or 53%, were originated to small businesses. By comparison, a review of all lenders in the market shows that 40% of all small business loans made in the assessment area were to small businesses. According to business data provided by Dun and Bradstreet, approximately 87% of businesses in the Lancaster MSA are small businesses. Furthermore, of the bank s 1,658 small business loans, 1,096 (or 66%) were extended in an amount of $100 thousand or less. Since small loans are generally commensurate with the borrowing needs of smaller businesses, Susquehanna s lending activity demonstrates that it is meeting the credit needs of these businesses. Susquehanna s participation in innovative and flexible lending programs which address the specific credit needs of small businesses enhanced its small business lending profile. Most notably, Susquehanna participates as a U.S. Small Business Administration (SBA) lender. The bank received SBA s Preferred Lender status and qualified for the SBAExpress lending program developed by the SBA to increase the number of small loans approved by the agency. During the period evaluated, the bank originated 154 SBA loans, aggregating $37.4 million. 43
47 Lending to Farms of Different Sizes Small farm lending data were analyzed to determine the extent of lending to farms of different sizes, especially small farms. A small farm is defined as a business with gross annual revenues of $1 million or less. Susquehanna s distribution of loans reflects good penetration among farms of different sizes. Susquehanna originated 267 small farm loans aggregating $23 million. Of these loans, 179, or 67%, were originated to small farms. By comparison, a review of all lenders in the market shows that 85% of all small farm loans made in the assessment area were to small farms. According to business data provided by Dun and Bradstreet, approximately 97% of farms in Lancaster County were small farms. Furthermore, of the 267 small farm loans the bank originated, 198 (or 74%) were extended in an amount of $100 thousand or less. Since small loans are generally commensurate with the borrowing needs of smaller businesses and farms, Susquehanna s lending activity demonstrates that it is meeting the credit needs of these farms. Community Development Lending Susquehanna is a leader in making community development loans in the Lancaster assessment area. During the period evaluated, the bank originated 13 community development loans aggregating $13 million. Seven loans totaling $11.2 million support activities that revitalize or stabilize low- or moderate-income census tracts. Four loans totaling $1.7 million, support affordable housing and two loans totaling $100 thousand support the provision of community development services in the assessment area. Responsiveness to Credit Needs Susquehanna exhibits an excellent record of serving the credit needs of the most economically disadvantaged areas of the Lancaster assessment area, including low-income borrowers and very small businesses, consistent with safe and sound banking practices. The bank achieved this record primarily through its community development lending and the use of innovative and flexible lending practices in order to serve assessment area credit needs. INVESTMENT TEST The investment test evaluates a financial institution s level of qualified investments that serve low- or moderate-income census tracts or individuals as well as the innovativeness and complexity of such investments. Qualified investments made before the previous evaluation, which are still outstanding, are considered under this test. For purposes of CRA, the term qualified investment includes a lawful investment, deposit, membership share, or grant that has as its primary purpose community development. Performance under the investment test is outstanding in the Lancaster assessment area. Of Susquehanna s total current investments, 11% are attributed to this assessment area. 44
48 Volume of Investment and Grant Activity A review of investment activity revealed that Susquehanna has an excellent level of qualified community development investments and grants in the Lancaster assessment area. Overall, investments aggregate $9.1 million. The substantial majority of these investments (95%) support affordable housing. The remaining 5% of investments support community development services and economic development. Of the bank s investments, $6.0 million are targeted mortgage-backed securities containing residential mortgage loans originated to low- and moderate-income borrowers, or inside low- and moderate-income census tracts. The bank also has $1.5 million invested in affordable rental housing for seniors, a $907 thousand share of Pennsylvania Housing Finance Agency Single Family Mortgage Revenue Bonds which finance homes for low-and moderate-income families in Pennsylvania. In addition, Susquehanna has a $128 thousand share of Pennsylvania s Business In Our Sites investments targeted to the redevelopment of brownfield sites around Pennsylvania. This program is funded by the Commonwealth of Pennsylvania s Financing Authority Revenue Bonds. The bank made grants and contributions to various organizations that routinely provide affordable housing, economic development, and community development services that benefit low- and moderate-income individuals and areas. During the period evaluated, the bank made $480 thousand in qualified grants and donations that benefit the Lancaster assessment area. Responsiveness to Credit and Community Development Needs Susquehanna exhibits good responsiveness to credit and community economic development needs through the use of investments. The largest portion of the bank's investments supports affordable housing, a demonstrated need in this assessment area. SERVICE TEST The service test evaluates the financial services provided by a financial institution using the following criteria: the accessibility of delivery mechanisms within an assessment area, including the distribution of an institution s branch offices and alternative delivery mechanisms; the impact of changes in branch locations upon low- and moderate-income census tracts or low- and moderate-income persons in the assessment area; the reasonableness of business hours and services in meeting assessment area needs; and the extent to which an institution provides community development services. The bank s performance under the service test is high satisfactory in the Lancaster MSA assessment area. 45
49 Accessibility of Delivery Systems The bank s delivery systems are reasonably accessible to essentially all portions of its assessment area. The bank operates 40 branches in the Lancaster MSA. One of these branches is located in a low-income census tract and one is in a moderate-income tract, representing six percent of bank branches, while 12% of the assessment area population resides in low- or moderate-income census tracts. However, the branch located in the low-income tract in the city of Lancaster was established as a private banking office to accommodate business customers and is not open to the general public. The branch also has no ATM. The bank s Columbia branch, although located in a middle-income census tract, is across the street from a moderate-income tract, making it accessible to customers in that moderate-income area. The following table details the locations of the bank s branches in the Lancaster MSA compared to the population. Census Tract Number of Branches Percent Total Population Percent Low-income ,746 3 Moderate-income ,901 9 Middle-income , Upper-income ,082 9 TOTALS % 470, % Alternative Retail Banking Services and Alternative Methods of Delivering Retail Banking Services To supplement traditional banking services, Susquehanna offers Internet banking on By accessing Susquehanna s Internet Banker, customers can view account balances, transfer funds between accounts, pay bills, open new accounts and issue stop payments. In addition, customers can bank by phone through a toll-free automated system which allows customers to access account information, open new accounts, renew CDs, apply for loans, or transfer funds. Customer service representatives are available daily, including Saturdays. Changes in Branch Locations Susquehanna s record of opening and closing branches in the assessment area has not adversely affected the accessibility of its delivery systems in low- and moderate-income census tracts or to low- and moderate-income individuals. During the evaluation period, the bank closed two branches, re-located two branches, and consolidated one branch. The branch closures were in the townships of East Earl and Willow Street. The closures resulted from duplication of branch locations following the 2007 merger of Susquehanna with Community Banks, N.A., Harrisburg. Both branches were located in middle-income census tracts in Lancaster County. In addition, the bank s Strasburg and Rockvale branches were consolidated, and then re-located with a new address of 35 South Willowdale Drive, Lancaster. Susquehanna s Park City Mall branch was moved from 338 Park City Center, to 536 Park City Center, Lancaster, which is within the same census tract. All of the impacted branches were located in middle-income census tracts in Lancaster County. 46
50 Reasonableness of Business Hours and Services in Meeting Assessment Area Needs Services, including business hours, do not vary among branch offices in a way that inconveniences portions of the assessment area, particularly low- and moderate-income census tracts or individuals. Susquehanna offers banking services in a uniform and consistent manner among all its branches. Community Development Services Susquehanna provides a relatively high level of community development services in its Lancaster MSA assessment area. The most notable of these services include: A bank officer serves on the board of directors for The Community First Fund, a nonprofit community development organization that supports community-based business and housing initiatives that increase the number of jobs and affordable-housing units in south central Pennsylvania. A bank officer serves as a board member of the Housing Development Corporation, a nonprofit corporation that assists in the development of affordable housing for low- and moderate-income families, seniors, and persons with disabilities. A bank officer is the Director of the Lancaster Housing Opportunity Partnership (LHOP), an organization focused on making housing more affordable for low- and moderate-income Lancaster County residents. LHOP advocates, educates, and facilitates local solutions to the county s need for affordable housing. Banking Products Susquehanna offers banking products that provide greater access to banking services for lowand moderate-income customers and small businesses. Susquehanna issued three commercial letters of credit in the Lancaster assessment area. These letters of credit qualify as a community development service because the letters provided necessary credit support for community development initiatives inside the assessment area. Two of the letters were issued to the Lancaster Area Habitat for Humanity to support affordable housing projects and one letter was issued to a for-profit company to support the rehabilitation of a vacant warehouse located in a Keystone Opportunity Zone. The Free Checking account is a basic checking account with no minimum balance requirement, no service charges, unlimited check writing, and free Internet banking, including bill payment, and a debit card. The account provides greater access to banking services for low- and moderate-income individuals. The Business Checking Account is designed for small businesses with limited transaction activity. The account has no minimum balance requirements and charges $.30 per item over 150 items per month. This account provides greater access to banking services, including Internet bill payment, for local smaller businesses. 47
51 NORTH CENTRAL PENNSYLVANIA: NORTHUMBERLAND, SCHUYLKILL, SNYDER, AND UNION COUNTIES NON-METROPOLITAN AREA DESCRIPTION OF ASSESSMENT AREA This assessment area is comprised of four counties situated in a non-metropolitan area of northern central Pennsylvania. The counties include Northumberland, Union, and Snyder (comprising the Sunbury-Lewisburg-Selinsgrove combined statistical area) and Schuylkill County (the Pottsville, PA micropolitan area). The assessment area has 77 census tracts, ten of which are moderate-income, 59 middle-income, and eight are upper-income. Of the ten moderate-income tracts, five are located in Northumberland County and five are in Schuylkill County. Twelve percent of the assessment area s population resides in these moderate-income tracts. There are no low-income census tracts in this assessment area. Susquehanna s performance was evaluated in terms of the demographic and business context in which it operates. According to the FDIC s Summary of Deposits, as of June 30, 2008, 31 depository institutions operate in the assessment area, maintaining a total of 147 branches holding $4.3 billion in deposits. Susquehanna, with 18 branches, ranks second in the assessment area with $573 million in deposits, comprising 6% of the bank s total deposits and over 13% of the area market share. Susquehanna s HMDA loans were compared to the aggregate of all lenders in the market reporting real estate loans under HMDA. These data are reported annually and 2007 is the most recent year for which information is available. Susquehanna was ranked 7 th in the assessment area with 3% of loans. Community Banks, acquired by Susquehanna in November 2007, was the 6 th largest HMDA loan originator in the assessment area with 4% of all such loan originations and purchases. Countrywide Homes was ranked 1 st with 7% of the market. Susquehanna ranked 10 th among small business lenders in the assessment area, with 2% of the market. Community Banks was the 18 th largest small business reporter with 1% of loans. Swineford National Bank was the highest ranked local bank at 9 th, with 2% of the market. There were 65 small business reporters in the North Central Pennsylvania assessment area, reporting 9,281 small business loans in ECONOMIC CHARACTERISTICS The North Central Pennsylvania assessment area consists of four counties: Northumberland, Union, Snyder, and Schuylkill Counties. Northumberland County, which comprises the Sunbury micropolitan area, has traditionally relied on mining, quarrying, and heavy manufacturing as the mainstays of its economy. Although these enterprises still provide employment, they have been eclipsed for the most part by food manufacturing and health services. Northumberland County s population continues to decrease. As of July 2007, the total county population was 91,003, down from 94,556 at the 2000 Census. 48
52 Major employers in the county include Weis Markets, Northumberland County government, Pennsylvania state government, Conagra Packaged Foods, Shikellamy School District, and Fleetwood Motor Homes of Pennsylvania. Much of the county is rural, comprised primarily of wooded and farm land. Banks with a presence in the county include Northumberland National Bank, M&T Bank, and Union National Bank of Mt. Carmel. Susquehanna has more branches and holds higher market share in the county than any of its competitors. Snyder County comprises the Selinsgrove Micropolitan Area, which is largely rural in nature. About 43% of the county s land is devoted to farming, although towns along the Susquehanna River support a variety of light industry. The county s population has increased slightly (2%) since the 2000 Census, to 38,113 as of July Major employers include Wood Mode Cabinets, Susquehanna University, and Conestoga Wood Specialties. Pennsylvania state government is the second largest employer in the county, and local school districts provide employment as well. Susquehanna s competitors in the area include Swineford National Bank, which holds 30% of county deposits, Northumberland National Bank, and First National Bank of Pennsylvania. Union County, which is the Lewisburg Micropolitan Area, has the smallest population of the four counties, but is also the fastest growing. Its population grew by 5% since the 2000 Census, to 43,724 as of July Although 10% of this growth resulted from the establishment of the Allenwood Federal Correctional Institution, the county s population has been growing steadily, and is projected to continue increasing. Much of Union County s land remains forest and open space (approximately one-third is state forest land). This open space attracts recreational, seasonal, and retirement homes. The county s major employers include the United States government, Bucknell University, Evangelical Community Hospital, The Mifflinburg Area School District, and Albright Care Services. Major area banks include West Milton State Bank and Mifflinburg Bank and Trust, which hold 66% of county deposits between them. Susquehanna has a minimal presence in the county with just 3% of market share. Schuylkill County, which is the Pottstown micropolitan area, is the largest of the four counties in terms of population with 46% of the total assessment area population. The county population was 147,269 as of July 2007; however, this is down 2% since the 2000 Census. Many specialized manufacturers are based in Schuylkill County, which has easy access to many northeastern population centers to attract distribution and warehousing businesses. Schuylkill County s major employers include the Wal-Mart Associates, Pennsylvania state government, Pottsville Hospital, SAPA Extrusions, and Good Samaritan Hospital. Major area banks include Wachovia Bank, M&T Bank, and Sovereign Bank, which together hold 56% of county deposits. Susquehanna holds an 11% market share. The unemployment rates for all the micropolitan areas, as well as rates for Pennsylvania and the US as a whole, are presented in the following table. 49
53 Location November 2008 November 2007 Northumberland County 7.5% 4.6% Snyder County 6.7% 4.3% Schuylkill County 7.0% 4.6% Union County 6.6% 4.6% Pennsylvania 6.2% 4.4% United States 6.8% 4.7% Based on interviews with community organizations in the assessment area, the area s credit needs include affordable housing, especially in Union County, small business loans, and technical assistance for small businesses. HOUSING The North Central PA assessment area contains 95,876 housing units, 68% of which are owneroccupied while 22% are rental units. In moderate-income census tracts, owner-occupancy is 53%, while rental units account for 31% of housing. The overall owner-occupancy rate in Pennsylvania as a whole is 65%. Single-family units comprise 80% of the housing units, while two-to-four family units comprise 8%, multi-family units 6%, and mobile homes 6%. The median age of the housing stock is 57 years, compared to 43 years in Pennsylvania as a whole. Median rent in the assessment area is $397, with 28% of renters paying more than 30% of their income for housing The median rent in Pennsylvania overall is $531, with 35% of renters paying more than 30% of their income for housing. The median housing value in the assessment area is $73,489. The median housing values in the upper-income census tracts ($106,526) exhibit a large disparity with those in middle-income ($74,105), and moderate-income ($36,305) tracts. Of the total owner-occupied housing units, 39% are valued at less than $60 thousand, indicating that housing in the North Central PA assessment area is more affordable overall than Pennsylvania as a whole at 24%. The percentage of owner-occupied housing units contained within designated census tracts was used as a proxy to estimate demand for residential mortgage lending within such census tracts. The analysis of owner-occupied housing units, compared to the number of total available housing units for each geographic designation, shows that the majority of owner-occupied housing units (78%) are located in the middle-income census tracts. Just 11% are located in the moderate-income census tracts, with the remaining 11% of owner-occupied units located in upper-income tracts. BORROWER INCOME DATA For purposes of evaluating the distribution of loans to borrowers of different income levels, incomes are classified based upon annually adjusted median family income data made available by HUD. According to 2000 Census data, the median family income for the North Central PA assessment area was $41,461, compared to $49,184 for Pennsylvania. The Pennsylvania non- MSA adjusted median family income for 2008 is $51,
54 Based on this data, of the total families in the North Central PA assessment area, 17% are designated as low-income, 20% are moderate-income, 25% are middle-income, and 38% are upper-income. Families living below the poverty level represent 7% of the total families in the assessment area. In Pennsylvania overall, 8% of the total families live below poverty level. GEOGRAPHIC BUSINESS DATA The percentage of small businesses and small farms located within designated census tracts was used as a proxy to estimate demand for small business and small farm credit within such census tracts. According to Dun and Bradstreet, the North Central PA assessment area has 10,496 businesses, 12% of which are located in moderate-income census tracts. The substantial majority of businesses are located in middle-income tracts (73%), with the remainder (15%) in upper-income tracts. In addition, the assessment area has 601 farms, just 0.3% of which are located in moderateincome census tracts. The substantial majority of farms are located in middle-income census tracts (85%), with the remainder (15%) in upper-income tracts. The demographics used to assess the performance context in which Susquehanna operates are detailed in the table on the following page. Income Categories Susquehanna Bank Assessment Area Demographics North Central Pennsylvania Non-Metropolitan Area (Northumberland, Schuylkill, Snyder and Union Counties) Tract Distribution Families by Tract Income Families < Poverty Level as % of Families by Tract Families by Family Income # % # % # % # % Low-income , Moderate-income , , , Middle-income , , , Upper-income , , Unknown-income Total Assessment Area , , , Housing Housing Types by Tract Units by Tract Owner-occupied Rental Vacant # % % # % # % Low-income Moderate-income 19,610 10, , , Middle-income 106,466 74, , , Upper-income 14,468 10, , Unknown-income Total Assessment Area 140,544 95, , , Total Businesses by Tract Businesses by Tract & Revenue Size Less Than or = $1 Revenue Not Over $1 Million Million Reported # % # % # % # % Low-income Moderate-income 1, , Middle-income 7, , Upper-income 1, , Unknown-income Total Assessment Area 10, , Percentage of Total Businesses:
55 CONCLUSIONS WITH RESPECT TO PERFORMANCE TESTS LENDING TEST The lending test evaluates an institution s lending activities based on the following characteristics. geographic distribution of loans, including loans originated in low- and moderate-income census tracts; borrowers profile, including distribution of loans to low- and moderate-income borrowers and small businesses; overall responsiveness to credit needs of highly economically disadvantaged census tracts, low-income persons, and very small businesses; and community development lending activities. Performance under the lending test is excellent in the North Central PA assessment area. Geographic Distribution of Lending The geographic distribution of loans was analyzed to determine the dispersion of loans among different census tracts within the North Central PA assessment area. The analysis revealed excellent penetration throughout the assessment area, including moderate-income census tracts. Home Mortgage Lending During the period evaluated, Susquehanna originated 1,194 home mortgage loans, in an aggregate amount of $89 million. The percentage of owner-occupied housing units contained within designated census tracts was used as a proxy to estimate demand for residential mortgage lending within such census tracts. A lower level of owner-occupied units limits the bank s lending opportunities in these census tracts. In the North Central PA assessment area, the large majority of owner-occupied housing units (89%) are located in middle- and upper-income census tracts. Only 11% of all owner-occupied units are located in the moderate-income tracts. By comparison, Susquehanna originated 12% of its home mortgage loans in moderate-income census tracts. Susquehanna s home mortgage lending was compared to all lenders operating in the North Central PA assessment area. In 2007, 10% of all home mortgage loans made in the assessment area were made in moderate-income census tracts. Overall, Susquehanna performed better than both aggregate lending levels and the housing proxy of owner-occupied housing units. This reflects excellent geographic penetration despite the limited amount of owner-occupied housing in moderate-income census tracts. 52
56 Small Business Lending The geographic distribution of small business loans was analyzed to measure the dispersion of these loans among different census tracts within the North Central PA assessment area. CRA data show the bank had excellent penetration throughout the assessment area, including the moderate-income census tracts. During the period evaluated, Susquehanna originated 578 small business loans, in an aggregate amount of $79 million. A comparison of the number of small business loans originated in each type of census tract to the number of businesses located in those tracts demonstrates a bank s commitment to making credit available to its entire community. Business demographics revealed a total of 10,496 small businesses in the assessment area. Susquehanna s extension of credit to these businesses shows that moderate-income census tracts received 17% of small business loans, while 12% of businesses are located in these tracts. Middle-income tracts received 65% of small business loans, for their 73% share of businesses. Upper-income tracts received 18% of small business loans for their 15% share of businesses. Susquehanna s small business lending was compared to all lenders operating in the North Central PA assessment area in Ten percent of all small business loans made in the assessment area were made in moderate-income census tracts. Susquehanna performed significantly better than the market in these census tracts, extending 17% of their small business loans in moderate-income census tracts while just 12% of businesses are located in these tracts. Small Farm Lending During the period evaluated, Susquehanna originated 77 small farm loans, in an aggregate amount of $9.5 million. A comparison of the number of farm loans originated in each type of census tract to the number of farms located in those tracts demonstrates a bank s commitment to making credit available to its entire community. Business demographics revealed a total of 601 farms in the assessment area. Susquehanna s extension of credit to these farms shows that moderate-income census tracts received 7% of small farm loans, while less than 1% of farms are located in moderate-income tracts. The large majority of small farm loans (74%) were originated in the middle-income census tracts where 85% of farms are located. Upper-income census tracts received 19% of small farm loans for their 15% share of farms. Aggregate loan data show just 1% of all small farm loans were made in moderate-income census tracts. Overall, Susquehanna had excellent penetration throughout the assessment area, including the moderate-income census tracts. Distribution of Loans By Borrower Income Level and Revenue Size of Business HMDA and small business lending data was analyzed in conjunction with a review of the demographic and economic characteristics of the assessment area to determine the extent of lending to borrowers of different income levels and to businesses of different sizes. 53
57 Lending to Borrowers of Different Income Levels The analysis of Susquehanna s distribution of home mortgage loans to low- and moderateincome borrowers revealed that 9% of the bank s HMDA loans were made to low-income borrowers, while 17% of families are designated as low-income. Twenty-two percent of HMDA loans were to moderate-income borrowers, while 20% of families are designated as moderateincome. Susquehanna s home mortgage lending was compared to all lenders operating in the North Central PA assessment area. The analysis shows that 7% of all home mortgage loans in the assessment area were made to low-income borrowers and 20% were to moderate-income borrowers. Susquehanna performed better than the market with respect to both low-and moderate-income borrowers. The bank s overall distribution of loans reflects excellent penetration among retail customers of different income levels, especially in light of the inherent difficulties in lending to low- and moderate-income borrowers. In particular, about 28% of the assessment area s renters expend more than 30% of gross income for housing, making it difficult for them to accumulate the funds required to purchase a home. The bank s participation in innovative and flexible lending programs that address the specific credit needs of low- and moderate-income borrowers enhanced its home mortgage lending profile. Most notably, the bank offers the Home Start Loan Program, a mortgage product developed to provide low- and moderate-income borrowers with the ability to purchase a home. The products allow for flexible underwriting standards and the use of alternative credit when no credit score exists. During the evaluation period, Susquehanna originated 279 loans under the program, aggregating $29.9 million. In the North Central PA assessment area, the bank originated 45 of these loans, aggregating $2.8 million. Susquehanna is a member of the Federal Home Loan Bank of Pittsburgh (FHLBP) and a participant in its First Front Door Program. This program is designed to provide low- and moderate-income homebuyers with down payment and closing cost assistance. Homebuyers are eligible to receive three dollars for every one dollar paid towards closing costs. Through Susquehanna, 41 homebuyers in its assessment areas received more than $215 thousand in matching funds from this program. Four homebuyers in the North Central PA assessment area received $11,500 in matching funds through this program. The bank also offers the Fannie Mae Flexible 100 Mortgage product for single-family, owneroccupied residences. The primary benefit of this product is the no down payment feature. The Flexible 100 is targeted to first-time homebuyers and primarily serves low- and moderate-income homebuyers. The product enables Susquehanna to originate loans to borrowers who would not qualify for mortgages under the bank s traditional underwriting criteria. During the evaluation period, Susquehanna originated eight mortgages under the program, aggregating $1.2 million. Susquehanna originates loans through lending programs offered by the Pennsylvania Housing Finance Agency (PHFA). Borrowers must be first-time homebuyers, or homebuyers in targeted areas, with incomes less than 100% of the area median and purchasing a home priced below an amount set by PHFA. 54
58 Income guidelines set by the PHFA ensure that loans are originated to primarily low- and moderate-income borrowers. Susquehanna originated 34 loans aggregating $3.3 million under the PHFA program, during the period examined. In the North Central PA assessment area, Susquehanna originated 13 loans, aggregating $660 thousand. Lending to Businesses of Different Sizes Small business lending data were reviewed to determine the extent of lending to businesses of different sizes, especially small businesses. A small business is defined as a business with gross annual revenues of $1 million or less. The bank s distribution of loans reflects good penetration among business customers of different sizes. During the evaluation period, the bank originated 578 small business loans aggregating $79 million. Of these loans, Susquehanna originated 283, or 49%, to small businesses. By comparison, a review of all lenders in the market shows that 40% of all small business loans were to small businesses. According to business data provided by Dun & Bradstreet, approximately 87% of businesses in the North Central PA assessment area are small businesses. Furthermore, of the 578 small business loans originated, 370 loans (64%) were extended in an amount of $100 thousand or less. Since smaller size loans are generally commensurate with the borrowing needs of smaller businesses, Susquehanna s lending activity demonstrates that it is meeting the credit needs of such businesses. Susquehanna s participation in innovative and flexible lending programs, which address the specific credit needs of small businesses, enhanced its small business lending profile. Most notably, Susquehanna participates as a U.S. Small Business Administration (SBA) lender. The bank received SBA s Preferred Lender status and qualified for the SBAExpress lending program developed by the SBA to increase the number of small loans approved by the agency. During the period evaluated, the bank originated 154 SBA loans, aggregating $37.4 million. Lending to Farms of Different Sizes Small farm lending data were reviewed to determine the extent of lending to farms of different sizes, especially small farms. A small farm is defined as a farm with gross annual revenues of $1 million or less. The bank s distribution of loans reflects good penetration among farm customers of different sizes. During the evaluation period, the bank originated 77 small farm loans aggregating $9.5 million. A small farm loan is defines as a loan secured by farmland or other loans to farmers an origination amount of $500, 000 or less. Of these loans, Susquehanna originated 57 loans, or 74%, to small farms. By comparison, a review of all lenders in the market shows that 84% of all small farm loans were to small farms. According to business data provided by Dun & Bradstreet, approximately 97% of farms in the North Central PA assessment area were small farms. Furthermore, of the 77 small farm loans originated by the bank, 42 small farm loans (55%), were extended in an amount of $100 thousand or less. Since smaller size loans are generally commensurate with the borrowing needs of smaller farms, Susquehanna s lending activity demonstrates that it is adequately meeting the credit needs of such farms. 55
59 Community Development Lending Susquehanna made a relatively high level of community development loans in the North Central PA assessment area. During the time period evaluated, the bank originated seven community development loans totaling $835 thousand to finance various community development initiatives. Five loans totaling $455 thousand support the provision of community development services in the assessment area. Two loans aggregating $380 thousand were for the purchase, refinance, or improvement of multi-family dwellings located in moderate-income census tracts in the assessment area. These multi-family dwellings provide affordable rental housing alternatives to low- and moderate-income individuals. Responsiveness to Credit Needs Susquehanna exhibits an excellent record of serving the credit needs of the most economically disadvantaged areas of the North Central PA assessment area, including low-income borrowers and very small businesses, consistent with safe and sound banking practices. The bank achieved this record primarily through its community development lending and the use of innovative and flexible lending practices in order to serve assessment area credit needs. INVESTMENT TEST The investment test evaluates a financial institution s level of qualified investments that serve low- or moderate-income census tracts or individuals, together with the innovativeness and complexity of such investments. Qualified investments made before the bank s last CRA performance evaluation, which are still outstanding, are considered under the test. For purposes of CRA, the term qualified investment includes a lawful investment, deposit, membership share, or grant that has as its primary purpose community development. Performance under the investment test is outstanding in the North Central PA assessment area. Of Susquehanna s total current investments, 4% are attributed to this assessment area. Volume of Investment and Grant Activity A review of investment activity revealed that Susquehanna has an excellent level of qualified community development investments and grants in its North Central PA assessment area. Overall, investments aggregate $3.1 million. The substantial majority of these investments (97%) support affordable housing. The remaining 3% of investments support community development services and economic development. Of the bank s investments, $523 thousand are targeted mortgage-backed securities containing residential mortgage loans originated to low- and moderate-income borrowers, or inside low- and moderate-income census tracts. The North Central PA assessment area also has $2 million in equity investments in affordable rental housing for seniors, and a $302 thousand share in Pennsylvania Housing Finance Agency Single Family Mortgage Revenue Bonds which finance homes for low-and moderate-income families in Pennsylvania. Susquehanna has $270 thousand in securities comprising rental housing for low-and moderate-income seniors. 56
60 In addition, Susquehanna has a $43 thousand share of Pennsylvania s Business In Our Sites Program, investments targeted to the redevelopment of brownfield sites around Pennsylvania. This program is funded by Commonwealth of Pennsylvania Financing Authority Revenue Bonds. In addition to these investments, Susquehanna made grants and contributions to various organizations that routinely provide affordable housing and community development services that benefit low- and moderate-income individuals and areas. During the period evaluated, the bank made $46 thousand in qualified grants and donations that benefit the North Central PA assessment area. Responsiveness to Credit and Community Development Needs Susquehanna exhibits good responsiveness to credit and community economic development needs through the use of investments. A large portion of the bank's investments support affordable housing for seniors in an area with a low per capita income and an aging population. In the North Central PA assessment area, 18% of residents are age 65 or older. SERVICE TEST The service test evaluates the financial services provided by a financial institution using the following characteristics: the accessibility of delivery mechanisms within an assessment area, including the distribution of an institution s branch offices, and alternative delivery mechanisms; the impact of changes in branch locations upon low- and moderate-income census tracts and/or low- and moderate-income persons in the assessment area; the reasonableness of business hours and services in meeting assessment area needs; and, the extent to which an institution provides community development services. Performance under the service test is rated outstanding in the North Central PA assessment area. Accessibility of Delivery Systems Susquehanna s delivery systems are readily accessible to all portions of the North Central PA assessment area. The bank currently operates 19 branches in this PA assessment area: eight are located in Northumberland County, seven in Schuylkill County, three in Snyder County, and one in Union County. Four of the branches are located in moderate-income tracts, representing 21% of bank branches, while 12% of the assessment area population resides in moderate-income tracts. 57
61 The following table details the locations of the bank s branches in the assessment area, compared to the population distribution: Census Tract Number of Branches Percent Total Population Percent Low-income Moderate-Income , Middle-income , Upper-income , TOTALS % 324, % Alternative Retail Banking Services and Alternative Methods of Delivering Retail Banking Services To supplement traditional banking services, Susquehanna offers Internet banking on By accessing Susquehanna s Internet Banker, customers can view account balances, transfer funds between accounts, pay bills, open new accounts, and issue stop payments. In addition, customers can bank by phone through a toll-free automated system which allows customers to access account information, open new accounts, renew CDs, apply for loans, or transfer funds. Changes in Branch Locations To the extent changes have been made, Susquehanna s record of opening and closing branches in the assessment area has not adversely affected the accessibility of its delivery systems in lowand moderate-income census tracts or to low- and moderate-income individuals. During the evaluation period, the bank consolidated one full service branch and closed a limited-service branch as a result of its merger with Community Banks, N.A. Harrisburg. The two branches affected were: The branch at 2894 North Susquehanna Trail, Shamokin Dam, PA, located in an upperincome census tract in Snyder County, was consolidated into the bank s branch located at 48 Orchard Drive, Shamokin Dam, located less than two miles away. The branch at 270 Ridgecrest Circle, Lewisburg, PA, located in a middle-income census tract in Union County, was a limited-service branch in a nursing home. Following closure, customer accounts were transferred to a branch located at 122 JPM Road, about one mile away. Reasonableness of Business Hours and Services in Meeting Assessment Area Needs Services, including business hours, do not vary among branch offices in a way that inconveniences certain portions of the assessment area, particularly low- and moderate-income census tracts or individuals. Banking services are offered in a uniform and consistent manner among all branches. 58
62 Community Development Services Susquehanna is a leader in providing community development services in the North Central PA assessment area. Numerous bank officers and employees serve in various capacities on boards of community development organizations, participate on loan and finance committees, make presentations for small business development, homeownership seminars, and financial literacy programs, and provide credit counseling and technical expertise. These organizations include: Pottsville Area Development Corporation Community Area New Development Organization Schuylkill County Economic Development Corporation Sunbury Housing Authority Greater Susquehanna Valley Chamber of Commerce Banking Products Susquehanna offers the following banking products that provide greater access to banking services for low- and moderate-income customers and small businesses. Susquehanna issued a commercial letter of credit in the North Central PA assessment area. The letter of credit qualifies as a community development service because the letter provides the necessary credit support for community development initiatives inside the assessment area. The letter was issued to a non-profit organization to support affordable housing projects. The Free Checking account is a basic checking account with no minimum balance requirement, no service charges, unlimited check writing, and free Internet banking, including bill payment, and a debit card. The account provides greater access to banking services for low- and moderate-income individuals. The Business Checking Account is designed for small businesses with limited transaction activity. The account has no minimum balance requirements and charges $.30 per item over 150 items per month. This account provides greater access to banking services, including Internet bill payment, for local smaller businesses. Susquehanna has partnered with Central Susquehanna Opportunities, Inc., to offer the Family Savings Account Individual Development Account (IDA). The program funded by the Pennsylvania Department of Economic and Community Development. Clients generally save $10 per week for two years. At the end of that period, account holders use the accumulated savings, plus a 100% match from the state and federal government, for a specific use (homeownership, advanced education, small business funding, or auto purchase.) The participating bank opens FSA accounts, waives standard fees and provides participant account balance reports to account holders and CSO. To qualify for the program, depositors must meet income guidelines that effectively reserve the program for low- and moderate-income clients. Since the inception of the program, the bank has opened 31 FSA accounts in its North Central PA assessment area. 59
63 HARRISBURG-CARLISLE, PA, METROPOLITAN STATISTICAL AREA DESCRIPTION OF ASSESSMENT AREA The Harrisburg assessment area comprises 102 census tracts in Cumberland and Dauphin Counties in central Pennsylvania. Of the 102 census tracts, 5 are designated as low-income and 25 as moderate-income. All 5 low-income census tracts are located in Dauphin County in the city of Harrisburg and 4% of the assessment area s population resides within these low-income tracts. Of the 25 moderate-income census tracts, more than half (16) are in Dauphin County (9 in the city of Harrisburg). Nine moderate-income tracts are in Cumberland County (4 are in Carlisle Borough where both Dickinson College and the U.S. Army War College are located). Eighteen percent of the assessment area s population resides within the moderate-income tracts. Susquehanna s performance in the assessment area was evaluated in terms of the demographic and business context in which it operates. According to the FDIC s Summary of Deposits as of June 30, 2008, 26 depository institutions operate in the Harrisburg assessment area. These 26 institutions maintained a total of 214 branches, holding $8.0 billion in deposits. Based on deposits reported to the FDIC as of June 30, 2008, Susquehanna operates 16 branches in its Harrisburg assessment area and these branches hold $467 million in deposits, or 5% of Susquehanna s total deposits. Susquehanna ranks 7 th in the assessment area, with 6% of the retail deposit market. Commerce Bank, Harrisburg, N.A., the highest ranked local bank, was 3 rd, with 12% of the market. Susquehanna s HMDA loans were compared to the aggregate of all lenders in the Harrisburg assessment area reporting real estate loans pursuant to HMDA. These data are reported annually, and 2007 is the most recent year for which information is available. The assessment area has a total of 372 HMDA reporters. Community Banks, acquired by Susquehanna in November 2007, was the 19 th largest HMDA loan originator in the Harrisburg assessment area with 1% of all such loan originations and purchases. Susquehanna Bank PA ranked 71 st in the assessment area with less than 1% of these loans and affiliate Susquehanna Mortgage Corporation ranked 101 st with less than 1% of loans. Together, these 3 institutions had 1.4% of the market. Commerce Bank, Harrisburg, was the highest ranked local bank at 9 th, with 3% of the market. Among small business lenders operating in the assessment area, Susquehanna ranked 12 th with 2% of the market. Community Banks was ranked 14 th with 1% of the market. Together, these 2 institutions had 3% of the market. Fulton Bank, headquartered in neighboring Lancaster County, was the highest ranked local bank at 9 th, with 3% of the market. American Express Bank, FSB ranked 1 st in small business lending with 20% of the market. The Harrisburg assessment area had a total of 79 small business reporters in ECONOMIC CHARACTERISTICS The Harrisburg-Carlisle MSA includes Dauphin, Cumberland, and Perry Counties in south central Pennsylvania. Susquehanna s assessment area is comprised only of Cumberland and Dauphin Counties. The core of the assessment area is the state capital of Harrisburg in Dauphin County and, as such, the state government is the largest employer. 60
64 Although health services and retail are important employers in the area, the federal, state, and local governments combined provide employment for a disproportionate share of the labor force. State government has served to stabilize the area s economy in the past, but the economy has suffered with the decline in state revenues and the current hiring freeze. Payrolls are shrinking in other sectors as well, especially construction and manufacturing, and the steady pace of hiring in the education and healthcare sector has not been picked up the slack. Although the housing market in the MSA has slowed along with the economy, prices remained stable. Those prices never reached the heights experienced in some regions and the pace of foreclosures in the MSA is modest, showing the relative stability of the housing market. Economic strengths of the area include its central location with a strong transportation and distribution hub, the presence of the state government, and a below average share of employment in housing-related industries. Weaknesses include a shrinking industrial base and rising business costs. The banking environment in which Susquehanna operates is highly competitive. Large superregional banks compete with numerous community banks, savings and loan associations, and credit unions. Major banking competitors in the area include M&T Bank, PNC Bank, Sovereign Bank, and Citizens Bank of Pennsylvania. Local competitors include Commerce Bank Harrisburg, Fulton Bank, and Integrity Bank. The area s five largest private sector employers are The Hershey Company, Penn State Hershey Medical Center, Hershey Entertainment and Resorts, Wal-Mart, and Highmark, Inc. Of note, four of the top ten employers in the MSA are health-care related. Between 2007 and 2008, area unemployment rates have increased. The unemployment rates for this assessment area are presented in the following table: Locations November 2008 November 2007 Dauphin County 5.3% 3.7% Cumberland County 4.7% 3.1% Harrisburg-Carlisle MSA 5.1% 3.4% Pennsylvania 6.2% 4.4% United States 6.8% 4.7% Information was obtained from interviews and contacts with bankers, community organizations, and local government officials regarding the credit needs in their communities. Community leaders indicated that their credit needs include first-time homebuyer programs, including down payment and closing cost assistance for low- and moderate-income homebuyers, and flexible small business loan programs, particularly for Carlisle Borough and the city of Harrisburg. 61
65 HOUSING The Harrisburg assessment area contains 198,084 housing units. Single-family units comprise 72% of the housing units, while two-to-four family units comprise 9%, multi-family units 14%, and mobile homes 5%. The median age of the housing stock is 36 years, lower than the median age for housing in the state at 43 years. Median rent in the assessment area is $565, with 31% of renters paying more than 30% of their income for housing. Statewide median rent is $531, with 35% of renters paying more than 30% of their income for housing. According to the 2000 census, the median housing value in the Harrisburg assessment area is $107,386. A significant disparity exists between the median housing values in the upper-income ($143,016) and middle-income census tracts ($105,691) and the values in moderate-income ($69,765) and low-income ($45,575) tracts. Of the total owner-occupied housing units in the assessment area, 45% are valued at less than $100 thousand. In the state, 54% of housing units are valued at less than $100 thousand. Although the cost of housing in Harrisburg remains relatively low when compared to other eastern metropolitan areas, the cost has increased. According to Moody s Economy.com, in 2008 the average home in the assessment area increased 1%, to $152,500, compared to $150,600 in The overall homeownership rate is 65% in both the assessment area and statewide. The percentage of owner-occupied housing units contained within designated census tracts is used as a proxy to estimate demand for residential mortgage lending within such census tracts. In the Harrisburg assessment area, 2% of owner-occupied units are located in the low-income tracts and 14% are in the moderate-income tracts. The large majority of owner-occupied housing units are located in middle-income (59%) and upper-income (25%) census tracts. BORROWER INCOME DATA For purposes of evaluating the distribution of loans to borrowers of different income levels, incomes were classified based upon annually adjusted median family income data made available by HUD. According to 2000 Census data, the median family income for the Harrisburg assessment area was $53,437, higher than the state median income level of $49,184. Median family income is higher in Cumberland County ($56,406) than Dauphin County ($50,974). In 2008, the adjusted median family income for the Harrisburg assessment area, as reported by HUD, increased to $67,500. From an income distribution standpoint, 17% of the families in the assessment area are designated as low-income and 19% are moderate-income. Families living below the poverty level represent 6% of total families in the assessment area, compared to 8% in Pennsylvania as a whole. DEMOGRAPHIC BUSINESS DATA The percentage of businesses located within designated census tracts is used as a proxy to estimate demand for small business credit within such tracts. In the Harrisburg assessment area, 2% of businesses are located in low-income census tracts and 16% are located in moderateincome tracts. The substantial majority of businesses are located in middle-income (62%) and upper-income (20%) tracts. 62
66 The demographics used to assess the performance context in which Susquehanna operates are detailed in the following table. Income Categories Tract Distribution Susquehanna Bank Assessment Area Demographics Harrisburg, PA, (Cumberland and Dauphin Counties) Families by Tract Income Families < Poverty Level as % of Families by Tract Families by Family Income # % # % # % # % Low-income , , , Moderate-income , , , Middle-income , , , Upper-income , , Unknown-income Total Assessment Area , , , Housing Housing Types by Tract Units by Tract Owner-occupied Rental Vacant # % % # % # % Low-income 7,671 2, , , Moderate-income 37,591 17, , , Middle-income 111,031 75, , , Upper-income 41,791 32, , , Unknown-income Total Assessment Area 198, , , , Businesses by Tract & Revenue Size Total Businesses by Less Than or = $1 Revenue Not Tract Over $1 Million Million Reported # % # % # % # % Low-income Moderate-income 2, , Middle-income 11, , , Upper-income 3, , Unknown-income Total Assessment Area 17, , , Percentage of Total Businesses: CONCLUSIONS WITH RESPECT TO PERFORMANCE TESTS LENDING TEST The lending test evaluates an institution s lending activities based on the following characteristics. geographic distribution of loans, including loans originated in low- and moderate-income census tracts; borrowers profile, including distribution of loans to low- and moderate-income borrowers and small businesses; overall responsiveness to credit needs of highly economically disadvantaged census tracts, low-income persons, and very small businesses; and community development lending activities. Performance under the lending test is satisfactory in the Harrisburg assessment area. 63
67 Geographic Distribution of Loans The geographic distribution of loans in the Harrisburg assessment area was analyzed to determine the dispersion of loans among different census tracts within the assessment area. The analysis reflected good penetration, including low- and moderate-income census tracts. Home Mortgage Lending During the period evaluated, Susquehanna originated 618 HMDA loans in the assessment area, in an aggregate amount of $85.6 million. The percentage of owner-occupied housing units contained within designated census tracts is used as a proxy to estimate demand for residential mortgage lending within such census tracts. A lower level of owner-occupied units limits the bank s lending opportunities in these tracts. A review of Susquehanna s home mortgage lending activity reflects excellent penetration throughout the assessment area. In the Harrisburg assessment area, 2% of all owner-occupied housing units are located in lowincome census tracts and 14% are located in moderate-income tracts. By comparison, 1% of Susquehanna s home mortgage loans were originated in low-income tracts and 18% were originated in moderate-income tracts. Susquehanna s home mortgage lending was compared to all lenders operating in the assessment area. According to 2007 aggregate HMDA data, 2% of all home mortgage loans were made in low-income census tracts and 15% were in moderateincome tracts. Overall, Susquehanna s performance was consistent with the market in low-income areas, although there were limited lending opportunities for any banks operating in these tracts. In moderate-income areas, Susquehanna performed better than the market. Small Business Lending An analysis of the geographic distribution of small business loans was conducted in an effort to determine the dispersion of these loans among different census tracts within the bank's assessment area. The analysis reflects adequate penetration given the economic characteristics of the Harrisburg assessment area. During the period evaluated, Susquehanna originated 994 small business loans in the assessment area, in an aggregate amount of $116 million. A comparison of the number of small business loans originated in each type of census tract to the number of businesses located in such tracts demonstrates the bank s commitment to making credit available to its entire community. Business demographics revealed a total of 17,854 businesses within the assessment area. Susquehanna s extension of credit to these businesses shows that the bank did not originate any small business loans in low-income census tracts; however just 2% of businesses are located in these tracts. Moderate-income tracts received 4% of small business loans, while 16% of businesses are located in these tracts. Middle-income tracts received 38% of small business loans, while 62% of businesses are located in these census tracts. Upper-income census tracts received a disproportionate share of lending with 58% of small business loans for their 20% share of businesses. 64
68 Susquehanna s small business lending was compared to all lenders operating in the assessment area. Aggregate loan data show that 2% of all reported small business loans were made in lowincome census tracts, although there were limited lending opportunities for any banks doing business in these tracts. Twelve percent of small business loans were made in moderate-income tracts. Susquehanna did not perform as well as the market in moderate-income census tracts; however, the overall distribution of loans in moderate-income tracts shows that lending levels do not correspond to the percentage of businesses in these tracts for Susquehanna or the aggregate. Distribution of Loans by Borrower Income Level and Revenue Size of the Business Home mortgage and small business lending data were analyzed, in conjunction with a review of the demographic and economic characteristics of the assessment area, to determine the extent of lending to borrowers of different income levels and to businesses of different sizes. Lending to Borrowers of Different Income Levels An analysis of the distribution of home mortgage loans among retail customers of different income levels, including low- and moderate-income customers, reflects excellent penetration in the Harrisburg assessment area. The demographics of the assessment area show that of the 122,754 families in the assessment area, 17% are designated as low-income and 19% are moderate-income. By comparison, the distribution of Susquehanna s home mortgage loans to these borrowers shows that 12% of loans were to low-income borrowers and 26% were to moderate-income borrowers. Susquehanna s home mortgage lending was compared to all lenders operating in the Harrisburg assessment area. An analysis of aggregate data show that 8% of all home mortgage loans made in the assessment area were to low-income borrowers and 22% were to moderate-income borrowers. Overall, Susquehanna performed better than the market with both low- and moderate-income borrowers. The distribution of loans to low-income families in comparison to the demographics of the assessment area shows that lending levels do not correspond to the percentage of low-income families in the assessment area. However, the bank s level of penetration is considered excellent given that the credit needs of the low-income segment of the population can be difficult to address through conventional loan products, presenting a significant obstacle to home ownership. In particular, 31% of renters in the assessment area pay more than 30% of their income for housing, making it difficult to save for a down payment on a house. Obstacles to home ownership also exist for moderate-income families; however, Susquehanna s distribution of loans to moderate-income borrowers in the assessment area is excellent. The bank s participation in innovative and flexible lending programs that address the specific credit needs of low- and moderate-income borrowers enhanced its home mortgage lending profile. Most notably, the bank offers the Home Start Loan Program, a mortgage product developed to provide low- and moderate-income borrowers with the ability to purchase a home. The products allow for flexible underwriting standards and the use of alternative credit when no credit score exists. During the evaluation period, Susquehanna originated 279 loans under the program, aggregating $29.9 million. In the Harrisburg assessment area, the bank originated 17 of these loans, aggregating $1.8 million. 65
69 Susquehanna is a member of the Federal Home Loan Bank of Pittsburgh (FHLBP) and a participant in its First Front Door Program. This program is designed to provide low- and moderate-income homebuyers with down payment and closing cost assistance. Homebuyers are eligible to receive three dollars for every one dollar paid towards closing costs. Through Susquehanna, 41 homebuyers in its assessment areas received more than $215 thousand in matching funds from this program. In the Harrisburg assessment area two homebuyers received $10 thousand in matching funds through this program. The bank also offers the Fannie Mae Flexible 100 Mortgage product for single-family, owneroccupied residences. The primary benefit of this product is the no down payment feature. The Flexible 100 is targeted to first time home buyers and primarily serves low- and moderateincome homebuyers. The product enables Susquehanna to originate loans to borrowers who would not qualify for mortgages under the bank s traditional underwriting criteria. During the evaluation period, Susquehanna originated eight mortgages under the program, aggregating $1.2 million. Susquehanna originates loans through lending programs offered by the Pennsylvania Housing Finance Agency (PHFA). Borrowers must be first-time homebuyers, or homebuyers in targeted areas, with incomes less than 100% of the area median and purchasing a home priced below an amount set by PHFA. Income guidelines set by the PHFA ensure that loans are originated to primarily low- and moderate-income borrowers. Susquehanna originated 34 loans aggregating $3.3 million under the PHFA program, during the period examined. In the Harrisburg assessment area, Susquehanna originated seven loans, aggregating $687 thousand. Lending to Businesses of Different Sizes Small business lending data were analyzed to determine the extent of lending to businesses of different sizes, including small businesses. Susquehanna s distribution of loans reflects adequate penetration among business customers of different sizes. A small business is defined as a business with gross annual revenues of $1 million or less. Using this definition, bank lending was analyzed to determine whether loans were made to small businesses. Of the 994 loans the bank originated during the evaluation period, 199, or 20%, were originated to small businesses. By comparison, a review of all lenders in the market shows that 38% of all small business loans were made to small businesses. Of the 994 small business loans originated by the bank, 66% were extended in an amount of $100 thousand or less. The number of small business loans originated in amounts of $100 thousand or less is significant because smaller size loans are generally commensurate with the borrowing needs of smaller businesses. As such, Susquehanna s lending activity demonstrates it is adequately meeting the credit needs of smaller businesses. By comparison, a review of all lenders in the market shows that 93% of all small business loans were extended in an amount of $100 thousand or less. 66
70 Susquehanna s participation in innovative and flexible lending programs, which address the specific credit needs of small businesses, enhanced its small business lending profile. Most notably, Susquehanna participates as a U.S. Small Business Administration (SBA) lender. The bank received SBA s Preferred Lender status and qualified for the SBAExpress lending program developed by the SBA to increase the number of small loans approved by the agency. During the period evaluated, the bank originated 154 SBA loans, aggregating $37.4 million. Community Development Lending Susquehanna made a relatively high level of community development loans in the Harrisburg assessment area. During the time period evaluated, the bank originated three community development loans totaling $2.7 million to finance community development initiatives. One loan totaling $600 thousand supports a major economic development project in the city of Harrisburg. Two loans aggregating $2.1 million support affordable housing in Carlisle Borough. The project meets an expressed demand for affordable housing for low- and moderate-income seniors. In Carlisle, 18% of residents are age 65 and over. In addition, four of its five census tracts are designated as moderate-income. Responsiveness to Credit Needs Susquehanna exhibits a good record of serving the credit needs of the most economically disadvantaged areas of this assessment area, including low-income borrowers and very small businesses, consistent with safe and sound banking practices. The bank achieved this record primarily through its community development lending and the use of innovative and flexible lending practices in order to serve assessment area credit needs. INVESTMENT TEST The investment test evaluates a financial institution s level of qualified investments that serve low- or moderate-income census tracts or individuals, together with the innovativeness and complexity of such investments. Qualified investments made prior to the previous evaluation that are still outstanding are considered under the test. For purposes of CRA, the term qualified investment includes a lawful investment, deposit, membership share, or grant that has as its primary purpose community development. Performance under the investment test is satisfactory in the Harrisburg assessment area. Of Susquehanna s total current investments, 2% are attributed to this assessment area. Volume of Investment and Grant Activity A review of investment activity revealed that Susquehanna has an adequate level of qualified community development investments and grants in the Harrisburg assessment area. Overall, investments aggregate $1.3 million. The substantial majority of these investments (91%) support affordable housing. The remaining 9% of investments support community development services and economic development. 67
71 Of the bank s investments, $907 thousand are targeted mortgage-backed securities containing residential mortgage loans originated to low- and moderate-income borrowers, or inside low- and moderate-income census tracts. This assessment area also has a $242 thousand share in Pennsylvania Housing Finance Agency Single Family Mortgage Revenue Bonds financing homes for low-and moderate-income families in Pennsylvania. In addition, the Harrisburg assessment area has a $34 thousand share in the Business In Our Sites Program investments targeted to the redevelopment of brownfield sites around Pennsylvania. The program is funded by Commonwealth of Pennsylvania Financing Authority Revenue Bonds. In addition to qualified investments, Susquehanna made grants and contributions to various organizations that routinely provide affordable housing and community development services that benefit low- and moderate-income individuals and areas. During the period evaluated, the bank made $108 thousand in qualified grants and donations that benefit the Harrisburg assessment area. Responsiveness to Credit and Community Development Needs Susquehanna exhibits responsiveness to credit and community economic development needs through the use of investments. A large portion of the bank's investments support affordable housing in an area with a large number of low- and moderate-income families and elderly residents. In the Harrisburg assessment area, 36% of families are designated as low- or moderate-income, and 15% of the population is age 65 or older. SERVICE TEST The service test evaluates the financial services provided by a financial institution using the following characteristics. the accessibility of delivery mechanisms within an assessment area, including the distribution of an institution s branch offices and alternative delivery mechanisms; the impact of changes in branch locations upon low- and moderate-income census tracts or low- and moderate-income persons in the assessment area; the reasonableness of business hours and services in meeting assessment area needs; and the extent to which an institution provides community development services. The bank s performance under the service test is rated satisfactory in the Harrisburg assessment area. Accessibility of Delivery Systems The bank s delivery systems are reasonably accessible to essentially all portions of its assessment area. Susquehanna currently operates 16 branches in its Harrisburg assessment area. No branches are located in low-income census tracts and one branch is located in a moderateincome tract, representing six percent of bank branches, while 22% of the assessment area population resides in low- or moderate-income census tracts. 68
72 The following table details the locations of the bank s branches in the Harrisburg assessment area, compared to the population. Census Tract Number of Branches Percent Total Population Percent Low-income ,752 4 Moderate-income , Middle-income , Upper-income , TOTALS % 465, % Alternative Retail Banking Services and Alternative Methods of Delivering Retail Banking Services To supplement traditional banking services, Susquehanna offers Internet banking on By accessing Susquehanna s Internet Banker, customers can view account balances, transfer funds between accounts, pay bills, open new accounts and issue stop payments. In addition, customers can bank by phone through a toll-free automated system which allows customers to access account information, open new accounts, renew CDs, apply for loans, or transfer funds. Changes in Branch Locations Susquehanna s record of opening and closing branches in the Harrisburg assessment area has not adversely affected the accessibility of its delivery systems in low- and moderate-income census tracts, or to low- and moderate-income individuals. Susquehanna s 16 Harrisburg branches were acquired as a result of its November 2007 merger with Community Banks N.A., Harrisburg, PA. Prior to this merger, Susquehanna did not have a branch presence in the Harrisburg market. Following the merger, the bank relocated two assessment area branches. The Halifax branch was moved from 3663 Peters Mountain Road, to 3679 Peters Mountain Road, in the same census tract in Halifax, PA. The Derry Street branch was moved from 6700 Derry Street, to 8170 Derry Street in the same census tract in Harrisburg, PA. All locations were in middle-income census tracts. Reasonableness of Business Hours and Services in Meeting Assessment Area Needs Services, including business hours, do not vary among branches in a way that inconveniences portions of the assessment area, particularly low- and moderate-income census tracts or individuals. Susquehanna offers banking services in a uniform and consistent manner among all its branches. Community Development Services Susquehanna provides a relatively high level of community development services that are tailored to the convenience and needs of the assessment area. The most notable services include the following: 69
73 A bank officer serves on the Board of the Tri-County Housing Development Corporation, a nonprofit community/development organization that creates affordable housing in Central Pennsylvania. Tri-County serves the entire Harrisburg MSA. A bank employee serves as board member of the Cumberland County Affordable Housing Trust Fund, an organization focused on making housing more affordable for low- and moderate-income Cumberland County residents. The Fund offers grant assistance for firsttime homebuyers. A bank employee serves as the treasurer and board member of the Cumberland/Perry Housing Initiative, a non-profit community development organization whose mission is to foster affordable housing through construction or rehabilitation. A bank officer serves as a board member and secretary of the Housing Development Corporation, a nonprofit community/development organization whose mission is the development and management of affordable rental housing for residents in Dauphin, Berks, Chester, Lancaster, Lebanon and York Counties. Banking Products Susquehanna offers banking products that provide greater access to banking services for lowand moderate-income customers and small businesses. The bank offers Free Checking, a basic checking account with no minimum balance requirement, no service charges, unlimited check writing, and free Internet banking, including bill payment and a debit card. The account provides greater access to banking services for low- and moderate-income individuals. Business Checking is an account designed for small businesses with limited transaction activity. The account has no minimum balance requirement and the first 150 items per month are free. This account provides greater access to banking services, including Internet bill payment, for local smaller businesses. Susquehanna issues commercial letters of credit to borrowers in its assessment areas. Letters of credit can qualify as a community development service when these letters provide necessary credit support for community development initiatives. The letter issued by Susquehanna in its Harrisburg assessment area was to a commercial developer to support an affordable housing project. 70
74 YORK-HANOVER-GETTYSBURG CONSOLIDATED STATISTICAL AREA DESCRIPTION OF ASSESSMENT AREA The York-Hanover-Gettysburg consolidated statistical area (York CSA) comprises 105 census tracts in York and Adams Counties in southern Pennsylvania. Of the 105 census tracts, six are designated as low-income and 11 are moderate-income. All six low-income census tracts are located in the city of York and 3% of the assessment area s population resides within these lowincome tracts. Of the 11 moderate-income census tracts, 9 are in the city of York and 2 are in Hanover Borough. Seven percent of the assessment area s population resides within the moderate-income tracts. Susquehanna s performance in the assessment area was evaluated in terms of the demographic and business context in which it operates. According to the FDIC s Summary of Deposits as of June 30, 2008, 20 depository institutions operate in the York CSA. These 20 institutions maintain a total of 156 branches, holding $7.0 billion in deposits. Susquehanna operated 29 of these branches, with $951 million in deposits. The bank ranks 2 nd in the York CSA, controlling 14% of the retail deposit market. M&T Bank headquartered in Buffalo, NY, ranked 1 st with 19% of the market. Of Susquehanna s total deposits, 9% come from the York CSA. Susquehanna s HMDA loans were compared to the aggregate of all lenders in the York CSA reporting real estate loans pursuant to HMDA. The assessment area has a total of 451 HMDA reporters. Community Banks, acquired by Susquehanna in November 2007, was the 14 th largest HMDA loan originator in the York CSA with 2% of all such loan originations and purchases. Susquehanna Bank PA ranked 51 st with less than 1% of these loans. Fulton Bank, headquartered in neighboring Lancaster County, was the highest ranked local bank at 7 th, with 3% of the market. Among small business lenders operating in the York CSA, Susquehanna ranked 17 th with 1% of the market. Community Banks ranked 14 th, also with 1% of the market. Fulton Bank ranked highest among local banks at 9 th, holding 3% of the market. The York CSA had a total of 69 small business reporters in ECONOMIC CHARACTERISTICS The York labor market has deteriorated in recent months. Manufacturing in particular has buckled under the pressure of the slower domestic and global demand, although York s higher than average export dependency has lent support. In addition, government and the education/healthcare industry also provided some support, but have not completely offset the decline in manufacturing and tourism-related industries. The manufacturing sector accounts for 20% of total area employment and government accounts for 11% of employment. Although York s housing market has contracted, the area s high housing affordability has helped maintain housing market stability. According to CreditForecast.com, mortgage delinquencies in the CSA are in line with the nation, but noticeably higher than the state. 71
75 Continuing strengths of the York CSA include competitive business costs for a northeast metropolitan area, strong transportation linkages, regionally strong migration trends, and a diverse manufacturing base. Weaknesses show a sizeable component of manufacturing is exposed to weakened consumer demand, a low-skilled labor force, and a decelerating population growth. The largest employers in York County are Wellspan Health, the Defense Distribution Center, Harley Davidson (manufacturing), and York International Corporation (manufacturing). In Adams County, the largest employers are Knouse Foods Cooperative, Gettysburg College, and the Gettysburg Hospital. Susquehanna s major banking competitors in the assessment area include Sovereign Bank, Peoples Bank Codorus Valley, and Fulton Bank. Like the Pennsylvania and national unemployment rates, the York CSA unemployment rates are increasing, as presented in the following table: Locations November 2008 November 2007 York County 5.4% 3.5% Adams County 5.0% 3.0% York-Hanover-Gettysburg CSA 5.4% 3.5% Pennsylvania 6.2% 4.4% National 6.8% 4.2% Information was obtained from interviews and contacts with bankers, community organizations, and local government officials. These community leaders indicated that the credit needs in their community include first-time homebuyer programs (offered in English and Spanish), down payment and closing cost assistance for low- and moderate-income homebuyers, and flexible small business loan programs, particularly for the city of York. HOUSING The York CSA contains 192,551 housing units. Single-family units comprise 78% of the housing units, while two-to-four family units comprise 9%, multi-family units 7%, and mobile homes 7%. The median age of the housing stock is 34 years, lower than the median age for housing stock in the state at 43 years. Median rent in the assessment area is $527, with 29% of renters paying more than 30% of their income for housing. Statewide median rent is $531, with 35% of renters paying more than 30% of their income for housing. According to the 2000 census, the median housing value in the York CSA is $108,453. A significant disparity exists between the median housing values in the upper-income ($129,560) and middle-income census tracts ($108,212) and corresponding values in moderate-income ($64,381) and low-income ($43,323) tracts. Of the total owner-occupied housing units in the assessment area, 43% are valued at less than $100 thousand. In the state, 54% of housing units are valued at less than $100 thousand. 72
76 The cost of housing in the York CSA remains low when compared to other northeastern metropolitan areas and continues to draw migrants from higher-cost neighboring areas like Harrisburg and Baltimore. Moody s Economy.com estimates that the average existing home price in the York CSA was $167,100 in 2008, down from $169,300 in 2007 (-1.3%). The overall homeownership rate in the assessment area is 72%, compared to 65% statewide. The percentage of owner-occupied housing units contained within designated census tracts is used as a proxy to estimate demand for residential mortgage lending within such census tracts. In the York CSA, 1% of owner-occupied units are located in the low-income census tracts and 5% are in the moderate-income tracts. The large majority of owner-occupied housing units are located in middle-income (78%) and upper-income (16%) census tracts. BORROWER INCOME DATA For purposes of evaluating the distribution of loans to borrowers of different income levels, incomes were classified based upon annually adjusted median family income data made available from HUD. According to 2000 Census data, the median family income for the York CSA was $51,626, slightly higher than the state median income level of $49,184. From an income distribution standpoint, 15% of the families in the assessment area are designated as lowincome and 19% are moderate-income. In 2008, the adjusted median family income for the York CSA, as reported by HUD, increased to $65,100. DEMOGRAPHIC BUSINESS DATA The percentage of businesses located within designated census tracts is used as a proxy to estimate demand for small business credit within such census tracts. In the York CSA, 5% of the assessment area s businesses are located in low-income census tracts and 7% are in moderateincome tracts. The substantial majority of businesses are located in middle- (73%) and upperincome (15%) tracts. The demographics used to assess the performance context in which Susquehanna operates are detailed in the table on the following page. 73
77 Income Categories Tract Distribution Susquehanna Bank Assessment Area Demographics York-Hanover-Gettysburg CSA (York and Adams Counties) Families by Tract Income Families < Poverty Level as % of Families by Tract Families by Family Income # % # % # % # % Low-income , , Moderate-income , , Middle-income , , , Upper-income , , Unknown-income Total Assessment Area , , , Housing Housing Types by Tract Units by Tract Owner-occupied Rental Vacant # % % # % # % Low-income 6,572 1, , , Moderate-income 14,152 6, , , Middle-income 145, , , , Upper-income 26,684 22, , , Unknown-income Total Assessment Area 192, , , , Businesses by Tract & Revenue Size Total Businesses by Less Than or = $1 Revenue Not Tract Over $1 Million Million Reported # % # % # % # % Low-income Moderate-income 1, Middle-income 11, , , Upper-income 2, , Unknown-income Total Assessment Area 16, , , Percentage of Total Businesses: CONCLUSIONS WITH RESPECT TO PERFORMANCE TESTS LENDING TEST The lending test evaluates an institution s lending activities based on the following characteristics. geographic distribution of loans, including loans originated in low- and moderate-income census tracts; borrowers profile, including distribution of loans to low- and moderate-income borrowers and small businesses; overall responsiveness to credit needs of highly economically disadvantaged census tracts, low-income persons, and very small businesses; and community development lending activities. Performance under the lending test is satisfactory in the York CSA assessment area. Geographic Distribution of Loans The geographic distribution of loans in the York CSA assessment area was analyzed to determine the dispersion of loans among different census tracts within the assessment area. The analysis reflected good penetration, including low- and moderate-income census tracts. 74
78 Home Mortgage Lending During the period evaluated, Susquehanna made 1,287 home mortgage loans in the assessment area, in an aggregate amount of $121 million. The percentage of owner-occupied housing units contained within designated census tracts is used as a proxy to estimate demand for residential mortgage lending within such census tracts. A lower level of owner-occupied units limits the bank s lending opportunities in these tracts. A review of Susquehanna s mortgage lending activity reflects good penetration throughout the assessment area. In the York CSA, 1% of all owner-occupied housing units are located in low-income census tracts and 5% are located in moderate-income tracts. By comparison, 2% of Susquehanna s home mortgage loans were originated in low-income tracts and 4% were in moderate-income tracts. Susquehanna s home mortgage lending was compared to all lenders operating in the assessment area. According to 2007 aggregate HMDA data, 2% of all home mortgage loans were made in low-income census tracts and 4% were in moderate-income tracts. Overall, Susquehanna performed about the same as the market in both low- and moderateincome areas, although the lending opportunities were modest for any banks operating here due to the limited amount of owner-occupied housing available. Small Business Lending An analysis of the geographic distribution of small business loans was conducted in an effort to determine the dispersion of these loans among different census tracts within the bank's assessment area. The analysis reflects good penetration given the economic characteristics of the York CSA. During the period evaluated, Susquehanna made 737 small business loans in the assessment area, in an aggregate amount of $119 million. A comparison of the number of small business loans originated in each type of census tract to the number of businesses located in such tracts demonstrates the bank s commitment to making credit available to its entire community. Business demographics revealed a total of 16,292 businesses within the assessment area. Susquehanna s extension of credit to these businesses shows that the bank made 4% of its small business loans in low-income census tracts, while 5% of businesses are located in these tracts. Moderate-income tracts received 7% of small business loans, while 7% of businesses are located in these tracts. Middle-income tracts received 73% of small business loans, while 73% of businesses are located in these tracts. Upper-income census tracts received 16% of small business loans for their 15% share of businesses. Susquehanna s small business lending was compared to all lenders operating in the assessment area. Aggregate loan data show that 7% of all reported small business loans were made in lowincome census tracts and 6% were made in moderate-income tracts. Overall, Susquehanna performed better than the market in both low- and moderate-income census tracts. 75
79 Distribution of Loans by Borrower Income Level and Revenue Size of the Business Home mortgage and small business lending data were analyzed, in conjunction with a review of the demographic and economic characteristics of the assessment area, to determine the extent of lending to borrowers of different income levels and to businesses of different sizes. Lending to Borrowers of Different Income Levels An analysis of the distribution of home mortgage loans among retail customers of different income levels, including low- and moderate-income customers, reflects excellent penetration in the York CSA. The demographics of the assessment area show that of the 130,698 families in the assessment area, 15% are designated as low-income and 19% are moderate-income. By comparison, the distribution of Susquehanna s home mortgage loans to these borrowers shows that 9% of loans were to low-income borrowers and 19% were to moderate-income borrowers. Susquehanna s home mortgage lending was compared to all lenders operating in the York CSA. An analysis of aggregate data show that 5% of all home mortgage loans made in the assessment area were to low-income borrowers and 17% were to moderate-income borrowers. Overall, Susquehanna performed better than the market with both low- and moderate-income borrowers. The distribution of loans to low-income families in comparison to the demographics of the assessment area shows that lending levels do not correspond to the percentage of low-income families in the assessment area. However, the bank s level of penetration is considered good given the credit needs of the low-income segment of the population can be difficult to address through conventional loan products, presenting a significant obstacle to home ownership. In particular, 29% of renters in the assessment area pay more than 30% of their income for housing, making it difficult to save for a down payment on a home. Obstacles to home ownership also exist for moderate-income families; however, Susquehanna s distribution of loans to moderateincome borrowers in the assessment area is excellent. The bank s participation in innovative and flexible lending programs that address the specific credit needs of low- and moderate-income borrowers enhanced its home mortgage lending profile. Most notably, the bank offers the Home Start Loan Program, a mortgage product developed to provide low- and moderate-income borrowers with the ability to purchase a home. The products allow for flexible underwriting standards and the use of alternative credit when no credit score exists. During the evaluation period, Susquehanna originated 279 loans under the program, aggregating $29.9 million. In the York CSA, the bank originated 42 of these loans, aggregating $4.8 million. Susquehanna is a member of the Federal Home Loan Bank of Pittsburgh (FHLBP) and a participant in its First Front Door Program. This Program is designed to provide low- and moderate-income homebuyers with down payment and closing cost assistance. Homebuyers are eligible to receive three dollars for every one dollar paid towards closing costs. Through Susquehanna, 41 homebuyers in its assessment areas received more than $215 thousand in matching funds from this program. Four homebuyers in the York CSA received $20 thousand in matching funds through this program. 76
80 The bank also offers the Fannie Mae Flexible 100 Mortgage product for single-family, owneroccupied residences. The primary benefit of this product is the no down payment feature. The Flexible 100 is targeted to first-time home buyers and primarily serves low- and moderateincome homebuyers. The product enables Susquehanna to originate loans to borrowers who would not qualify for mortgages under the bank s traditional underwriting criteria. During the evaluation period, Susquehanna originated eight mortgages under the program, aggregating $1.2 million. Susquehanna originates loans through lending programs offered by the Pennsylvania Housing Finance Agency (PHFA). Borrowers must be first-time homebuyers, or homebuyers in targeted areas, with incomes less than 100% of the area median and purchasing a home priced below an amount set by PHFA. Income guidelines set by the PHFA ensure that loans are originated to primarily low- and moderate-income borrowers. Susquehanna originated 34 loans aggregating $3.3 million under the PHFA program, during the period examined. In the York CSA, Susquehanna originated nine loans, aggregating $1.5 million, under the PHFA program. Susquehanna participates in the USDA Rural Development Agency guaranteed loan program. The loans are primarily used to help low- and moderate-income individuals or households purchase homes in rural areas. Susquehanna originated four loans, aggregating $531,035, through this program. In the York assessment area, Susquehanna originated one loan in Adams County, totaling $183,569. Lending to Businesses of Different Sizes Small business lending data were analyzed to determine the extent of lending to businesses of different sizes, including small businesses. Susquehanna s distribution of loans reflects good penetration among business customers of different sizes. A small business is defined as a business with gross annual revenues of $1 million or less. Using this definition, bank lending was analyzed to determine whether loans were made to small businesses. Of the 737 loans the bank originated during the evaluation period, 366, or 50%, were originated to small businesses. By comparison, a review of all lenders in the market shows that 40% of all small business loans were made to small businesses. In addition, of the 737 small business loans originated by the bank, 59% were extended in an amount of $100 thousand or less. The number of small business loans originated in amounts of $100 thousand or less is significant because smaller size loans are generally commensurate with the borrowing needs of smaller businesses and, as such, Susquehanna s lending activity demonstrates it is meeting the credit needs of smaller businesses. A review of all lenders in the market shows that 56% of all small business loans were extended in an amount of $100 thousand or less. 7 7 Susquehanna also originated 31 small farm loans, aggregating $4.7 million. Sixty one percent of these loans were made to small farms and 42% were in an amount of $100 thousand or less. 77
81 Susquehanna s participation in innovative and flexible lending programs, which address the specific credit needs of small businesses, enhanced its small business lending profile. Most notably, Susquehanna participates as a U.S. Small Business Administration (SBA) lender. The bank received SBA s Preferred Lender status and qualified for the SBAExpress lending program developed by the SBA to increase the number of small loans approved by the agency. During the period evaluated, the bank originated 154 SBA loans, aggregating $37.4 million. Community Development Lending Susquehanna made an adequate level of community development loans in the York assessment area. During the time period evaluated, the bank originated three community development loans totaling $265,000. All three loans support the provision of community development services in the assessment area. Responsiveness to Credit Needs Susquehanna exhibits a good record of serving the credit needs of the most economically disadvantaged areas of this assessment area, including low-income borrowers and very small businesses, consistent with safe and sound banking practices. The bank achieved this record primarily through the use of innovative and flexible lending practices in order to serve assessment area credit needs. INVESTMENT TEST The investment test evaluates a financial institution s level of qualified investments that serve low- or moderate-income census tracts or individuals. The test also considers the innovativeness and complexity of these investments. Qualified investments made prior to the previous evaluation, which are still outstanding, are considered under the test. For purposes of CRA, the term qualified investment includes a lawful investment, deposit, membership share, or grant that has as its primary purpose community development. Performance under the investment test is outstanding in the York CSA. Of Susquehanna s total current investments, 13% are attributed to this assessment area. Volume of Investment and Grant Activity A review of investment activity revealed that Susquehanna has an excellent level of qualified community development investments and grants in the York CSA assessment area. Overall, investments aggregate $10.1 million. The substantial majority of these investments (97%) support affordable housing. The remaining 3% of investments support community development services and economic development. Of the bank s investments, $5.6 million are targeted mortgage-backed securities containing residential mortgage loans originated to low- and moderate-income borrowers, or inside low- and moderate-income census tracts. The York CSA also has a $514 thousand share in Pennsylvania Housing Finance Agency Single Family Mortgage Revenue Bonds which finance homes for lowand moderate-income families in Pennsylvania, and a $3.7 million equity investment in affordable rental properties for seniors. 78
82 The York CSA assessment area also has a $72 thousand share in the Business In Our Sites Program investments targeted to the redevelopment of brownfield sites around Pennsylvania. This program is funded by Commonwealth of Pennsylvania Financing Authority Revenue Bonds. In addition to these investments, Susquehanna made grants and contributions to various organizations that routinely provide affordable housing, economic development, and community development services that benefit low- and moderate-income individuals and areas. During the period evaluated, the bank made $223 thousand in qualified grants and donations that benefit the York CSA assessment area. Responsiveness to Credit and Community Development Needs Susquehanna exhibits good responsive to credit and community economic development needs through the use of investments. A large portion of the bank's investments support affordable housing in an area with a demonstrated need for affordable housing, particularly for seniors. SERVICE TEST The service test evaluates the financial services provided by a financial institution using the following characteristics: the accessibility of delivery mechanisms within an assessment area, including the distribution of an institution s branch offices and alternative delivery mechanisms; the impact of changes in branch locations upon low- and moderate-income census tracts and/or low- and moderate-income persons in the assessment area; the reasonableness of business hours and services in meeting assessment area needs; and the extent to which an institution provides community development services. The bank s performance under the service test is rated high satisfactory in the York CSA. Accessibility of Delivery Systems The bank s delivery systems are accessible to essentially all portions of its assessment area. Susquehanna currently operates 27 branches in the York CSA. Of these branches, one is located in low-income census tract and one is in moderate-income tract, representing 8% of bank branches, while 10% of the assessment area population resides in low- or moderate-income census tracts. The following table details the locations of the bank s branches in the York MSA, compared to the population. Geography Number of Branches Percent Total Population Percent Low-income ,053 3 Moderate-income ,089 7 Middle-income , Upper-income , TOTALS % 473, % 79
83 Alternative Retail Banking Services and Alternative Methods of Delivering Retail Banking Services To supplement traditional banking services, Susquehanna offers Internet banking on By accessing Susquehanna s Internet Banker, customers can view account balances, transfer funds between accounts, pay bills, open new accounts and issue stop payments. In addition, customers can bank by phone through a toll-free automated system which allows customers to access account information, open new accounts, renew CDs, apply for loans, or transfer funds. Changes in Branch Locations To the extent changes have been made, Susquehanna s record of opening and closing branches in the York CSA has not adversely affected the accessibility of its delivery systems in low- or moderate-income census tracts, or to low- and moderate-income individuals. Since the previous evaluation, Susquehanna closed its branch located at 16 North George Street, York, PA, in a low-income census tract. All branch deposits were transferred to a new branch acquired as a result of the merger with Community Banks, N.A. Harrisburg. The new branch is located one block away at One East Market Street, York, in the same low-income census tract The bank also closed its drive-thru only branch located at 55 Wetzel Drive, Hanover, PA. The bank opened a branch at 402 Eisenhower Drive, also located in Hanover, one mile from the Wetzel Drive branch. Both branches are in the same upper-income census tract. Susquehanna closed four additional branches in the York CSA as a result of its merger with Community Banks, N.A., Harrisburg, PA. All four branches were in middle-income census tracts. BRANCHES CLOSED Census Tract Street City State Low-income 16 North George Street York PA Upper-income 55 Wetzel Drive Hanover PA Middle-income 2170 White Street York PA Middle-income 10 South Main Street Spring Grove PA Middle-income 3090 Cape Horn Road Red Lion PA Middle-income 1 East Harrisburg Street Dillsburg PA Reasonableness of Business Hours and Services in Meeting Assessment Area Needs Services, including business hours, do not vary among branch offices in a way that inconveniences portions of the assessment area, particularly low- and moderate-income census tracts or individuals. Banking services are offered in a uniform and consistent manner among all branches. 80
84 Community Development Services Susquehanna is a leader in providing community development services that are tailored to the convenience and needs of its assessment area. The most notable services include: A bank officer serves on the board of the York County Economic Development Corporation, a nonprofit community development organization that supports small business and economic development in the York-Hanover MSA. A bank officer serves as the Chairperson of the Family Services Committee of York Habitat for Humanity, a non-profit corporation organized to assist in the development of affordable housing for low-income families. An employee serves as an instructor for the first-time homebuyer s program in Spanish through the York Housing Alliance. The Alliance is an organization focused on stabilizing and enhancing the community by providing housing counseling services. A bank employee serves as a board member for the Partnership for Economic Development of York County, a non-profit corporation organized to stimulate economic development in York County. The organization supports the operation of a Foreign Trade Zone. Bank officers and employees serve in various capacities at other community organizations, including the following: York County Community Foundation, serving Adams and York Counties. Lutheran Social Services of South Central PA, serving Adams, Cumberland, Franklin, Fulton and York in PA. In Maryland; Carroll, Frederick and Washington Counties. Pennsylvania Interfaith Community Program, Inc., serving Adams, Berks, Cumberland, Franklin and York Counties. Banking Products Susquehanna offers banking products that provide greater access to banking services for lowand moderate-income customers and small businesses. Susquehanna issued a commercial letter of credit in the York CSA. The letter of credit qualifies as a community development service because the letter provides the necessary credit support for community development initiatives inside the bank s assessment area. The letter was issued to a non-profit organization to support affordable housing projects. The bank offers Free Checking, a basic checking account with no minimum balance requirement, no service charges, unlimited check writing, and free Internet banking. The account provides greater access to banking services for low- and moderate-income individuals. 81
85 Business Checking is an account designed for small businesses with limited transaction activity. The account has no minimum balance requirement and the first 150 items per month are free. This account provides greater access to banking services, including Internet bill payment, for local smaller businesses. 82
86 LIMITED REVIEW ASSESSMENT AREA CONCLUSIONS Limited reviews of Susquehanna s CRA performance were conducted in five Pennsylvania assessment areas: Allentown, South Central PA, Reading MSA, Scranton, and the Williamsport MSA. The bank s performance in these assessment areas was consistent with, or exceeded, its performance in the full review assessment areas (Lancaster, North Central PA, Harrisburg, and York). For purposes of assessing performance, greater weight was given to the bank s performance in the full review assessment areas. The facts and data reviewed, including performance and demographic information, are in the tables accompanying this report. Conclusions regarding performance, which did not impact the overall institution rating, are as follows: Assessment Area Lending Test Investment Test Service Test Reading MSA (Berks County) Exceeds Consistent Consistent Allentown-Bethlehem-Easton MSA (Lehigh and Northampton Counties) Consistent Exceeds Consistent Williamsport MSA (Lycoming County) Consistent Consistent Consistent South Central Pennsylvania Non-Metropolitan Area (Bedford, Franklin, Fulton and Huntingdon) Consistent Consistent Consistent Scranton MSA (Luzerne County) Consistent Consistent Consistent READING, PA, MSA Situated in southeastern Pennsylvania, the Reading MSA comprises 82 census tracts in Berks County. Of these tracts, 9 are designated as low-income and 16 are moderate-income. All 9 low-income census tracts and 15 of the moderate-income tracts are located in the city of Reading. Twenty percent of the assessment area population resides within these census tracts. According to the FDIC s Summary of Deposits, as of June 30, 2008, there are 21 depository institutions operating in Berks County. These institutions maintain a total of 146 branches holding $8.5 billion in deposits. Susquehanna, with nine branches in the assessment area, ranked 7 th with $385 million and 5% of the retail deposit market. Sovereign Bank, headquartered in Reading, is ranked 1 st with 38% of area deposits. Of Susquehanna s total bank deposits, 5% is attributed to the Reading MSA. Susquehanna reported 464 home mortgage loans aggregating $48 million and 519 small business loans aggregating $69 million, during the examination period in Berks County. Of the total 464 home mortgage loans, 12% were originated in low- or moderate-income census tracts and 22% were made to low- and moderate-income borrowers. Of the total 519 small business loans, 6% were originated in low- or moderate-income tracts and 47% were made to small businesses. During the period evaluated, the bank originated two community development loans aggregating $21.8 million. One loan totaling $21.7 million supports activities that stabilize low- and moderate-income census tracts in the city of Reading. One loan aggregating $100 thousand supports the provision of community development services. 83
87 Susquehanna holds $2.5 million in qualified community development investments in the Reading MSA. The investments primarily support affordable housing initiatives in Reading. Of Susquehanna s total current investments, 3% are attributed to this assessment area. The following table shows the demographics for Reading MSA assessment area. Income Categories Tract Distribution Susquehanna Bank Assessment Area Demographics Reading, PA, MSA (Berks County) Families by Tract Income Families < Poverty Level as % of Families by Tract Families by Family Income # % # % # % # % Low-income , , , Moderate-income , , , Middle-income , , , Upper-income , , Unknown-income Total Assessment Area , , , Housing Housing Types by Tract Units by Tract Owner-occupied Rental Vacant # % % # % # % Low-income 12,157 3, , , Moderate-income 19,717 10, , , Middle-income 96,752 73, , , Upper-income 21,596 17, , Unknown-income Total Assessment Area 150, , , , Total Businesses by Tract Businesses by Tract & Revenue Size Less Than or = $1 Revenue Not Over $1 Million Million Reported # % # % # % # % Low-income 1, Moderate-income Middle-income 8, , Upper-income 2, , Unknown-income Total Assessment Area 12, , , Percentage of Total Businesses:
88 ALLENTOWN-BETHLEHEM-EASTON, PA-NJ MSA Situated in the eastern Pennsylvania area known as the Lehigh Valley, this MSA includes Lehigh, Northampton and Carbon Counties in Pennsylvania and Warren County in New Jersey. Susquehanna s assessment area includes only Lehigh and Northampton Counties. The Allentown assessment area has 130 census tracts, 9 of which are low-income and 28 moderate-income. Of the 9 low-income census tracts, 6 are in Allentown and 3 are in Bethlehem. Of the 28 moderate-income tracts, 15 are in Allentown, 3 in Bethlehem, and 5 in Easton. Twenty-four percent of the assessment area s population resides in these low- and moderate-income census tracts. Susquehanna s performance was evaluated in terms of the demographic and business context in which the bank operates. According to the FDIC s Summary of Deposits, as of June 30, 2008, there are 23 depository institutions operating in Lehigh and Northampton counties. These institutions maintain a total of 233 branches holding $10 billion in deposits. Susquehanna, with 8 branches in the assessment area, ranks 11 th, with $228 million and 2% of the retail deposit market. Wachovia Bank has a strong presence in the market, ranking 1 st, with 28% of the market. Of Susquehanna s total bank deposits, 3% is attributed to the Allentown assessment area. Susquehanna reported 263 home mortgage loans aggregating $22 million and 286 small business loans aggregating $29 million, during the examination period. Of the total 263 home mortgage loans, 14% were originated in low- or moderate-income census tracts and 29% were made to low- and moderate-income borrowers. Of the total 286 small business loans, 23% were originated in low- or moderate-income tracts and 42% were made to small businesses. During the period evaluated, the bank originated two community development loans totaling $280,000 which supported affordable housing initiatives in Lehigh County. In addition, the bank has a total of $6.6 million in qualified community development investments in the assessment area, mainly supporting affordable housing. Of Susquehanna s total current investments, 8% are attributed to this assessment area. 85
89 Income Categories Tract Distribution Susquehanna Bank Assessment Area Demographics Allentown Assessment Area (Lehigh and Northampton Counties) Families by Tract Income Families < Poverty Level as % of Families by Tract Families by Family Income # % # % # % # % Low-income , , , Moderate-income , , , Middle-income , , , Upper-income , , Unknown-income Total Assessment Area , , , Housing Housing Types by Tract Units by Tract Owner-occupied Rental Vacant # % % # % # % Low-income 9,898 2, , , Moderate-income 47,070 22, , , Middle-income 121,955 85, , , Upper-income 56,697 47, , , Unknown-income Total Assessment Area 235, , , , Businesses by Tract & Revenue Size Total Businesses by Less Than or = $1 Revenue Not Tract Over $1 Million Million Reported # % # % # % # % Low-income 1, Moderate-income 3, , Middle-income 10, , Upper-income 6, , Unknown-income Total Assessment Area 21, , , Percentage of Total Businesses:
90 WILLIAMSPORT, PA, MSA The Williamsport MSA, which comprises Lycoming County in its entirety, is located in north central Pennsylvania. The assessment area contains 27 census tracts, six of which are designated as moderate-income. All six of the moderate-income tracts are located in the city of Williamsport, and 18% of the assessment area population resides within these moderate-income tracts. The assessment area has no low-income census tracts. Susquehanna s performance was evaluated in terms of the demographic and business context in which it operates. According to the FDIC s Summary of Deposits as of June 30, 2008, 11 depository institutions operate in the Williamsport MSA, maintaining a total of 55 branches holding $1.6 billion in deposits. Susquehanna operates seven of these branches, holding $229 million in deposits, or 3% of the bank s total deposits. The bank ranked third in the MSA, controlling almost 14% of the retail deposit market. Susquehanna reported 287 home mortgage loans aggregating $31 million and 459 small business loans aggregating $39 million, during the examination period. Of the total 287 home mortgage loans, 19% were originated in low- or moderate-income census tracts and 32% were made to low- and moderate-income borrowers. Of the total 459 small business loans, 16% were originated in low- or moderate-income tracts and 51% were made to small businesses. During the period evaluated, the bank originated four community development loans totaling $6.2 million. All four loans support affordable housing initiatives in Lycoming County. In addition, Susquehanna holds $1.4 million in qualified community developments investments in this assessment area. Of Susquehanna s total investments, 1% is attributed to this assessment area. The table on the following page shows the demographics for the Williamsport MSA. 87
91 Income Categories Tract Distribution Susquehanna Bank Assessment Area Demographics Williamsport MSA (Lycoming County) Families by Tract Income Families < Poverty Level as % of Families by Tract Families by Family Income # % # % # % # % Low-income , Moderate-income , , Middle-income , , , Upper-income , , Unknown-income Total Assessment Area , , , Housing Housing Types by Tract Units by Tract Owner-occupied Rental Vacant # % % # % # % Low-income Moderate-income 9,578 3, , , Middle-income 40,780 27, , , Upper-income 2,106 1, Unknown-income Total Assessment Area 52,464 32, , , Businesses by Tract & Revenue Size Total Businesses by Less Than or = $1 Revenue Not Tract Over $1 Million Million Reported # % # % # % # % Low-income Moderate-income 1, Middle-income 3, , Upper-income Unknown-income Total Assessment Area 4, , Percentage of Total Businesses:
92 SOUTH CENTRAL PENNSYLVANIA NON-METROPOLITAN AREAS (BEDFORD, FRANKLIN, FULTON AND HUNTINGDON COUNTIES) The South Central Pennsylvania assessment area is comprised of a four county, non-metropolitan region. The assessment area contains 52 census tracts, four of which are designated as moderateincome. Two of the moderate-income census tracts are located in Franklin County and one each are in Bedford and Huntingdon Counties. Just 5% of the assessment area population resides within the moderate-income tracts. The assessment area has no low-income census tracts. Susquehanna s performance was evaluated in terms of the demographic and business context in which it operates. According to the FDIC s Summary of Deposits as of June 30, 2008, 21 depository institutions operate in the assessment area, maintaining a total of 114 branches holding $3.1 billion in deposits. Susquehanna operates 11 of these branches, holding $419 million in deposits, or 5% of the bank s total deposits. The bank ranked third in this four-county assessment area, controlling 13% of the retail deposit market. Susquehanna reported 543 home mortgage loans aggregating $62 million and 570 small business loans aggregating $69 million, during the examination period. Of the total 543 home mortgage loans, 8% were originated in moderate-income census tracts and 23% were made to low- and moderate-income borrowers. Of the total 570 small business loans, 4% were originated in moderate-income tracts and 74% were made to small businesses. During the evaluation period, the bank originated three community development loans totaling $2.3 million. Two of the loans support economic development in Franklin and Bedford Counties and one loan financed affordable housing in Franklin County. Susquehanna holds $2.2 million in qualified community development investments in this assessment area. Of Susquehanna s total investments, 3% are attributed to this assessment area. The table on the following page shows the demographics for the bank s South Central Pennsylvania assessment area. 89
93 Income Categories Susquehanna Bank Assessment Area Demographics South Central Pennsylvania Non-Metropolitan Assessment Area (Bedford, Franklin, Fulton and Huntingdon Counties) Tract Distribution Families by Tract Income Families < Poverty Level as % of Families by Tract Families by Family Income # % # % # % # % Low-income , Moderate-income , , Middle-income , , , Upper-income , , Unknown-income Total Assessment Area , , , Housing Housing Types by Tract Units by Tract Owner-occupied Rental Vacant # % % # % # % Low-income Moderate-income 6,708 3, , Middle-income 82,673 55, , , Upper-income 15,799 12, , Unknown-income Total Assessment Area 105,180 70, , , Businesses by Tract & Revenue Size Total Businesses by Less Than or = $1 Revenue Not Tract Over $1 Million Million Reported # % # % # % # % Low-income Moderate-income Middle-income 6, , Upper-income 1, , Unknown-income Total Assessment Area 8, , Percentage of Total Businesses:
94 SCRANTON-WILKES-BARRE, PA, MSA The bank s Scranton assessment area consists of Luzerne County in northeastern Pennsylvania. The assessment area contains 103 census tracts, 14 of which are designated as moderate-income. Of the 14 moderate-income census tracts, 5 are located in Wilkes-Barre, 3 in Hazelton, 2 in Pittston, 2 in Nanticoke and one each in Edwardsville and Plymouth. Twelve percent of the assessment area population resides within these moderate-income tracts. The assessment area has no low-income census tracts. Susquehanna s performance was evaluated in terms of the demographic and business context in which it operates. According to the FDIC s Summary of Deposits as of June 30, 2008, 26 depository institutions operate in Luzerne County, maintaining a total of 127 branches holding $5.6 billion in deposits. Susquehanna operates just 3 of these branches, holding $115 million in deposits, or 1% of the bank s total deposits. The bank ranked 12 th in the assessment area, controlling 2% of the retail deposit market. Susquehanna reported 152 home mortgage loans aggregating $8.5 million and 93 small business loans aggregating $9.8 million, during the examination period. Of the total 152 home mortgage loans, 8% were originated in moderate-income census tracts and 30% were made to low- and moderate-income borrowers. Of the total 93 small business loans, 11% were originated in moderate-income tracts and 63% were made to small businesses. Susquehanna did not originate any community development loans in the Scranton assessment area during the period evaluated. The bank holds $226 thousand of qualified community development investments, almost exclusively targeting affordable housing initiatives in Luzerne County. Of Susquehanna s total current investments, less than 1% is attributed to this assessment area. The table on the following page shows the demographics for Luzerne County, Pennsylvania. 91
95 Income Categories Tract Distribution Susquehanna Bank Assessment Area Demographics Scranton (Luzerne County) Families by Tract Income Families < Poverty Level as % of Families by Tract Families by Family Income # % # % # % # % Low-income , Moderate-income , , , Middle-income , , , Upper-income , , Unknown-income Total Assessment Area , , , Housing Housing Types by Tract Units by Tract Owner-occupied Rental Vacant # % % # % # % Low-income Moderate-income 18,530 8, , , Middle-income 105,661 67, , , Upper-income 20,495 16, , , Unknown-income Total Assessment Area 144,686 91, , , Businesses by Tract & Revenue Size Total Businesses by Less Than or = $1 Revenue Not Tract Over $1 Million Million Reported # % # % # % # % Low-income Moderate-income 1, , Middle-income 8, , Upper-income 1, , Unknown-income Total Assessment Area 11, , , Percentage of Total Businesses:
96 MARYLAND CRA RATING 8 STATE OF MARYLAND Performance Test Lending Investment Service Overall Performance Level High Satisfactory Outstanding High Satisfactory High Satisfactory SUMMARY OF MAJOR FACTORS SUPPORTING RATING Major factors contributing to the rating include: The geographic distribution of loans reflects good penetration throughout the State of Maryland. The distribution of borrowers, given the product lines offered by the bank, reflects good penetration among retail customers of different income levels and business customers of different sizes. The bank exhibits a good record of serving the credit needs of the most economically disadvantaged areas of its assessment areas, low-income individuals, and very small businesses, consistent with safe and sound banking practices. The bank is a leader in making community development loans in the State of Maryland. The bank has an excellent level of qualified community development investments and grants. The bank provides a significant level of retail and community development services. SCOPE OF EXAMINATION For purposes of this CRA evaluation, the state rating for Maryland is comprised of the evaluation of Susquehanna s performance in the Baltimore-Towson MSA. A substantial majority of the bank s lending and operations in Maryland are in this assessment area and, accordingly, a full review of the bank s performance in the assessment area was performed. Limited reviews of the bank s CRA performance were conducted for the Cumberland MSA, Garret County, and Worchester County assessment areas due to the bank s limited operations in these markets. The bank s performance in these assessment areas did not affect the bank s overall rating in the state. Under the lending test, loan products evaluated included home purchase and home-improvement loans and refinancing of such loans (collectively titled HMDA loans), small business loans and other loans that qualified as community development. 8 The statewide evaluation is adjusted for institutions with branches in two or more states in a multi-state metropolitan area and does not reflect performance in the parts of those states contained within the multi-state metropolitan area. 93
97 BALTIMORE-TOWSON, MD METROPOLITAN STATISTICAL AREA DESCRIPTION OF ASSESSMENT AREA Susquehanna s Baltimore assessment area consists of Baltimore City and the counties of Anne Arundel, Carroll, Harford, Howard, and Baltimore. According to 2000 Census data, the total population of the assessment area is 2.5 million, which is 47% of the total state population. The assessment area consists of 615 census tracts, of which 79 are low-income and 136 are moderateincome. Of the total 215 low- and moderate-income census tracts, 160 tracts (74%) are in the city of Baltimore. Twenty nine percent of the MSA population resides within these low- and moderate-income tracts. Susquehanna s performance in the Baltimore assessment area was evaluated in terms of the demographic and business context in which it operates. The assessment area is a highly competitive market with many large regional banking organizations, mortgage companies, and community banks. Based on deposits reported to the FDIC as of June 30, 2008, Susquehanna operated 27 branches in the Baltimore assessment area and these branches contain $1.0 billion in deposits, or 11% of the bank s total deposits. Susquehanna ranks 8 th in the assessment area, with 2% of the retail deposit market. Bank of America holds a significant market share with 26% of deposits in the assessment area. Regarding reported HMDA loans, Susquehanna ranks 110 th in the assessment area with less than 1% of all such loan originations and purchases. A bank affiliate, Susquehanna Mortgage Corporation, ranks 186 th, also with less than 1% of the market. Countrywide Homes ranks 1 st, with 10% of HMDA loans. Regarding small business lenders, Susquehanna ranked 19 th among lenders operating in the assessment area with less than 1% of the market. Competition is strong for small business loans, with 132 lenders reporting 110,308 small business loans in A large percentage of these loans were originated by specialized lenders and include business credit cards. American Express Bank, FSB, ranks 1 st with 26% of the assessment area market. ECONOMIC CHARACTERISTICS The Baltimore MSA is situated in eastern Maryland and includes the city of Baltimore. The MSA is a portion of the larger Baltimore-Washington CSA. The economic activity of Baltimore has slowed but the area has, so far, held off recession. This is primarily due to retail payrolls doing well, despite falling house prices and the turbulent financial markets. In addition, trade through metropolitan area ports is supporting job gains in the transportation industry. Leading industries in the area include Federal, State, and local government, along with health and educational services. These industries account for nearly half of the area s employed labor force. The largest employers include Fort George G. Meade (military and civilian), Johns Hopkins University, MedStar Health, Johns Hopkins Health System, and the National Security Agency. Although Baltimore has a diverse industrial mix, many residents still travel outside of the area to work in such places as Washington, DC; York, PA; Bethesda, MD; and Wilmington, DE. 94
98 The cost of housing in the assessment area remains relatively high when compared to other northeastern metropolitan areas. Moody s Economy.com estimates that the average existing home price in the Baltimore MSA was $268,700 in 2008, down from $284,900 in 2007 (-6%). Area weaknesses include a weak population growth, above-average living and business costs, and a decline in old-line manufacturing. Despite these facts, Baltimore still benefits from a large concentration of defense and life science facilities, strong transportation and distribution industries, and its proximity to the core of federal government operations in Washington, DC. The following table presents unemployment rates for the assessment area and the state. Locations November 2008 November 2007 Anne Arundel County 4.5% 2.9% Baltimore County 5.4% 3.5% Carroll County 4.5% 2.7% Harford County 5.0% 3.1% Howard County 3.6% 2.4% Baltimore City 8.1% 5.5% Baltimore-Towson MSA 5.4% 3.5% State of Maryland 5.1% 3.3% Discussions with community contacts located in the Baltimore assessment area indicated that local financial institutions are actively involved in the area. Credit needs in the assessment area include: (1) home mortgage products, including home improvement loans, targeted to low- and moderate-income neighborhoods and borrowers; (2) small business loans, including participation in small business loan pools, and (3) technical support for small businesses. HOUSING The Baltimore assessment area contains 1,031,372 housing units, of which 62% are owneroccupied and 31% are rental units. According to 2000 Census data, in low-income census tracts the level of owner-occupancy is just 28%, while rental units account for 51% of all housing. In moderate-income census tracts, owner-occupancy is 46% and rental units account for 44% of housing. Single-family units comprise 73% of total housing units, while multi-family units comprise 19% of units, two-to-four family units comprise 7%, and mobile homes 1%. The median housing value in the assessment area is $132,384, which is lower than the state median housing value of $143,300. A significant disparity exists between the median housing value in the assessment area s upper-income census tracts ($193,911) and in the low- ($48,576), moderate- ($75,051) and middle-income ($124,101) census tracts. Although decreasing, the cost of housing in the Baltimore MSA is still high, significantly limiting homeownership opportunities for low- and moderate-income families throughout the assessment area. Moody s Economy.com estimates that the average existing home price in the Baltimore MSA was $268,700 in 2008, down from $284,900 in 2007 (-6%). 95
99 BORROWER INCOME DATA According to 2000 Census data, the median family income for the assessment area is $59,188, compared to $61,876 for the state of Maryland. HUD has reported that the adjusted median family income for the Baltimore MSA in 2008 was $75,800, compared to $66,200 for the state in Of the 646,579 families in the Baltimore MSA, 21% are designated as low-income and 18% are moderate-income, according to 2000 Census data. Families living below the poverty level represented 7% of the total families in the assessment area. In the state of Maryland, 6% of families live below the poverty level. GEOGRAPHIC BUSINESS DATA The percentage of businesses located within designated census tracts is used as a proxy to estimate demand for business credit within such census tracts. According to business demographics, 96,423 businesses are located in the Baltimore assessment area. Of these businesses, 5% are located in low-income census tracts and 15% are in moderate-income tracts. The majority of businesses remain in middle- (42%) and upper-income (37%) tracts. Business demographic data also revealed that of the total businesses in the MSA, 88% are small businesses. A small business is defined as a business with gross annual revenues of $1 million or less. The demographics used in rating Susquehanna under the performance tests in the Baltimore assessment area are detailed in the table on the following page. 96
100 Income Categories Susquehanna Bank Assessment Area Demographics Baltimore, MD, Assessment Area (Baltimore City and Anne Arundel, Carroll, Harford, Howard and Baltimore Counties) Tract Distribution Families by Tract Income Families < Poverty Level as % of Families by Tract Families by Family Income # % # % # % # % Low-income , , , Moderate-income , , , Middle-income , , , Upper-income , , , Unknown-income Total Assessment Area , , , Housing Housing Types by Tract Units by Tract Owner-occupied Rental Vacant # % % # % # % Low-income 105,275 29, , , Moderate-income 224, , , , Middle-income 406, , , , Upper-income 295, , , , Unknown-income Total Assessment Area 1,031, , , , Businesses by Tract & Revenue Size Total Businesses by Less Than or = $1 Revenue Not Tract Over $1 Million Million Reported # % # % # % # % Low-income 5, , Moderate-income 14, , , Middle-income 40, , , Upper-income 36, , , Unknown-income Total Assessment Area 96, , , , Percentage of Total Businesses: CONCLUSIONS WITH RESPECT TO PERFORMANCE TESTS LENDING TEST The lending test evaluates an institution s lending activities based on the following characteristics. geographic distribution of loans, including loans originated in low- and moderate-income census tracts; borrowers profile, including the distribution of loans to low- and moderate-income borrowers and small businesses; overall responsiveness to credit needs of highly economically disadvantaged census tracts, low-income persons, and very small businesses; and community development lending activities. Performance under the lending test is high satisfactory in the Baltimore MSA. 97
101 Geographic Distribution of Loans Home Mortgage Lending The geographic distribution of loans was analyzed to determine the dispersion of the bank's loans among different census tracts within the Baltimore assessment area. The analysis reflected adequate penetration, including low- and moderate-income census tracts. During the examination period, Susquehanna originated 495 home mortgage loans in the Baltimore assessment area, aggregating $96 million. The percentage of owner-occupied housing units contained within designated census tracts is used as a proxy to estimate demand for residential mortgage lending within such tracts. A lower level of owner-occupied units limits lending opportunities in these census tracts. According to 2000 Census data, 5% of all owneroccupied housing units are located in low-income tracts and 16% are in moderate-income tracts. By comparison, 2% of Susquehanna s home mortgage loans were originated in low-income tracts and 10% were in moderate-income tracts. Susquehanna s home mortgage lending was compared to all other lenders operating in the Baltimore assessment area. An analysis of this data indicates that 5% of all home mortgage loans were made in low-income census tracts and 19% were in moderate-income tracts. This comparison shows the bank s lending in low- and moderate-income tracts is below both the aggregate and owner-occupied housing levels. Although Susquehanna operates 27 branches in the Baltimore assessment area, none are located in the low-income census tracts and just three are in moderate-income tracts. This modest branch presence limits the bank s ability to lend in the low- and moderate-income tracts. Small Business Lending The geographic distribution of small business loans was analyzed to determine the dispersion of these loans among different census tracts within the assessment area. The analysis reflects good penetration, including low- and moderate-income census tracts. Susquehanna originated 829 small business loans in the Baltimore assessment area, aggregating $161 million. A comparison of the number of small business loans originated in each type of census tract to the number of businesses located in those tracts demonstrates the bank s commitment to making credit available to its entire community. The bank s extension of credit to these businesses shows that low-income census tracts received 3% of small business loans, while 5% of businesses are located in these census tracts. Moderate-income census tracts received 11% of small business loans, while 15% of businesses are located in these tracts. Susquehanna s small business lending was compared to all other lenders operating in the Baltimore assessment area. An analysis of this data showed that 3% of all small business loans were made in low-income census tracts and 12% were in moderate-income tracts. This comparison shows there were limited lending opportunities for any bank operating in the lowincome tracts. In the moderate-income tracts, Susquehanna performed about the same as the aggregate, but below the level of businesses operating in these tracts. 98
102 This level of lending activity by the bank is considered good given the demographics of the assessment area, particularly the limited lending opportunities in low-income census tracts, and Susquehanna s consistent performance in moderate-income census tracts where lending is similar to aggregate lending. Distribution of Loans by Borrower Income Level and Revenue Size of the Business Home mortgage and small business lending data were analyzed, in conjunction with a review of the demographic and economic characteristics of the assessment area, to determine the level of lending to borrowers of different income levels and to businesses of different sizes. Lending to Borrowers of Different Income Levels Of the 646,579 families in the Baltimore assessment area, 21% are designated as low-income and 18% are moderate-income. By comparison, 7% of Susquehanna s home mortgage loans were originated to low-income borrowers and 18% were to moderate-income borrowers. An analysis of all lenders operating in the assessment area, using 2007 aggregate loan data, shows that 7% of all home mortgage loans were made to low-income borrowers and 20% were to moderateincome borrowers. This comparison shows that Susquehanna performed the same as the market with low-income borrowers, but well below the percentage of these borrowers in the assessment area. Susquehanna performed below the market with moderate-income borrowers; however, bank lending to these borrowers was the same as the percentage of moderate-income borrowers in the assessment area. The distribution of bank loans reflects good penetration among retail customers of different income levels, even though the distribution of loans to low-income borrowers does not correspond to the percentage of low-income families in the assessment area. The bank s level of penetration to these borrowers is considered good given the high cost of housing in the Baltimore area and given that the credit needs of the low-income segment of the population can be difficult to address through conventional loan products, presenting a significant obstacle to home ownership. In particular, 35% of renters in the assessment area pay more than 30% of their income for housing, making it difficult to save for a down payment on a house. Obstacles to home ownership also exist for moderate-income families; however, Susquehanna s distribution of loans to moderate-income borrowers in the assessment area is good. The bank s participation in innovative and flexible lending programs that address the specific credit needs of low- and moderate-income borrowers enhances its home mortgage lending profile. Most notably, the bank offers the Home Start Loan Program, a mortgage product developed to provide low- and moderate-income borrowers with the ability to purchase a home. The products allow for flexible underwriting standards and the use of alternative credit when no credit score exists. During the evaluation period, Susquehanna originated 279 loans under the program, aggregating $29.9 million. In the Baltimore assessment area, the bank originated 16 of these loans, aggregating $2.5 million. 99
103 Susquehanna is a member of the Federal Home Loan Bank of Pittsburgh (FHLBP) and a participant in its First Front Door Program. This Program is designed to provide low- and moderate-income homebuyers with down payment and closing cost assistance. Homebuyers are eligible to receive three dollars for every one dollar paid towards closing costs. Through Susquehanna, 41 homebuyers in its assessment areas received more than $215 thousand in matching funds through this program. Six homebuyers in the Baltimore assessment area received $60 thousand in matching funds through this program. The bank also offers the Fannie Mae Flexible 100 Mortgage product for single-family, owneroccupied residences. The primary benefit of this product is the no down payment feature. The Flexible 100 is targeted to first time home buyers and primarily serves low- and moderateincome homebuyers. The product enables Susquehanna to originate loans to borrowers who would not qualify for mortgages under the bank s traditional underwriting criteria. During the evaluation period, Susquehanna originated eight mortgages under the program, aggregating $1.2 million. Lending to Businesses of Different Sizes Small business lending data were analyzed to determine the level of lending to businesses of different sizes, especially small businesses. Of the 829 small business loans originated by the bank during the examination period, 52% were extended in an amount of $100 thousand or less. The number of small business loans originated in smaller amounts is significant because smaller size loans are generally commensurate with the borrowing needs of small businesses. Susquehanna s lending activity, therefore, demonstrates that the bank is meeting the credit needs of small businesses at a good level. The bank s small business lending is further quantified to determine whether loans were made to businesses with gross annual revenues of $1 million or less. Of the 829 loans originated, 51% were originated to small businesses. By comparison, a review of all lenders in the market shows that 36% of all commercial loans made in the Baltimore assessment area were to small businesses. Susquehanna s participation in innovative and flexible lending programs, which address the specific credit needs of small businesses, enhanced its small business lending profile. Most notably, Susquehanna participates as a U.S. Small Business Administration (SBA) lender. The bank received SBA s Preferred Lender status and qualified for the SBAExpress lending program developed by the SBA to increase the number of small loans approved by the agency. During the period evaluated, the bank originated 154 SBA loans, aggregating $37.4 million. In addition, Susquehanna is a stockholder in the Carroll County Development Corporation (CCDC), a non-profit community financial development corporation dedicated to improving the economic conditions in Carroll County. The CCDC provides start-up or growth financing to small businesses not served by mainstream lenders. The bank committed $25 thousand to the CCDC to provide on-going loan financing. 100
104 Community Development Lending Susquehanna is a leader in making community development loans in the Baltimore assessment area. During the time period evaluated, the bank originated 11 community development loans totaling $6.4 million. Seven loans aggregating $5.6 million support affordable housing initiatives and four loans totaling $750 thousand support the provision of community development services. Responsiveness to Credit Needs Susquehanna exhibits an excellent record of serving the credit needs of the most economically disadvantaged areas of this assessment area, including low-income borrowers and very small businesses, consistent with safe and sound banking practices. The bank achieved this record primarily through its community development lending. INVESTMENT TEST The investment test evaluates a financial institution s level of qualified investments that serve low- or moderate-income census tracts or individuals. The test also considers the innovativeness and complexity of these investments. Qualified investments made prior to the previous evaluation, which are still outstanding, are considered under the test. For purposes of CRA, the term qualified investment includes a lawful investment, deposit, membership share, or grant that has as its primary purpose community development. Performance under the investment test is outstanding in the Baltimore assessment area. Of Susquehanna s total current investments, 15% were attributed to this assessment area. Volume of Investment and Grant Activity A review of investment activity revealed that Susquehanna has an excellent level of qualified community development investments and grants in the Baltimore MSA. Overall, investments aggregate $11.8 million and almost exclusively support affordable housing. Of the bank s investments, $10.6 million are targeted mortgage-backed securities containing residential mortgage loans originated to low- and moderate-income borrowers, or inside low- and moderate-income census tracts. This assessment area also holds a $1.1 million share in Maryland Department of Housing and Community Development Multi-Family Housing Revenue Bonds. The bank made grants and contributions to various organizations that routinely provide affordable housing and community development services that benefit low- and moderate-income individuals and areas. During the period evaluated, the bank made $13 thousand in qualified grants and donations that benefit the Baltimore MSA. 101
105 Responsiveness to Credit and Community Development Needs Susquehanna exhibits a good responsiveness to credit and community economic development needs through the use of investments. The bank's investments support affordable housing in an area with high housing costs and a low per capita income. Of the total families in the assessment area, 39% are designated as low- or moderate-income and have limited access to affordable housing. SERVICE TEST The service test evaluates the financial services provided by a financial institution using the following characteristics: the accessibility of delivery mechanisms within an assessment area, including the distribution of an institution s branch offices and alternative delivery mechanisms; the impact of changes in branch locations upon low- and moderate-income census tracts and/or low- and moderate-income persons in the assessment area; the reasonableness of business hours and services in meeting assessment area needs; and the extent to which an institution provides community development services. The bank s performance under the service test is rated high satisfactory in the Baltimore MSA assessment area. Accessibility of Delivery Systems The bank s delivery systems are reasonably accessible to essentially all portions of its assessment area. Susquehanna currently operates 27 branches in its Baltimore assessment area. There are no branches in low-income census tracts and three are in moderate-income tracts, representing 11% of bank branches, while 29% of the assessment area population resides in lowor moderate-income census tracts. The following table details the locations of the bank s branches in the assessment area, compared to population levels: Geography Number of Branches Percent Total Population Percent Low-income ,828 9 Moderate-income , Middle-income , Upper-income , TOTALS % 2,512, % Alternative Retail Banking Services and Alternative Methods of Delivering Retail Banking Services To supplement traditional banking services, Susquehanna offers Internet banking on By accessing Susquehanna s Internet Banker, customers can view account balances, transfer funds between accounts, pay bills, open new accounts and issue stop payments. 102
106 In addition, customers can bank by phone through a toll-free automated system which allows customers to access account information, open new accounts, renew CDs, apply for loans, or transfer funds. Changes in Branch Locations Susquehanna s record of opening and closing branches in the Baltimore assessment area has not adversely affected the accessibility of its delivery systems in low- and moderate-income census tracts, or to low- and moderate-income individuals. During the evaluation period, the bank opened seven branches as a result of its merger with Community Banks, N.A., Harrisburg, PA. Two of the branches were located in middle-income census tracts and five were in upper-income tracts. Census Tract Street City State Middle-income 4501 Hanover Pike Red Run Boulevard Manchester MD Middle-income 275 Clifton Boulevard Red Run Boulevard Westminster MD Upper-income Red Run Boulevard Owings Mills MD Upper-income Mill Run Circle 10 Owings Mills MD Upper-income 1525 Rock Spring Road 10 First Hill MD Upper-income Upper-income 8801 Columbia 100 Parkway Snowden River Parkway 10 Columbia Columbia In addition, the bank s Pasadena branch was relocated from 3820 Mountain Road, to 25 Magothy Beach Road, Pasadena, MD. The branch continues to be located in a middle-income census tract. Reasonableness of Business Hours and Services in Meeting Assessment Area Needs Services, including business hours, do not vary among branch offices in a way that inconveniences portions of the assessment area, particularly low- and moderate-income census tracts or individuals. Banking services are offered in a uniform and consistent manner among all branches. Community Development Services Susquehanna is a leader in providing community development services in the Baltimore assessment area. Numerous bank officers and employees serve on loan and finance committees for local community development organizations, make presentations for small business development, homeownership and financial literacy programs, provide credit counseling and technical expertise, and serve in various capacities on boards of numerous community development organizations. These organizations include: Southeast Community Development Corporation Family and Children s Services of Central Maryland Human Services of Carroll County MD MD 103
107 Jim Rouse Entrepreneurial Fund Harbel Housing Partnership Habitat for Humanity of Carroll County Neighborhood Housing Services of Baltimore Open Doors Maryland Small Business Development Financing Authority Banking Products Susquehanna offers banking products that provide greater access to banking services for lowand moderate-income customers and small businesses, including: Free Checking, a basic checking account with no minimum balance requirement, no service charges, unlimited check writing, free Internet banking and a debit card. The account provides greater access to banking services for low- and moderate-income individuals. Business Checking is an account designed for small businesses with limited transaction activity. The account has no minimum balance requirement and the first 150 items per month are free. This account provides greater access to banking services, including Internet bill payment, for local small businesses. 104
108 LIMITED REVIEW ASSESSMENT AREA CONCLUSIONS Limited reviews of Susquehanna s CRA performance were conducted in the Allegany County, Worchester County, and Garrett County assessment areas in Maryland. While a full review was conducted and greater weight was given to the bank s performance in the Baltimore MSA, bank performance in the limited review assessment areas was determined to be consistent overall with the performance in the full review assessment area. Facts and data reviewed, including performance and demographic information, can be found in the tables accompanying this report. Conclusions regarding performance, which did not impact the overall institution rating, are as follows: Assessment Area Lending Test Investment Test Service Test Allegany County, MD (Cumberland MSA) Consistent Consistent Consistent Worcester County, MD (Ocean Pines Micropolitan Statistical Area) Below Consistent Consistent Garrett County, MD Exceeds Consistent Consistent ALLEGANY COUNTY, MD (CUMBERLAND METROPOLITAN STATISTICAL AREA) Situated in northwestern Maryland, the Cumberland MSA consists of Allegany County in Maryland and Mineral County in West Virginia. Susquehanna s assessment area includes only Allegany County which contains 23 census tracts, two of which are designated as moderateincome. Both moderate-income tracts are located in the city of Cumberland. The total population of Allegany County is 74,930. According to the FDIC s Summary of Deposits, as of June 30, 2008, there are just five depository institutions operating in Allegany County. These institutions maintain a total of 21 branches holding $611 million in deposits. Susquehanna, with five branches in the assessment area, ranked 1 st, with $224 million and 37% of the retail deposit market. M&T Bank, headquartered in Buffalo, NY is ranked 2 nd, with 28% of area deposits. Of Susquehanna s total bank deposits, 3% are attributed to the Allegany County assessment area. Susquehanna reported 218 home mortgage loans aggregating $12.2 million and 131 small business loans aggregating $16.6 million, during the examination period in Allegany County. Of the total 218 home mortgage loans, 5% were originated in moderate-income census tracts and 28% were made to low- and moderate-income borrowers. Of the total 131 small business loans, 3% were originated in moderate-income census tracts and 54% were made to small businesses. Susquehanna made one community development loan, totaling $50,000, which supported economic development in Allegany County. The bank also has $1.8 million in qualified investments in the county which support both the provision of community services and affordable housing. Of Susquehanna s total current investments, 2% are attributed to this assessment area. 105
109 The following table shows Susquehanna s branch distribution by population level: Allegany County, MD Census Tract Number of Branches Percent Branches Population Percent Population Low-income Moderate-income ,053 8 Middle-income , Upper-income , TOTALS 8 100% 74, % The following table shows the demographics for Allegany County. Income Categories Susquehanna Bank Assessment Area Demographics Allegany County, MD, Assessment Area (Cumberland, MD-WV, MSA) Tract Distribution Families by Tract Income Families < Poverty Level as % of Families by Tract Families by Family Income # % # % # % # % Low-income , Moderate-income , , Middle-income , , , Upper-income , , Unknown-income Total Assessment Area , , , Housing Housing Types by Tract Units by Tract Owner-occupied Rental Vacant # % % # % # % Low-income Moderate-income 3,102 1, , Middle-income 23,392 14, , , Upper-income 6,490 4, , Unknown-income Total Assessment Area 32,984 20, , , Businesses by Tract & Revenue Size Total Businesses by Less Than or = $1 Revenue Not Tract Over $1 Million Million Reported # % # % # % # % Low-income Moderate-income Middle-income 1, , Upper-income Unknown-income Total Assessment Area 2, , Percentage of Total Businesses:
110 WORCESTER COUNTY, MD Situated in eastern Maryland, the Ocean Pines micropolitan statistical area encompasses all of Worcester County. The county, with a population of 46,543, contains 11 census tracts of which two are designated as moderate-income and nine as middle-income. The nine middle-income tracts are designated as distressed for purposes of CRA. According to the FDIC s Summary of Deposits as of June 30, 2008, 13 depository institutions operate in Worcester County. These institutions maintain a total of 42 branches holding $1.2 billion in deposits. Susquehanna operates one branch in the county and ranks 9 th, holding $31 million, or 3% of the retail deposit market. PNC Bank, headquartered in Pittsburgh, PA, ranks 1 st with 27% of the market. Calvin B. Taylor Bank, headquartered in Worchester County, is ranked 2 nd, with 23% of the market. Of Susquehanna s total bank deposits, less than 1% is attributed to the Worcester County assessment area. During the examination period, Susquehanna originated 40 home mortgage loans aggregating $17.4 million and eight small business loans aggregating $2.0 million. Of the 40 home mortgage loans, none were originated in the moderate-income census tracts or to low- or moderate-income borrowers. There was a total of 8 small business loans all were originated in the middle-income census tracts and 63% were to small businesses. Susquehanna did not originate any community development loans in Worcester County during the period evaluated. The bank's lending performance in Worcester County is below its lending performance in the Maryland assessment area that was reviewed using the full-scope examination procedures. However, it does not change the overall performance conclusion for the state of Maryland. Susquehanna holds $292 thousand in qualified investments in this assessment area, all targeted to affordable housing. Of Susquehanna s total current investments, less than 1% is attributed to this assessment area. The following table shows Susquehanna s branch distribution by population level: Worcester County, MD Census Tract Number of Branches Percent Branches Population Percent Population Low-income Moderate-income 0 0 9, Middle-income , Upper-income TOTALS 1 100% 46, % 107
111 The following table shows the demographics for Worcester County, MD. Income Categories Susquehanna Bank Assessment Area Demographics Worcester County, MD (Ocean Pines, MD, Micropolitan Statistical Area) Tract Distribution Families by Tract Income Families < Poverty Level as % of Families by Tract Families by Family Income # % # % # % # % Low-income , Moderate-income , , Middle-income , , Upper-income , Unknown-income Total Assessment Area , , Housing Housing Types by Tract Units by Tract Owner-occupied Rental Vacant # % % # % # % Low-income Moderate-income 3,875 1, , Middle-income 43,485 12, , , Upper-income Unknown-income Total Assessment Area 47,360 14, , , Total Businesses by Tract Less Than or = $1 Million Businesses by Tract & Revenue Size Over $1 Million Revenue Not Reported # % # % # % # % Low-income Moderate-income Middle-income 2, , Upper-income Unknown-income Total Assessment Area 3, , Percentage of Total Businesses:
112 GARRETT COUNTY, MARYLAND, NON-METROPOLITAN AREA Situated in western Maryland, Garrett County shares a border with Pennsylvania to its north and West Virginia to its south and west. The county has just seven census tracts, five of which are designated as moderate-income and two are middle-income tracts designated as underserved. For purposes of CRA, a middle-income census tract designated as underserved constitutes a rural area with a population so small, thin and distant from a population center that it will have difficulty financing essential community needs. According to the FDIC s Summary of Deposits, as of June 30, 2008, there are just five depository institutions operating in Garrett County. These institutions maintain a total of 14 branches holding $775 million in deposits. Susquehanna, with two branches in the assessment area, ranked 3 rd with $71 million and 9% of the retail deposit market. First United Bank & Trust, headquartered in Oakland, MD, is ranked 1 st with 75% of area deposits. Of Susquehanna s total bank deposits, 1% is attributed to the Garrett County assessment area. Susquehanna reported 85 home mortgage loans aggregating $11.6 million and 241 small business loans aggregating $22.9 million, during the examination period in Garrett County. Of the total 85 home mortgage loans, 59% were originated in moderate-income census tracts and 27% were made to low- and moderate-income borrowers. Of the total 241 small business loans, 74% were originated in moderate-income tracts and 66% were made to small businesses. Susquehanna made one community development loan aggregating $200,000 which supports affordable housing in Garrett County. The bank holds $890 thousand in qualified community development investments which also support affordable housing in the assessment area. Of Susquehanna s total current investments, 1% is attributed to this assessment area. The following table shows Susquehanna s branch distribution by population level: Garrett County, MD Census Tract Number of Branches Percent Branches Population Percent Population Low-income Moderate-income , Middle-income , Upper-income TOTALS 2 100% 29, % The table on the following page shows the demographics for Garrett County, MD. 109
113 Income Categories Susquehanna Bank Assessment Area Demographics Garrett County, MD, Non-Metropolitan Area Tract Distribution Families by Tract Income Families < Poverty Level as % of Families by Tract Families by Family Income # % # % # % # % Low-income , Moderate-income , , Middle-income , , Upper-income , Unknown-income Total Assessment Area , , Housing Housing Types by Tract Units by Tract Owner-occupied Rental Vacant # % % # % # % Low-income Moderate-income 10,580 6, , , Middle-income 6,181 2, , Upper-income Unknown-income Total Assessment Area 16,761 8, , , Total Businesses by Tract Less Than or = $1 Million Businesses by Tract & Revenue Size Over $1 Million Revenue Not Reported # % # % # % # % Low-income Moderate-income 1, Middle-income Upper-income Unknown-income Total Assessment Area 1, , Percentage of Total Businesses:
114 NEW JERSEY CRA RATING 9 STATE OF NEW JERSEY Performance Test Lending Investment Service Overall Performance Level High Satisfactory Low Satisfactory High Satisfactory High Satisfactory SUMMARY OF MAJOR FACTORS SUPPORTING RATING Major factors contributing to the rating include the following. The geographic distribution of loans reflects good penetration throughout New Jersey. The distribution of borrowers, given the product lines offered by the bank, reflects adequate penetration among retail customers of different income levels and good penetration of business customers of different sizes. The bank exhibits a good record of serving the credit needs of the most economically disadvantaged areas of its assessment areas, low-income individuals, and very small businesses, consistent with safe and sound banking practices. The bank has made an excellent level of community development loans in New Jersey. The bank has an adequate level of qualified community development investments and grants. The bank provides a significant level of community development services in New Jersey. SCOPE OF EXAMINATION For purposes of this CRA evaluation, the state rating for New Jersey is comprised of the evaluation of Susquehanna s performance in the Vineland-Millville-Bridgeton MSA. A majority of the bank s lending and operations in New Jersey are in this assessment area and, accordingly, a full review of the bank s performance in the assessment area was performed. A limited review of the bank s CRA performance was conducted for the Atlantic City MSA assessment area due to the bank s limited operations in that market. The bank s performance in the Atlantic City assessment area did not affect the bank s overall rating in the state. Under the lending test, loan products evaluated included home purchase and home-improvement loans and refinancing of such loans (collectively titled HMDA loans), small business loans and other loans that qualified as community development. 9 The statewide evaluation is adjusted for institutions with branches in two or more states in a multi-state metropolitan area, and does not reflect performance in the parts of those states contained within the multi-state metropolitan area. 111
115 FULL REVIEW ASSESSMENT AREA CONCLUSIONS VINELAND-MILLVILLE-BRIDGETON, NJ, METROPOLITAN STATISTICAL AREA DESCRIPTION OF ASSESSMENT AREA Situated in southeastern New Jersey, the Vineland MSA consists of Cumberland County which has a total population of 146 thousand. The Vineland MSA is comprised of 34 census tracts, of which two are designated as low-income and seven as moderate-income. 10 Of the two lowincome census tracts, one is located in the city of Bridgeton and one in the city of Vineland. Five percent of the assessment area s population resides within these low-income tracts. Of the seven moderate-income census tracts, three are in the city of Bridgeton, two in the city of Millville and two in the city of Vineland. Eighteen percent of the MSA s population resides within the moderate-income tracts. Susquehanna s performance in the assessment area was evaluated in terms of the demographic and business context in which it operates. According to the FDIC s Summary of Deposits as of June 30, 2008, 12 depository institutions operate in the Vineland MSA. These 12 institutions maintained a total of 46 branches, holding $2.1 billion in deposits. Susquehanna operated six of these branches, with $320 million in deposits. The bank ranks 4 th in the MSA, controlling 15% of the retail deposit market. Two local banks, Sun National Bank and Colonial Bank FSB, ranked 1 st and 2 nd, with 22% and 16% of the market, respectively. Of Susquehanna s total deposits, 4% come from the Vineland MSA. Susquehanna s HMDA loans were compared to the aggregate of all lenders in the Vineland MSA reporting real estate loans pursuant to HMDA. The assessment area had a total of 274 HMDA reporters in 2007 and Susquehanna was the 15 th largest HMDA loan originator in the Vineland MSA with 1% of all such loan originations and purchases. Colonial Bank FSB, headquartered in Vineland, is the highest ranked local bank at 6 th, holding 3% of the market. Among small business lenders operating in the Vineland MSA, Susquehanna ranked 7 th with 4% of the market. American Express Bank FSB ranked 1 st with 22% of the market. The Vineland MSA had a total of 49 small business reporters in Susquehanna is ranked highest of the local banks. ECONOMIC CHARACTERISTICS Vineland s recession deepened in 2008 and the area remains weaker than the rest of the nation. The area s factories are losing jobs at a pace that is slightly faster than the rest of the nation. Vineland has one of the highest shares of old-line manufacturing in the Northeast and its dependence on declining manufacturing industries remains a challenge. In addition, the area s low educational attainment makes it difficult to develop new industries. Manufacturing accounts for 15% of jobs in the MSA. State and local governments, which account for 24% of jobs in Vineland, are also shedding jobs at a high rate due to the economic downturn. 10 An additional three census tracts have no population and are designated as income unknown. These tracts consist of an airport and a state forest. 112
116 Overall strengths of the Vineland MSA include its relatively stable, highly affordable housing market, a cost of living well below state and regional averages, population growth above regional averages, and the growing number of tourist attractions. Weaknesses include low industrial diversity, overdependence on manufacturing, poor labor force quality, low per capita income, and above average cost of doing business. The largest employers in the Vineland MSA are South Jersey Healthcare, Kimble Glass, the Training School at Vineland, and Durand Glass Manufacturing Company The metropolitan area unemployment rate continues to increase, as seen in the following table: November November Locations Cumberland County 8.7% 5.7% Vineland City 8.6% 5.3% New Jersey 6.0% 4.8% Discussions with community contacts located in the Vineland MSA indicated that credit needs in the assessment area include: (1) flexible loan programs which allow for the use of alternative credit for the seasonal workforce in Cumberland County who are unable to document their income sources; (2) assistance for low-income residents in opening bank accounts; (3) donations to non-profit groups providing community development services; and (4) funding for small businesses, including participation in alternative small business loan programs in the area. HOUSING The Vineland MSA contains 52,863 housing units. Single-family units comprise 72% of the housing units, while multi-family units comprise 12%, two-to-four family units 10%, and mobile homes 7%. The median age of the housing stock is 39 years, close to the median age for housing stock in the state at 38 years. Median rent in the assessment area is $616, with 43% of renters paying more than 30% of their income for housing. Statewide median rent is $751, with 37% of renters paying more than 30% of their income for housing. According to the 2000 census, the median housing value in the Vineland MSA was $89,237. Some disparity exists between the median housing values in the upper-income ($103,284), middle-income ($86,974), and moderate-income census tracts ($71,755) and that in low-income ($52,588) tracts. Of the total owner-occupied housing units in the assessment area, 63% were valued at less than $100 thousand. In the state, just 17% of housing units were valued at less than $100 thousand. The cost of housing in the Vineland MSA remains stable and relatively low when compared to other northeastern metropolitan areas. According to Moody s Economy.com, the existing median home price in 2008 was $159,100, compared to $163,900 in 2007 (-3%). The overall homeownership rate in the assessment area is 63%, compared to 61% statewide. The percentage of owner-occupied housing units contained within designated census tracts is used as a proxy to estimate demand for residential mortgage lending within such census tracts. In the Vineland MSA, 2% of owner-occupied units are located in low-income census tracts and 10% are in moderate-income tracts. The large majority of owner-occupied housing units are located in middle-income (59%) and upper-income (29%) tracts. 113
117 BORROWER INCOME DATA For purposes of evaluating the distribution of loans to borrowers of different income levels, incomes were classified based upon annually adjusted median family income data made available from HUD. According to 2000 Census data, the median family income for the Vineland MSA was $45,377, significantly less than the state median income level of $65,370. From an income distribution standpoint, 22% of families in the assessment area are designated as low-income and 18% are moderate-income. In 2008, the adjusted median family income for the Vineland MSA, as reported by HUD, increased to $58,700. DEMOGRAPHIC BUSINESS DATA The percentage of businesses located within designated census tracts is used as a proxy to estimate demand for small business credit within such census tracts. In the Vineland MSA, 8% of the assessment area s businesses are located in low-income census tracts and 17% are in moderate-income tracts. Most of the MSA s businesses are located in middle-come (48%) and upper-income (27%) census tracts. The demographics used to assess the performance context in which Susquehanna operates are detailed in the table on the following page. Income Categories Susquehanna Bank Assessment Area Demographics Vineland-Millville-Bridgeton, NJ, MSA (Cumberland County) Tract Distribution Families by Tract Income Families < Poverty Level as % of Families by Tract Families by Family Income # % # % # % # % Low-income , Moderate-income , , , Middle-income , , , Upper-income , , Unknown-income Total Assessment Area , , , Housing Housing Types by Tract Units by Tract Owner-occupied Rental Vacant # % % # % # % Low-income 1, Moderate-income 9,020 3, , Middle-income 29,317 19, , , Upper-income 13,059 9, , Unknown-income Total Assessment Area 52,863 33, , , Businesses by Tract & Revenue Size Total Businesses by Less Than or = $1 Revenue Not Tract Over $1 Million Million Reported # % # % # % # % Low-income Moderate-income Middle-income 2, , Upper-income 1, , Unknown-income Total Assessment Area 4, , Percentage of Total Businesses:
118 CONCLUSIONS WITH RESPECT TO PERFORMANCE TESTS LENDING TEST The lending test evaluates an institution s lending activities based on the following characteristics. geographic distribution of loans, including loans originated in low- and moderate-income census tracts; borrowers profile, including distribution of loans to low- and moderate-income borrowers and small businesses; overall responsiveness to credit needs of highly economically disadvantaged census tracts, low-income persons, and very small businesses; and community development lending activities. Performance under the lending test is satisfactory in the Vineland assessment area. Geographic Distribution of Loans The geographic distribution of loans was analyzed to determine the dispersion of loans among different census tracts within the Vineland assessment area. The analysis reflected good penetration throughout the assessment area, including low- and moderate-income census tracts. Home Mortgage Lending During the period evaluated, Susquehanna originated 212 home mortgage loans in the Vineland MSA, in an aggregate amount of $18 million. The percentage of owner-occupied housing units contained within designated census tracts is used as a proxy to estimate demand for residential mortgage lending within such census tracts. A lower level of owner-occupied units limits the bank s lending opportunities in these tracts. A review of Susquehanna s mortgage lending activity reflects good penetration throughout the assessment area. In the Vineland MSA, 2% of all owner-occupied units are located in low-income census tracts and 10% are located in moderate-income tracts. By comparison, 1% of Susquehanna s home mortgage loans were originated in low-income tracts and 12% were in moderate-income tracts. Susquehanna s home mortgage lending was compared to all lenders operating in the Vineland MSA. According to 2007 aggregate HMDA data, 2% of all home mortgage loans were made in low-income census tracts and 14% were in moderate-income tracts. Susquehanna s lending in low-and moderate-income census tracts is similar to aggregate lending and near the housing proxy in the Vineland MSA. Overall, bank lending is considered good given the demographics of the assessment area, including limited housing availability in low- and moderate-income census tracts. The bank has responded to affordable housing needs by providing an excellent level of community development loans in the Vineland MSA. A discussion of these efforts is in the Community Development Loan section following this analysis. 115
119 Small Business Lending An analysis of the geographic distribution of small business loans was conducted in an effort to determine the dispersion of these loans among different census tracts. The analysis reflects good penetration given the economic characteristics of the Vineland MSA. A comparison of the number of small business loans originated in each type of census tract to the number of businesses located in each type of tract demonstrates the bank s commitment to making credit available to its entire community. During the period evaluated, Susquehanna originated 326 small business loans in the Vineland MSA, in an aggregate amount of $52 million. Business demographics revealed a total of 4,569 businesses within the assessment area. Susquehanna s extension of credit to these businesses shows that low-income census tracts received 5% of small business loans, while 8% of businesses are located in these tracts. Moderate-income tracts received 14% of small business loans, while 17% of businesses are located in these tracts. Susquehanna s small business lending was compared to all lenders operating in the assessment area. Aggregate loan data show that 6% of all reported small business loans were made in lowincome census tracts and 12% were in moderate-income tracts. Overall, Susquehanna performed slightly lower than the market in low-income tracts and higher than the market in moderateincome tracts. However, the aggregate data show that overall lending in both low- and moderate-income census tracts was less than the level of small businesses operating in these tracts, indicating limited lending opportunities for any banks operating in these areas. Distribution of Loans by Borrower Income Level and Revenue Size of the Business HMDA and small business lending data were analyzed, in conjunction with a review of the demographic and economic characteristics of the assessment area, to determine the extent of lending to borrowers of different income levels and to businesses of different sizes. Lending to Borrowers of Different Income Levels The demographics of the assessment area show that of the 35,373 families in the assessment area, 22% are designated as low-income and 18% are moderate-income. By comparison, the distribution of Susquehanna s home mortgage loans shows that 4% of loans were to low-income borrowers and 14% were to moderate-income borrowers. Susquehanna s home mortgage lending was compared to all lenders operating in the Vineland MSA. An analysis of aggregate data show that 4% of all home mortgage loans made in the assessment area were made to low-income borrowers and 16% were made to moderate-income borrowers. Overall, analysis shows Susquehanna s lending levels were lower than both aggregate lending and the level of low- and moderate-income families in the assessment area. 116
120 The distribution of bank loans reflects adequate penetration among retail customers of different income levels, even though the distribution of loans to low- and moderate-income borrowers does not correspond to the percentage of low- and moderate-income families in the assessment area. The bank s level of penetration is considered adequate given that the credit needs of this segment of the population can be difficult to address through conventional loan products, presenting a significant obstacle to home ownership. Although the demographic profile shows that housing is more affordable in the assessment area when compared to both the state and other eastern metropolitan areas, Vineland s low wage economy results in serious housing affordability problems for low- and moderate-income borrowers. Even though housing is low-cost, the low wage jobs make it unaffordable to many residents. Specifically, 43% of renters in the Vineland MSA pay more than 30% of their income for housing, making it difficult to save for a down payment on a house. Susquehanna participated in innovative and flexible lending programs which address the specific credit needs of low- and moderate-income borrowers in its assessment areas. Most notably, the bank developed its Home Start Loan Program, a mortgage product developed to provide low- and moderate-income borrowers with the ability to purchase a home. The products allow for flexible underwriting standards and the use of alternative credit when no credit score exists. During the evaluation period, Susquehanna originated 279 loans under the program, aggregating $29.9 million. The bank originated two of these loans, aggregating $129 thousand, in the Vineland MSA. Lending to Businesses of Different Sizes Small business lending data were analyzed to determine the extent of lending to businesses of different sizes, especially small businesses. Susquehanna s distribution of loans reflects good penetration among business customers of different sizes. A small business is defined as a business with gross annual revenues of $1 million or less. Using this definition, bank lending was analyzed to determine whether loans were made to small businesses. Of the 326 loans the bank originated during the evaluation period, 144 or (44%) were originated to small businesses. By comparison, a review of all lenders in the market shows that 38% of all small business loans were made to small businesses. In addition, of the 326 small business loans originated by the bank, 65% were extended in an amount of $100 thousand or less. The number of small business loans originated in amounts of $100 thousand or less is significant because smaller size loans are generally commensurate with the borrowing needs of smaller businesses and, as such, Susquehanna s lending activity demonstrates it is meeting the credit needs of smaller businesses. Susquehanna participates as a U.S. Small Business Administration (SBA) lender. The bank received SBA s Preferred Lender status and qualified for the SBAExpress lending program developed by the SBA to increase the number of small loans approved by the agency. During the period evaluated, the bank originated 154 SBA loans, aggregating $37.4 million. 117
121 Community Development Loans Susquehanna is a leader in making community development loans in the Vineland assessment area. During the period evaluated, the bank originated four community development loans totaling $9.7 million. Three loans aggregating $9.6 million support economic development initiatives and one loan totaling $100 thousand supports affordable housing in the assessment area. INVESTMENT TEST The investment test evaluates a financial institution s level of qualified investments that serve low- or moderate-income census tracts or individuals. The test also considers the innovativeness and complexity of these investments. Qualified investments made prior to the previous evaluation, which are still outstanding, are considered under the test. For purposes of CRA, the term qualified investment includes a lawful investment, deposit, membership share, or grant that has as its primary purpose community development. Performance under the investment test is satisfactory in the Vineland assessment area. Of Susquehanna s total current investments, 2% are attributed to this assessment area. Volume of Investment and Grant Activity A review of investment activity revealed that Susquehanna has an adequate level of qualified community development investments and grants in the Vineland MSA. Overall, investments aggregate $1.6 million. The substantial majority of these investments (99%) support affordable housing. The remaining 1% of investments supports the provision of community development services. Of the bank s investments, $254,000 are targeted mortgage-backed securities containing residential mortgage loans originated to low- and moderate-income borrowers, or inside low- and moderate-income census tracts. This assessment area also has a $1.4 million share in New Jersey Housing and Mortgage Finance Authority Multi-Family Housing Revenue Bonds which finance affordable multifamily properties in New Jersey. In addition to these investments, the bank made grants and contributions to various organizations that routinely provide affordable housing and community development services that benefit lowand moderate-income individuals and areas. During the period evaluated, the bank made $22 thousand in qualified grants and donations that benefit the Vineland MSA. Responsiveness to Credit and Community Development Needs Susquehanna exhibits adequate responsiveness to credit and community development needs through the use of investments. A large portion of the bank's investments support affordable housing in an area with a low per capita income which makes homeownership difficult for many low- and moderate-income residents. 118
122 SERVICE TEST The service test evaluates the financial services provided by a financial institution using the following characteristics: the accessibility of delivery mechanisms within an assessment area, including the distribution of an institution s branch offices and alternative delivery mechanisms; the impact of changes in branch locations upon low- and moderate-income census tracts and/or low- and moderate-income persons in the assessment area; the reasonableness of business hours and services in meeting assessment area needs; and the extent to which an institution provides community development services. The bank s performance under the service test is rated high satisfactory in the Vineland MSA. Accessibility of Delivery Systems The bank s delivery systems are accessible to essentially all portions of its assessment area. Susquehanna operates 7 branches in the Vineland MSA. Overall, 29 percent of the branches are located in moderate-income census tracts while 23 percent of the population reside in these similar census tracts. The following table details the locations of the bank s branches in the Vineland MSA, compared to the population. Geography Number of Branches Percent Total Population Percent Low-income 0 0 7,426 5 Moderate-income , Middle-income , Upper-income , TOTALS 7 100% 146, % Alternative Retail Banking Services and Alternative Methods of Delivering Retail Banking Services To supplement traditional banking services, Susquehanna offers Internet banking on By accessing Susquehanna s Internet Banker, customers can view account balances, transfer funds between accounts, pay bills, open new accounts and issue stop payments. In addition, customers can bank by phone through a toll-free automated system which allows customers to access account information, open new accounts, renew CDs, apply for loans, or transfer funds. Changes in Branch Locations Susquehanna s record of opening and closing branches in the Vineland MSA has not adversely affected the accessibility of its delivery systems in low- and moderate-income census tracts or to low- and moderate-income individuals. The bank has not opened or closed any branches in this assessment area during the evaluation period. 119
123 Reasonableness of Business Hours and Services in Meeting Assessment Area Needs Services, including business hours, do not vary among branch offices in a way that inconveniences portions of the assessment area, particularly low- and moderate-income census tracts or individuals. Susquehanna offers banking services in a uniform and consistent manner among all its branches. Community Development Services Susquehanna provides a relatively high level of community development services that are tailored to the convenience and needs of its assessment area. The most notable services include: A bank employee serves on the economic restructuring committee of the Vineland Downtown Improvement District, a nonprofit community development organization that supports businesses in the downtown district. The City of Vineland s redevelopment area is designated as a New Jersey Urban Enterprise Zone and a Federal Empowerment Zone. A bank employee serves as the Vice President of AHOME, Inc., a non-profit organization that provides credit and financial counseling to low- and moderate-income families. The organization also assists these families in finding affordable housing. A bank employee serves as the Chairman of the Finance Committee of the Vineland- Millville Urban Enterprise Zone, an area set aside for redevelopment and revitalization. A bank employee serves as the President of Roosevelt Park, a non-profit organization that provides housing to low-income senior citizens in Millville. Banking Products Susquehanna offers banking products that provide greater access to banking services for lowand moderate-income customers and small businesses. Susquehanna issued two commercial letters of credit in the Vineland assessment area. These letters of credit qualify as a community development service because the letters provided necessary credit support for community development initiatives in the assessment area. Both letters were issued to a for-profit company located in an Urban Enterprise Zone designated for redevelopment. The bank offers Free Checking, a basic checking account with no minimum balance requirement, no service charges, unlimited check writing, and free Internet banking. The account provides greater access to banking services for low- and moderate-income individuals. A NJ Consumer Checking account that offers a low-cost account designed for consumers who write eight or fewer checks per month. The account has a $1 minimum balance requirement and a $3.00 monthly service fee. There is an additional charge of $0.50 per check for all checks written in excess of eight. 120
124 Business Checking is an account designed for small businesses with limited transaction activity. The account has no minimum balance requirement and the first 150 items per month are free. This account provides greater access to banking services, including Internet bill payment, for local small businesses. 121
125 LIMITED REVIEW ASSESSMENT AREA CONCLUSIONS A limited review of Susquehanna s CRA performance was conducted in the Atlantic City, NJ, assessment area. While a full review was conducted and greater weight was given to the bank s performance in the Vineland-Millville-Bridgeton, NJ, MSA (Cumberland County), bank performance in the Atlantic City MSA was determined to be consistent with the performance in the full review assessment area. Facts and data reviewed, including performance and demographic information, can be found in the tables accompanying this report. Conclusions regarding performance, which did not impact the overall institution rating, are as follows: Assessment Area Lending Test Investment Test Service Test Atlantic City, NJ, MSA (Atlantic County) Consistent Consistent Consistent ATLANTIC CITY, NJ, METROPOLITAN STATISTICAL AREA Situated in southern New Jersey, the Atlantic City MSA consists of Atlantic County, which has a total population of 252,552 based on 2000 Census data. Susquehanna s assessment area includes the entire MSA, which contains 63 census tracts of which four are designated as low-income and eleven are moderate-income. All of the low-income census tracts and eight moderate-income tracts are located in Atlantic City. The remaining three moderate-income census tracts are located in Egg Harbor City and Pleasantville. Susquehanna entered the Atlantic City market in April According to the FDIC s Summary of Deposits, as of June 30, 2008, 16 depository institutions operate in the Atlantic City MSA. These institutions maintain a total of 85 branches holding $4.1 billion in deposits. Susquehanna has 6 branches holding $236 million in deposits in the assessment area. The bank ranks 7 th in the MSA with 6% of the retail deposit market. TD Bank has a strong presence in the market and is ranked 1 st with 24% of the deposit market. Of Susquehanna s total bank deposits, 3% are attributed to the Atlantic City assessment area. During the evaluation period, Susquehanna reported 123 home mortgage loans aggregating $17 million and 240 small business loans aggregating $39.4 million in Atlantic County. Of the total 123 home mortgage loans, 2% were originated in low- or moderate-income census tracts and 29% were made to low- and moderate-income borrowers. Of the total 240 small business loans, just 1% was originated in low- or moderate-income census tracts and 54% were made to small businesses. Susquehanna made one community development loan, aggregating $1.8 million, in the assessment area. The loan supports economic development in Atlantic City. The bank holds $1.6 million in qualified community development investments in the assessment area, largely targeted to affordable housing. Of Susquehanna s total current investments, 2% are attributed to this assessment area. 122
126 The following table shows Susquehanna s branch distribution by population level: Atlantic City, NJ Census Tracts Number of Branches Percent Branches Population Percent Population Low-income ,875 4 Moderate-income , Middle-income , Upper-income , Income Unknown 0 0 2,030 1 TOTALS 6 100% 252, % The demographics for the Atlantic City MSA are detailed in the following table. Income Categories Tract Distribution Susquehanna Bank Assessment Area Atlantic City, NJ, MSA (Atlantic County) Families by Tract Income Families < Poverty Level as % of Families by Tract Families by Family Income # % # % # % # % Low-income , , Moderate-income , , , Middle-income , , , Upper-income , , Unknown-income Total Assessment Area , , , Housing Housing Types by Tract Units by Tract Owner-occupied Rental Vacant # % % # % # % Low-income 5, , , Moderate-income 17,920 6, , , Middle-income 70,960 41, , , Upper-income 19,419 14, , , Unknown-income Total Assessment Area 114,090 63, , , Businesses by Tract & Revenue Size Total Businesses by Less Than or = $1 Revenue Not Tract Over $1 Million Million Reported # % # % # % # % Low-income Moderate-income 1, , Middle-income 6, , Upper-income 2, , Unknown-income Total Assessment Area 10, , Percentage of Total Businesses:
127 CRA APPENDICES 124
128 CRA APPENDIX A: GLOSSARY Aggregate lending: The number of loans originated and purchased by all reporting lenders in specified income categories as a percentage of the aggregate number of loans originated and purchased by all reporting lenders in the metropolitan area/assessment area. Block numbering area ( BNA ): A statistical subdivision of a county for grouping and numbering blocks in nonmetropolitan counties where local census statistical area committees have not established census tracts. A BNA does not cross county lines. Census tract: A small subdivision of metropolitan and other densely populated counties. Census tract boundaries do not cross county lines; however, they may cross the boundaries of metropolitan statistical areas. Census tracts usually have between 2,500 and 8,000 persons, and their physical size varies widely depending upon population density. Census tracts are designed to be homogeneous with respect to population characteristics, economic status, and living conditions to allow for statistical comparisons. Community development: Affordable housing (including multifamily rental housing) for lowor moderate-income individuals; community services targeted to low- or moderate-income individuals; activities that promote economic development by financing businesses or farms that meet the size eligibility standards of the Small Business Administration s Development Company or Small Business Investment Company programs (13 CFR ) or have gross annual revenues of $1 million or less; or, activities that revitalize or stabilize low- or moderateincome census tracts. Consumer loan(s): A loan(s) to one or more individuals for household, family, or other personal expenditures. A consumer loan does not include a home mortgage, small business, or small farm loan. This definition includes the following categories: motor vehicle loans, credit card loans, home equity loans, other secured consumer loans, and other unsecured consumer loans. Family: Includes a householder and one or more other persons living in the same household who are related to the householder by birth, marriage, or adoption. The number of family households always equals the number of families; however, a family household may also include nonrelatives living with the family. Families are classified by type as either a married-couple family or other family, which is further classified into male householder (a family with a male householder and no wife present) or female householder (a family with a female householder and no husband present). Full review: Performance under the lending, investment and service tests is analyzed considering performance context, quantitative factors (for example, geographic distribution, borrower distribution, and total number and dollar amount of investments), and qualitative factors (for example, innovativeness, complexity and responsiveness). Geography: A census tract or a block numbering area delineated by the U.S. Bureau of the Census in the most recent decennial census. 125
129 Home Mortgage Disclosure Act ( HMDA ): The statute that requires certain mortgage lenders that do business or have banking offices in a metropolitan statistical area to file annual summary reports of their mortgage lending activity. The reports include data such as race, gender and income of applications, amount of loan requested, and disposition of the application (for example, approved, denied, and withdrawn). Home mortgage loans: Includes home purchase and home improvement loans as defined in the HMDA regulation. This definition also includes multifamily (five or more families) dwelling loans, loans for the purchase of manufactured homes and refinancings of home improvement and home purchase loans. Household: Includes all persons occupying a housing unit. Persons not living in households are classified as living in group quarters. In 100 percent tabulations, the count of households always equals the count of occupied housing units. Limited review: Performance under the lending, investment and service tests is analyzed using only quantitative factors (for example, geographic distribution, borrower distribution, total number and dollar amount of investments, and branch distribution). Low-income: Individual income that is less than 50 percent of the area median income, or a median family income that is less than 50 percent, in the case of a geography. Market share: The number of loans originated and purchased by the institution as a percentage of the aggregate number of loans originated and purchased by all reporting lenders in the metropolitan area/assessment area. Metropolitan area ( MA ): Any primary metropolitan statistical area ( PMSA ), metropolitan statistical area ( MSA ) or consolidated metropolitan statistical area ( CMSA ) as defined by the Office of Management and Budget, with a population of 250 thousand or more, and any other area designated as such by the appropriate federal financial supervisory agency. Middle-income: Individual income that is at least 80 percent and less than 120 percent of the area median income, or a median family income that is at least 80 percent and less than 120 percent, in the case of a geography. Moderate-income: Individual income that is at least 50 percent and less than 80 percent of the area median income, or a median family income that is at least 50 percent and less than 80 percent, in the case of a geography. Multifamily: Refers to a residential structure that contains five or more units. Other products: Includes any unreported optional category of loans for which the institution collects and maintains data for consideration during a CRA examination. Examples of such activity include consumer loans and other loan data an institution may provide concerning its lending performance. 126
130 Owner-occupied units: Includes units occupied by the owner or co-owner, even if the unit has not been fully paid for or is mortgaged. Qualified investment: A qualified investment is defined as any lawful investment, deposit, membership share or grant that has as its primary purpose community development. Rated area: A rated area is a state or multi-state metropolitan area. For an institution with domestic branches in only one state, the institution s CRA rating would be the state rating. If an institution maintains domestic branches in more than one state, the institution will receive a rating for each state in which those branches are located. If an institution maintains domestic branches in two or more states within a multi-state metropolitan area, the institution will receive a rating for the multi-state metropolitan area. Small loan(s) to business(es): A loan included in loans to small businesses as defined in the Consolidated Report of Condition and Income ( Call Report ) and the Thrift Financial Reporting ( TFR ) instructions. These loans have original amounts of $1 million or less and typically are either secured by non-farm or nonresidential real estate or are classified as commercial and industrial loans. However, thrift institutions may also exercise the option to report loans secured by non-farm residential real estate as "small business loans" if the loans are reported on the TFR as non-mortgage, commercial loans. Small loan(s) to farm(s): A loan included in loans to small farms as defined in the instructions for preparation of the Call Report. These loans have original amounts of $500 thousand or less and are either secured by farmland, or are classified as loans to finance agricultural production and other loans to farmers. Upper-income: Individual income that is more than 120 percent of the area median income, or a median family income that is more than 120 percent, in the case of a geography. 127
131 CRA APPENDIX B: HMDA LOAN DISTRIBUTION TABLES 128
132 LOAN DISTRIBUTION TABLE ALLENTOWN-BETHLEHEM-EASTON ASSESSMENT AREA (LEHIGH AND NORTHAMPTON COUNTIES) Income Categories By Tract Income HMDA By Borrower Income # % $(000s) % # % $(000s) % Home Purchase Low 1 2.4% % % % Moderate % % % % Middle % 2, % % 1, % Upper % 1, % % 1, % Unknown 0 0.0% 0 0.0% 4 9.5% % Total % 5, % % 5, % Refinance Low 3 2.9% % 9 8.6% % Moderate % % % % Middle % 5, % % 2, % Upper % 2, % % 4, % Unknown 0 0.0% 0 0.0% 8 7.6% % Total % 9, % % 9, % Home Improvement Low 2 1.8% % % % Moderate % % % 1, % Middle % 3, % % % Upper % 2, % % 3, % Unknown 0 0.0% 0 0.0% 5 4.4% % Total % 6, % % 6, % Multi-Family Low 0 0.0% 0 0.0% 0 0.0% 0 0.0% Moderate 0 0.0% 0 0.0% 0 0.0% 0 0.0% Middle % % 0 0.0% 0 0.0% Upper 0 0.0% 0 0.0% 0 0.0% 0 0.0% Unknown 0 0.0% 0 0.0% % % Total % % % % HMDA Totals Low 6 2.3% % % 1, % Moderate % 2, % % 3, % Middle % 11, % % 4, % Upper % 7, % % 10, % Unknown 0 0.0% 0 0.0% % 2, % Total % 21, % % 21, % 129
133 SMALL BUSINESS LOAN DISTRIBUTION TABLE ALLENTOWN-BETHLEHEM- EASTON ASSESSMENT AREA (LEHIGH AND NORTHAMPTON COUNTIES) SMALL BUSINESS SMALL FARM # % $(000s) % # % $(000s) % By Tract Income Low % 1, % 0 0.0% 0 0.0% Moderate % 5, % 0 0.0% 0 0.0% Middle % 12, % % 2, % Upper % 9, % % 1, % Unknown 0 0.0% 0 0.0% 0 0.0% 0 0.0% Total % 28, % % 4, % By Revenue Total $1 Million or Less % 12, % % 3, % Over $1 Million % 9, % 2 8.3% % Not Known % 6, % 1 4.2% % Total % 28, % % 4, % By Loan Size $100,000 or less % 8, % % % $100,001 - $250, % 6, % % 1, % $250,001 - $1 Million (Bus)- $500k (Farm) % 13, % % 2, % Over $1 Million (Bus)-$500k (Farm) 0 0.0% 0 0.0% 0 0.0% 0 0.0% Total % 28, % % 4, % By Loan Size and Revenue $1 Million or Less $100,000 or less % 3, % % % $100,001 - $250, % 3, % % % $250,001 - $1 Million (Bus)- $500k (Farm) % 6, % % 2, % Over $1 Million (Bus)-$500k (Farm) 0 0.0% 0 0.0% 0 0.0% 0 0.0% Total % 12, % % 3, % 130
134 LOAN DISTRIBUTION TABLE ATLANTIC CITY HMDA By Tract Income By Borrower Income Income Categories # % $(000s) % # % $(000s) % Home Purchase Low 0 0.0% 0 0.0% 0 0.0% 0 0.0% Moderate 0 0.0% 0 0.0% 1 5.9% % Middle % 6, % % % Upper % % % 5, % Unknown 0 0.0% 0 0.0% % % Total % 6, % % 6, % Refinance Low 0 0.0% 0 0.0% % % Moderate 0 0.0% 0 0.0% % % Middle % 3, % 2 4.8% % Upper % 2, % % 3, % Unknown 0 0.0% 0 0.0% 3 7.1% 1, % Total % 5, % % 5, % Home Improvement Low 1 1.6% % 3 4.8% % Moderate 1 1.6% % % % Middle % 4, % % % Upper 3 4.8% % % 2, % Unknown 0 0.0% 0 0.0% 2 3.2% % Total % 4, % % 4, % Multi-Family Low 0 0.0% 0 0.0% 0 0.0% 0 0.0% Moderate 0 0.0% 0 0.0% 0 0.0% 0 0.0% Middle % % 0 0.0% 0 0.0% Upper 0 0.0% 0 0.0% 0 0.0% 0 0.0% Unknown 0 0.0% 0 0.0% % % Total % % % % HMDA Totals Low 1 0.8% % 9 7.3% % Moderate 1 0.8% % % 1, % Middle % 14, % % 1, % Upper % 2, % % 10, % Unknown 0 0.0% 0 0.0% % 3, % Total % 17, % % 17, % 131
135 SMALL BUSINESS LOAN DISTRIBUTION TABLE ATLANTIC CITY SMALL BUSINESS SMALL FARM # % $(000s) % # % $(000s) % By Tract Income Low 0 0.0% 0 0.0% 0 0.0% 0 0.0% Moderate 2 0.8% % 0 0.0% 0 0.0% Middle % 37, % % % Upper % 1, % % % Unknown 0 0.0% 0 0.0% 0 0.0% 0 0.0% Tract Unknown 0 0.0% 0 0.0% 0 0.0% 0 0.0% Total % 39, % % % By Revenue Total $1 Million or Less % 16, % 0 0.0% 0 0.0% Over $1 Million % 22, % % % Not Known % % 0 0.0% 0 0.0% Total % 39, % % % By Loan Size $100,000 or less % 7, % % % $100,001 - $250, % 7, % % % $250,001 - $1 Million (Bus)- $500k (Farm) % 24, % % % Over $1 Million (Bus)-$500k (Farm) 0 0.0% 0 0.0% 0 0.0% 0 0.0% Total % 39, % % % By Loan Size and Revenue $1 Million or Less $100,000 or less % 4, % 0 0.0% 0 0.0% $100,001 - $250, % 2, % 0 0.0% 0 0.0% $250,001 - $1 Million (Bus)- $500k (Farm) % 8, % 0 0.0% 0 0.0% Over $1 Million (Bus)-$500k (Farm) 0 0.0% 0 0.0% 0 0.0% 0 0.0% Total % 16, % 0 0.0% 0 0.0% 132
136 LOAN DISTRIBUTION TABLE BALTIMORE-TOWSON HMDA By Tract Income By Borrower Income Income Categories # % $(000s) % # % $(000s) % Home Purchase Low 8 6.6% % % 1, % Moderate % 4, % % 3, % Middle % 17, % % 4, % Upper % 17, % % 24, % Unknown 0 0.0% 0 0.0% % 6, % Total % 40, % % 40, % Refinance Low 0 0.0% 0 0.0% % 1, % Moderate % 2, % % 3, % Middle % 13, % % 6, % Upper % 16, % % 15, % Unknown 0 0.0% 0 0.0% % 5, % Total % 32, % % 32, % Home Improvement Low 2 1.3% % 9 5.8% % Moderate 8 5.2% % % 1, % Middle % 6, % % 2, % Upper % 7, % % 9, % Unknown 0 0.0% 0 0.0% 8 5.2% % Total % 14, % % 14, % Multi-Family Low % 2, % 0 0.0% 0 0.0% Moderate % 1, % 0 0.0% 0 0.0% Middle 0 0.0% 0 0.0% 0 0.0% 0 0.0% Upper % 5, % 0 0.0% 0 0.0% Unknown 0 0.0% 0 0.0% % 9, % Total % 9, % % 9, % HMDA Totals Low % 3, % % 3, % Moderate % 8, % % 8, % Middle % 37, % % 13, % Upper % 47, % % 49, % Unknown 0 0.0% 0 0.0% % 21, % Total % 96, % % 96, % 133
137 SMALL BUSINESS LOAN DISTRIBUTION TABLE BALTIMORE-TOWSON SMALL BUSINESS SMALL FARM # % $(000s) % # % $(000s) % By Tract Income Low % 4, % 0 0.0% 0 0.0% Moderate % 20, % 0 0.0% 0 0.0% Middle % 75, % % % Upper % 60, % 0 0.0% 0 0.0% Unknown 0 0.0% 0 0.0% 0 0.0% 0 0.0% Total % 160, % % % By Revenue Total $1 Million or Less % 58, % % % Over $1 Million % 98, % % % Not Known % 3, % 0 0.0% 0 0.0% Total % 160, % % % By Loan Size $100,000 or less % 20, % % % $100,001 - $250, % 34, % % % $250,001 - $1 Million (Bus)- $500k (Farm) % 105, % % % Over $1 Million (Bus)-$500k (Farm) 0 0.0% 0 0.0% 0 0.0% 0 0.0% Total % 160, % % % By Loan Size and Revenue $1 Million or Less $100,000 or less % 11, % 0 0.0% 0 0.0% $100,001 - $250, % 17, % % % $250,001 - $1 Million (Bus)- $500k (Farm) % 29, % 0 0.0% 0 0.0% Over $1 Million (Bus)-$500k (Farm) 0 0.0% 0 0.0% 0 0.0% 0 0.0% Total % 58, % % % 134
138 LOAN DISTRIBUTION TABLE ALLEGANY COUNTY, MD ASSESSMENT AREA (CUMBERLAND MSA) Income Categories By Tract Income HMDA By Borrower Income # % $(000s) % # % $(000s) % Home Purchase Low 0 0.0% 0 0.0% 1 3.7% % Moderate 1 3.7% % 2 7.4% % Middle % 2, % % % Upper % % % 2, % Unknown 0 0.0% 0 0.0% 2 7.4% % Total % 3, % % 3, % Refinance Low 0 0.0% 0 0.0% 6 6.6% % Moderate 2 2.2% % % % Middle % 3, % % 1, % Upper % 1, % % 3, % Unknown 0 0.0% 0 0.0% 2 2.2% % Total % 5, % % 5, % Home Improvement Low 0 0.0% 0 0.0% % % Moderate 7 7.1% % % % Middle % 2, % % % Upper % % % 1, % Unknown 0 0.0% 0 0.0% 0 0.0% 0 0.0% Total % 2, % % 2, % Multi-Family Low 0 0.0% 0 0.0% 0 0.0% 0 0.0% Moderate 0 0.0% 0 0.0% 0 0.0% 0 0.0% Middle % % 0 0.0% 0 0.0% Upper 0 0.0% 0 0.0% 0 0.0% 0 0.0% Unknown 0 0.0% 0 0.0% % % Total % % % % HMDA Totals Low 0 0.0% 0 0.0% % % Moderate % % % % Middle % 8, % % 2, % Upper % 3, % % 7, % Unknown 0 0.0% 0 0.0% 6 2.8% % Total % 12, % % 12, % 135
139 SMALL BUSINESS LOAN DISTRIBUTION TABLE ALLEGANY COUNTY, MD, ASSESSMENT AREA (CUMBERLAND MSA) SMALL BUSINESS SMALL FARM # % $(000s) % # % $(000s) % By Tract Income Low 0 0.0% 0 0.0% 0 0.0% 0 0.0% Moderate 4 3.1% % 0 0.0% 0 0.0% Middle % 10, % % % Upper % 5, % 0 0.0% 0 0.0% Unknown 0 0.0% 0 0.0% 0 0.0% 0 0.0% Total % 16, % % % By Revenue Total $1 Million or Less % 5, % % % Over $1 Million % 11, % 0 0.0% 0 0.0% Not Known 1 0.8% % 0 0.0% 0 0.0% Total % 16, % % % By Loan Size $100,000 or less % 4, % % % $100,001 - $250, % 3, % 0 0.0% 0 0.0% $250,001 - $1 Million (Bus)- $500k (Farm) % 8, % 0 0.0% 0 0.0% Over $1 Million (Bus)-$500k (Farm) 0 0.0% 0 0.0% 0 0.0% 0 0.0% Total % 16, % % % By Loan Size and Revenue $1 Million or Less $100,000 or less % 2, % % % $100,001 - $250, % % 0 0.0% 0 0.0% $250,001 - $1 Million (Bus)- $500k (Farm) 5 7.0% 1, % 0 0.0% 0 0.0% Over $1 Million (Bus)-$500k (Farm) 0 0.0% 0 0.0% 0 0.0% 0 0.0% Total % 5, % % % 136
140 LOAN DISTRIBUTION TABLE GARRETT COUNTY, MD, NON-METROPOLITAN ASSESSMENT AREA Income Categories By Tract Income HMDA By Borrower Income # % $(000s) % # % $(000s) % Home Purchase Low 0 0.0% 0 0.0% % 1, % Moderate % 2, % % % Middle % 2, % 2 8.3% % Upper 0 0.0% 0 0.0% % 2, % Unknown 0 0.0% 0 0.0% 2 8.3% % Total % 5, % % 5, % Refinance Low 0 0.0% 0 0.0% 1 2.9% % Moderate % 3, % % % Middle % 1, % % 1, % Upper 0 0.0% 0 0.0% % 2, % Unknown 0 0.0% 0 0.0% 2 5.9% % Total % 4, % % 4, % Home Improvement Low 0 0.0% 0 0.0% % % Moderate % % % % Middle % % % % Upper 0 0.0% 0 0.0% % % Unknown 0 0.0% 0 0.0% 1 3.8% % Total % 1, % % 1, % Multi-Family Low 0 0.0% 0 0.0% 0 0.0% 0 0.0% Moderate % % 0 0.0% 0 0.0% Middle 0 0.0% 0 0.0% 0 0.0% 0 0.0% Upper 0 0.0% 0 0.0% 0 0.0% 0 0.0% Unknown 0 0.0% 0 0.0% % % Total % % % % HMDA Totals Low 0 0.0% 0 0.0% % 1, % Moderate % 6, % % 1, % Middle % 5, % % 1, % Upper 0 0.0% 0 0.0% % 5, % Unknown 0 0.0% 0 0.0% 6 7.1% 1, % Total % 11, % % 11, % 137
141 SMALL BUSINESS LOAN DISTRIBUTION TABLE GARRETT COUNTY, MD, NON- METROPOLITAN ASSESSMENT AREA SMALL BUSINESS SMALL FARM # % $(000s) % # % $(000s) % By Tract Income Low 0 0.0% 0 0.0% 0 0.0% 0 0.0% Moderate % 13, % % % Middle % 8, % 0 0.0% 0 0.0% Upper 0 0.0% 0 0.0% 0 0.0% 0 0.0% Unknown 0 0.0% 0 0.0% 0 0.0% 0 0.0% Total % 22, % % % By Revenue Total $1 Million or Less % 9, % % % Over $1 Million % 13, % 0 0.0% 0 0.0% Not Known 0 0.0% 0 0.0% 0 0.0% 0 0.0% Total % 22, % % % By Loan Size $100,000 or less % 7, % % % $100,001 - $250, % 3, % 0 0.0% 0 0.0% $250,001 - $1 Million (Bus)- $500k (Farm) % 11, % 0 0.0% 0 0.0% Over $1 Million (Bus)-$500k (Farm) 0 0.0% 0 0.0% 0 0.0% 0 0.0% Total % 22, % % % By Loan Size and Revenue $1 Million or Less $100,000 or less % 4, % % % $100,001 - $250, % 1, % 0 0.0% 0 0.0% $250,001 - $1 Million (Bus)- $500k (Farm) 6 3.8% 3, % 0 0.0% 0 0.0% Over $1 Million (Bus)-$500k (Farm) 0 0.0% 0 0.0% 0 0.0% 0 0.0% Total % 9, % % % 138
142 LOAN DISTRIBUTION TABLE HAGERSTOWN-MARTINSBURG, MD-WV, MSA HMDA By Tract Income By Borrower Income Income Categories # % $(000s) % # % $(000s) % Home Purchase Low 0 0.0% 0 0.0% 5 4.7% % Moderate % 2, % % 2, % Middle % 13, % % 3, % Upper % 6, % % 11, % Unknown 0 0.0% 0 0.0% % 5, % Total % 22, % % 22, % Refinance Low 1 0.5% % 9 4.6% % Moderate % 1, % % 3, % Middle % 16, % % 5, % Upper % 9, % % 12, % Unknown 0 0.0% 0 0.0% % 4, % Total % 27, % % 27, % Home Improvement Low 1 0.4% 6 0.0% % % Moderate % 1, % % 1, % Middle % 7, % % 2, % Upper % 3, % % 7, % Unknown 1 0.4% % 6 2.7% % Total % 12, % % 12, % Multi-Family Low % % 0 0.0% 0 0.0% Moderate 0 0.0% 0 0.0% 0 0.0% 0 0.0% Middle % 2, % 0 0.0% 0 0.0% Upper 0 0.0% 0 0.0% 0 0.0% 0 0.0% Unknown 0 0.0% 0 0.0% % 3, % Total % 3, % % 3, % HMDA Totals Low 3 0.6% % % 1, % Moderate % 4, % % 7, % Middle % 41, % % 11, % Upper % 19, % % 31, % Unknown 1 0.2% % % 14, % Total % 66, % % 66, % 139
143 SMALL BUSINESS LOAN DISTRIBUTION TABLE HAGERSTOWN-MARTINSBURG, MD-WV, MSA SMALL BUSINESS SMALL FARM # % $(000s) % # % $(000s) % By Tract Income Low % 3, % 0 0.0% 0 0.0% Moderate % 19, % 0 0.0% 0 0.0% Middle % 57, % % % Upper % 26, % % % Unknown 0 0.0% 0 0.0% 0 0.0% 0 0.0% Total 1, % 107, % % 1, % By Revenue Total $1 Million or Less % 32, % % 1, % Over $1 Million % 75, % 1 5.6% % Not Known 4 0.4% % 0 0.0% 0 0.0% Total 1, % 107, % % 1, % By Loan Size $100,000 or less % 27, % % % $100,001 - $250, % 19, % 1 5.6% % $250,001 - $1 Million (Bus)- $500k (Farm) % 59, % % 1, % Over $1 Million (Bus)-$500k (Farm) 0 0.0% 0 0.0% 0 0.0% 0 0.0% Total 1, % 107, % % 1, % By Loan Size and Revenue $1 Million or Less $100,000 or less % 7, % % % $100,001 - $250, % 6, % 1 5.9% % $250,001 - $1 Million (Bus)- $500k (Farm) % 17, % % % Over $1 Million (Bus)-$500k (Farm) 0 0.0% 0 0.0% 0 0.0% 0 0.0% Total % 32, % % 1, % 140
144 LOAN DISTRIBUTION TABLE HARRISBURG-CARLISLE, PA, ASSESSMENT AREA (CUMBERLAND AND DAUPHIN COUNTIES) Income Categories By Tract Income HMDA By Borrower Income # % $(000s) % # % $(000s) % Home Purchase Low 3 1.7% % % 1, % Moderate % 3, % % 6, % Middle % 14, % % 2, % Upper % 3, % % 7, % Unknown 0 0.0% 0 0.0% % 3, % Total % 21, % % 21, % Refinance Low 0 0.0% 0 0.0% % 1, % Moderate % 2, % % 4, % Middle % 18, % % 5, % Upper % 2, % % 9, % Unknown 0 0.0% 0 0.0% % 1, % Total % 22, % % 22, % Home Improvement Low 0 0.0% 0 0.0% % % Moderate % 1, % % 1, % Middle % 6, % % 2, % Upper % 1, % % 5, % Unknown 0 0.0% 0 0.0% 5 2.4% % Total % 9, % % 9, % Multi-Family Low 0 0.0% 0 0.0% 0 0.0% 0 0.0% Moderate % 12, % 0 0.0% 0 0.0% Middle % 18, % 0 0.0% 0 0.0% Upper 0 0.0% 0 0.0% 0 0.0% 0 0.0% Unknown 0 0.0% 0 0.0% % 31, % Total % 31, % % 31, % HMDA Totals Low 3 0.5% % % 3, % Moderate % 19, % % 12, % Middle % 58, % % 10, % Upper % 7, % % 22, % Unknown 0 0.0% 0 0.0% % 36, % Total % 85, % % 85, % 141
145 SMALL BUSINESS LOAN DISTRIBUTION TABLE HARRISBURG-CARLISLE, PA, ASSESSMENT AREA (CUMBERLAND AND DAUPHIN COUNTIES) SMALL BUSINESS SMALL FARM # % $(000s) % # % $(000s) % By Tract Income Low 0 0.0% 0 0.0% 0 0.0% 0 0.0% Moderate % 6, % 0 0.0% 0 0.0% Middle % 62, % % % Upper % 45, % % 1, % Unknown 0 0.0% 0 0.0% 0 0.0% 0 0.0% Total % 115, % % 1, % By Revenue Total $1 Million or Less % 28, % % 1, % Over $1 Million % 80, % 0 0.0% 0 0.0% Not Known % 6, % 1 6.7% % Total % 115, % % 1, % By Loan Size $100,000 or less % 28, % % % $100,001 - $250, % 41, % % % $250,001 - $1 Million (Bus)- $500k (Farm) % 45, % % % Over $1 Million (Bus)-$500k (Farm) 0 0.0% 0 0.0% 0 0.0% 0 0.0% Total % 115, % % 1, % By Loan Size and Revenue $1 Million or Less $100,000 or less % 6, % % % $100,001 - $250, % 8, % % % $250,001 - $1 Million (Bus)- $500k (Farm) % 13, % % % Over $1 Million (Bus)-$500k (Farm) 0 0.0% 0 0.0% 0 0.0% 0 0.0% Total % 28, % % 1, % 142
146 LOAN DISTRIBUTION TABLE LANCASTER MSA HMDA By Tract Income By Borrower Income Income Categories # % $(000s) % # % $(000s) % Home Purchase Low 8 1.9% % % 2, % Moderate % 6, % % 17, % Middle % 51, % % 13, % Upper % 7, % % 25, % Unknown 0 0.0% 0 0.0% % 6, % Total % 66, % % 66, % Refinance Low 3 0.5% % % 3, % Moderate % 2, % % 6, % Middle % 51, % % 14, % Upper % 7, % % 32, % Unknown 0 0.0% 0 0.0% % 5, % Total % 62, % % 62, % Home Improvement Low 1 0.2% % % % Moderate % % % 3, % Middle % 23, % % 8, % Upper % 1, % % 11, % Unknown 0 0.0% 0 0.0% % 1, % Total % 26, % % 26, % Multi-Family Low 0 0.0% 0 0.0% 0 0.0% 0 0.0% Moderate % % 0 0.0% 0 0.0% Middle % 14, % 0 0.0% 0 0.0% Upper 0 0.0% 0 0.0% 0 0.0% 0 0.0% Unknown 0 0.0% 0 0.0% % 15, % Total % 15, % % 15, % HMDA Totals Low % 1, % % 6, % Moderate % 10, % % 28, % Middle 1, % 140, % % 35, % Upper % 17, % % 69, % Unknown 0 0.0% 0 0.0% % 29, % Total 1, % 170, % 1, % 170, % 143
147 SMALL BUSINESS LOAN DISTRIBUTION TABLE LANCASTER MSA SMALL BUSINESS SMALL FARM # % $(000s) % # % $(000s) % By Tract Income Low % 4, % 0 0.0% 0 0.0% Moderate % 7, % % 1, % Middle 1, % 209, % % 21, % Upper % 33, % 2 0.7% % Unknown 0 0.0% 0 0.0% 0 0.0% 0 0.0% Total 1, % 255, % % 22, % By Revenue Total $1 Million or Less % 93, % % 15, % Over $1 Million % 136, % % 3, % Not Known % 25, % % 3, % Total 1, % 255, % % 22, % By Loan Size $100,000 or less 1, % 43, % % 8, % $100,001 - $250, % 48, % % 8, % $250,001 - $1 Million (Bus)- $500k (Farm) % 163, % % 6, % Over $1 Million (Bus)-$500k (Farm) 0 0.0% 0 0.0% 0 0.0% 0 0.0% Total 1, % 255, % % 22, % By Loan Size and Revenue $1 Million or Less $100,000 or less % 23, % % 5, % $100,001 - $250, % 23, % % 6, % $250,001 - $1 Million (Bus)- $500k (Farm) % 46, % % 4, % Over $1 Million (Bus)-$500k (Farm) 0 0.0% 0 0.0% 0 0.0% 0 0.0% Total % 93, % % 15, % 144
148 LOAN DISTRIBUTION TABLE NORTH CENTRAL PENNSYLVANIA NON- METROPOLITAN ASSESSMENT AREA (NORTHUMBERLAND, SCHUYLKILL, SNYDER, AND UNION) Income Categories By Tract Income HMDA By Borrower Income # % $(000s) % # % $(000s) % Home Purchase Low 0 0.0% 0 0.0% % 1, % Moderate % 3, % % 5, % Middle % 22, % % 6, % Upper % 6, % % 13, % Unknown 0 0.0% 0 0.0% % 4, % Total % 31, % % 31, % Refinance Low 0 0.0% 0 0.0% % 1, % Moderate % 3, % % 4, % Middle % 30, % % 7, % Upper % 5, % % 18, % Unknown 0 0.0% 0 0.0% % 6, % Total % 38, % % 38, % Home Improvement Low 0 0.0% 0 0.0% % % Moderate % 1, % % 2, % Middle % 12, % % 3, % Upper % 2, % % 9, % Unknown 0 0.0% 0 0.0% % % Total % 16, % % 16, % Multi-Family Low 0 0.0% 0 0.0% 0 0.0% 0 0.0% Moderate % % 0 0.0% 0 0.0% Middle % 1, % 0 0.0% 0 0.0% Upper 0 0.0% 0 0.0% 0 0.0% 0 0.0% Unknown 0 0.0% 0 0.0% % 2, % Total % 2, % % 2, % HMDA Totals Low 0 0.0% 0 0.0% % 3, % Moderate % 8, % % 12, % Middle % 66, % % 17, % Upper % 14, % % 41, % Unknown 0 0.0% 0 0.0% % 13, % Total 1, % 89, % 1, % 89, % 145
149 SMALL BUSINESS LOAN DISTRIBUTION TABLE NORTH CENTRAL PENNSYLVANIA NON-METROPOLITAN ASSESSMENT AREA (NORTHUMBERLAND, SCHUYLKILL, SNYDER, AND UNION) SMALL BUSINESS SMALL FARM # % $(000s) % # % $(000s) % By Tract Income Low 0 0.0% 0 0.0% 0 0.0% 0 0.0% Moderate % 12, % 5 6.5% % Middle % 55, % % 6, % Upper % 11, % % 2, % Unknown 0 0.0% 0 0.0% 0 0.0% 0 0.0% Total % 78, % % 9, % By Revenue Total $1 Million or Less % 28, % % 6, % Over $1 Million % 41, % % 1, % Not Known % 8, % 7 9.1% % Total % 78, % % 9, % By Loan Size $100,000 or less % 15, % % 2, % $100,001 - $250, % 21, % % 4, % $250,001 - $1 Million (Bus)- $500k (Farm) % 41, % % 2, % Over $1 Million (Bus)-$500k (Farm) 0 0.0% 0 0.0% 0 0.0% 0 0.0% Total % 78, % % 9, % By Loan Size and Revenue $1 Million or Less $100,000 or less % 8, % % 1, % $100,001 - $250, % 10, % % 2, % $250,001 - $1 Million (Bus)- $500k (Farm) % 10, % % 2, % Over $1 Million (Bus)-$500k (Farm) 0 0.0% 0 0.0% 0 0.0% 0 0.0% Total % 28, % % 6, % 146
150 LOAN DISTRIBUTION TABLE PHILADELPHIA-CAMDEN, PA-NJ ASSESSMENT AREA Income Categories By Tract Income HMDA By Borrower Income # % $(000s) % # % $(000s) % Home Purchase Low % 2, % % 2, % Moderate % 2, % % 4, % Middle % 13, % % 3, % Upper % 10, % % 9, % Unknown 0 0.0% 0 0.0% % 8, % Total % 29, % % 29, % Refinance Low 6 2.3% 1, % % 1, % Moderate % 1, % % 4, % Middle % 15, % % 5, % Upper % 12, % % 16, % Unknown 0 0.0% 0 0.0% % 4, % Total % 31, % % 31, % Home Improvement Low 4 1.3% % % % Moderate % % % 2, % Middle % 10, % % 4, % Upper % 6, % % 9, % Unknown 0 0.0% 0 0.0% % % Total % 18, % % 18, % Multi-Family Low % 2, % 0 0.0% 0 0.0% Moderate % % 0 0.0% 0 0.0% Middle % 8, % 0 0.0% 0 0.0% Upper 0 0.0% 0 0.0% 0 0.0% 0 0.0% Unknown 0 0.0% 0 0.0% % 10, % Total % 10, % % 10, % HMDA Totals Low % 6, % % 4, % Moderate % 4, % % 11, % Middle % 48, % % 13, % Upper % 29, % % 35, % Unknown 0 0.0% 0 0.0% % 24, % Total % 89, % % 89, % 147
151 SMALL BUSINESS LOAN DISTRIBUTION TABLE PHILADELPHIA-CAMDEN, PA- NJ, ASSESSMENT AREA SMALL BUSINESS SMALL FARM # % $(000s) % # % $(000s) % By Tract Income Low % 4, % 0 0.0% 0 0.0% Moderate % 33, % 0 0.0% 0 0.0% Middle % 67, % % 2, % Upper % 83, % % 1, % Unknown 2 0.2% % 0 0.0% 0 0.0% Total 1, % 189, % % 3, % By Revenue Total $1 Million or Less % 58, % % 3, % Over $1 Million % 112, % 1 3.3% % Not Known % 18, % % % Total 1, % 189, % % 3, % By Loan Size $100,000 or less % 26, % % % $100,001 - $250, % 43, % % 2, % $250,001 - $1 Million (Bus)- $500k (Farm) % 119, % 2 6.7% % Over $1 Million (Bus)-$500k (Farm) 0 0.0% 0 0.0% 0 0.0% 0 0.0% Total 1, % 189, % % 3, % By Loan Size and Revenue $1 Million or Less $100,000 or less % 11, % % % $100,001 - $250, % 15, % % 1, % $250,001 - $1 Million (Bus)- $500k (Farm) % 31, % 2 8.7% % Over $1 Million (Bus)-$500k (Farm) 0 0.0% 0 0.0% 0 0.0% 0 0.0% Total % 58, % % 3, % 148
152 LOAN DISTRIBUTION TABLE READING MSA HMDA By Tract Income By Borrower Income Income Categories # % $(000s) % # % $(000s) % Home Purchase Low 3 2.8% % 3 2.8% % Moderate % 1, % % 2, % Middle % 10, % % 2, % Upper % 3, % % 8, % Unknown 0 0.0% 0 0.0% % 1, % Total % 16, % % 16, % Refinance Low 3 1.6% % % % Moderate 7 3.7% % % 1, % Middle % 14, % % 3, % Upper % 4, % % 12, % Unknown 0 0.0% 0 0.0% % 1, % Total % 19, % % 19, % Home Improvement Low 7 4.3% % % % Moderate % % % % Middle % 7, % % 1, % Upper % 1, % % 6, % Unknown 0 0.0% 0 0.0% 8 5.0% % Total % 9, % % 9, % Multi-Family Low % % 0 0.0% 0 0.0% Moderate % % 0 0.0% 0 0.0% Middle % 1, % 0 0.0% 0 0.0% Upper % % 0 0.0% 0 0.0% Unknown 0 0.0% 0 0.0% % 2, % Total % 2, % % 2, % HMDA Totals Low % % % 1, % Moderate % 3, % % 5, % Middle % 33, % % 8, % Upper % 10, % % 26, % Unknown 0 0.0% 0 0.0% % 6, % Total % 48, % % 48, % 149
153 SMALL BUSINESS LOAN DISTRIBUTION TABLE READING MSA SMALL BUSINESS SMALL FARM # % $(000s) % # % $(000s) % By Tract Income Low % 2, % 0 0.0% 0 0.0% Moderate % % 0 0.0% 0 0.0% Middle % 37, % % 5, % Upper % 27, % 1 2.0% % Unknown 0 0.0% 0 0.0% 0 0.0% 0 0.0% Total % 68, % % 5, % By Revenue Total $1 Million or Less % 29, % % 3, % Over $1 Million % 27, % % 1, % Not Known % 11, % % % Total % 68, % % 5, % By Loan Size $100,000 or less % 14, % % 1, % $100,001 - $250, % 16, % % 2, % $250,001 - $1 Million (Bus)- $500k (Farm) % 38, % % 2, % Over $1 Million (Bus)-$500k (Farm) 0 0.0% 0 0.0% 0 0.0% 0 0.0% Total % 68, % % 5, % By Loan Size and Revenue $1 Million or Less $100,000 or less % 6, % % % $100,001 - $250, % 6, % % 1, % $250,001 - $1 Million (Bus)- $500k (Farm) % 15, % % 1, % Over $1 Million (Bus)-$500k (Farm) 0 0.0% 0 0.0% 0 0.0% 0 0.0% Total % 29, % % 3, % 150
154 LOAN DISTRIBUTION TABLE SCRANTON-WILKES-BARRE ASSESSMENT AREA (LUZERNE COUNTY) Income Categories By Tract Income HMDA By Borrower Income # % $(000s) % # % $(000s) % Home Purchase Low 0 0.0% 0 0.0% 0 0.0% 0 0.0% Moderate 0 0.0% 0 0.0% 0 0.0% 0 0.0% Middle % % 0 0.0% 0 0.0% Upper % % 0 0.0% 0 0.0% Unknown 0 0.0% 0 0.0% 0 0.0% 0 0.0% Total % 1, % 0 0.0% 0 0.0% Refinance Low 0 0.0% 0 0.0% 0 0.0% 0 0.0% Moderate 4 7.1% % 0 0.0% 0 0.0% Middle % 2, % 0 0.0% 0 0.0% Upper % 1, % 0 0.0% 0 0.0% Unknown 0 0.0% 0 0.0% 0 0.0% 0 0.0% Total % 3, % 0 0.0% 0 0.0% Home Improvement Low 0 0.0% 0 0.0% 0 0.0% 0 0.0% Moderate 7 8.9% % 0 0.0% 0 0.0% Middle % 1, % 0 0.0% 0 0.0% Upper % % 0 0.0% 0 0.0% Unknown 0 0.0% 0 0.0% 0 0.0% 0 0.0% Total % 2, % 0 0.0% 0 0.0% Multi-Family Low 0 0.0% 0 0.0% 0 0.0% 0 0.0% Moderate % % 0 0.0% 0 0.0% Middle 0 0.0% 0 0.0% 0 0.0% 0 0.0% Upper 0 0.0% 0 0.0% 0 0.0% 0 0.0% Unknown 0 0.0% 0 0.0% 0 0.0% 0 0.0% Total % % 0 0.0% 0 0.0% HMDA Totals Low 0 0.0% 0 0.0% 0 0.0% 0 0.0% Moderate % % 0 0.0% 0 0.0% Middle % 4, % 0 0.0% 0 0.0% Upper % 3, % 0 0.0% 0 0.0% Unknown 0 0.0% 0 0.0% 0 0.0% 0 0.0% Total % 8, % 0 0.0% 0 0.0% 151
155 SMALL BUSINESS LOAN DISTRIBUTION TABLE SCRANTON-WILKES-BARRE ASSESSMENT AREA (LUZERNE COUNTY) SMALL BUSINESS SMALL FARM # % $(000s) % # % $(000s) % By Tract Income Low 0 0.0% 0 0.0% 0 0.0% 0 0.0% Moderate % 1, % 0 0.0% 0 0.0% Middle % 4, % 0 0.0% 0 0.0% Upper % 3, % % % Unknown 0 0.0% 0 0.0% 0 0.0% 0 0.0% Total % 9, % % % By Revenue Total $1 Million or Less % 6, % % % Over $1 Million % 1, % 0 0.0% 0 0.0% Not Known % 1, % 0 0.0% 0 0.0% Total % 9, % % % By Loan Size $100,000 or less % 3, % % % $100,001 - $250, % 4, % 0 0.0% 0 0.0% $250,001 - $1 Million (Bus)- $500k (Farm) 6 6.5% 2, % % % Over $1 Million (Bus)-$500k (Farm) 0 0.0% 0 0.0% 0 0.0% 0 0.0% Total % 9, % % % By Loan Size and Revenue $1 Million or Less $100,000 or less % 1, % % % $100,001 - $250, % 2, % 0 0.0% 0 0.0% $250,001 - $1 Million (Bus)- $500k (Farm) 4 6.8% 1, % % % Over $1 Million (Bus)-$500k (Farm) 0 0.0% 0 0.0% 0 0.0% 0 0.0% Total % 6, % % % 152
156 LOAN DISTRIBUTION TABLE SCRANTON-WILKES-BARRE ASSESSMENT AREA (LUZERNE COUNTY) Income Categories By Tract Income HMDA By Borrower Income # % $(000s) % # % $(000s) % Home Purchase Low 0 0.0% 0 0.0% 0 0.0% 0 0.0% Moderate 0 0.0% 0 0.0% 0 0.0% 0 0.0% Middle % % 0 0.0% 0 0.0% Upper % % 0 0.0% 0 0.0% Unknown 0 0.0% 0 0.0% 0 0.0% 0 0.0% Total % 1, % 0 0.0% 0 0.0% Refinance Low 0 0.0% 0 0.0% 0 0.0% 0 0.0% Moderate 4 7.1% % 0 0.0% 0 0.0% Middle % 2, % 0 0.0% 0 0.0% Upper % 1, % 0 0.0% 0 0.0% Unknown 0 0.0% 0 0.0% 0 0.0% 0 0.0% Total % 3, % 0 0.0% 0 0.0% Home Improvement Low 0 0.0% 0 0.0% 0 0.0% 0 0.0% Moderate 7 8.9% % 0 0.0% 0 0.0% Middle % 1, % 0 0.0% 0 0.0% Upper % % 0 0.0% 0 0.0% Unknown 0 0.0% 0 0.0% 0 0.0% 0 0.0% Total % 2, % 0 0.0% 0 0.0% Multi-Family Low 0 0.0% 0 0.0% 0 0.0% 0 0.0% Moderate % % 0 0.0% 0 0.0% Middle 0 0.0% 0 0.0% 0 0.0% 0 0.0% Upper 0 0.0% 0 0.0% 0 0.0% 0 0.0% Unknown 0 0.0% 0 0.0% 0 0.0% 0 0.0% Total % % 0 0.0% 0 0.0% HMDA Totals Low 0 0.0% 0 0.0% 0 0.0% 0 0.0% Moderate % % 0 0.0% 0 0.0% Middle % 4, % 0 0.0% 0 0.0% Upper % 3, % 0 0.0% 0 0.0% Unknown 0 0.0% 0 0.0% 0 0.0% 0 0.0% Total % 8, % 0 0.0% 0 0.0% 153
157 SMALL BUSINESS LOAN DISTRIBUTION TABLE CRANTON-WILKES-BARRE ASSESSMENT AREA (LUZERNE COUNTY) SMALL BUSINESS SMALL FARM # % $(000s) % # % $(000s) % By Tract Income Low 0 0.0% 0 0.0% 0 0.0% 0 0.0% Moderate % 1, % 0 0.0% 0 0.0% Middle % 4, % 0 0.0% 0 0.0% Upper % 3, % % % Unknown 0 0.0% 0 0.0% 0 0.0% 0 0.0% Total % 9, % % % By Revenue Total $1 Million or Less % 6, % % % Over $1 Million % 1, % 0 0.0% 0 0.0% Not Known % 1, % 0 0.0% 0 0.0% Total % 9, % % % By Loan Size $100,000 or less % 3, % % % $100,001 - $250, % 4, % 0 0.0% 0 0.0% $250,001 - $1 Million (Bus)- $500k (Farm) 6 6.5% 2, % % % Over $1 Million (Bus)-$500k (Farm) 0 0.0% 0 0.0% 0 0.0% 0 0.0% Total % 9, % % % By Loan Size and Revenue $1 Million or Less $100,000 or less % 1, % % % $100,001 - $250, % 2, % 0 0.0% 0 0.0% $250,001 - $1 Million (Bus)- $500k (Farm) 4 6.8% 1, % % % Over $1 Million (Bus)-$500k (Farm) 0 0.0% 0 0.0% 0 0.0% 0 0.0% Total % 6, % % % 154
158 LOAN DISTRIBUTION TABLE SOUTH CENTRAL PENNSYLVANIA ASSESSMENT AREA (BEDFORD, FRANKLIN, FULTON AND HUNTINGDON) Income Categories By Tract Income HMDA By Borrower Income # % $(000s) % # % $(000s) % Home Purchase Low 0 0.0% 0 0.0% 5 3.5% % Moderate % 2, % % 2, % Middle % 15, % % 4, % Upper % 5, % % 12, % Unknown 0 0.0% 0 0.0% % 3, % Total % 22, % % 22, % Refinance Low 0 0.0% 0 0.0% % % Moderate % 1, % % 2, % Middle % 19, % % 3, % Upper % 6, % % 18, % Unknown 0 0.0% 0 0.0% 7 3.1% 1, % Total % 26, % % 26, % Home Improvement Low 0 0.0% 0 0.0% % % Moderate % % % % Middle % 6, % % 1, % Upper % 2, % % 5, % Unknown 0 0.0% 0 0.0% % % Total % 9, % % 9, % Multi-Family Low 0 0.0% 0 0.0% 0 0.0% 0 0.0% Moderate % % 0 0.0% 0 0.0% Middle % 1, % 0 0.0% 0 0.0% Upper 0 0.0% 0 0.0% 0 0.0% 0 0.0% Unknown 0 0.0% 0 0.0% % 1, % Total % 1, % % 1, % HMDA Totals Low 0 0.0% 0 0.0% % 1, % Moderate % 4, % % 5, % Middle % 42, % % 9, % Upper % 14, % % 36, % Unknown 0 0.0% 0 0.0% % 8, % Total % 61, % % 61, % 155
159 SMALL BUSINESS LOAN DISTRIBUTION TABLE SOUTH CENTRAL PENNSYLVANIA ASSESSMENT AREA (BEDFORD, FRANKLIN, FULTON AND HUNTINGDON) SMALL BUSINESS SMALL FARM # % $(000s) % # % $(000s) % By Tract Income Low 0 0.0% 0 0.0% 0 0.0% 0 0.0% Moderate % 1, % 2 2.5% % Middle % 49, % % 3, % Upper % 17, % 1 1.3% % Unknown 0 0.0% 0 0.0% 0 0.0% 0 0.0% Total % 68, % % 4, % By Revenue Total $1 Million or Less % 32, % % 3, % Over $1 Million % 34, % 2 2.5% % Not Known 9 1.6% 1, % 0 0.0% 0 0.0% Total % 68, % % 4, % By Loan Size $100,000 or less % 16, % % 1, % $100,001 - $250, % 15, % % 1, % $250,001 - $1 Million (Bus)- $500k (Farm) % 37, % 3 3.8% 1, % Over $1 Million (Bus)-$500k (Farm) 0 0.0% 0 0.0% 0 0.0% 0 0.0% Total % 68, % % 4, % By Loan Size and Revenue $1 Million or Less $100,000 or less % 11, % % 1, % $100,001 - $250, % 10, % % 1, % $250,001 - $1 Million (Bus)- $500k (Farm) % 10, % 1 1.3% % Over $1 Million (Bus)-$500k (Farm) 0 0.0% 0 0.0% 0 0.0% 0 0.0% Total % 32, % % 3, % 156
160 LOAN DISTRIBUTION TABLE VINELAND-MILLVILLE-BRIDGTON MSA HMDA By Tract Income By Borrower Income Income Categories # % $(000s) % # % $(000s) % Home Purchase Low 0 0.0% 0 0.0% 2 9.5% % Moderate % % % % Middle % 1, % % % Upper % 1, % % % Unknown 0 0.0% 0 0.0% % % Total % 2, % % 2, % Refinance Low 1 1.4% % 3 4.2% % Moderate % 1, % % % Middle % 2, % % 1, % Upper % 2, % % 3, % Unknown 0 0.0% 0 0.0% 2 2.8% % Total % 6, % % 6, % Home Improvement Low 0 0.0% 0 0.0% 5 4.3% % Moderate % % % % Middle % 3, % % 1, % Upper % 3, % % 5, % Unknown 0 0.0% 0 0.0% 1 0.9% % Total % 7, % % 7, % Multi-Family Low 0 0.0% 0 0.0% 0 0.0% 0 0.0% Moderate % 1, % 0 0.0% 0 0.0% Middle % % 0 0.0% 0 0.0% Upper 0 0.0% 0 0.0% 0 0.0% 0 0.0% Unknown 0 0.0% 0 0.0% % 1, % Total % 1, % % 1, % HMDA Totals Low 1 0.5% % % % Moderate % 3, % % 1, % Middle % 7, % % 3, % Upper % 6, % % 9, % Unknown 0 0.0% 0 0.0% % 2, % Total % 17, % % 17, % 157
161 SMALL BUSINESS LOAN DISTRIBUTION TABLE VINELAND-MILLVILLE- BRIDGTON MSA SMALL BUSINESS SMALL FARM # % $(000s) % # % $(000s) % By Tract Income Low % 2, % 0 0.0% 0 0.0% Moderate % 9, % 0 0.0% 0 0.0% Middle % 20, % 0 0.0% 0 0.0% Upper % 20, % 0 0.0% 0 0.0% Unknown 0 0.0% 0 0.0% 0 0.0% 0 0.0% Total % 52, % 0 0.0% 0 0.0% By Revenue Total $1 Million or Less % 14, % 0 0.0% 0 0.0% Over $1 Million % 36, % 0 0.0% 0 0.0% Not Known % 1, % 0 0.0% 0 0.0% Total % 52, % 0 0.0% 0 0.0% By Loan Size $100,000 or less % 9, % 0 0.0% 0 0.0% $100,001 - $250, % 10, % 0 0.0% 0 0.0% $250,001 - $1 Million (Bus)- $500k (Farm) % 32, % 0 0.0% 0 0.0% Over $1 Million (Bus)-$500k (Farm) 0 0.0% 0 0.0% 0 0.0% 0 0.0% Total % 52, % 0 0.0% 0 0.0% By Loan Size and Revenue $1 Million or Less $100,000 or less % 4, % 0 0.0% 0 0.0% $100,001 - $250, % 4, % 0 0.0% 0 0.0% $250,001 - $1 Million (Bus)- $500k (Farm) % 5, % 0 0.0% 0 0.0% Over $1 Million (Bus)-$500k (Farm) 0 0.0% 0 0.0% 0 0.0% 0 0.0% Total % 14, % 0 0.0% 0 0.0% 158
162 LOAN DISTRIBUTION TABLE WILLIAMSPORT MSA HMDA By Tract Income By Borrower Income Income Categories # % $(000s) % # % $(000s) % Home Purchase Low 0 0.0% 0 0.0% % % Moderate % 2, % % 1, % Middle % 6, % % 1, % Upper 3 3.6% % % 4, % Unknown 0 0.0% 0 0.0% 7 8.3% 1, % Total % 9, % % 9, % Refinance Low 0 0.0% 0 0.0% 6 5.8% % Moderate % % % 1, % Middle % 7, % % 2, % Upper 5 4.8% % % 4, % Unknown 0 0.0% 0 0.0% 2 1.9% % Total % 8, % % 8, % Home Improvement Low 0 0.0% 0 0.0% 8 8.4% % Moderate % % % % Middle % 2, % % % Upper 3 3.2% % % 1, % Unknown 0 0.0% 0 0.0% 1 1.1% % Total % 3, % % 3, % Multi-Family Low 0 0.0% 0 0.0% 0 0.0% 0 0.0% Moderate % % 0 0.0% 0 0.0% Middle % 8, % 0 0.0% 0 0.0% Upper 0 0.0% 0 0.0% 0 0.0% 0 0.0% Unknown 0 0.0% 0 0.0% % 9, % Total % 9, % % 9, % HMDA Totals Low 0 0.0% 0 0.0% % 1, % Moderate % 4, % % 3, % Middle % 25, % % 4, % Upper % 1, % % 10, % Unknown 0 0.0% 0 0.0% % 10, % Total % 30, % % 30, % 159
163 SMALL BUSINESS LOAN DISTRIBUTION TABLE WILLIAMSPORT MSA SMALL BUSINESS SMALL FARM # % $(000s) % # % $(000s) % By Tract Income Low 0 0.0% 0 0.0% 0 0.0% 0 0.0% Moderate % 4, % 0 0.0% 0 0.0% Middle % 33, % % 2, % Upper % % 0 0.0% 0 0.0% Unknown 0 0.0% 0 0.0% 0 0.0% 0 0.0% Total % 39, % % 2, % By Revenue Total $1 Million or Less % 16, % % 2, % Over $1 Million % 14, % 1 4.8% % Not Known % 8, % % % Total % 39, % % 2, % By Loan Size $100,000 or less % 12, % % % $100,001 - $250, % 8, % % % $250,001 - $1 Million (Bus)- $500k (Farm) % 17, % % 1, % Over $1 Million (Bus)-$500k (Farm) 0 0.0% 0 0.0% 0 0.0% 0 0.0% Total % 39, % % 2, % By Loan Size and Revenue $1 Million or Less $100,000 or less % 7, % % % $100,001 - $250, % 4, % % % $250,001 - $1 Million (Bus)- $500k (Farm) % 4, % % 1, % Over $1 Million (Bus)-$500k (Farm) 0 0.0% 0 0.0% 0 0.0% 0 0.0% Total % 16, % % 2, % 160
164 LOAN DISTRIBUTION TABLE WORCHESTER COUNTY, MD, ASSESSMENT AREA HMDA By Tract Income By Borrower Income Income Categories # % $(000s) % # % $(000s) % Home Purchase Low 0 0.0% 0 0.0% 0 0.0% 0 0.0% Moderate 0 0.0% 0 0.0% 0 0.0% 0 0.0% Middle % 11, % 2 9.1% % Upper 0 0.0% 0 0.0% % 10, % Unknown 0 0.0% 0 0.0% 0 0.0% 0 0.0% Total % 11, % % 11, % Refinance Low 0 0.0% 0 0.0% 0 0.0% 0 0.0% Moderate 0 0.0% 0 0.0% 0 0.0% 0 0.0% Middle % 3, % % % Upper 0 0.0% 0 0.0% % 2, % Unknown 0 0.0% 0 0.0% % % Total % 3, % % 3, % Home Improvement Low 0 0.0% 0 0.0% 0 0.0% 0 0.0% Moderate 0 0.0% 0 0.0% 0 0.0% 0 0.0% Middle % 2, % 0 0.0% 0 0.0% Upper 0 0.0% 0 0.0% % 2, % Unknown 0 0.0% 0 0.0% 0 0.0% 0 0.0% Total % 2, % % 2, % Multi-Family Low 0 0.0% 0 0.0% 0 0.0% 0 0.0% Moderate 0 0.0% 0 0.0% 0 0.0% 0 0.0% Middle 0 0.0% 0 0.0% 0 0.0% 0 0.0% Upper 0 0.0% 0 0.0% 0 0.0% 0 0.0% Unknown 0 0.0% 0 0.0% 0 0.0% 0 0.0% Total 0 0.0% 0 0.0% 0 0.0% 0 0.0% HMDA Totals Low 0 0.0% 0 0.0% 0 0.0% 0 0.0% Moderate 0 0.0% 0 0.0% 0 0.0% 0 0.0% Middle % 17, % % % Upper 0 0.0% 0 0.0% % 15, % Unknown 0 0.0% 0 0.0% 3 7.5% % Total % 17, % % 17, % 161
165 SMALL BUSINESS LOAN DISTRIBUTION TABLE WORCHESTER COUNTY, MD, ASSESSMENT AREA SMALL BUSINESS SMALL FARM # % $(000s) % # % $(000s) % By Tract Income Low 0 0.0% 0 0.0% 0 0.0% 0 0.0% Moderate 0 0.0% 0 0.0% 0 0.0% 0 0.0% Middle % 1, % 0 0.0% 0 0.0% Upper 0 0.0% 0 0.0% 0 0.0% 0 0.0% Unknown 0 0.0% 0 0.0% 0 0.0% 0 0.0% Total % 1, % 0 0.0% 0 0.0% By Revenue Total $1 Million or Less % % 0 0.0% 0 0.0% Over $1 Million % 1, % 0 0.0% 0 0.0% Not Known 0 0.0% 0 0.0% 0 0.0% 0 0.0% Total % 1, % 0 0.0% 0 0.0% By Loan Size $100,000 or less % % 0 0.0% 0 0.0% $100,001 - $250, % 0 0.0% 0 0.0% 0 0.0% $250,001 - $1 Million (Bus)- $500k (Farm) % 1, % 0 0.0% 0 0.0% Over $1 Million (Bus)-$500k (Farm) 0 0.0% 0 0.0% 0 0.0% 0 0.0% Total % 1, % 0 0.0% 0 0.0% By Loan Size and Revenue $1 Million or Less $100,000 or less % % 0 0.0% 0 0.0% $100,001 - $250, % 0 0.0% 0 0.0% 0 0.0% $250,001 - $1 Million (Bus)- $500k (Farm) 0 0.0% 0 0.0% 0 0.0% 0 0.0% Over $1 Million (Bus)-$500k (Farm) 0 0.0% 0 0.0% 0 0.0% 0 0.0% Total % % 0 0.0% 0 0.0% 162
166 LOAN DISTRIBUTION TABLE YORK-HANOVER-GETTYSBURG CSA (YORK AND ADAMS COUNTIES) Income Categories By Tract Income HMDA By Borrower Income # % $(000s) % # % $(000s) % Home Purchase Low % 1, % % 2, % Moderate % 2, % % 11, % Middle % 36, % % 10, % Upper % 9, % % 22, % Unknown 0 0.0% 0 0.0% % 3, % Total % 49, % % 49, % Refinance Low 7 1.4% % % 1, % Moderate % 1, % % 5, % Middle % 33, % % 10, % Upper % 8, % % 20, % Unknown 0 0.0% 0 0.0% % 4, % Total % 43, % % 43, % Home Improvement Low 1 0.2% % % 1, % Moderate % % % 3, % Middle % 21, % % 6, % Upper % 4, % % 14, % Unknown 0 0.0% 0 0.0% % % Total % 25, % % 25, % Multi-Family Low 0 0.0% 0 0.0% 0 0.0% 0 0.0% Moderate % % 0 0.0% 0 0.0% Middle % 1, % 0 0.0% 0 0.0% Upper 0 0.0% 0 0.0% 0 0.0% 0 0.0% Unknown 0 0.0% 0 0.0% % 1, % Total % 1, % % 1, % HMDA Totals Low % 1, % % 5, % Moderate % 4, % % 19, % Middle 1, % 92, % % 28, % Upper % 22, % % 56, % Unknown 0 0.0% 0 0.0% % 10, % Total 1, % 120, % 1, % 120, % 163
167 SMALL BUSINESS LOAN DISTRIBUTION TABLE WORCHESTER COUNTY, MD, ASSESSMENT AREA SMALL BUSINESS SMALL FARM # % $(000s) % # % $(000s) % By Tract Income Low % 4, % 0 0.0% 0 0.0% Moderate % 9, % 0 0.0% 0 0.0% Middle % 85, % % 4, % Upper % 18, % % % Unknown 0 0.0% 0 0.0% 0 0.0% 0 0.0% Total % 118, % % 4, % By Revenue Total $1 Million or Less % 45, % % 3, % Over $1 Million % 59, % % 1, % Not Known % 13, % % % Total % 118, % % 4, % By Loan Size $100,000 or less % 19, % % % $100,001 - $250, % 29, % % 2, % $250,001 - $1 Million (Bus)- $500k (Farm) % 69, % % 1, % Over $1 Million (Bus)-$500k (Farm) 0 0.0% 0 0.0% 0 0.0% 0 0.0% Total % 118, % % 4, % By Loan Size and Revenue $1 Million or Less $100,000 or less % 9, % % % $100,001 - $250, % 14, % % 1, % $250,001 - $1 Million (Bus)- $500k (Farm) % 20, % % 1, % Over $1 Million (Bus)-$500k (Farm) 0 0.0% 0 0.0% 0 0.0% 0 0.0% Total % 45, % % 3, % 164


168 CRA APPENDIX C: ASSESSMENT AREA MAPS Baltimore-Towson MSA Allentown, PA, Assessment Area 165

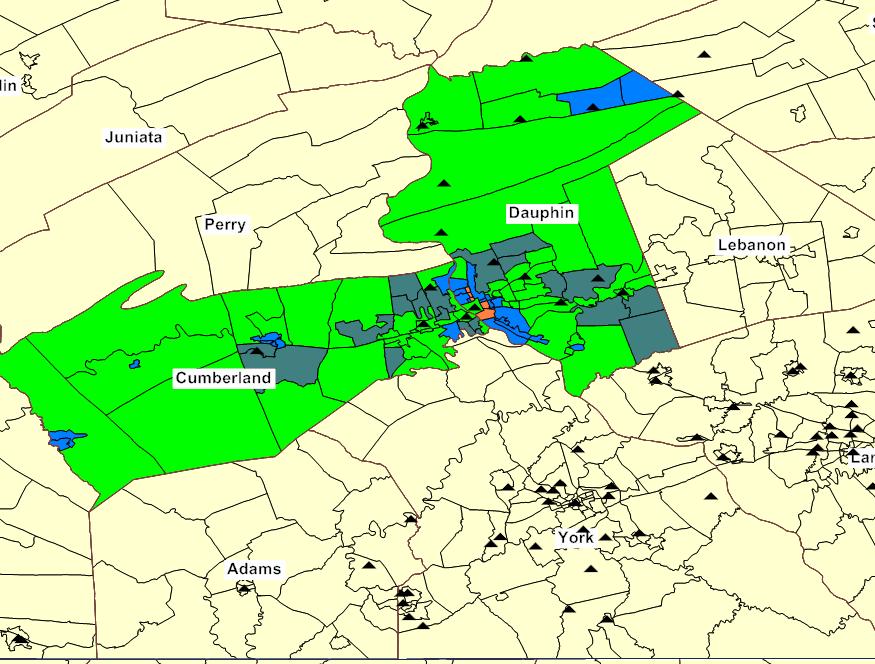
169 Atlantic City, NJ MSA Harrisburg-Carlisle, PA MSA 166

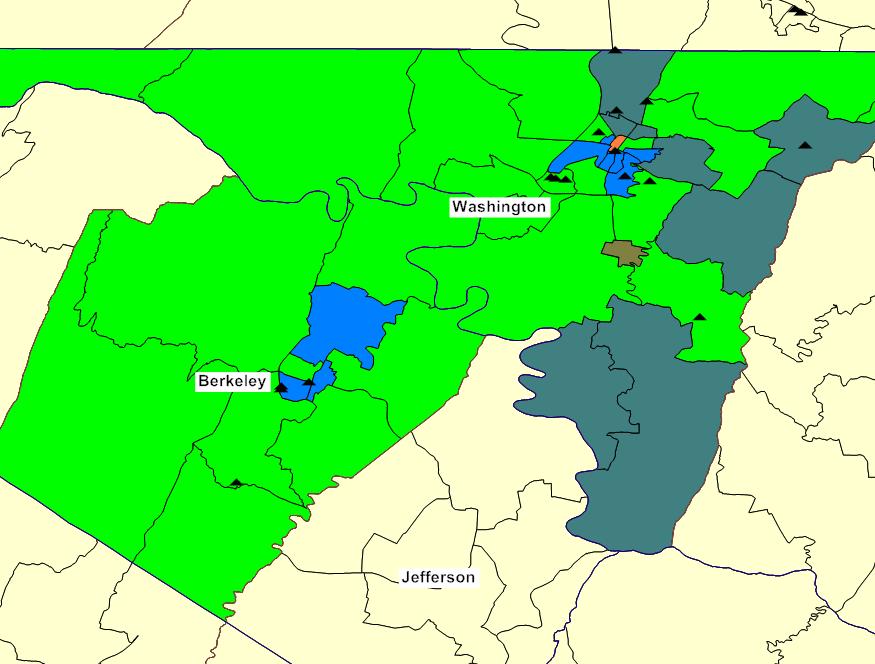
170 Cumberland, MD-WV MSA Hagerstown-Martinsburg, MD-WV MSA 167


171 North Central, PA Non MSA Lancaster MSA 168

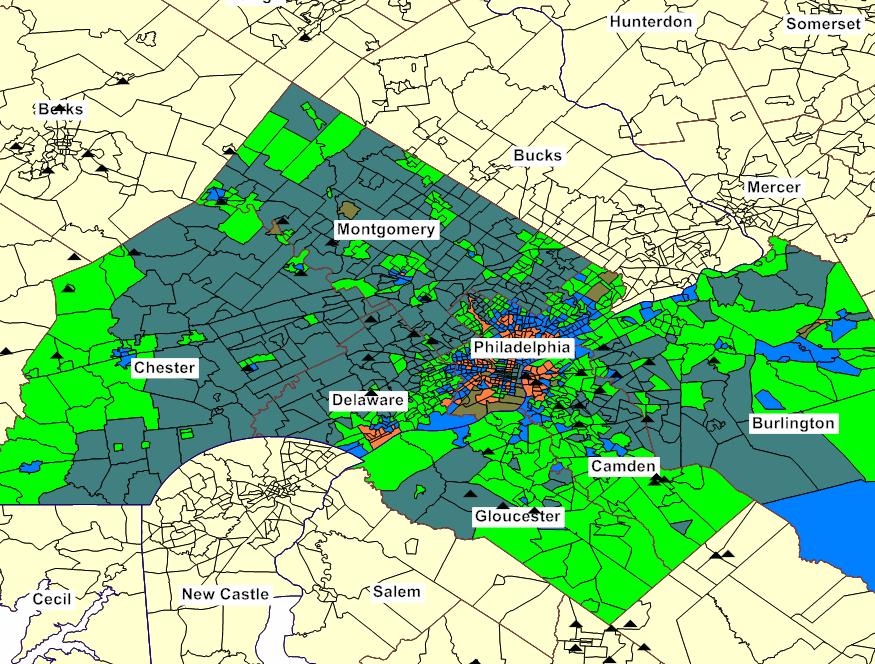
172 Garrett County, MD Non MSA Philadelphia-Camden, PA-NJ MSA 169


173 South Central, PA Non MSA Worcester County, MD Non MSA 170


174 Vineland-Millville-Bridgeton, NJ MSA Reading, PA MSA 171


175 Scranton, PA MSA York-Hanover-Gettysburg CSA 172
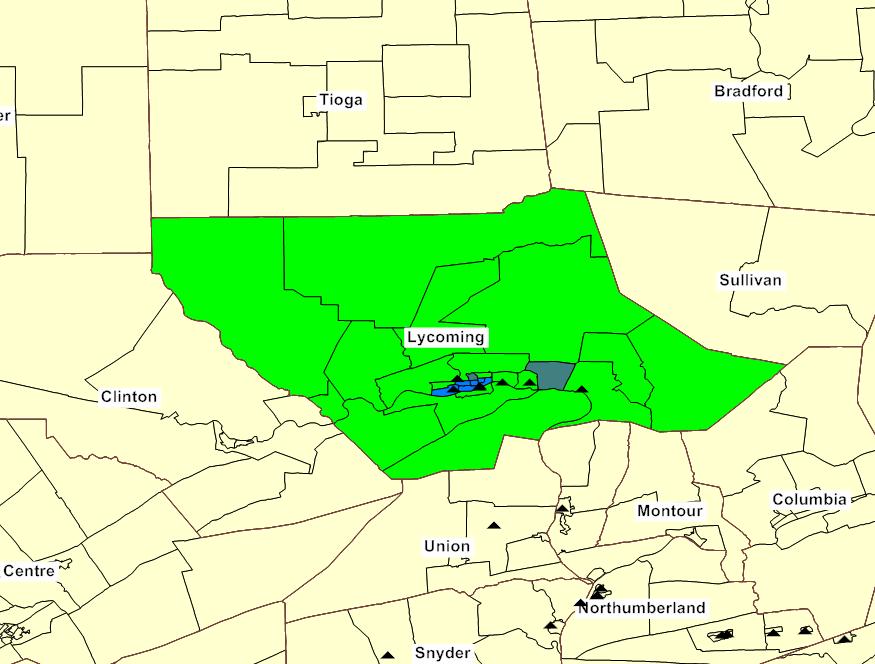
176 Williamsport MSA 173
COMMUNITY REINVESTMENT ACT PERFORMANCE EVALUATION
 PUBLIC DISCLOSURE Date of Evaluation: MARCH 09, 2015 COMMUNITY REINVESTMENT ACT PERFORMANCE EVALUATION Name of Depository Institution: UNIVEST BANK AND TRUST Co. Institution s Identification Number: 354310
PUBLIC DISCLOSURE COMMUNITY REINVESTMENT ACT PERFORMANCE EVALUATION
 PUBLIC DISCLOSURE March 31, 2008 COMMUNITY REINVESTMENT ACT PERFORMANCE EVALUATION LAFAYETTE AMBASSADOR BANK RSSD 140018 EASTON, PENNSYLVANIA FEDERAL RESERVE BANK OF PHILADELPHIA TEN INDEPENDENCE MALL,
PUBLIC DISCLOSURE COMMUNITY REINVESTMENT ACT PERFORMANCE EVALUATION
 PUBLIC DISCLOSURE September 17, 2007 COMMUNITY REINVESTMENT ACT PERFORMANCE EVALUATION AMERISERV FINANCIAL BANK RSSD 928618 JOHNSTOWN, PENNSYLVANIA FEDERAL RESERVE BANK OF PHILADELPHIA TEN INDEPENDENCE
PUBLIC DISCLOSURE COMMUNITY REINVESTMENT ACT PERFORMANCE EVALUATION
 PUBLIC DISCLOSURE October 31, 2005 COMMUNITY REINVESTMENT ACT PERFORMANCE EVALUATION RSSD No. 236706 158 U.S. Highway 206 North Gladstone, New Jersey 07934 Federal Reserve of New York 33 Liberty Street
PUBLIC DISCLOSURE COMMUNITY REINVESTMENT ACT PERFORMANCE EVALUATION
 PUBLIC DISCLOSURE (November 8, 1999) COMMUNITY REINVESTMENT ACT PERFORMANCE EVALUATION ORRSTOWN BANK RSSD ID - 342410 ORRSTOWN, PENNSYLVANIA FEDERAL RESERVE BANK OF PHILADELPHIA PHILADELPHIA, PENNSYLVANIA
PUBLIC DISCLOSURE COMMUNITY REINVESTMENT ACT PERFORMANCE EVALUATION
 PUBLIC DISCLOSURE January 26, 2009 COMMUNITY REINVESTMENT ACT PERFORMANCE EVALUATION Amboy Bank RSSD No. 9807 3590 Highway 9 Old Bridge, NJ 08859 Federal Reserve Bank of New York 33 Liberty Street New
COMMUNITY REINVESTMENT ACT PERFORMANCE EVALUATION
 PUBLIC DISCLOSURE August 24, 2009 COMMUNITY REINVESTMENT ACT PERFORMANCE EVALUATION First State Bank of Red Bud RSSD # 356949 115 West Market Street Red Bud, Illinois 62278 Federal Reserve Bank of St.
PUBLIC DISCLOSURE COMMUNITY REINVESTMENT ACT PERFORMANCE EVALUATION
 PUBLIC DISCLOSURE August 1, 2011 COMMUNITY REINVESTMENT ACT PERFORMANCE EVALUATION Empire State Bank RSSD No. 3277241 68 North Plank Road Newburgh, New York 12550 FEDERAL RESERVE BANK OF NEW YORK 33 LIBERTY
PUBLIC DISCLOSURE COMMUNITY REINVESTMENT ACT PERFORMANCE EVALUATION
 PUBLIC DISCLOSURE November 5, 2003 COMMUNITY REINVESTMENT ACT PERFORMANCE EVALUATION RSSD No. 236706 158 U.S. Highway 206 North Gladstone, New Jersey 07934 Federal Reserve of New York 33 Liberty Street
PUBLIC DISCLOSURE AUGUST 16, 2010 COMMUNITY REINVESTMENT ACT PERFORMANCE EVALUATION AMERICAN HERITAGE BANK RSSD#
 PUBLIC DISCLOSURE AUGUST 16, 2010 COMMUNITY REINVESTMENT ACT PERFORMANCE EVALUATION AMERICAN HERITAGE BANK RSSD# 311050 2 SOUTH MAIN SAPULPA, OKLAHOMA 74066 Federal Reserve Bank of Kansas City 1 Memorial
PUBLIC DISCLOSURE COMMUNITY REINVESTMENT ACT PERFORMANCE EVALUATION
 PUBLIC DISCLOSURE January 9, 2012 COMMUNITY REINVESTMENT ACT PERFORMANCE EVALUATION Peapack-Gladstone Bank RSSD No. 236706 500 Hills Drive Suite 300 Bedminster, New Jersey 07921 FEDERAL RESERVE BANK OF
PUBLIC DISCLOSURE COMMUNITY REINVESTMENT ACT PERFORMANCE EVALUATION
 PUBLIC DISCLOSURE March 10, 2008 COMMUNITY REINVESTMENT ACT PERFORMANCE EVALUATION Tioga State Bank RSSD No. 910118 1 Main Street P.O. Box 386 Spencer, NY 14883 FEDERAL RESERVE BANK OF NEW YORK 33 LIBERTY
PUBLIC DISCLOSURE COMMUNITY REINVESTMENT ACT PERFORMANCE EVALUATION
 PUBLIC DISCLOSURE January 19, 2016 COMMUNITY REINVESTMENT ACT PERFORMANCE EVALUATION RSSD# 856748 200 South Third Street Batesville, Arkansas 72501 Federal Reserve Bank of St. Louis P.O. Box 442 St. Louis,
PUBLIC DISCLOSURE COMMUNITY REINVESTMENT ACT PERFORMANCE EVALUATION
 PUBLIC DISCLOSURE April 5, 2010 COMMUNITY REINVESTMENT ACT PERFORMANCE EVALUATION The Callaway Bank RSSD #719656 5 East Fifth Street Fulton, Missouri 65251 Federal Reserve Bank of St. Louis P.O. Box 442
CRA Public File As of: August 31, 2018
 CRA Public File As of: August 31, 2018 TABLE OF CONTENTS 1 Written Comments on CRA Performance 2 Responses to Written Comments on CRA Performance 3 CRA Performance Evaluation 4 Listing of Bank Branches,
PUBLIC DISCLOSURE COMMUNITY REINVESTMENT ACT PERFORMANCE EVALUATION
 PUBLIC DISCLOSURE September 29, 2014 COMMUNITY REINVESTMENT ACT PERFORMANCE EVALUATION MainSource Bank Certificate #5766 201 North Broadway Greensburg, Indiana 47240 Federal Deposit Insurance Corporation
COMMUNITY REINVESTMENT ACT PERFORMANCE EVALUATION
 PUBLIC DISCLOSURE December 6, 2010 COMMUNITY REINVESTMENT ACT PERFORMANCE EVALUATION Alden State Bank RSSD No. 414102 13216 Broadway Alden, New York 14004 FEDERAL RESERVE BANK OF NEW YORK 33 LIBERTY STREET
PUBLIC DISCLOSURE. December 6, 2004 COMMUNITY REINVESTMENT ACT PERFORMANCE EVALUATION BANK OF EUFAULA RSSD#
 PUBLIC DISCLOSURE COMMUNITY REINVESTMENT ACT PERFORMANCE EVALUATION BANK OF EUFAULA RSSD# 343051 P.O. BOX 607 EUFAULA, OKLAHOMA 74432-0607 Federal Reserve Bank of Kansas City 925 Grand Boulevard Kansas
PUBLIC DISCLOSURE COMMUNITY REINVESTMENT ACT PERFORMANCE EVALUATION
 PUBLIC DISCLOSURE August 1, 2011 COMMUNITY REINVESTMENT ACT PERFORMANCE EVALUATION Five Star Bank RSSD No. 601416 55 North Main Street Warsaw, NY 14203 Federal Reserve Bank of New York 33 Liberty Street
PUBLIC DISCLOSURE COMMUNITY REINVESTMENT ACT PERFORMANCE EVALUATION
 PUBLIC DISCLOSURE December 3, 2007 COMMUNITY REINVESTMENT ACT PERFORMANCE EVALUATION RSSD: 368522 201 North Warren Avenue Apollo, Pennsylvania 15613 Federal Reserve Bank of Cleveland P.O. Box 6387 Cleveland,
PUBLIC DISCLOSURE COMMUNITY REINVESTMENT ACT PERFORMANCE EVALUATION
 PUBLIC DISCLOSURE April 15, 2013 COMMUNITY REINVESTMENT ACT PERFORMANCE EVALUATION RSSD# 311845 75 North East Street Fayetteville, Arkansas 72701 Federal Reserve Bank of St. Louis P.O. Box 442 St. Louis,
PUBLIC DISCLOSURE COMMUNITY REINVESTMENT ACT PERFORMANCE EVALUATION
 PUBLIC DISCLOSURE March 6, 2017 COMMUNITY REINVESTMENT ACT PERFORMANCE EVALUATION RSSD No. 101671 185 Genesee Street Utica, New York 13501 FEDERAL RESERVE BANK OF NEW YORK 33 LIBERTY STREET NEW YORK, NY
COMMUNITY REINVESTMENT ACT PERFORMANCE EVALUATION
 PUBLIC DISCLOSURE July 25, 2011 COMMUNITY REINVESTMENT ACT PERFORMANCE EVALUATION Bank of Millbrook RSSD No. 175609 3263 Franklin Avenue Millbrook, New York 12545 FEDERAL RESERVE BANK OF NEW YORK 33 LIBERTY
PUBLIC DISCLOSURE COMMUNITY REINVESTMENT ACT PERFORMANCE EVALUATION
 PUBLIC DISCLOSURE February 22, 2010 COMMUNITY REINVESTMENT ACT PERFORMANCE EVALUATION Orange County Trust Company RSSD No. 176101 212 Dolson Avenue Middletown, NY 10940 FEDERAL RESERVE BANK OF NEW YORK
Mortgage Performance Summary
 Mortgage Performance Summary QUARTERLY UPDATE Housing Market and Mortgage Performance in Maryland and the District of Columbia 3 rd Quarter, 216 Joseph Mengedoth Michael Stanley 42 4 37 3 32 3 27 2 22
Mortgage Performance Summary
 Mortgage Performance Summary QUARTERLY UPDATE Housing Market and Mortgage Performance in Maryland and the District of Columbia st Quarter, 27 Joseph Mengedoth Michael Stanley 47 4 42 4 37 3 32 3 27 2 22
PUBLIC DISCLOSURE. June 4, 2012 COMMUNITY REINVESTMENT ACT PERFORMANCE EVALUATION. Utah Independent Bank RSSD #
 PUBLIC DISCLOSURE June 4, 2012 COMMUNITY REINVESTMENT ACT PERFORMANCE EVALUATION Utah Independent RSSD # 256179 55 South State Street Salina, Utah 84654 Federal Reserve of San Francisco 101 Market Street
PUBLIC DISCLOSURE. August 30, 2004 COMMUNITY REINVESTMENT ACT PERFORMANCE EVALUATION FARMERS STATE BANK RSSD#
 PUBLIC DISCLOSURE COMMUNITY REINVESTMENT ACT PERFORMANCE EVALUATION FARMERS STATE BANK RSSD# 542854 P.O. BOX 458 PINE BLUFFS, WYOMING 82082 Federal Reserve Bank of Kansas City 925 Grand Boulevard Kansas
PUBLIC DISCLOSURE COMMUNITY REINVESTMENT ACT PERFORMANCE EVALUATION
 PUBLIC DISCLOSURE November 26, 2012 COMMUNITY REINVESTMENT ACT PERFORMANCE EVALUATION Southern Bancorp Bank RSSD# 852544 601 Main Street Arkadelphia, Arkansas 71923 Federal Reserve Bank of St. Louis P.O.
PUBLIC DISCLOSURE COMMUNITY REINVESTMENT ACT PERFORMANCE EVALUATION
 PUBLIC DISCLOSURE August 10, 2015 COMMUNITY REINVESTMENT ACT PERFORMANCE EVALUATION Amboy Bank RSSD No. 9807 3890 U.S. Hwy 9 Old Bridge, New Jersey 08859 FEDERAL RESERVE BANK OF NEW YORK 33 LIBERTY STREET
Housing Market and Mortgage Performance in Maryland and the District of Columbia
 QUARTERLY UPDATE Housing Market and Mortgage Performance in Maryland and the District of Columbia 4 th Quarter, 21 Joseph Mengedoth Michael Stanley 42 4 37 3 32 3 27 2 22 2 17 1 12 Figure 1 FHFA House
Mortgage Performance Summary
 Mortgage Performance Summary QUARTERLY UPDATE Housing Market and Mortgage Performance in Maryland and the District of Columbia 2 nd Quarter, 216 Joseph Mengedoth Michael Stanley 42 4 37 3 32 3 27 2 22
PUBLIC DISCLOSURE COMMUNITY REINVESTMENT ACT PERFORMANCE EVALUATION
 PUBLIC DISCLOSURE November 5, 2012 COMMUNITY REINVESTMENT ACT PERFORMANCE EVALUATION RSSD: 2747279 115 Third Street Marietta, Ohio 45750 Federal Reserve Bank of Cleveland P.O. Box 6387 Cleveland, OH 44101-1387
PUBLIC DISCLOSURE COMMUNITY REINVESTMENT ACT PERFORMANCE EVALUATION
 PUBLIC DISCLOSURE February 22, 2016 COMMUNITY REINVESTMENT ACT PERFORMANCE EVALUATION Empire State Bank RSSD No. 3277241 68 Plank Road Newburgh, New York 12550 FEDERAL RESERVE BANK OF NEW YORK 33 LIBERTY
PUBLIC DISCLOSURE COMMUNITY REINVESTMENT ACT PERFORMANCE EVALUATION
 PUBLIC DISCLOSURE August 25, 2003 COMMUNITY REINVESTMENT ACT PERFORMANCE EVALUATION ORANGE COUNTY TRUST COMPANY RSSD 176101 212 Dolson Avenue Middletown, New York 10940 FEDERAL RESERVE BANK OF NEW YORK
PUBLIC DISCLOSURE COMMUNITY REINVESTMENT ACT PERFORMANCE EVALUATION
 PUBLIC DISCLOSURE June 14, 2004 COMMUNITY REINVESTMENT ACT PERFORMANCE EVALUATION Manufacturers and Traders Trust Company RSSD No. 501105 One M&T Plaza Buffalo, New York 14203 Federal Reserve Bank of New
PUBLIC DISCLOSURE. January 17, 2006 COMMUNITY REINVESTMENT ACT PERFORMANCE EVALUATION. 500 Linden Avenue South San Francisco, California 94080
 PUBLIC DISCLOSURE January 17, 2006 COMMUNITY REINVESTMENT ACT PERFORMANCE EVALUATION Liberty Bank RSSD - 478766 500 Linden Avenue South San Francisco, California 94080 Federal Reserve Bank of San Francisco
PUBLIC DISCLOSURE COMMUNITY REINVESTMENT ACT PERFORMANCE EVALUATION
 PUBLIC DISCLOSURE January 14, 2008 COMMUNITY REINVESTMENT ACT PERFORMANCE EVALUATION Orange County Trust Company RSSD No. 176101 212 Dolson Avenue Middletown, NY 10940 FEDERAL RESERVE BANK OF NEW YORK
PUBLIC DISCLOSURE COMMUNITY REINVESTMENT ACT PERFORMANCE EVALUATION
 PUBLIC DISCLOSURE July 15, 2013 COMMUNITY REINVESTMENT ACT PERFORMANCE EVALUATION Meridian Bank Texas Certificate Number: 11895 100 Lexington Street, Suite 100 Fort Worth, Texas 76102 Federal Deposit Insurance
PUBLIC DISCLOSURE. September 4, 2001 COMMUNITY REINVESTMENT ACT PERFORMANCE EVALUATION CITIZENS BANK OF EDMOND RSSD#
 PUBLIC DISCLOSURE COMMUNITY REINVESTMENT ACT PERFORMANCE EVALUATION CITIZENS BANK OF EDMOND RSSD# 172457 ONE EAST 1 st STREET, P.O. BOX 30 EDMOND, OKLAHOMA 73034 Federal Reserve Bank of Kansas City 925
PUBLIC DISCLOSURE COMMUNITY REINVESTMENT ACT PERFORMANCE EVALUATION
 PUBLIC DISCLOSURE August 17, 2009 COMMUNITY REINVESTMENT ACT PERFORMANCE EVALUATION Midland States Bank RSSD #773247 133 West Jefferson Street Effingham, Illinois 62401 Federal Reserve Bank of St. Louis
PUBLIC DISCLOSURE COMMUNITY REINVESTMENT ACT PERFORMANCE EVALUATION
 PUBLIC DISCLOSURE July 28, 2015 COMMUNITY REINVESTMENT ACT PERFORMANCE EVALUATION Bangor Savings Bank Certificate Number: 18408 3 State Street Bangor, Maine 04401 Federal Deposit Insurance Corporation
PUBLIC DISCLOSURE COMMUNITY REINVESTMENT ACT PERFORMANCE EVALUATION
 CapitalMark Bank & Trust CRA PUBLIC EVALUATION PUBLIC DISCLOSURE May 7, 2012 COMMUNITY REINVESTMENT ACT PERFORMANCE EVALUATION CapitalMark Bank &Trust 801 Broad Street Chattanooga, Tennessee 37402 RSSD
PUBLIC DISCLOSURE COMMUNITY REINVESTMENT ACT PERFORMANCE EVALUATION
 PUBLIC DISCLOSURE May 12, 2008 COMMUNITY REINVESTMENT ACT PERFORMANCE EVALUATION Manufacturers and Traders Trust Company RSSD No. 501105 One M&T Plaza Buffalo, New York 14203 Federal Reserve of New York
PUBLIC DISCLOSURE. May 9, 2005 COMMUNITY REINVESTMENT ACT PERFORMANCE EVALUATION COMMUNITY BANK & TRUST RSSD #
 PUBLIC DISCLOSURE May 9, 2005 COMMUNITY REINVESTMENT ACT PERFORMANCE EVALUATION COMMUNITY BANK & TRUST RSSD # 957757 100 SOUTH WOOD STREET, P.O. BOX 400 NEOSHO, MISSOURI 64850-1819 Federal Reserve Bank
COMMUNITY REINVESTMENT ACT PERFORMANCE EVALUATION
 PUBLIC DISCLOSURE June 2, 2008 COMMUNITY REINVESTMENT ACT PERFORMANCE EVALUATION Legacy Bank & Trust Company RSSD # 397755 10603 Highway 32 P.O. Box D Plato, Missouri 65552 Federal Reserve Bank of St.
PUBLIC DISCLOSURE COMMUNITY REINVESTMENT ACT PERFORMANCE EVALUATION
 PUBLIC DISCLOSURE January 6, 2014 COMMUNITY REINVESTMENT ACT PERFORMANCE EVALUATION LegacyTexas Bank RSSD Number: 913267 5000 Legacy Drive Plano, Texas 75024 Federal Reserve Bank of Dallas 2200 North Pearl
PUBLIC DISCLOSURE COMMUNITY REINVESTMENT ACT PERFORMANCE EVALUATION
 PUBLIC DISCLOSURE October 29, 2007 COMMUNITY REINVESTMENT ACT PERFORMANCE EVALUATION First Financial Bank RSSD# 48374 214 North Washington El Dorado, Arkansas 71730 Federal Reserve Bank of St. Louis P.O.
PUBLIC DISCLOSURE COMMUNITY REINVESTMENT ACT PERFORMANCE EVALUATION
 PUBLIC DISCLOSURE February 17,1998 COMMUNITY REINVESTMENT ACT PERFORMANCE EVALUATION Chemung Canal Trust Company 2362400 P.O. Box 1522 One Chemung Canal Plaza Elmira, New York 14902-1522 Federal Reserve
PUBLIC DISCLOSURE. December 4, 2006 COMMUNITY REINVESTMENT ACT PERFORMANCE EVALUATION. 101 North Main Street Logan, Utah 84321
 PUBLIC DISCLOSURE December 4, 2006 COMMUNITY REINVESTMENT ACT PERFORMANCE EVALUATION Cache Valley Bank RSSD #995076 101 North Main Street Logan, Utah 84321 Federal Reserve Bank of San Francisco 101 Market
PUBLIC DISCLOSURE COMMUNITY REINVESTMENT ACT PERFORMANCE EVALUATION
 PUBLIC DISCLOSURE August 25, 2008 COMMUNITY REINVESTMENT ACT PERFORMANCE EVALUATION RSSD: 2747279 115 Third Street Marietta, Ohio 45750 Federal Reserve Bank of Cleveland P.O. Box 6387 Cleveland, OH 44101-1387
PUBLIC DISCLOSURE COMMUNITY REINVESTMENT ACT
 PUBLIC DISCLOSURE March 31, 2014 COMMUNITY REINVESTMENT ACT PERFORMANCE EVALUATION First Bank & Trust RSSD# 2333298 820 Church Street Evanston, IL 60201 Federal Reserve Bank of Chicago 230 South LaSalle
BANK NAME YEAR CENSUS TRACT LOAN TYPE PROGRAM NO. OF LOANS VALUE OF LOANS BNY Mellon N.A HM NONE BNY Mellon N.A
 BANK NAME YEAR CENSUS TRACT LOAN TYPE PROGRAM NO. OF LOANS VALUE OF LOANS BNY Mellon N.A. 2015 2612.00 HM NONE 1 700 BNY Mellon N.A. 2015 2162.00 HM NONE 1 500 BNY Mellon N.A. 2015 2641.02 HM NONE 1 784
COMMUNITY REINVESTMENT ACT PERFORMANCE EVALUATION
 PUBLIC DISCLOSURE August 23, 1999 COMMUNITY REINVESTMENT ACT PERFORMANCE EVALUATION Bank of Cairo and Moberly RSSD# 833646 27 E. Rollins Street Moberly, Missouri 6527-2 Federal Reserve Bank of St. Louis
PUBLIC DISCLOSURE. August 5, 2013 COMMUNITY REINVESTMENT ACT PERFORMANCE EVALUATION. Pacific Enterprise Bank RSSD #
 PUBLIC DISCLOSURE August 5, 2013 COMMUNITY REINVESTMENT ACT PERFORMANCE EVALUATION Pacific Enterprise Bank RSSD # 3490871 17748 Sky Park Circle, Suite 100 Irvine, California 92614 Federal Reserve Bank
PUBLIC DISCLOSURE COMMUNITY REINVESTMENT ACT PERFORMANCE EVALUATION
 PUBLIC DISCLOSURE September 17, 2007 COMMUNITY REINVESTMENT ACT PERFORMANCE EVALUATION Belgrade State Bank RSSD #761244 410 Main Street Belgrade, Missouri 63622 Federal Reserve Bank of St. Louis P.O. Box
COMMUNITY REINVESTMENT ACT PERFORMANCE EVALUATION
 PUBLIC DISCLOSURE February 26, 2001 COMMUNITY REINVESTMENT ACT PERFORMANCE EVALUATION Central Bank and Trust RSSD# 1821024 801 Technology Drive Little Rock, Arkansas 72221 Federal Reserve Bank of St. Louis
COMMUNITY REINVESTMENT ACT PERFORMANCE EVALUATION
 PUBLIC DISCLOSURE July 9, 2012 COMMUNITY REINVESTMENT ACT PERFORMANCE EVALUATION Manufacturers and Traders Trust Company RSSD No. 501105 One M&T Plaza Buffalo, New York 14203 Federal Reserve Bank of New
PUBLIC DISCLOSURE COMMUNITY REINVESTMENT ACT PERFORMANCE EVALUATION
 PUBLIC DISCLOSURE April 22, 2013 COMMUNITY REINVESTMENT ACT PERFORMANCE EVALUATION RSSD #2552099 1001 Gibson Bay Drive, Suite #101 Richmond, Kentucky 40475 Federal Reserve Bank of Cleveland P.O. Box 6387
PUBLIC DISCLOSURE. January 23, 2006 COMMUNITY REINVESTMENT ACT PERFORMANCE EVALUATION GUARANTY BANK AND TRUST COMPANY RSSD#
 PUBLIC DISCLOSURE January 23, 2006 COMMUNITY REINVESTMENT ACT PERFORMANCE EVALUATION GUARANTY BANK AND TRUST COMPANY RSSD# 666657 1331 SEVENTEENTH STREET DENVER, COLORADO 80202 Federal Reserve Bank of
COMMUNITY REINVESTMENT ACT PERFORMANCE EVALUATION
 PUBLIC DISCLOSURE August 26, 2013 COMMUNITY REINVESTMENT ACT PERFORMANCE EVALUATION BNY Mellon, National Association Charter Number 6301 One Mellon Center, 500 Grant Street Pittsburgh, PA 15258 Office
PUBLIC DISCLOSURE COMMUNITY REINVESTMENT ACT PERFORMANCE EVALUATION
 PUBLIC DISCLOSURE January 22, 2013 COMMUNITY REINVESTMENT ACT PERFORMANCE EVALUATION Bank of Texas RSSD: 925653 306 West Wall Midland, Texas 79701 Federal Reserve Bank of Dallas 2200 North Pearl Street
PUBLIC DISCLOSURE. April 2, 2007 COMMUNITY REINVESTMENT ACT PERFORMANCE EVALUATION. Four Oaks Bank & Trust Company U.S.
 PUBLIC DISCLOSURE April 2, 2007 COMMUNITY REINVESTMENT ACT PERFORMANCE EVALUATION Four Oaks Bank & Trust Company 292524 6144 U.S. Highway 301 South Four Oaks, North Carolina 27524 Federal Reserve Bank
PUBLIC DISCLOSURE COMMUNITY REINVESTMENT ACT PERFORMANCE EVALUATION
 PUBLIC DISCLOSURE March 2, 2015 COMMUNITY REINVESTMENT ACT PERFORMANCE EVALUATION Stifel Bank and Trust RSSD# 3076248 501 North Broadway St. Louis, Missouri 63102 Federal Reserve Bank of St. Louis P.O.
PUBLIC DISCLOSURE COMMUNITY REINVESTMENT ACT PERFORMANCE EVALUATION
 PUBLIC DISCLOSURE December 4, 2006 COMMUNITY REINVESTMENT ACT PERFORMANCE EVALUATION ALDEN STATE BANK RSSD No. 414102 13216 Broadway Alden, New York 14004 FEDERAL RESERVE BANK OF NEW YORK 33 Liberty Street
PUBLIC DISCLOSURE COMMUNITY REINVESTMENT ACT PERFORMANCE EVALUATION
 PUBLIC DISCLOSURE January 18, 2017 COMMUNITY REINVESTMENT ACT PERFORMANCE EVALUATION Sterling National Bank Charter Number 25075 400 Rella Boulevard Montebello, NY 10901-4243 Office of the Comptroller
PUBLIC DISCLOSURE COMMUNITY REINVESTMENT ACT PERFORMANCE EVALUATION
 PUBLIC DISCLOSURE May 12, 1997 COMMUNITY REINVESTMENT ACT PERFORMANCE EVALUATION Bank of Avoca 02-36-0480 18 North Main Street Avoca, New York 14809 Federal Reserve Bank of New York 33 Liberty Street,
PUBLIC DISCLOSURE COMMUNITY REINVESTMENT ACT PERFORMANCE EVALUATION
 PUBLIC DISCLOSURE February 22, 2016 COMMUNITY REINVESTMENT ACT PERFORMANCE EVALUATION Franklin Synergy Bank 722 Columbia Avenue Franklin, Tennessee RSSD ID NUMBER: 3635533 FEDERAL RESERVE BANK OF ATLANTA
PUBLIC DISCLOSURE COMMUNITY REINVESTMENT ACT PERFORMANCE EVALUATION
 PUBLIC DISCLOSURE December 6, 2010 COMMUNITY REINVESTMENT ACT PERFORMANCE EVALUATION Metamora State Bank RSSD #533227 120 East Main Street Metamora, Ohio 43540 Federal Reserve Bank of Cleveland P.O. Box
PUBLIC DISCLOSURE. October 10, 2006 COMMUNITY REINVESTMENT ACT PERFORMANCE EVALUATION. BPD BANK RSSD No
 PUBLIC DISCLOSURE October 10, 2006 COMMUNITY REINVESTMENT ACT PERFORMANCE EVALUATION BPD BANK RSSD No. 66015 90 BROAD STREET NEW YORK, NEW YORK 10004 Federal Reserve Bank of New York 33 Liberty Street
PUBLIC DISCLOSURE COMMUNITY REINVESTMENT ACT PERFORMANCE EVALUATION
 PUBLIC DISCLOSURE June 6, 2016 COMMUNITY REINVESTMENT ACT PERFORMANCE EVALUATION Mizuho Bank (USA) RSSD No. 229913 1251 Avenue of the Americas New York, NY 10020 FEDERAL RESERVE BANK OF NEW YORK 33 LIBERTY
COMMUNITY REINVESTMENT ACT PERFORMANCE EVALUATION
 PUBLIC DISCLOSURE May 21, 2001 COMMUNITY REINVESTMENT ACT PERFORMANCE EVALUATION Arvest Bank RSSD# 970242 201 West Walnut Street Rogers, Arkansas 72757 Federal Reserve Bank of St. Louis P.O. Box 442 St.
PUBLIC DISCLOSURE. March 5, 2012 COMMUNITY REINVESTMENT ACT PERFORMANCE EVALUATION. Bay Commercial Bank RSSD #
 PUBLIC DISCLOSURE March 5, 2012 COMMUNITY REINVESTMENT ACT PERFORMANCE EVALUATION Bay Commercial Bank RSSD # 3281510 1280 Civic Drive, Suite 100 Walnut Creek, California 94596 Federal Reserve Bank of San
71 st Annual Field Meeting
 71 st Annual Field Meeting Hershey FEDERAL RESERVE BANK OF PHILADELPHIA Banking Trends and Supervisory Update William Spaniel Senior Vice President and Lending Officer Overview Third District Banking Conditions
PUBLIC DISCLOSURE. June 22, 2009 COMMUNITY REINVESTMENT ACT PERFORMANCE EVALUATION. The Bank of Monroe. 39 Main Street. Union, West Virginia 24983
 PUBLIC DISCLOSURE June 22, 2009 COMMUNITY REINVESTMENT ACT PERFORMANCE EVALUATION The Bank of Monroe 849432 39 Main Street Union, West Virginia 24983 Federal Reserve Bank of Richmond P. O. Box 27622 Richmond,
PUBLIC DISCLOSURE COMMUNITY REINVESTMENT ACT PERFORMANCE EVALUATION CHEMUNG CANAL TRUST COMPANY RSSD:
 PUBLIC DISCLOSURE (FEBRUARY 4, 2002) COMMUNITY REINVESTMENT ACT PERFORMANCE EVALUATION CHEMUNG CANAL TRUST COMPANY RSSD: 884303 One Chemung Canal Plaza Elmira, New York 14901 Federal Reserve Bank of New
Race and Housing in Pennsylvania
 w w w. t r f u n d. c o m About this Paper TRF created a data warehouse and mapping tool for the Pennsylvania Housing Finance Agency (PHFA). In follow-up to this work, PHFA commissioned TRF to analyze
PUBLIC DISCLOSURE COMMUNITY REINVESTMENT ACT PERFORMANCE EVALUATION
 PUBLIC DISCLOSURE February 25, 2008 COMMUNITY REINVESTMENT ACT PERFORMANCE EVALUATION Patriot Bank RSSD# 3120646 8376 Highway 51 North Millington, Tennessee 38053 Federal Reserve Bank of St. Louis P.O.
PUBLIC DISCLOSURE COMMUNITY REINVESTMENT ACT PERFORMANCE EVALUATION
 PUBLIC DISCLOSURE July 12, 2004 COMMUNITY REINVESTMENT ACT PERFORMANCE EVALUATION 202 Main Street P.O. Box 27 Kalispell, MT 59903 RSSD 2634191 Federal Reserve Bank of Minneapolis 90 Hennepin Avenue, P.O.
PUBLIC DISCLOSURE COMMUNITY REINVESTMENT ACT PERFORMANCE EVALUATION
 PUBLIC DISCLOSURE October 27, 2003 COMMUNITY REINVESTMENT ACT PERFORMANCE EVALUATION First Financial Bank RSSD #48374 214 North Washington El Dorado, Arkansas 71730 Federal Reserve Bank of St. Louis P.O.
PUBLIC DISCLOSURE. September 27, 2004 COMMUNITY REINVESTMENT ACT PERFORMANCE EVALUATION. BPD Bank RSSD No
 PUBLIC DISCLOSURE September 27, 2004 COMMUNITY REINVESTMENT ACT PERFORMANCE EVALUATION RSSD No. 66015 90 BROAD STREET NEW YORK, NEW YORK 10045 Federal Reserve Bank of New York 33 Liberty Street New York,
PUBLIC DISCLOSURE COMMUNITY REINVESTMENT ACT PERFORMANCE EVALUATION
 PUBLIC DISCLOSURE March 21, 2011 COMMUNITY REINVESTMENT ACT PERFORMANCE EVALUATION RSSD #27614 19 Public Square Andover, Ohio Federal Reserve Bank of Cleveland P.O. Box 6387 Cleveland, OH 44101-1387 NOTE:
PUBLIC DISCLOSURE COMMUNITY REINVESTMENT ACT PERFORMANCE EVALUATION
 PUBLIC DISCLOSURE June 12, 2017 COMMUNITY REINVESTMENT ACT PERFORMANCE EVALUATION The First National Bank of Granbury 101 E. Bridge Street Granbury, TX 76048 Office of the Comptroller of the Currency Fort
PUBLIC DISCLOSURE COMMUNITY REINVESTMENT ACT PERFORMANCE EVALUATION
 PUBLIC DISCLOSURE September 29, 2014 COMMUNITY REINVESTMENT ACT PERFORMANCE EVALUATION Manufacturers and Traders Trust Company RSSD No. 501105 One M&T Plaza Buffalo, New York 14203 Federal Reserve Bank
PUBLIC DISCLOSURE COMMUNITY REINVESTMENT ACT PERFORMANCE EVALUATION
 PUBLIC DISCLOSURE August 04, 2014 COMMUNITY REINVESTMENT ACT PERFORMANCE EVALUATION The First, A National Banking Association Charter 22949 6480 U.S. Highway 98 West Hattiesburg, MS 39404 Office of the
U.S. DEPARTMENT OF HUD 05/2016 STATE: PENNSYLVANIA HOUSING TRUST FUND PROGRAM RENTS
 STATE: PENNSYLVANIA --------- 2016 HOUSING TRUST FUND PROGRAM RENTS --------------- Allentown-Bethlehem-Easton, PA-NJ MSA Allentown-Bethlehem-Easton, PA HMFA HOUSING TRUST FUND RENT 362 388 504 659 814
PUBLIC DISCLOSURE COMMUNITY REINVESTMENT ACT PERFORMANCE EVALUATION
 PUBLIC DISCLOSURE April 28, 2014 COMMUNITY REINVESTMENT ACT PERFORMANCE EVALUATION Solvay Bank RSSD No. 722816 1537 Milton Avenue Solvay, New York 13209 FEDERAL RESERVE BANK OF NEW YORK 33 LIBERTY STREET
PUBLIC DISCLOSURE COMMUNITY REINVESTMENT ACT PERFORMANCE EVALUATION
 PUBLIC DISCLOSURE May 7, 2012 COMMUNITY REINVESTMENT ACT PERFORMANCE EVALUATION RSSD #604024 95 West 4 th Street Minster, Ohio Federal Reserve Bank of Cleveland P.O. Box 6387 Cleveland, Ohio 44101-1387
 Page 1 of 20 Advanced Search Search FDIC... Su Home Deposit Insurance Consumer Protection Industry Analysis Regulations & Examinations Asset Sales News & Events About FDIC Home > Regulation & Examinations
PUBLIC DISCLOSURE COMMUNITY REINVESTMENT ACT PERFORMANCE EVALUATION
 PUBLIC DISCLOSURE May 31, 2011 COMMUNITY REINVESTMENT ACT PERFORMANCE EVALUATION RSSD No. 2736291 9600 West Bryn Mawr Rosemont, Illinois 60018 Federal Reserve Bank of New York 33 Liberty Street New York,
PUBLIC DISCLOSURE COMMUNITY REINVESTMENT ACT PERFORMANCE EVALUATION
 PUBLIC DISCLOSURE August 20, 2007 COMMUNITY REINVESTMENT ACT PERFORMANCE EVALUATION RSSD No. 101671 185 Genesee Street Utica, New York 13501 FEDERAL RESERVE BANK OF NEW YORK 33 LIBERTY STREET NEW YORK,
PUBLIC DISCLOSURE COMMUNITY REINVESTMENT ACT PERFORMANCE EVALUATION
 PUBLIC DISCLOSURE September 6, 2016 COMMUNITY REINVESTMENT ACT PERFORMANCE EVALUATION Valley National Bank Charter Number 15790 615 Main Avenue Passaic, NJ 07055 Office of the Comptroller of the Currency
PUBLIC DISCLOSURE COMMUNITY REINVESTMENT ACT PERFORMANCE EVALUATION
 PUBLIC DISCLOSURE July 24, 2017 COMMUNITY REINVESTMENT ACT PERFORMANCE EVALUATION First Financial Bank, National Association Charter Number 4166 400 Pine Street Abilene, TX 79601 Office of the Comptroller
PUBLIC DISCLOSURE COMMUNITY REINVESTMENT ACT PERFORMANCE EVALUATION
 PUBLIC DISCLOSURE January 28, 2002 COMMUNITY REINVESTMENT ACT PERFORMANCE EVALUATION The Callaway Bank RSSD# 719656 5 East Fifth Street Fulton, Missouri 65251 Federal Reserve Bank of St. Louis P.O. Box
PUBLIC DISCLOSURE. February 7, 2011 COMMUNITY REINVESTMENT ACT PERFORMANCE EVALUATION. Webster Bank, National Association Charter Number: 24469
 O LARGE BANK Comptroller of the Currency Administrator of National Banks Washington, DC 20219 PUBLIC DISCLOSURE February 7, 2011 COMMUNITY REINVESTMENT ACT PERFORMANCE EVALUATION Webster Bank, National
PUBLIC DISCLOSURE COMMUNITY REINVESTMENT ACT PERFORMANCE EVALUATION
 PUBLIC DISCLOSURE November 19, 2001 Date of Evaluation COMMUNITY REINVESTMENT ACT PERFORMANCE EVALUATION North Shore Bank of Commerce Name of Depository Institution 126553 Institution s Identification
PUBLIC DISCLOSURE COMMUNITY REINVESTMENT ACT PERFORMANCE EVALUATION
 PUBLIC DISCLOSURE July 1, 2013 COMMUNITY REINVESTMENT ACT PERFORMANCE EVALUATION Whitaker Bank, Incorporated RSSD# 1445943 2001 Pleasant Ridge Drive Lexington, Kentucky Federal Reserve Bank of Cleveland
PUBLIC DISCLOSURE. November 30, 2009 COMMUNITY REINVESTMENT ACT PERFORMANCE EVALUATION. Solvay Bank RSSD No
 PUBLIC DISCLOSURE November 30, 2009 COMMUNITY REINVESTMENT ACT PERFORMANCE EVALUATION Solvay Bank RSSD No. 722816 1537 Milton Avenue Solvay, New York 13209 Federal Reserve Bank of New York 33 Liberty Street
PUBLIC DISCLOSURE. September 13, 1999 COMMUNITY REINVESTMENT ACT PERFORMANCE EVALUATION. BPD INTERNATIONAL BANK RSSD No
 PUBLIC DISCLOSURE September 13, 1999 COMMUNITY REINVESTMENT ACT PERFORMANCE EVALUATION BPD INTERNATIONAL BANK 152 West 57 th Street Carnegie Hall Tower, 5 th Floor New York, NY 10019 FEDERAL RESERVE BANK
PUBLIC DISCLOSURE COMMUNITY REINVESTMENT ACT PERFORMANCE EVALUATION
 PUBLIC DISCLOSURE February 25, 2013 COMMUNITY REINVESTMENT ACT PERFORMANCE EVALUATION The Genoa Banking Company 504311 801 Main Street Genoa, OH 43430 Federal Reserve Bank of Cleveland P.O. Box 6387 Cleveland,