PUBLIC DISCLOSURE COMMUNITY REINVESTMENT ACT PERFORMANCE EVALUATION
|
|
|
- Sharon Bryant
- 5 years ago
- Views:
Transcription
1 PUBLIC DISCLOSURE May 31, 2011 COMMUNITY REINVESTMENT ACT PERFORMANCE EVALUATION RSSD No West Bryn Mawr Rosemont, Illinois Federal Reserve Bank of New York 33 Liberty Street New York, New York NOTE: This document is an evaluation of this institution's record of meeting the credit needs of its entire community, including low- and moderate-income neighborhoods, consistent with safe and sound operation of the institution. This evaluation is not, nor should it be construed as, an assessment of the financial condition of this institution. The rating assigned to this institution does not represent an analysis, conclusion, or opinion of the federal financial supervisory agency concerning the safety and soundness of this financial institution.
2 TABLE OF CONTENTS Institution Rating Institution s CRA Rating... BB1 Performance Test Ratings Table... BB1 Institution Description of Institution... BB2 Scope of Examination... BB3 Conclusions With Respect to Performance Tests... BB5 Fair Lending or other Illegal Credit Practices Review... BB12 MSA (New York-Northern New Jersey-Long Island, NY-NJ-PA) Multi-State Metropolitan Area MSA Multi-state Metropolitan Area Rating... BB13 Scope of Examination... BB13 Description of Operations... BB13 Conclusions With Respect to Performance Tests... BB15 State of California California State Rating... BB23 Scope of Examination... BB23 Description of Operations... BB23 California Metropolitan Area (Full Review) Description of Operations in MSA ((Los Angeles-Long Beach-Santa Ana, CA)... BB25 Conclusions With Respect to Performance Tests... BB26 California Metropolitan Areas (Limited Review)... BB33 State of Illinois Illinois State Rating... BB34 Scope of Examination... BB34 Illinois Metropolitan Area (Full Review) Description of Operations in MSA (Chicago-Naperville-Joliet, IL-IN-WI)... BB35 Conclusions With Respect to Performance Tests... BB37 State of Florida Florida State Rating... BB44 Scope of Examination... BB44 Description of Operations... BB44 Conclusions With Respect to Performance Tests... BB46 BBi
3 Florida Metropolitan Area (Full Review) Description of Operations in MSA (Miami-Fort Lauderdale-Pompano Beach, FL) BB47 Conclusions With Respect to Performance Tests... BB48 Florida Metropolitan Area (Full Review) Description of Operations in MSA (Orlando-Kissimmee-Sanford, FL)... BB57 Conclusions With Respect to Performance Tests... BB59 Exhibits Exhibit 1: Summary of Key Assessment Area Data for All Rated Areas... BB6 Exhibit 2: Summary of Lending Activity... BB7 Exhibit 3: Originations and Purchases Inside and Outside the Assessment Area... BB8 Exhibit 4: Summary of Key Assessment Area Data: California... BB24 Exhibit 5: Summary of Key Assessment Area Data: Florida... BB45 Appendices CRA Appendix A: Scope of Examination... BB66 CRA Appendix B: Summary of State and Multi-state Metropolitan Area Ratings... BB67 CRA Appendix C: Summary of Branch Locations... BB68 CRA Appendix D: Community Development Loans... BB69 CRA Appendix E: Qualified Investments... BB70 CRA Appendix F: Bank and Aggregate Lending Tables, MSA BB71 CRA Appendix G: Glossary.....BB72 CRA Appendix H: Assessment Area Maps...BB75 BBii
4 INSTITUTION RATING INSTITUTION'S CRA RATING: is rated Satisfactory. The following table indicates the performance level of the institution with respect to the lending, investment and service tests. PERFORMANCE LEVELS PERFORMANCE TESTS Lending Test* Investment Test Service Test Outstanding X High Satisfactory Low Satisfactory X X Needs to Improve Substantial Noncompliance *The lending test is weighted more heavily than the investment and service tests in determining the overall rating. The major factors supporting the institution s rating follow: The overall volume of lending related to the Home Mortgage Disclosure Act ( HMDA ) and small businesses reflected adequate responsiveness to credit needs in the bank s assessment areas; The overall level of community development lending was adequate; The overall geographic distribution of lending was excellent; The overall distribution of loans among borrowers of different income levels and businesses of different sizes was good; The level of qualified investments and grants was adequate; Retail delivery systems were readily accessible to geographies and individuals of differing income levels within the assessment areas; and, provided an excellent level of community development services throughout its assessment areas. BB1
5 DESCRIPTION OF INSTITUTION* INSTITUTION * As of December 31, Total assets $9.0 billion Net loans & leases $6.6 billion Total domestic deposits $6.6 billion Number of branches 96 Headquarters Chicago, IL Bank holding company Popular North America, Inc. (also referred to as BPNA or Banco Popular ) is a principal subsidiary of Popular North America, Inc., a bank holding company. Popular North America, Inc. is one of several banking entities indirectly owned by Popular, Inc., a diversified, publicly owned bank holding company located in Hato Rey, Puerto Rico. BPNA s primary lines of business are commercial and retail banking. BPNA s domestic deposits are located in 96 branches in five states (New York, New Jersey, Illinois, Florida, and California). BPNA s largest presence is in the combined New York/New Jersey Metropolitan Area and in California, with 66 percent of all branches located in those states. BPNA s assets total $9 billion and net loans and leases total $6.6 billion, representing 73 percent of total assets. At this examination, BPNA had four state or multi-state Metropolitan Statistical Areas (MSA) rated areas which encompassed 8 MSA or Metropolitan Division (MD) assessment areas, as detailed below: 1. MSA (New York-Northern New Jersey-Long Island, NY-NJ-PA) MD (New York-White Plains-Wayne, NY-NJ), including Bronx, Kings (Brooklyn), New York, and Queens Counties in New York and Hudson and portions of Passaic County in New Jersey. MD (Newark-Union, NJ-PA), including Essex and Union Counties. MD (Edison-New Brunswick, NJ), including portions of Middlesex County. 2. State of California MSA (Los Angeles-Long Beach-Santa Ana, CA), consisting of: o MD (Los Angeles-Long Beach-Glendale, CA), including Los Angeles County. o MD (Santa Ana-Anaheim-Irvine, CA), including Orange County. MSA (San Diego-Carlsbad-San Marcos, CA), including portions of San Diego County. BB2
6 3. State of Illinois MSA (Chicago-Joliet-Naperville, IL-IN-WI), consisting of: o MD (Chicago-Joliet-Naperville, IL), including Cook and DuPage Counties, and portions of Kane County. 4. State of Florida MSA (Orlando-Kissimmee-Sanford, FL), including Orange, Seminole County, and portions of Osceola County. MSA (Miami-Fort Lauderdale-Pompano, FL), consisting of: o MD (Fort Lauderdale-Pompano Beach-Deerfield Beach, FL), including Broward County. o MD (Miami-Miami Beach-Kendall, FL), including Miami-Dade County. During the evaluation period, BPNA underwent a restructuring in 2009 to refocus its core business in response to the economic contraction in the real estate market. This contraction saw a dramatic decline in applications and loan originations as demand for bank services declined along with the decline in property values within many areas serviced by BPNA. BPNA closed, sold or consolidated 55 branches and realigned its assessment areas to a smaller regional market. The current evaluation period reflects the elimination of the Texas assessment area and significant reductions in BPNA s Florida assessment area. In the remaining portions of its assessment area, BPNA removed one MSA in California, two counties in its NY Metro MSA, and one county in its Illinois MSA. SCOPE OF EXAMINATION Procedures BPNA s performance was reviewed using the Federal Financial Institutions Examination Council s Interagency CRA Procedures for Large Retail Financial Institutions. Products Home purchase, refinance, home improvement, and multi-family loans reportable under HMDA and small business loans reportable under CRA were analyzed. Examiners verified the integrity of HMDA and small business loan data reported by BPNA and its affiliates in 2008, 2009 and The inclusion of consumer loans is optional under the CRA regulation and BPNA chose not to report consumer loans at this exam. Small farm loans were not analyzed as volume was insufficient. Multifamily loans qualifying as community development loans were also considered in the evaluation of community development lending. Examination Period HMDA-related and small business loan originations from January 1, 2008 through December 31, 2010 were analyzed. Examiners also reviewed activities pertaining to the service test, community development ( CD ) loans and qualified investments for the same period. BB3
7 Lending Distribution Analysis Only loans in BPNA s assessment areas were included in the analysis of geographic and borrower distribution. To evaluate the geographic distribution of HMDA-related loans, the proportion of loan originations was compared with the proportion of owner-occupied housing units in low- and moderate-income ( LMI ) and non-lmi geographies. For small business loans, the analysis compared the proportion of loan originations with the proportion of businesses located in LMI and non-lmi geographies. Performance was rated based on penetration in LMI geographies, but performance in LMI geographies was analyzed separately. The analysis took into account lending opportunities in low- income census tracts relative to moderate-income tracts as indicated by demographic data and aggregate lending patterns. In order to analyze the borrower characteristics of HMDA-related loans, the proportion of originations to LMI borrowers was compared with the proportion of LMI families in the assessment areas. Income estimates from the U.S. Department of Housing and Urban Development ( HUD ) were used to categorize borrower income. HUD-adjusted median family income figures for 2008, 2009 and 2010 were used to categorize borrower income levels for loans originated in those respective years Dun and Bradstreet (D&B) data were used for demographic information relating to the proportion of businesses with gross annual revenues ( GAR ) of less than or equal to $1 million. The size of the small business loan was also used as a proxy to identify lending to smaller businesses. HMDA-related and small business loan performance for 2009 was also compared with the aggregate of all lenders in BPNA s assessment areas subject to HMDA and/or CRA small business loan reporting. The analysis of HMDA-related and small business lending data was conducted as of December 31, Since the analysis of geographic and borrower distribution only considers activity within BPNA s assessment area, HMDA-related and small business loan data for assessment areas removed in 2008, 2009 and 2010 were not be considered in the geographic and borrower evaluation. Deriving Overall Conclusions BPNA s performance in multi-state MSA (New York-Northern New Jersey-Long Island, NY-NJ-PA) received the most weight in determining BPNA s overall rating because of the concentration of deposits, lending and demographics in the multi-state assessment area. The state of California was also weighted significantly in determining the bank s overall rating because of its concentration of branches, branch deposits, and lending. For additional details, see Exhibit 1, which contains a summary of assessment area data for all rated areas. In reaching a conclusion about BPNA s overall performance within an individual assessment area, products were weighted based on their volume in that area. BB4
8 MSA (San Diego Carlsbad San Marcos, CA) did not have a substantial effect on the overall California assessment area and as such was reviewed as a limited scope assessment area. MSA had 1% of deposits, 5% of loans, and no branches in the State of California assessment area. Twenty-five community contacts were conducted by examiners or obtained from other supervisory agencies in order to understand community credit needs. Community contacts were located throughout BPNA s assessment areas and included representatives of community-based organizations, municipalities and quasi-government agencies. Demographic and economic information also impacts BPNA s performance context and is discussed in detail within each full scope area. Information was obtained from publicly available sources including the U.S. Department of Commerce s Bureau of the Census 2000, National Association of Realtors, the U.S. Department of Labor, and the U.S. Department of Housing and Urban Development ( HUD ). CONCLUSIONS WITH RESPECT TO PERFORMANCE TESTS LENDING TEST BPNA s overall performance in meeting the credit needs of its assessment areas under the lending test is rated low satisfactory. Lending Activity: BPNA s responsiveness to the retail credit needs of its assessment areas was adequate, given its capacity to meet assessment area credit needs, overall market conditions including the state of the housing market, and weak economic conditions. This conclusion is based on adequate responsiveness in all assessment areas except for the Chicago MSA (MSA 16980) where lending activity was poor. BPNA s lending activity rating was determined by evaluating the volume of HMDA-related and small business loans originated during the examination period. Loan volume declined significantly since the prior evaluation. As discussed previously, BPNA s assessment areas changed significantly during each year of the examination period as the bank restructured its operations focusing on a more localized banking operation which impacted lending activity. Overall, 6,551 Home Purchase, Refinance, Home Improvement, and Small Business loans were made during the examination period, totaling $903 million. This represents a large decrease in the number and in the dollar volume of HMDA-related and small business loans made compared to the prior review. It should also be noted that the prior review period covered two years of lending, compared to three for the current evaluation period. BB5
9 Exhibit 1 Summary of Key Assessment Area Data ASSESSMENT AREA DATA Multi-State MSA State of California State of 'Florida State of Illinois Total Population 4 10,076,641 14,438,553 5,255,691 6,396,455 36,167,340 Population % of AA population 28% 40% 14% 18% 100% Families 2,372,794 3,315,112 1,318,384 1,541,981 8,548,271 Families % of AA families 28% 39% 15% 18% 100% Total Census Tracts 4 2,700 3, ,513 8,221 Tracts % AA tracts 33% 38% 11% 18% 100% LMI tracts 1,207 1, ,216 LMI tracts % all AA LMI tracts 37% 34% 9% 20% 100% Total Owner-Occupied Units 4 1,233,492 2,468,516 1,232,173 1,415,874 6,350,055 Units % of AA units 20% 39% 19% 22% 100% Business Establishments 5 443, , , ,834 1,847,288 Bus. est. % AA bus. est. 24% 41% 21% 14% 100% Number of Branches Branches % all branches 41% 25% 21% 13% 100% Branches in LMI tracts LMI branches % AA LMI branches 47% 23% 16% 14% 100% Branch Deposits ($'000s) 2 3,732,222 1,424,889 1,092,218 1,023,216 7,272,545 Deposits % AA deposits 51% 20% 15% 14% 100% Deposit Market Share (% )/ Rank in Market*.40%/25.17%/40.27%/43.36%/36.51%/23 Home Purchase Originations HP originations % AA orig. 18% 21% 34% 27% 100% Refinance Originations Refi orig. % AA orig. 31% 27% 21% 21% 100% Home Improvement Originations Home Improvement orig. % AA orig. 33% 24% 25% 18% 100% Small Business Originations ,996 SB orig. % AA orig. 29% 23% 31% 17% 100% Combined Loan Totals 1, , ,991 % of AA Orig. 29% 24% 29% 18% 100% (1) Branch numbers are as of 12/31/2010. (2) Branch deposits and deposit market share are from the FDIC as of 6/30/10. (3)Originations are loans reported under HMDA or CRA small business reporting for 2008, 2009 and (4)Demographic information was obtained from the 2000 Census. (5)Business establishments information was reported by D&B for Totals BB6
10 BPNA s market share in terms of deposits and particularly in terms of loans was low, with market share figures for home purchase, refinance, and small business lending all below 0.15% while home improvement market shares ranged between 0.23% and 0.92%. Home purchase, refinance and small business loan market share was consistently below the deposit market share in each of BPNA s assessment areas. Also, BPNA s performance was below the lending activity volume of similarly situated banks based on the number of loans per billion dollars of deposits in all MSAs except for the Miami, Florida MSA (MSA 33100), which had similar performance as similarly situated banks. While BPNA continues to serve the credit needs of its market, it has substantially shrunk portions of its assessment areas. As a result, the number of overall HMDA-related loans and the number of HMDA-related loans made in LMI census tracts and to LMI persons are low, even though the majority of overall lending is still inside the bank s assessment area. Exhibit 2 SUMMARY OF LENDING ACTIVITY January 1, 2008 December 31, 2010 LOAN TYPE # % $(000s) % HMDA Home Purchase 1, $ 138, HMDA Refinancings $ 136, HMDA Home Improvement $34,642 3 HMDA Multi Family $160, Total HMDA -- Related 2, $ 470, Total Small Business 4, $ 593, TOTAL LOANS 6, $ 1,063, Assessment Area Concentration: A high percentage of loans originated by BPNA were extended in BPNA s assessment areas as detailed in the chart below. HMDA loan activity was impacted by several events that occurred during the examination period. These events include the sale of branches in the state of Texas in 2009, the closure, consolidation, and relocation of branches in the state of California in 2009 and 2010, the sale, consolidation and relocation of branches in the states of New York and New Jersey in 2009 and In addition, these events also include the relocation and consolidation of branches in the State of Florida in 2009, and the relocation and consolidation of branches in the Chicago MSA in 2008, 2009 and 2010, and the consequent realignment of assessment areas. BB7
11 Exhibit 3 LENDING INSIDE AND OUTSIDE THE ASSESSMENT AREA January 1, 2008 December 31, 2010 LOAN TYPE INSIDE OUTSIDE # % $ (000S) % # % $ (000S) % 2008 HMDA $193, $125, Small Business 2, $263, $174, TOTAL , $456, , $300, HMDA $79, $20, Small Business $70, $28, TOTAL $150, $48, HMDA $41, $10, Small Business $43, $13, TOTAL $84, $23, Note: This table includes only loans originated or purchased by the bank. Geographic Distribution: The overall geographic distribution of HMDA-related and small business loans reflected excellent penetration in LMI geographies. This conclusion is based on excellent penetration in the multi-state MSA (New York-Northern New Jersey-Long Island, NY-NJ-PA) and the state of Illinois and good lending penetration in the states of California and Florida. The analysis considered performance context issues, such as the number of owner-occupied units in LMI geographies and the market aggregate s performance. Small business lending was factored in significantly in the overall conclusion for the various assessment areas, since approximately three-quarters of all lending was small business lending over the three year evaluation period. Borrower Distribution: The overall distribution of loans among borrowers of different income levels and businesses of different sizes was good based on good distribution in the multi-state MSA (New York- Northern New Jersey-Long Island, NY-NJ-PA) and the State of California, Illinois and Florida. In making this conclusion, consideration was given to the wide disparity between housing prices and incomes, which makes owner-occupied housing unaffordable to most LMI families residing within the assessment areas. Overall, small business lending factored significantly in the overall conclusion for the various assessment areas, since approximately three-quarters of all lending was small business lending over the three year evaluation period. BB8
12 BPNA s borrower and geographic distribution performance was considered in the context of the low volume of HMDA-related lending and small business lending noted in the lending activity evaluation. In some instances, the evaluation of HMDA-related products in LMI geographies or to LMI persons reflected consideration of the very limited lending opportunities, as denoted in the low number of loans made by the aggregate. BPNA s use of various innovative and flexible products that served to enhance the level of lending in low- and moderate-income geographies and to low- and moderate-income borrowers was limited. Community Development Lending: BPNA s community development lending performance was adequate based on adequate performance in multi-state MSA (New York-Northern New Jersey-Long Island, NY-NJ-PA) and the states of California and Illinois and good performance in the state of Florida. Community Development Lending Purpose # $('000s) Affordable Housing 385 $363,934 Community Services 60 $74,777 Economic Development 8 $8,522 Revitalize and Stabilize 18 $55,038 Totals 471 $502,271 As shown in the table above, the bank extended 471 community development loans totaling $502 million. Of note are new commitments amounting to $271 million, representing 54% of the total activity. BPNA s community development loans were not particularly complex or innovative and most of the loans were provided in the normal course of commercial lending. This total also includes loans that may be outside of BPNA s current assessment area, as delineated December 31, 2010, but originated inside BPNA s assessment area during 2008, 2009 and For instance, community development loans originated in 2008 in Texas would be outside BPNA s current assessment area as delineated December 31, 2010, given that most of Texas was removed from BPNA s assessment area in However, the loans were inside the bank s assessment area at the time they were originated and are therefore considered inside BPNA s assessment area. The same holds true for community development investments. For details on community development lending and investment volumes, see Appendix D and E. BPNA s community development lending demonstrated adequate responsive to community needs. In terms of dollar amounts, affordable housing initiatives represented 72% of total activity. According to community contacts, financing for affordable housing is an important need in all of BPNA s assessment areas. Affordable housing initiatives were primarily multifamily and construction loans which represented 49% and 18% respectively of all community development loans. BB9
13 INVESTMENT TEST BPNA s investment test performance is rated low satisfactory. There was an adequate level of qualified investments and grants in all assessment areas. As indicated in the table below, BPNA s volume of qualified investments totaled approximately $48 million, an annualized increase of 31% when compared the investment activity noted at the previous examination. Thirty-three million, or 69%, were new investments made since the prior examination. The table to the right illustrates that BPNA s investments exhibited good responsiveness to the most pressing credit and community development needs throughout the assessment areas. Specifically, community contacts noted that affordable housing was a primary community development need. Qualified Investments INVESTMENT PURPOSE # $( 000s) Affordable Housing 37 43,407 Community Services 202 1,823 Economic Development 48 2,298 Revitalize & Stabilize 6 16 Total ,544 BPNA made a total of $38 million, or 81% of investments in terms of dollar amount in mortgage-backed securities, which are not considered innovative or complex. BPNA s $5 million in investments in tax credits are considered complex. In addition, comparisons of BPNA s performance in its various assessment areas was relatively weak, compared to peer bank s performances. Qualified investments made in Texas totaled $1.9 million or 4% of total qualified investments and are included in the overall investment totals as previously noted. Details of investments may be found in Appendix E. SERVICE TEST BPNA s rating on the service test is outstanding based on its excellent performance in the multistate MSA (New York-Northern New Jersey-Long Island, NY-NJ-PA) and in the states of California, Illinois and Florida. Retail Services: BPNA s branches were readily accessible to BPNA s geographies and individuals of different income levels in its assessment areas. Of BPNA s 96 branches, 57, or 59%, were located in LMI tracts. This compares very favorably with the overall assessment areas population residing in LMI areas. According to the 2000 U.S. Census data, 40% of the overall assessment areas population resides in LMI areas. In addition, BPNA offers alternative delivery systems including a web-site that is available in both English and Spanish, toll-free telephone and on-line banking. BB10
14 Community Development Services: BPNA is a leader in providing community development services throughout its assessment areas. During the evaluation period, BPNA provided approximately 600 services, a 10 percent increase from the previous evaluation period. Examples of qualified services included sponsoring and participating in a significant number of seminars and presentations relating to affordable mortgages, small business development, financial literacy, and the provision of financially related technical services to community organizations. Additionally, approximately 75 BPNA staff members provided over 130 qualified service activities by serving on the boards of directors or acting as key members of approximately 100 community development organizations, similar to levels noted at the previous evaluation. The community development organizations missions cover a wide spectrum of activities, including economic and business development, affordable housing, education, health services and numerous other activities that aid LMI individuals. The following are examples of community development services provided by BPNA: In conjunction with a leading provider of government sponsored health plans including Medicare, Medicaid, and state children s health insurance programs, BPNA advises LMI seniors on financial matters. BPNA maintains a community strategic partnership with Junior Achievement across its various assessment areas. Employees volunteer in classrooms teaching various business subjects and raise funds for organizational interests. The majority of the students served by Junior Achievement are LMI, or the school in which the program runs is located in an LMI census tract. In addition, BPNA staff act as board members at several Junior Achievement organizations in various cities within BPNA s assessment areas. A BPNA branch manager is chairperson of an organization in Chicago that provides technical assistance and individual foreclosure prevention counseling and serves as a panelist at the agency s foreclosure prevention workshops and Fix Your Mortgage events. BPNA collaborates with an organization that provides financial presentations to LMI people seeking to start their own businesses. BPNA staff also act as board members for an organization which provides micro-financing credit and other business services to small business owners who do not have access to traditional sources of financing. BPNA offers a free checking account for small businesses that requires no minimum balance, no monthly fee, and provides unlimited BPNA ATM access. The account is offered through BPNA s branch network in New York, New Jersey, California, Illinois, Central and Southern Florida. BB11
15 A BPNA employee acts as a board member of an organization that owns and operates a section 202 HUD-financed multifamily housing project for the elderly. The project is located in a low-income census tract and consists of 80 housing units. A BPNA employee acts as a board member of an organization that assists LMI individuals in areas such as: health, education, employment, economic, community development and housing. The organization is located in a lowincome census tract in the Bronx, New York. FAIR LENDING OR OTHER ILLEGAL CREDIT PRACTICES REVIEW BPNA is in compliance with the substantive provisions of the anti-discrimination laws and regulations. No evidence of discriminatory or other illegal credit practices were identified as being inconsistent with helping to meet community credit needs. BB12
16 MULTISTATE METROPOLITAN AREA (FULL REVIEW) MSA (NEW YORK-NORTHERN NEW JERSEY-LONG ISLAND, NY-NJ-PA) CRA RATING FOR MULTISTATE MSA 35620: SATISFACTORY The lending test is rated: Low Satisfactory The investment test is rated: Low Satisfactory The service test is rated: Outstanding The major factors supporting the rating include the following: Adequate responsiveness to assessment area credit needs; An adequate level of community development lending; Excellent geographic distribution of loans in BPNA s assessment areas; Good distribution of loans among individuals of different income levels and businesses of different revenue sizes; An adequate level of qualified investments; Readily accessible retail delivery systems to geographies and individuals of different income levels; and, An excellent level of community development services SCOPE OF EXAMINATION Examiners conducted a full-scope review of multi-state MSA (New York, Northern New Jersey-Long Island, NY-NJ-PA). BPNA s activities in the multi-state MSA make up a significant proportion of BPNA s operations and were weighted as such when deriving BPNA s overall CRA ratings. DESCRIPTION OF INSTITUTION S OPERATIONS As of December 31, 2010, BPNA has 39 branch locations in MSA (New York-Northern New Jersey-Long Island, NY-NJ-PA) also referred to as the multi-state MSA or the multistate assessment area representing over a third of its total branch network. A total of 27 or 69% of BPNA s branches in the multi-state MSA are located in LMI census tracts. Based on the Federal Deposit Insurance Corporation ( FDIC ) Deposit Market Share Report as of June 30, 2010, 51% of BPNA s total deposit base was held in the MSA. Lending in the MSA represented 29% of the total combined HMDA-related and small business originations extended throughout BPNA s overall assessment areas. BB13
17 The area is a highly competitive market, home to some of the largest money center banking institutions in the US. BPNA captured a deposit market share of 0.56%, ranking 19 th in deposits among the 171 depository institutions operating in this MSA assessment area. PERFORMANCE CONTEXT Demographic Characteristics BPNA s assessment area in MSA (New York-Northern New Jersey-Long Island, NY-NJ- PA) consists of portions of three metropolitan divisions, MD (New York, White Plains, Wayne NY-NJ), MD (Newark-Union, NJ-PA), and MD (Edison-New Brunswick, NJ). According to the 2000 Census, the population of the assessment area exceeds 10 million, with 85% located in MD (New York, White Plains, Wayne, NY-NJ). Approximately 49% of the MSA assessment area population resides in LMI geographies, and the LMI geographies are concentrated in New York City, especially in the Bronx. Forty-five percent of the geographies in the assessment area are LMI. Income Characteristics According to HUD, the multi-state 2010 median family income was $62,300. Of the 2.4 million families in the assessment area, 30% are considered low-income, 17% are moderate-income, and 17% have incomes below the poverty level. As shown in the table to the right, there is a wide disparity in income levels across the MSA. For example, in Middlesex County the Median Family Income ( MFI ) was $102,000 in In contrast, the 2010 MFI in Bronx County was $62,300 in In addition, low-income and high poverty in New York City, particularly outside of Manhattan, make it difficult for families to afford homes. Housing Characteristics HUD MEDIAN FAMILY INCOMES Area MSA $61,600 $62,300 MD $64,800 $65,600 Essex, Union Counties, NJ $88,400 $88,800 Bergen-Passaic Counties, NJ $91,200 $92,200 Middlesex, NJ $92,700 $102,000 The assessment area contains 4 million housing units, of which 31% or 1.2 million are owneroccupied, according to the 2000 Census. Of the available owner-occupied housing units, 4% and 19% are located in low- and moderate-income census tracts, respectively. During the examination period, housing prices decreased. According to the National Association of Realtors, the median sales price for existing single-family homes in the New York-Northern New Jersey-Long Island MSA was $437,900 in 2008 and $393,700 in Despite this decrease, higher home values are found in the suburban areas of the assessment area and in Manhattan (New York County). Most families throughout the assessment area, particularly LMI families, cannot afford to own a home because of the sharp disparity between incomes and housing costs. This indicates the need to provide affordable mortgage programs and develop affordable rental properties for LMI residents. Information received from community contacts also identified the need for affordable housing in this MSA. BB14
18 Labor, Employment and Economic Characteristics As summarized in the chart at right, overall unemployment rates increased during the evaluation period and were high overall, reflecting the economic contraction during this timeframe and resulted in fewer lending opportunities. Unemployment levels varied across BPNA s assessment area, with higher unemployment rates in Essex and Passaic Counties, NJ. Additional performance context data for this assessment area is provided in the Assessment Area Demographics report on the next page. Annual Unemployment Rates Area MD (NY-WP-Wayne, NY-NJ) 8.7% 8.9% Essex County, NJ 10.3% 11.0% Union County, NJ 9.3% 9.6% Bergen County, NJ 7.8% 8.1% Middlesex County, NJ 8.5% 8.7% Passaic County, NJ 11.0% 11.3% Source: Bureau of Labor Statistics CONCLUSIONS WITH RESPECT TO PERFORMANCE TESTS IN MULTISTATE MSA (NEW YORK-NORTHERN NEW JERSEY-LONG ISLAND, NY-NJ-PA) LENDING TEST BPNA s performance under the lending test in MSA is rated low satisfactory. This conclusion is based on adequate community development loan performance, good borrower distribution performance, excellent geographic distribution performance and adequate lending activity performance. Some of the data used to evaluate BPNA s performance in this MSA assessment area appears in Appendix D. Lending Activity: BPNA s lending activity in MSA was considered adequate based on lending activity levels, market share and comparison to peer banks and market aggregate data. Performance in small business lending was considered adequate while HMDA-related lending was poor. For the three year evaluation period, lending activity totaled 1,161 loans consisting of 39 home purchase, 127 refinance, 122 home improvement and 873 small business loans. Lending activity declined significantly compared to the prior evaluation period, during which over a two-year period, lending activity totaled 2,792 loans consisting of 248 home purchase, 414 refinance, 259 home improvement, and 1,871 small business loans. In the MSA, BPNA had a deposit market share of 0.74% of all deposits, compared to a market share of 0.04% in home purchase lending, 0.06% in refinance lending, 0.23% in home improvement lending and 0.06% in small business lending. BPNA s performance was above the lending activity volume of similarly-situated banks in small business lending but below the lending activity volume of similarly-situated banks in HMDA lending based on the number of loans per billion dollars of deposits. While lending market shares are less than deposit market share, BPNA competes in a highly competitive market and overall market aggregate lending was reduced due to the economic recession in the MSA assessment area. BB15
19 Income Categories Assessment Area Demographics Tract Distribution Assessment Area : MSA Families by Tract Income Families < Poverty Level as % of Families by Tract Families by Family Income # % # % # % # % Low-income , , , Moderate-income , , , Middle-income , , , Upper-income , , , Unknown-income Total Assessment Area 2, ,372, , ,372, Housing Units by Tract Housing Types by Tract Owner-occupied Rental Vacant # % % # % # % Low-income 568,882 45, , , Moderate-income 1,200, , , , Middle-income 1,132, , , , Upper-income 1,073, , , , Unknown-income Total Assessment Area 3,974,801 1,233, ,528, , Businesses by Tract & Revenue Size Total Businesses by Less Than or = $1 Revenue Not Tract Over $1 Million Million Reported # % # % # % # % Low-income 42, , , , Moderate-income 99, , , , Middle-income 107, , , , Upper-income 186, , , , Unknown-income 6, , Total Assessment Area 443, , , , Percentage of Total Businesses: Geographic Distribution: The geographic distribution of HMDA-related and small business loans was excellent based on excellent performance of small business lending in LMI geographies and excellent HMDArelated penetration in low and moderate-income census tracts. The table on the following page summarizes lending performance in these tracts. Although lending volumes are low, BPNA made 1, or 4% of its home purchase loans, 2, or 3% of its refinance loans, and 2, or 9%, of its home improvement loans in low-income geographies, exceeding the aggregate s 4% of home improvement loans and slightly below the aggregate s 6% of home purchase and 4% of refinance loans. BPNA s home improvement lending also compares well to the demographics of the assessment area, which indicate that 4% of the available owner-occupied housing units are located within low-income geographies. BB16
20 MSA (New York-Northern New Jersey-Long Island, NY-NJ-PA) Product Home Purchase Refinance Home Improvement Small Business Low-Income Census Tracts BPNA Performance EXCELLENT EXCELLENT EXCELLENT EXCELLENT 2009 Aggregate Comparison SLIGHTLY BELOW SLIGHTLY BELOW ABOVE ABOVE Moderate-Income Census Tracts BPNA Performance EXCELLENT EXCELLENT EXCELLENT EXCELLENT 2009 Aggregate Comparison ABOVE ABOVE ABOVE ABOVE When compared to the level of owner-occupied housing units and to the aggregate performance, BPNA s 2008 and 2010 home purchase, refinance and home improvement lending was excellent. BPNA made 30% of its home purchase, 25% of its refinance, and 27% of its home improvement loans in moderate-income geographies, exceeding the aggregate s 21% for home purchase loans, 16% for refinance loans, and 17% for home improvement loans. BPNA s HMDA-related loan performance also compares well to the demographics of the assessment area, which indicate that 19% of the available owner-occupied housing units are located within moderate-income geographies. BPNA s 2009 HMDA-related performance was similar to its 2009 and 2010 performance. BPNA originated 19% and 36% of its small business loans in low- and moderate-income geographies, respectively, significantly above the aggregate s 7% and 19%. BPNA s performance in low and moderate-income geographies is also above the demographics of the MSA, where 10% of all small businesses operate in low-income geographies and 23% of all small businesses operate in moderate-income geographies. BPNA s 2008 and 2010 small business performance was similar to its 2009 performance. Distribution by Borrower Income and Revenue Size of the Business: BPNA s lending to LMI borrowers and small businesses of different sizes in the multistate MSA was good based on a good level of lending to moderate-income borrowers and small businesses and an adequate level of lending to low-income borrowers, as indicated in the chart on the following page. BB17
21 Low-Income Borrowers BPNA s HMDA-related lending performance in lending to low-income borrowers was adequate overall when compared to the 30% of families in the MSA which are of low-income and the performance of the aggregate as well as consideration of performance context issues related to home affordability in the assessment area. During the examination period the bank made 1, or 4%, 1, or 2%, and 6, or 27%, of its home purchase, refinance, and home improvement loans to low-income borrowers respectively. MSA (New York- Northern New Jersey- Long Island, NY-NJ-PA) Low-Income Borrowers Moderate-Income Borrowers Product BPNA Performance 2009 Aggregate Comparison BPNA Performance 2009 Aggregate Comparison Home Purchase POOR POOR ABOVE BELOW Refinance POOR SLIGHTLY BELOW GOOD SLIGHTLY ABOVE Home EXCELLENT EXCELLENT Improvement ABOVE ABOVE Lending to Businesses with GAR <= $1 million 2009 Aggregate Comparison Small Business GOOD ABOVE BPNA s performance for home purchase and home improvement was significantly above the aggregate while its performance for refinance loans was below. The aggregate made 2%, 2%, and 5% of its home purchase, refinance, and home improvement loans to low-income borrowers, respectively. Performance for 2008 and 2010 was comparable to 2009 performance for home purchase and refinance lending. BPNA made no home purchase loans to low-income borrowers in 2008 and Conversely, refinance performance was slightly stronger in 2008 and and 2010 home improvement performance was slightly weaker than 2009 performance. Moderate-Income Borrowers BPNA s HMDA-related lending performance to moderate-income borrowers was good overall when compared to the 17% of families in the MSA who are of moderate-income. The bank made 1, or 4%, 6, or 9%, and 5, or 23%, of its home purchase, refinance, and home improvement loans to moderate-income borrowers respectively. BPNA s performance for home purchase loans was significantly below the aggregate while refinance and home improvement lending performance was above the aggregate. The aggregate made 11%, 8%, and 14% of its home purchase, refinance, and home improvement loans to moderate-income borrowers, respectively. BB18
22 Performance in 2008 and 2010 was stronger than 2009 performance for home purchase and refinance lending and comparable to 2009 performance for home improvement lending. Lending to Businesses of Different Sizes BPNA provided a good level of lending to small business borrowers with gross annual revenue (GAR) of $1 million or less. BPNA made 56% of its small business loans to these businesses, compared to the 86% of business establishments in the MSA with GAR of $1 million or less. Performance was significantly above the aggregate which made 17% of its small business loans to businesses with GAR of $1 million or less. BPNA made 82% of its small business loans in amounts of $100,000 or less, which was slightly below the aggregate which made 96% of its small business loans in amounts of $100,000 or less. The average loan size was $77,000. Performance in 2008 and 2010 was comparable to Community Development Lending: BPNA s level of community development lending in MSA was adequate with 101 loan originations totaling $162 million or 32% of total community development lending. 95% of all community development lending came from the New York State portion of the MSA while 5% was from New Jersey. Performance in the Totals ,681 MSA was down 21% compared to the last examination when BPNA reported $206 million in community development lending within the MSA. Performance within the MSA was directed at affordable housing with 48% of all community development lending activity. A total of $115 million or 71% of community development lending was from the current period. Lending outside the assessment area in the broader statewide or regional area that includes the assessment area totaled $1.8 million or 1% of the multi-state community development activity. Community development lending performance is below that of similarly-situated large retail banks in the MSA. Examples of community development lending included: Community Development Lending Purpose # $( 000s) Affordable Housing 41 78,046 Community Services 49 53,026 Economic Development 1 1,950 Revitalize and Stabilize 10 28,659 A $17 million loan to construct 89 units of housing, of which 67 units must be affordable to LMI purchasers under New York City s Housing Preservation and Development ( HPD ) affordable cooperative program. A $3 million commercial mortgage to finance renovations to a building in an Empire Development Zone in the Bronx. The business employs 150 workers, the majority of which are of LMI. Proceeds of the loan will allow for business expansion. A $1 million line of credit to a nonprofit corporation that seeks to revitalize the Brownsville community of Brooklyn by providing primary health care services and economic development opportunities. The corporation also provides health care services in other disadvantaged areas in Brooklyn. BB19
23 2009 Aggregate Comparison Loan Distribution Table Assessment Area: MSA HMDA Income Categories By Tract Income By Borrower Income Bank Aggregate Bank Aggregate # % % $(000s) % % $(000s) # % % $(000s) % % $(000s) Home Purchase Low 1 4.3% 4.2% 5.5% 4.8% 1 4.3% 4.1% 2.0% 0.8% Moderate % 29.0% 21.2% 17.0% 1 4.3% 2.3% 10.9% 5.5% Middle % 30.1% 34.5% 27.3% % 41.6% 22.6% 16.2% Upper % 36.7% 38.3% 49.8% % 46.2% 52.8% 66.3% Unknown 0 0.0% 0.0% 0.5% 0.9% 2 8.7% 5.8% 11.6% 11.3% Total % 100.0% 100.0% 100.0% % 100.0% 100.0% 100.0% Refinance Low 2 3.1% 3.3% 3.5% 3.2% 1 1.6% 0.6% 2.1% 1.3% Moderate % 28.9% 16.4% 14.3% 6 9.4% 5.3% 8.0% 4.8% Middle % 33.0% 31.3% 26.4% % 29.8% 17.5% 13.0% Upper % 34.8% 48.6% 55.9% % 54.1% 53.1% 61.3% Unknown 0 0.0% 0.0% 0.1% 0.2% 6 9.4% 10.2% 19.3% 19.6% Total % 100.0% 100.0% 100.0% % 100.0% 100.0% 100.0% Home Improvement Low 2 9.1% 2.9% 4.0% 3.0% % 10.3% 5.2% 1.5% Moderate % 3.9% 17.4% 13.5% % 7.5% 13.8% 7.2% Middle % 78.6% 36.4% 28.9% % 35.7% 22.4% 17.1% Upper % 14.6% 42.3% 54.6% % 45.1% 54.6% 68.0% Unknown 0 0.0% 0.0% 0.0% 0.0% 1 4.5% 1.4% 4.0% 6.2% Total % 100.0% 100.0% 100.0% % 100.0% 100.0% 100.0% Multi-Family Low 0 0.0% 0.0% 12.6% 11.3% 0 0.0% 0.0% 0.0% 0.0% Moderate 0 0.0% 0.0% 34.5% 35.2% 0 0.0% 0.0% 0.0% 0.0% Middle 0 0.0% 0.0% 23.9% 20.1% 0 0.0% 0.0% 0.0% 0.0% Upper 0 0.0% 0.0% 28.9% 33.4% 0 0.0% 0.0% 0.0% 0.0% Unknown 0 0.0% 0.0% 0.1% 0.0% 0 0.0% 0.0% 100.0% 100.0% Total 0 0.0% 0.0% 100.0% 100.0% 0 0.0% 0.0% 100.0% 100.0% HMDA Totals Low 5 4.6% 3.5% 4.4% 4.3% 8 7.3% 2.3% 2.1% 1.0% Moderate % 26.9% 18.4% 16.6% % 4.7% 9.2% 4.8% Middle % 36.0% 32.5% 26.4% % 33.4% 19.4% 13.5% Upper % 33.6% 44.4% 52.3% % 51.3% 52.4% 59.8% Unknown 0 0.0% 0.0% 0.3% 0.5% 9 8.3% 8.3% 16.9% 20.9% Total % 100.0% 100.0% 100.0% % 100.0% 100.0% 100.0% SMALL BUSINESS By Tract Income Bank Aggregate # % % $(000s) % % $(000s) Low % 15.7% 6.9% 6.4% Moderate % 39.1% 19.2% 18.1% Middle % 27.8% 24.4% 24.1% Upper % 16.1% 47.7% 49.1% Unknown 2 1.9% 1.3% 1.0% 1.7% Tract Unknown 0 0.0% 0.0% 0.9% 0.6% Total % 100.0% 100.0% 100.0% By Revenue $1 Million or Less % 34.2% 17.2% 24.9% By Loan Size $100,000 or less % 54.6% 95.6% 39.5% $100,001-$250, % 33.9% 2.0% 13.1% $250,001-$1 Million 3 2.8% 11.5% 2.4% 47.4% Total % 100.0% 100.0% 100.0% Originations and Purchases BB20
24 INVESTMENT TEST BPNA s investment test performance in MSA is rated low satisfactory. Qualified investments totaled $19 million or 41% of BPNA s total qualified investments, compared to $7.4 million at the last examination. This represents an annualized increase of 76%. However, BPNA s community development investment performance was below other similarly-situated banks operating in the assessment area. Examples of qualified investments include: A $100,000 certificate of deposit in a community development financial institution located in a moderate-income census tract. A $1.4 million equity investment in an organization that provides affordable housing to LMI persons. A $10 million mortgage backed security to provide subsidized housing to moderateincome workers who receive government subsidiaries. SERVICE TEST BPNA s overall performance on the service test is rated outstanding, based on its level of community development services and the accessibility of its delivery systems. Retail Services: BPNA s delivery systems were readily accessible to all portions of the MSA, including LMI areas. Overall, BPNA has 39 branches in this multi-state MSA, of which 27, or 69 percent, are located in LMI areas. This compares very favorably with the 40 percent of the MSA population residing in LMI areas. BPNA also has one off-site ATM in a low-income census tract in this assessment area. While changes in branch locations during the evaluation period did not adversely affect the accessibility of its delivery systems, during the evaluation period, BPNA closed 8 branches in the MSA, of which 6, or 75%, were in LMI census tracts. No branches were opened. BPNA continued to meet the needs of its assessment area with its existing branch network. Services are tailored to the convenience and needs of BPNA s assessment area, including LMI geographies and/or LMI individuals. Of the total 39 branches in the MSA, 27, or 69%, of the branches had Saturday hours. Also, 20 out of the 27 total LMI branches in the MSA, 74%, have Saturday hours. Community Development Services: BPNA was a leader in providing community development services throughout the assessment area. BPNA provided 253 services which included a significant number of seminars to community organizations and sponsoring groups relating to affordable mortgages, small business development, and financial literacy. BB21
25 Additionally, approximately 23 BPNA staff members provided 37 services including serving on the boards of directors or providing financial technical assistance to approximately 32 community development organizations. Approximately 25, or 78%, of these organizations are located in LMI census tracts. BPNA staff provided financial management expertise and technical assistance to these organizations. BB22
26 STATE OF CALIFORNIA CRA RATING FOR CALIFORNIA: SATISFACTORY The lending test is rated: Low Satisfactory The investment test is rated: Low Satisfactory The service test is rated: Outstanding The major factors supporting the rating include: BPNA s lending activity in the state of California was considered adequate. An adequate level of community development lending; The geographic distribution of loans in BPNA s assessment areas was good; The overall distribution of loans among individuals of different income levels and businesses of different revenue sizes was good; An adequate level of qualified investments; Delivery Systems that were readily accessible to geographies and individuals of different income levels; and, BPNA provided a relatively high level of community development services SCOPE OF EXAMINATION MSA (Los Angeles-Long Beach-Santa Ana, CA) was the only full scope assessment area for the State of California based on such measures as deposit concentration, lending volume and branch office network. As shown in Exhibit 4, MSA takes in 99% of BPNA s deposits, 96% of BPNA s loans, and 96% of BPNA s branches in the state of California. MSA encompasses two Metropolitan Divisions in California, MD (Los Angeles, Long Beach, and Glendale, including Los Angeles County) and MD (Santa Ana, Anaheim and Irvine, including Orange County). Ratings for the state are based on performance within this MSA. A limited scope review was conducted of MSA (San Diego-Carlsbad-San Marcos, CA), including San Diego County. DESCRIPTION OF INSTITUTION S OPERATIONS The California assessment area has the second largest branch presence and second largest proportion of deposits. As detailed in Exhibit 4, as of December 31, 2010, BPNA operated 24 or 25% of its branches in its California assessment areas. In addition, BPNA had 0.44% deposit market share, and ranks twenty-third in deposit market share in this assessment area. The FDIC reported that as of June 30, 2010, 20% of all BPNA deposits were held in the California assessment areas. BB23
27 Exhibit 4: Summary of Key Assessment Area Data: State of California ASSESSMENT AREA DATA MSA (Los Angeles- Long Beach-Santa Ana, CA) MSA (San Diego County, CA) TOTALS Total Population 4 12,365,627 2,072,926 14,438,553 Population % of AA population 86% 14% 100% Families 2,828, ,889 3,315,112 Families % of AA families 85% 15% 100% Total Census Tracts 4 2, ,094 Tracts % AA tracts 85% 15% 100% LMI tracts ,083 LMI tracts % all AA LMI tracts 86% 14% 100% Total Owner-Occupied Units 4 2,073, ,629 2,468,516 Units % of AA units 84% 16% 100% Business Establishments 5 651, , ,582 Bus. est. % AA bus. est. 86% 14% 100% Number of Branches Branches % all branches 96% 4% 100% Branches in LMI tracts LMI branches % AA LMI branches 100% 8% 100% Branch Deposits ($'000s) 2 1,409,327 15,562 1,424,889 Deposits % AA deposits 99% 1% 100% Deposit Market Share (%)/ Rank in Market.44%/23.03%/51.17%/40 Home Purchase Originations HP originations % AA orig. 82% 18% 100% Refinance Originations Refi orig. % AA orig. 97% 3% 100% Home Improvement Originations Home Improvement orig. % AA orig. 100% 0% 100% Small Business Originations SB orig. % AA orig. 96% 4% 100% Combined Loan Totals % of AA Orig. 96% 4% 100% (1) Branch numbers are as of 12/31/2010. (2) Branch deposits and deposit market share are from the FDIC as of 6/30/10. (3)Originations are loans reported under HMDA or CRA small business reporting for 2008, 2009 and (4)Demographic information was obtained from the 2000 Census. (5)Business establishments information was reported by D&B for BB24
28 METROPOLITAN AREA (FULL REVIEW) MSA (LOS ANGELES LONG BEACH-SANTA ANA, CA) DESCRIPTION OF INSTITUTION S OPERATIONS Banco Popular has a total of 23 branches within this MSA. Of these, 12 branches are located in LMI census tracts. The MSA is dominated by large regional institutions. The top five institutions have 60% of the deposit market share and hold approximately $191 billion dollars in deposits. Banco Popular has less than a 1% market share of total deposits in the MSA, ranks 23 rd in deposit balances, and competes with 157 FDIC-insured depository institutions. Demographic Characteristics The Los Angeles MSA covers a large geographic area, extending over 4,752 square miles, including the islands of San Clemente and Santa Catalina. Los Angeles County includes the cities of Los Angeles, Long Beach, and Santa Ana. The Metropolitan Divisions include the cities of Anaheim, Glendale and Irvine as well as Los Angeles and Orange Counties. According to the 2000 census, the MSA s population is 12.3 million residents. Los Angeles County is the largest county in the nation in terms of population. The population of the MSA continues to grow, as according to estimates, the MSA has experienced a 4% population increase over the last seven years. The MSA is a culturally diverse region, wherein approximately 5 million residents, or 31%, are foreign-born. Residents from Latin America and Asia comprise the two largest groups within the foreign-born population. There are approximately 7 million residents that speak a language other than English, with Spanish being the most common second language in the region, spoken by 3.7 million residents. Income Characteristics According to HUD, the estimated median family income for the Los Angeles MSA in 2010 was $63,000. Of the 2.8 million families in the assessment area, 23% are considered low-income, 17% moderate-income, and 13% have incomes below the poverty level. Additionally, 6% of the families live in low-income tracts, while 27% of the families live in moderate-income tracts. Housing Characteristics The assessment area contains 4.2 million housing units, of which 49%, or 2 million, are owneroccupied. However, only 2% of the available owner-occupied housing units, or 35,850 units, are located in low-income census tracts, limiting opportunities for lending in low-income areas. 17% of owner occupied units are located in moderate-income areas. BB25
29 During the review period, the existing prices for a single family home in Los Angeles decreased from $402,100 in 2008 to $316,700 in Housing costs still remain very high, making home purchasing unaffordable to many LMI individuals. Community contacts noted that affordable mortgage and small business loans are needed, with particular emphasis on affordable entry level housing. Labor, Employment and Economic Characteristics Los Angeles has a diverse economic base that relies on a variety of industries. The area s leading industries are focused on international trade that is supported by the city s connection with the Asia Pacific region; tourism and the motion picture industry. Business services round out the other major industries in Los Angeles. In addition, Los Angeles is the largest manufacturing center in the United States. The most important sectors are apparel, fabricated metals, food producers and aerospace. Los Angeles continues to experience high unemployment rates reducing lending opportunities. The unemployment rate rose to 11.9% in 2010 from 10.9% in Community contacts noted an absence of lending to small-to-medium sized businesses, due to tightened credit standards. Contacts also noted that the economic downturn had impacted all sectors, but specifically the service sector (e.g. hotels, restaurants), manufacturing (i.e. apparel), and aerospace. Contacts further noted that the demand for affordable housing has increased and government subsidies and services have experienced deep cuts. CONCLUSIONS WITH RESPECT TO PERFORMANCE TESTS IN MSA (LOS ANGELES-LONG BEACH-SANTA ANA, CA) LENDING TEST Overall lending test performance in MSA (Los Angeles-Long Beach-Santa Ana, CA) is rated low satisfactory. Some of the data used to evaluate BPNA s performance in this MSA assessment area appears in Appendix D. Lending Activity: BPNA s lending activity in the Los Angeles MSA was considered adequate based on volume, market share activity and comparison to peer banks. HMDA lending was adequate while small business lending activity was poor. Loan volume in the MSA was impacted by the closure of 14 branches in the MSA as BPNA restructured operations due to strategic decisions and due to the decline in economic conditions. For the three year evaluation period, BPNA s lending activity totaled 902 loans, consisting of 36 home purchase, 107 refinance, 91 home improvement and 668 small business loans. Lending activity declined significantly compared to the prior evaluation, during which over a two-year period lending activity totaled 4,747 loans, consisting of 798 home purchase loans, 1,473 refinance, 438 home improvement, and 2,038 small business loans. BB26
30 BPNA had a deposit market share of 0.44% of all deposits, compared to a market share of 0.01% in home purchase lending, 0.02% in refinance lending, 0.47% in home improvement lending and 0.04% in small business lending. Comparisons with local peers based on the number of loans per billion dollars of deposits indicates that BPNA s HMDA lending volume is comparable to the performance of similarly-situated banks while small business lending volume is below the performance of similarly-situated banks. Income Categories Assessment Area Demographics Tract Distribution Assessment Area MSA Families by Tract Income Families < Poverty Level as % of Families by Tract Families by Family Income # % # % # % # % Low-income , , , Moderate-income , , , Middle-income , , , Upper-income ,008, , ,184, Unknown-income Total Assessment Area 2, ,828, , ,828, Housing Units by Tract Housing Types by Tract Owner-occupied Rental Vacant # % % # % # % Low-income 266,283 35, , , Moderate-income 1,106, , , , Middle-income 1,308, , , , Upper-income 1,559,004 1,031, , , Unknown-income Total Assessment Area 4,240,393 2,073, ,995, , Businesses by Tract & Revenue Size Total Businesses by Less Than or = $1 Revenue Not Tract Over $1 Million Million Reported # % # % # % # % Low-income 42, , , , Moderate-income 148, , , , Middle-income 190, , , , Upper-income 264, , , , Unknown-income 4, , Total Assessment Area 651, , , , Percentage of Total Businesses: Geographic Distribution: The overall geographic distribution of HMDA-related and small business loans was good based on excellent small business loan penetration in LMI geographies and adequate HMDA-related loan penetration in low and moderate-income census tracts. The table on the next page summarizes lending performance in these tracts. BPNA made 2 or 4%, of it s of its refinance loans in low-income geographies, exceeding the aggregate s 1% of refinance loans. BPNA s refinance lending also compares well to the demographics of the assessment area, which indicate that 2% of the available owner-occupied housing units are located within low-income geographies. BB27
31 BPNA made no home purchase and no home improvement loans in low-income geographies and performance was significantly below the aggregate. As a result, home purchase performance was considered poor given that the aggregate s home purchase lending in low-income geographies indicated that opportunities existed to lend. Home improvement performance was considered adequate since the market aggregate only made 97 home improvement loans in lowincome geographies, indicating limited lending opportunities. MSA (Los Angeles-Long Beach-Santa Ana, CA) Product Home Purchase Refinance Home Improvement Small Business Low-Income Census Tracts BPNA 2009 Aggregate Performance Comparison VERY POOR BELOW GOOD ABOVE ADEQUATE BELOW EXCELLENT ABOVE Moderate-Income Census Tracts BPNA 2009 Aggregate Performance Comparison GOOD ABOVE POOR ADEQUATE EXCELLENT BELOW SLIGHTLY BELOW ABOVE BPNA s 2008 and 2010 home purchase performance in low-income geographies was similar to 2009 performance. Refinance performance in low-income geographies was weaker in 2008 and 2010 compared to 2009 performance home improvement performance in low-income geographies was comparable for 2010 but weaker than 2008 performance. BPNA made 31% of its home purchase, 6% of its refinance, and 10% of its home improvement loans in moderate-income geographies, exceeding the aggregate s 20% for home purchase loans but below the aggregate s 10% for refinance loans and 12% for home improvement loans. BPNA s home purchase loan performance also compares well to the demographics of the assessment area, which indicate that 17% of the available owner-occupied housing units are located within moderate-income geographies. When compared to the level of owner-occupied housing units and to the 2008 and 2010 aggregate performance, BPNA s 2008 and 2010 refinance performance in moderate-income geographies was stronger than 2009 performance. Home purchase performance was weaker in 2008 and 2010 compared to Home improvement performance in 2008 was comparable to 2009 performance but weaker than 2010 performance. BPNA originated 8% and 36% of its small business loans in low- and moderate-income geographies, respectively, significantly above the aggregate s 4% and 18%. BPNA s performance in low and moderate-income geographies was above the demographics of the assessment area, where 7% of all small businesses operate in low-income geographies and 23% of all small businesses operate in moderate-income geographies. BPNA s 2008 and 2010 small business performance was similar to 2009 performance. BB28
32 Distribution by Borrower Income and Revenue Size of the Business: BPNA s overall lending to LMI borrowers and businesses of different sizes in MSA was good based on a good level of lending to moderate-income borrowers and small businesses and adequate lending to low -income borrowers, as indicated in the chart below. Product Home Purchase Refinance Home Improvement MSA (Los Angeles-Long Beach- Santa Ana, CA) Low-Income Borrowers BPNA 2009 Aggregate Performance Comparison ADEQUATE ABOVE ADEQUATE ABOVE ADEQUATE ABOVE Lending to Businesses with GAR <= $1 million Moderate-Income Borrowers BPNA Performance POOR ADEQUATE EXCELLENT 2009 Aggregate Comparison BELOW SIMILAR ABOVE 2009 Aggregate Comparison Small Business GOOD ABOVE Low-Income Borrowers BPNA s HMDA-related lending performance to low-income borrowers was adequate overall when compared to the 23% of families in the MSA which are of low-income and the performance of the aggregate. During the examination period the bank made 2, or 15%, 7, or 13%, and 2, or 10%, of its home purchase, refinance, and home improvement loans to lowincome borrowers respectively. BPNA s performance for HMDA-related lending was significantly above the aggregate. The aggregate made 4%, 3%, and 4% of its home purchase, refinance, and home improvement loans to low-income borrowers, respectively and the aggregate s performance is reflective of the high housing costs in the assessment area. BPNA s home purchase performance to low-income borrowers was weaker in 2008 and 2010 compared to 2009 performance. Refinance lending performance to low-income borrowers in 2008 and 2010 was also weaker than 2009 performance. Home improvement lending performance in 2009 was stronger than 2008 performance but weaker than 2010 performance. BB29
33 Moderate-Income Borrowers BPNA s HMDA-lending performance to moderate-income borrowers was overall good when compared to the 17% of families in the MSA who are of moderate-income. The bank made 1, or 8%, 5, or 9%, and 7, or 33% of its home purchase, refinance, and home improvement loans to moderate-income borrowers respectively. BPNA s performance for home improvement loans was above the market aggregate; while its performance for home purchase loans was below and refinance lending was similar. The aggregate made 13%, 9%, and 10% of its home purchase, refinance, and home improvement loans to moderate-income borrowers, respectively. BPNA s 2008 and 2010 home purchase performance to moderate-income borrowers was comparable to 2009 performance refinance lending to moderate-income borrowers was comparable to 2010 performance and stronger than 2008 performance home improvement performance to moderate-income borrowers was comparable to 2008 and 2010 performance. Lending to Businesses of Different Sizes BPNA provided a good level of lending to small business borrowers with gross annual revenue (GAR) of $1 million or less. The bank made 56% of its small business loans to these businesses, compared to the 89% of business establishments in the MSA with GAR of $1 million or less. Performance was significantly above the aggregate which made 31% of its small business loans to businesses with GAR of $1 million or less. BPNA made 75% of its small business loans in amounts of $100,000 or less, which was somewhat below the aggregate which made 95% of its small business loans in amounts of $100,000 or less. The average loan size was $132,000. Also, 2009 small business performance was comparable to 2008 performance and stronger than 2010 performance. Community Development Lending: BPNA s level of community development lending activity in MSA (Los Angeles-Long Beach-Santa Ana, CA) was adequate, with 177 loan originations totaling $147 million. Performance within the MSA was directed at affordable housing which represented 87% of all community development lending activity. Community Development Lending Purpose # $( 000s) Affordable Housing ,599 Community Services 4 13,713 Economic Development Revitalize and Stabilize 2 4,783 Totals ,362 Multifamily lending represented 83% of MSA community development lending. Performance in the MSA increased 16% compared to the last examination when BPNA reported $127 million in community development lending within the MSA, however, new commitments totaled only $54 million or 37% of community development lending activity. Community development lending performance was consistent with the performance of similarly-situated large retail banks in the MSA. BB30
34 Examples of community development lending initiatives included: 160 multi-family loans totaling $122 million that provided 2,097 units of affordable housing. Renewal of a $1 million line of credit to a non-profit fund that facilitates the development of affordable housing throughout California. A $4 million loan to remodel a 154 bed skilled nursing home that provides a variety of services to its residents. Seventy-two percent of all revenues come from Medicaid and 11% from Medicare, indicating the majority of residents are LMI. The property is located in a moderate-income census tract. INVESTMENT TEST BPNA s investment performance in MSA (Los Angeles-Long Beach-Santa Ana) was adequate. BPNA s volume of qualified investments totaled $893 thousand, or 8% the BPNA s total qualified investments in the State of California compared to $887 thousand at the last examination. Additionally, BPNA made $10 million in statewide investment initiatives that benefited MSA as well as the broader statewide area. The statewide investments included five collateralized mortgage obligations totaling $9 million. BPNA s community development investment performance was below other similarly-situated banks operating in the assessment area. Examples of qualified investments include: A $400 thousand investment in a Community Development Financial Institution. $298 thousand in deposits with a community development bank which serves the real estate, business and financial needs of customers in underserved urban communities. SERVICE TEST Retail Services: BPNA s retail delivery systems were readily accessible to all portions of the MSA, including LMI areas. Overall, BPNA has 23 branches in this MSA, of which 12, or 52 percent, are located in LMI areas. This compares very favorably with the 37 percent of the MSA population residing in LMI areas. BPNA has no off-site ATMs in this assessment area. Changes in branch locations during the evaluation period did not adversely affect the accessibility of its delivery systems. During the evaluation period, BPNA closed 14 branches, of which 6, or 43%, were in LMI census tracts and no branches were opened. However, BPNA continued to meet the needs of its assessment area with its existing branch network. Services are tailored to the convenience and needs of BPNA s assessment area, particularly LMI geographies and/or LMI individuals. Nineteen, or 83%, of the branches in the MSA had Saturday hours. In LMI areas, 9 out of the 12 total LMI branches in the MSA, or 75%, have Saturday hours. BB31
35 2009 Aggregate Comparison Loan Distribution Table Assessment Area: MSA HMDA Income Categories By Tract Income By Borrower Income Bank Aggregate Bank Aggregate # % % $(000s) % % $(000s) # % % $(000s) % % $(000s) Home Purchase Low 0 0.0% 0.0% 2.6% 1.7% % 11.3% 3.6% 1.5% Moderate % 25.6% 19.8% 14.1% 1 7.7% 6.9% 13.0% 7.6% Middle % 37.0% 34.3% 27.5% % 14.3% 22.7% 17.6% Upper % 37.4% 43.1% 56.4% % 48.6% 49.3% 63.2% Unknown 0 0.0% 0.0% 0.2% 0.2% % 18.9% 11.5% 10.1% Total % 100.0% 100.0% 100.0% % 100.0% 100.0% 100.0% Refinance Low 2 3.8% 4.7% 0.8% 0.6% % 7.7% 3.0% 1.6% Moderate 3 5.7% 4.7% 9.9% 7.4% 5 9.4% 6.2% 8.5% 5.2% Middle % 27.4% 26.1% 21.3% % 17.8% 17.5% 13.5% Upper % 63.2% 63.1% 70.7% % 59.9% 57.0% 64.8% Unknown 0 0.0% 0.0% 0.1% 0.1% 5 9.4% 8.5% 14.0% 14.9% Total % 100.0% 100.0% 100.0% % 100.0% 100.0% 100.0% Home Improvement Low 0 0.0% 0.0% 0.8% 0.5% 2 9.5% 4.4% 3.9% 1.8% Moderate 2 9.5% 1.4% 11.5% 8.0% % 20.3% 10.4% 6.9% Middle % 27.8% 29.6% 23.6% % 7.0% 21.0% 17.6% Upper % 70.8% 58.1% 67.9% % 68.4% 57.9% 67.4% Unknown 0 0.0% 0.0% 0.1% 0.1% 0 0.0% 0.0% 6.8% 6.3% Total % 100.0% 100.0% 100.0% % 100.0% 100.0% 100.0% Multi-Family Low 0 0.0% 0.0% 11.3% 11.8% 0 0.0% 0.0% 0.0% 0.0% Moderate 0 0.0% 0.0% 37.2% 26.2% 0 0.0% 0.0% 0.0% 0.0% Middle 0 0.0% 0.0% 26.8% 29.7% 0 0.0% 0.0% 0.0% 0.0% Upper 0 0.0% 0.0% 24.6% 32.2% 0 0.0% 0.0% 0.0% 0.0% Unknown 0 0.0% 0.0% 0.1% 0.1% 0 0.0% 0.0% 100.0% 100.0% Total 0 0.0% 0.0% 100.0% 100.0% 0 0.0% 0.0% 100.0% 100.0% HMDA Totals Low 2 2.3% 3.3% 1.5% 1.3% % 8.0% 3.2% 1.5% Moderate % 8.3% 13.5% 10.2% % 7.9% 10.0% 5.8% Middle % 29.2% 28.9% 23.6% % 15.9% 19.2% 14.4% Upper % 59.2% 56.0% 64.7% % 58.8% 54.0% 62.1% Unknown 0 0.0% 0.0% 0.1% 0.1% 7 8.0% 9.5% 13.6% 16.2% Total % 100.0% 100.0% 100.0% % 100.0% 100.0% 100.0% SMALL BUSINESS By Tract Income Bank Aggregate # % % $(000s) % % $(000s) Low % 12.6% 4.4% 6.6% Moderate % 47.2% 18.1% 22.2% Middle % 24.1% 27.0% 27.2% Upper % 15.8% 47.6% 41.1% Unknown 1 0.8% 0.3% 0.7% 1.2% Tract Unknown 0 0.0% 0.0% 2.1% 1.8% Total % 100.0% 100.0% 100.0% By Revenue $1 Million or Less % 35.1% 31.4% 30.2% By Loan Size $100,000 or less % 29.7% 95.2% 43.5% $100,001-$250, % 14.2% 2.4% 12.7% $250,001-$1 Million % 56.1% 2.5% 43.8% Total % 100.0% 100.0% 100.0% Originations and Purchases BB32
36 Community Development Services: BPNA provides a relatively high level of community development services throughout the assessment area. BPNA provided 39 services, sponsoring and participating in seminars and presentations relating to affordable mortgages, small business development and financial literacy. Additionally, BPNA staff members serve on the boards of directors or acting as members of approximately 13 community development organizations. Five, or 38%, of these organizations are located in LMI census tracts. BPNA staff provided financial management expertise and technical assistance to these organizations. METROPOLITAN AND NONMETROPOLITAN AREA (LIMITED REVIEW) MSA (San Diego-Carlsbad-San Marcos, CA) Data reviewed, including performance and demographic information, can be found in the California tables in Appendices C, D, E and F. Conclusions regarding performance were compared with the overall state rating, which was based on the full-scope assessment area performance. Conclusions follow: Assessment Area Lending Test Investment Test Service Test MSA Consistent Below Consistent BB33
37 STATE OF ILLINOIS CRA RATING FOR ILLINOIS SATISFACTORY The lending test is rated: Low Satisfactory The investment test is rated: Low Satisfactory The service test is rated: Outstanding The major factors supporting the rating include: An adequate level of community development lending; Excellent geographic distribution of loans in the BPNA s assessment areas; Good distribution of loans among individuals of different income levels and businesses of different sizes; An adequate level of qualified investments; Delivery Systems were readily accessible to geographies and individuals of different income levels; and, Poor responsiveness to assessment area credit needs; SCOPE OF EXAMINATION Examiners conducted a full-scope review of the Illinois assessment area, MSA (Chicago- Joliet-Naperville, IL, IN, WI) in the state of Illinois. Since the multi-state MSA is the only assessment area in the state, ratings are solely based on performance in this MSA. BPNA s assessment area in MSA consists of all of Cook and DuPage Counties and portions of Kane County. BPNA s activities in the multi-state MSA make up 14% percent of BPNA s total deposits and were weighted accordingly when deriving overall ratings. BB34
38 METROPOLITAN AREA (FULL REVIEW) MSA (CHICAGO-JOLIET-NAPERVILLE, IL-IN-WI) DESCRIPTION OF INSTITUTION S OPERATIONS BPNA operates 13 branches in the assessment area, representing 14 percent of BPNA s total branch network. Eleven branches are located in Cook County, and one each is located in the DuPage and Kane counties. Accordingly, the majority of BPNA s business is derived from its operations in Cook County. Based on the FDIC Deposit Market Share Report of June 30, 2010, BPNA was ranked 32 out of 196 financial institutions with at least one branch in MSA Although the bank had total deposits of $1.02 billion, representing approximately 14 percent of BPNA s total deposits, its overall market share in the Chicago Assessment Area was approximately 0.44 percent. BPNA originated 18% of all its total small business and HMDA-related loans in the Chicago MSA. BPNA competes with a significant number of banks in the Chicago MSA, including large regional banking organizations. BPNA closed nine branches in MSA during the evaluation period. Of the closed branches, seven were consolidated into existing BPNA branches in MSA while two were relocated within MSA BPNA opened one branch in the MSA. The branch closures were part of BPNA s restructuring plan. PERFORMANCE CONTEXT Demographic Characteristics The greater Chicago metropolitan area, known as the Chicago-Joliet-Naperville MSA, is a combination of the Chicago MD, the Gary Indiana MD, and the Lake County-Kenosha County MD. The Chicago MSA includes 1,513 census tracts, of which 15 percent are low-income and 27 percent are moderate-income. According to 2000 Census data, the population in BPNA s assessment area is approximately 6.4 million. Income Characteristics According to HUD, the estimated median family income for the Chicago MSA in 2010 was $75,100. Of the 1.5 million families in the assessment area, 23% are considered low-income, 18% moderate-income, and 9% have incomes below the poverty level. Eight percent of all families live in low-income tracts, and 25% reside in moderate-income tracts. BB35
39 Housing Characteristics The assessment area contains 2.5 million Median Home Sales Price housing units of which 57%, or 1.4 Area/County million, are owner-occupied. Of the MSA $199,200 $191,400 available owner-occupied housing units, 3% and 18% are located in low- and moderate-income tracts, respectively. The median sales price for homes in the greater Chicago MSA was $191,400 in Median home sales prices reflect a downward trend, having declined from $245,600 in Homes were unaffordable to LMI persons, with a home prices five times the income of a low-income person and over three times the income of moderate- income persons. Foreclosure filings in the Chicago metropolitan area rose 14% between 2009 and 2010 and are expected to trend upward according to a report by the Woodstock Institute, a nonprofit consumer advocacy group. Labor, Employment and Economic Characteristics The annual average Average Annual Unemployment Rates unemployment rate for the Area/County Chicago MSA was 10.0% in MSA % 10.2% 2009 and 10.2% in The high unemployment was an outgrowth of the economic recession that started at the end of 2007, driving down loan demand. The Chicago area is the business and financial center of the Midwest. Major employers in the assessment area include federal, state, and local governments, schools, retail chains, and the healthcare industry. The area is home to many of the country s largest employers, including McDonald s Corporation, The Boeing Company, Sears Holding Corporation, Kraft Foods, Walgreens Company and Allstate Corporation. More detailed performance context data for this assessment area is provided in the assessment area demographic table on the following page: BB36
40 Income Categories Assessment Area Demographics Tract Distribution Assessment Area : MSA Families by Tract Income Families < Poverty Level as % of Families by Tract Families by Family Income # % # % # % # % Low-income , , , Moderate-income , , , Middle-income , , , Upper-income , , , Unknown-income Total Assessment Area 1, ,541, , ,541, Housing Units by Tract Housing Types by Tract Owner-occupied Rental Vacant # % % # % # % Low-income 218,193 44, , , Moderate-income 610, , , , Middle-income 939, , , , Upper-income 702, , , , Unknown-income Total Assessment Area 2,470,497 1,415, , , Businesses by Tract & Revenue Size Total Businesses by Less Than or = $1 Revenue Not Tract Over $1 Million Million Reported # % # % # % # % Low-income 11, , Moderate-income 41, , , , Middle-income 95, , , , Upper-income 109, , , , Unknown-income Total Assessment Area 258, , , , Percentage of Total Businesses: CONCLUSIONS WITH RESPECT TO PERFORMANCE TESTS IN MSA (CHICAGO-JOLIET-NAPERVILLE, IL-IN-WI) LENDING TEST Overall performance on the lending test in MSA (Chicago-Naperville-Joliet, IL, IN, WI) is rated low satisfactory. Some of the data used to evaluate the bank s performance in this MSA assessment area appears in Appendix D. Lending Activity: BPNA s overall lending activity demonstrated poor responsiveness to the retail credit needs of MSA For the three year evaluation period, lending activity totaled 750 loans consisting of 60 home purchase, 88 refinance, 69 home improvement and 533 small business loans. Lending activity declined significantly compared to the prior evaluation, during which over a two year period lending activity totaled 2,382 loans, consisting of 611 home purchase, 533 refinance, 365 home improvement, and 873 small business loans. BPNA had a deposit market share of 0.63% of all deposits in the MSA, compared to a market share of 0.04% in home BB37
41 purchase lending, 0.02% in refinance lending, 0.34% in home improvement lending and 0.10% in small business lending. Although the weak economy has reduced the available lending opportunities in the assessment area, comparisons indicate that BPNA s lending performance, in terms of volume, is generally below the performance of similarly-situated banks. Geographic Distribution: The geographic distribution of HMDA-related and small business loans was excellent based on excellent performance of small business lending and excellent overall HMDA-related lending performance in LMI geographies. The following table summarizes lending performance in these tracts. Product Home Purchase Refinance Home Improvement Small Business MSA (Chicago-Joliet-Naperville, IL-IN-WI) Low-Income Census Tracts Moderate-Income Census Tracts BPNA 2009 Aggregate BPNA 2009 Aggregate Performance Comparison Performance Comparison GOOD SLIGHTLY EXCELLENT BELOW ABOVE EXCELLENT ABOVE EXCELLENT SLIGHTLY ABOVE EXCELLENT EXCELLENT ABOVE ABOVE EXCELLENT EXCELLENT ABOVE ABOVE BPNA made 1, or 4%, of its home purchase loans, 3, or 10%, of its refinance loans, and 5, or 28%, of its home improvement loans in low-income geographies, exceeding the aggregate s 3% of refinance loans and 4% of home improvement loans and slightly below the aggregate s 4% of home purchase loans. The demographics of the assessment area indicate that 3% of the available owner-occupied housing units are located within low-income geographies. When compared to the level of owner-occupied housing units and to the 2008 and 2010 aggregate performance, BPNA s 2008 and 2010 home improvement performance was comparable to its 2009 performance in low-income geographies home purchase and refinance performance was comparable to 2008 performance and stronger than 2010 performance in low-income geographies. BPNA made 10, or 36%, of its home purchase loans, 4, or 13%, of its refinance loans, and 6, or 33%, of its home improvement loans in moderate-income geographies, exceeding the aggregate s 17% for home purchase loans, 12% for refinance lending and 20% for home improvement lending. The demographics of the assessment area indicate 18% of the available owner-occupied housing units are located within moderate-income geographies. BB38
42 When compared to the level of owner-occupied housing units and to the 2008 and 2010 aggregate performance, BPNA s HMDA-related loan performance in moderate-income geographies was comparable to 2009 performance. BPNA originated 5% and 34% of its small business loans in low- and moderate-income geographies, respectively, significantly above the aggregate s 3% and 13%. The demographics show that 4% of all small businesses are operating in low-income geographies and 16% in moderate-income geographies. BPNA s 2008 and 2010 small business performance was similar to 2009 performance. Distribution by Borrower Income and Revenue Size of Business: Lending performance in MSA was good based on good lending to low-income borrowers and small businesses and excellent lending to moderate-income borrowers, as indicated in the chart below: Product Home Purchase Refinance Home Improvement MSA (Chicago- Joliet-Naperville, IL-IN-WI) Low-Income Borrowers BPNA 2009 Aggregate Performance Comparison GOOD ABOVE ADEQUATE ABOVE EXCELLENT ABOVE Lending to Businesses with GAR <= $1 million Moderate-Income Borrowers BPNA 2009 Aggregate Performance Comparison EXCELLENT SLIGHTLY BELOW EXCELLENT ABOVE EXCELLENT SLIGHTLY ABOVE 2009 Aggregate Comparison Small Business GOOD ABOVE Low-Income Borrowers BPNA s HMDA-related performance in lending to low-income borrowers was good overall when compared to the 23% of families in the MSA which are of low-income and the performance of the aggregate. During the examination period the bank made 4, or 14%, 2, or 6%, and 7, or 40%, of its home purchase, refinance, and home improvement loans to low-income borrowers respectively. BPNA s HMDA-related loan performance was significantly above the aggregate. The aggregate made 8%, 4%, and 12% of its home purchase, refinance, and home improvement loans to lowincome borrowers, respectively. Performance for 2008 and 2010 was comparable to 2009 performance for home purchase and home improvement lending to low-income borrowers refinance lending to low-income borrowers was stronger than 2010 performance but weaker than 2008 performance. BB39
43 Moderate-Income Borrowers BPNA s overall HMDA-lending performance to moderate-income borrowers was excellent. BPNA made 5, or 18%, 7, or 23%, and 4, or 22%, of its home purchase, refinance, and home improvement loans to moderate-income borrowers respectively. 18% of the families in the MSA are moderate-income. BPNA s performance for home improvement and refinance loans was significantly above the aggregate, while its performance for home purchase loans was slightly below. The aggregate made 23%, 12%, and 20% of its home purchase, refinance, and home improvement loans to moderate-income borrowers, respectively. Performance to moderate-income borrowers for 2008 and 2010 was comparable to 2009 performance for home purchase lending. Refinance and home improvement performance to moderate-income borrowers was weaker in 2008 compared to 2009 while 2010 performance was comparable to 2009 performance. Lending to Businesses of Different Sizes BPNA provided a good level of lending to small business borrowers with gross annual revenue (GAR) of $1 million or less. BPNA made 56% of its small business loans to these businesses, compared to the 86% of business establishments in the MSA with GAR of $1 million or less. Performance was significantly above the aggregate which made 20% of its small business loans to businesses with GAR of $1 million or less. BPNA made 54% of its small business loans in amounts of $100,000 or less, which was below the aggregate which made 92% of its small business loans in amounts of $100,000 or less. The average loan size was $195,000. Performance in 2008 and 2010 was consistent with 2009 performance. Community Development Loans: BPNA s community development lending activity in MSA (Chicago-Joliet- Naperville, IL, IN, WI) was adequate with 83 loan originations totaling $73 million or 15% of BPNA s total community development lending. Performance within the MSA was directed at affordable housing which had been identified by community contacts as a critical need in the Community Development Lending Purpose # $( 000s) Affordable Housing 72 56,985 Community Services 3 5,765 Economic Development Revitalize and Stabilize 5 8,996 Totals 83 72,087 assessment area. Affordable housing initiatives represented 79%, community service initiatives represented 8%, and revitalization and stabilization efforts represented 12% of community development lending activity in the MSA, respectively. Community development lending totals included $29 million or 40% from the current period. Community development lending performance is below that of similarly-situated large retail banks in the MSA. BB40
44 Examples of community development lending initiatives included: A $ 1 million participation in a community mortgage loan that provides low- and moderate-income mortgages in the Chicago area. A $2 million loan to a community based organization to construct and rehabilitate a high school serving low- and moderate-income students. The property will be leased to the school upon completion. The property is located in a low-income census tract. A $2 million line of credit to a nonprofit organization that provides special education, vocational training, job placement, and residential facilities for the mentally handicapped of Cook County. INVESTMENT TEST Qualified investments performance is rated low satisfactory. Qualified investments in the MSA totaled $8 million, which included $5 million in statewide investments. This represents an increase of 26% on an annualized basis compared to the prior evaluation. The majority of investments in MSA 16980, 93%, were for affordable housing projects. BPNA s community development investment performance was below other similarly-situated banks operating in the assessment area. Examples of qualified investments include: A $250 thousand investment in a non-profit community development corporation that engages in revitalization projects in LMI neighborhoods. A $173 thousand investment in SBIC venture capital fund that is focused on community development as a core component of its mandate. A $1.5 million equity investment to an organization that provides affordable housing to LMI persons. BB41
45 2009 Aggregate Comparison Loan Distribution Table Assessment Area: MSA HMDA Income Categories By Tract Income By Borrower Income Bank Aggregate Bank Aggregate # % % $(000s) % % $(000s) # % % $(000s) % % $(000s) Home Purchase Low 1 3.6% 2.2% 4.3% 3.8% % 9.0% 8.1% 4.0% Moderate % 33.2% 17.4% 14.1% % 9.9% 22.7% 15.9% Middle % 32.5% 39.8% 32.6% % 19.9% 24.0% 22.0% Upper % 32.0% 38.3% 49.3% % 27.7% 32.8% 48.5% Unknown 0 0.0% 0.0% 0.1% 0.2% % 33.4% 12.4% 9.6% Total % 100.0% 100.0% 100.0% % 100.0% 100.0% 100.0% Refinance Low 3 9.7% 19.3% 2.5% 2.3% 2 6.5% 3.9% 4.2% 2.2% Moderate % 12.5% 11.6% 9.8% % 15.7% 12.2% 7.9% Middle % 38.8% 35.6% 29.6% % 20.1% 20.9% 17.4% Upper % 29.4% 50.3% 58.2% 3 9.7% 20.2% 44.5% 55.2% Unknown 0 0.0% 0.0% 0.1% 0.1% % 40.1% 18.2% 17.3% Total % 100.0% 100.0% 100.0% % 100.0% 100.0% 100.0% Home Improvement Low % 37.0% 4.4% 3.0% % 35.2% 11.8% 4.7% Moderate % 21.3% 20.2% 13.1% % 29.6% 20.1% 13.4% Middle % 29.6% 40.8% 33.4% % 17.4% 25.4% 22.5% Upper % 12.1% 34.6% 50.4% % 17.7% 37.5% 52.8% Unknown 0 0.0% 0.0% 0.0% 0.0% 0 0.0% 0.0% 5.2% 6.6% Total % 100.0% 100.0% 100.0% % 100.0% 100.0% 100.0% Multi-Family Low % 47.0% 14.7% 11.2% 0 0.0% 0.0% 0.0% 0.0% Moderate % 53.0% 39.3% 28.0% 0 0.0% 0.0% 0.0% 0.0% Middle 0 0.0% 0.0% 30.6% 26.8% 0 0.0% 0.0% 0.0% 0.0% Upper 0 0.0% 0.0% 15.4% 34.1% 0 0.0% 0.0% 0.0% 0.0% Unknown 0 0.0% 0.0% 0.0% 0.0% % 100.0% 100.0% 100.0% Total % 100.0% 100.0% 100.0% % 100.0% 100.0% 100.0% HMDA Totals Low % 26.7% 3.0% 2.8% % 4.9% 5.4% 2.6% Moderate % 34.4% 13.4% 11.2% % 8.5% 15.1% 9.7% Middle % 21.3% 36.8% 30.3% % 11.9% 21.7% 18.3% Upper % 17.6% 46.7% 55.6% % 14.0% 41.1% 52.7% Unknown 0 0.0% 0.0% 0.1% 0.1% % 60.7% 16.7% 16.7% Total % 100.0% 100.0% 100.0% % 100.0% 100.0% 100.0% SMALL BUSINESS By Tract Income Bank Aggregate # % % $(000s) % % $(000s) Low 6 5.1% 6.6% 2.7% 3.2% Moderate % 31.5% 13.2% 13.5% Middle % 35.8% 38.6% 37.4% Upper % 26.1% 44.5% 45.3% Unknown 0 0.0% 0.0% 0.2% 0.3% Tract Unknown 0 0.0% 0.0% 0.8% 0.3% Total % 100.0% 100.0% 100.0% By Revenue $1 Million or Less % 33.0% 20.0% 25.6% By Loan Size $100,000 or less % 14.1% 92.0% 24.3% $100,001-$250, % 19.9% 3.3% 14.6% $250,001-$1 Million % 66.1% 4.6% 61.1% Total % 100.0% 100.0% 100.0% Originations and Purchases BB42
46 SERVICE TEST BPNA s overall performance is considered outstanding based on its level of community development services and the accessibility of its delivery systems. Retail Services BPNA s delivery systems were readily accessible to all portions of the MSA, including LMI areas. Overall, BPNA has 13 branches in this MSA, of which 8, or 62 percent, are located in LMI areas. This compares very favorably with the 36 percent of the MSA population residing in LMI areas. Changes in branch locations during the evaluation period did not adversely affect the accessibility of its delivery systems. During the evaluation period, BPNA closed 9 branches, of which 3, or 33%, were in LMI census tracts. However, BPNA continued to meet the needs of its assessment area with its existing branch network. Services are tailored to the convenience and needs of BPNA s assessment area, particularly LMI geographies and/or LMI individuals. In LMI areas within the MSA, all branches have Saturday hours. Community Development Services BPNA is a leader in providing community development services throughout the assessment area. BPNA provided 200 services, a 133% increase since the prior evaluation in the MSA. BPNA sponsored and participated in a significant number of seminars and presentations relating to affordable mortgages, small business development, financial literacy, and community organizations. Additionally, approximately 20 BPNA staff members have provided 43 service events serving on the boards of directors or acting as key members of approximately 30 community development organizations. Approximately 17, or 57%, of these organizations are located in LMI census tracts. BPNA s community development services entailed BPNA staff providing financial management expertise and technical assistance to these organizations. BB43
47 STATE of FLORIDA CRA RATING FLORIDA: SATISFACTORY The lending test is rated: Low Satisfactory The investment test is rated: Low Satisfactory The service test is rated: Outstanding The major factors supporting the rating include: Adequate lending activity performance in the state of Florida. Good distribution of loans among individuals of different income levels and businesses of different sizes; A good level of community development lending; The geographic distribution of loans in BPNA s assessment area was good; An adequate level of qualified investments; and, Retail delivery systems were readily accessible to geographies and individuals of different income levels in the bank s assessment area. SCOPE OF EXAMINATION Examiners conducted full-scope reviews of MSA (Miami-Fort Lauderdale-Pompano Beach, FL) and MSA (Orlando-Kissimmee-Sanford, FL). These assessment areas had sufficient activity to warrant a full-scope review based on measures such as lending volume, deposit concentration, and branch office network. MSA was given the greatest weight in the overall rating, since this MSA contained 76% of the deposits, 78% of the loans and 55% of the branches in the Florida assessment area. DESCRIPTION OF INSTITUTION S OPERATIONS The Florida assessment areas have the third largest branch presence and proportion of deposits and have loan volumes similar to the New York Metro MSA. As detailed in Exhibit 1, as of December 31, 2010, BPNA operated 20 branches, or 21%, of its branches in the Florida assessment areas. The State of Florida also generated approximately 29% of BPNA s combined HMDA-related and small business loans during the examination period. Additional details on the Florida assessment area are noted in Exhibit 5 on the next page. BB44
48 Exhibit 5: Summary of Key Assessment Area Data: Florida ASSESSMENT AREA DATA MSA (Orange, Seminole, Osceola) MSA (Miami- Ft. Lauderdale- Pompano) Total Population 4 1,379,311 3,876,380 5,255,691 Population % of AA population 26% 74% 100% Families 351, ,442 1,318,384 Families % of AA families 27% 73% 100% Total Census Tracts Tracts % AA tracts 32% 69% 101% LMI tracts LMI tracts % all AA LMI tracts 26% 74% 100% Total Owner-Occupied Units 4 328, ,958 1,232,173 Units % of AA units 27% 73% 100% Business Establishments 5 102, , ,130 Bus. est. % AA bus. est. 27% 73% 100% Number of Branches Branches % all branches 45% 55% 100% Branches in LMI tracts LMI branches % AA LMI branches 56% 44% 100% Branch Deposits ($'000s) 2 264, ,167 1,092,218 Deposits % AA deposits 24% 76% 100% Deposit Market Share (% )/ Rank in Market.74%/19.53%/27.27%/43 Home Purchase Originations HP originations % AA orig. 58% 43% 100% Refinance Originations Refi orig. % AA orig. 29% 72% 100% Home Improvement Originations Total Florida Home Improvement orig. % AA orig. 24% 76% 100% Small Business Originations SB orig. % AA orig. 19% 81% 100% Combined Loan Totals ,160 % of AA Orig. 22% 78% 100% (1) Branch numbers are as of 12/31/2010. (2) Branch deposits and deposit market share are from the FDIC as of 6/30/10. (3)Originations are loans reported under HMDA or CRA small business reporting for 2008, 2009 and (4)Demographic information was obtained from the 2000 Census. (5)Business establishments information was reported by D&B for BB45
49 CONCLUSIONS WITH RESPECT TO PERFORMANCE IN FLORIDA LENDING TEST BPNA s lending performance in Florida is rated low satisfactory based on overall adequate performance in both MSA (Miami-Fort Lauderdale-Pompano Beach, FL) and MSA (Orlando-Kissimmee-Sanford, FL). Lending Activity: Lending activity showed adequate responsiveness to retail credit needs in MSA and MSA when measured in terms of number and dollar amount of HMDArelated and small business loans originated and purchased in each assessment area. Geographic Distribution: The overall geographic distribution of HMDA-related and small business loans reflected good penetration throughout LMI geographies based on good performance in MSA and excellent performance in MSA Borrower Distribution: The overall distribution of loans among borrowers of different income levels and businesses of different sizes in the State of Florida was good. This conclusion is based on good performance in MSA and excellent performance in MSA Community Development Loans: Community development lending was good. This conclusion is based on a good level of community development lending in MSA and MSA Investment Test: BPNA s overall performance was rated low satisfactory. Investment activity in MSAs and reflected an adequate level of qualified investments and grants and exhibited adequate responsiveness to credit and community development needs. Most of Florida s investments were broader statewide investments that benefited MSA and MSA Service Test: BPNA s overall performance under the Service Test in the Florida assessment area was rated Outstanding. This conclusion was based primarily on retail delivery systems that are readily accessible to all portions of the BPNA s assessment areas in MSA and MSA 36740, and an adequate level of community development services in both assessment areas. BB46
50 METROPOLITAN AREA (FULL REVIEW) MSA (MIAMI-FORT LAUDERDALE-POMPANO BEACH, FL) DESCRIPTION OF INSTITUTION S OPERATIONS BPNA operates 11 of its 20 Florida-based branches in MSA (Miami-Fort Lauderdale- Pompano Beach, FL), also referred to as the Miami MSA. As of June 30, 2010, the MSA branches held $828 million in deposits, which represents 76% of BPNA s deposits in the state of Florida. BPNA deposits in the MSA represent 0.5% market share, ranking 27 th among depository institutions in the area. Four of the MSA branches are located in LMI geographies. Of the total HMDA-related and small business originations made in Florida, 77% were extended in the Miami MSA. The Miami MSA is dominated by large regional institutions competing with BPNA for retail lending and deposit activity. The top five institutions account for 51% of overall deposits in the MSA. PERFORMANCE CONTEXT Demographic Characteristics The Miami MSA is located in the southeast part of the state of Florida and includes the cities of Miami, Miami Beach, Fort Lauderdale, Pompano Beach, Deerfield Beach, and Kendall. As of the 2000 Census, the MSA population was 3,876,380 and is estimated to have increased by 10% to $4.2 million as of July 2009, according to a U.S. Census estimate population count. The MSA is ranked as the eighth largest metro area in the United States. Miami is the lead city in the MSA and is the second largest city in Florida. The Census estimated population count reports that as of July 2009, the city s population is 418,480. The Greater Miami area is considered a cultural melting pot due to its large Latin American and Caribbean populations. The majority of area residents (76%) speak Spanish as their first language, and 57% of city residents were born outside of the US. Income Characteristics According to the 2000 Census, the Miami MSA has 966,442 families, of which 22% are lowincome, 18% are moderate-income, and 12% live below the poverty level. The HUD-adjusted 2010 median family income for the MSA is $60,200. BB47
51 Housing Characteristics The 2000 Census reports that the MSA contains approximately 1.6 million housing units, of which 57% are owner-occupied, 33% are rental, and 10% are vacant. Of the available owneroccupied units, about 1% are in low-income geographies and 22% are in moderate-income geographies. The MSA continues to struggle with a distressed housing market. During the examination period, housing prices decreased. The National Association of Realtors reported the 2010 median sales price of an existing single-family home in the MSA at $201,900, a decrease of 29% since Housing, however, remains unaffordable for most LMI borrowers. Housing prices range from four to seven times what LMI borrowers are able to afford. Labor, Employment and Economic Characteristics Since the prior examination, unemployment rates have significantly increased throughout the state of Florida and within the Miami MSA. In 2010, the MSA reported unemployment at 11.5%, compared to 6% in The economic downturn has resulted in reduced lending opportunities in this assessment area. Unemployment Statistics Area Florida 10.2% 11.5% MSA % 11.5% Source: Bureau of Labor Statistics Tourism and healthcare are the strongest industries in the Miami area. Because of its close proximity to Latin America, Miami serves as the headquarters of Latin American operations for many multinational corporations, and the city of Miami also has the largest concentration of international banks in the US. CONCLUSIONS WITH RESPECT TO PERFORMANCE TESTS IN MSA (MIAMI-FORT LAUDERDALE-POMPANO BEACH, FL) LENDING TEST BPNA s performance under the lending test in MSA was rated low satisfactory. Some of the data used to evaluate BPNA s performance in this MSA assessment area appears in Appendix D. Lending Activity: BPNA s overall lending activity performance in MSA (Miami-Ft. Lauderdale-Miami Beach, FL) was adequate, based on comparisons to peer banks and market aggregate performance. For the three year evaluation period, lending activity totaled 899 loans consisting of 30 home purchase, 60 refinance, 71 home improvement and 738 small business loans. Lending activity declined significantly compared to the prior evaluation, which over a two year evaluation period totaled 1,500 loans, consisting of 203 home purchase, 356 refinance, 149 home improvement, and 792 small business loans. BPNA had a deposit market share of 0.53% of all deposits in the MSA, compared to a market share of.13% in home purchase lending, 0.02% in BB48
52 refinance lending, 0.72% in home improvement lending and 0.12% in small business lending. Peer Comparisons indicates that BPNA s performance was comparable to that of other similarlysituated banks. Income Categories Assessment Area Demographics Tract Distribution Assessment Area: MSA Families by Tract Income Families < Poverty Level as % of Families by Tract Families by Family Income # % # % # % # % Low-income , , , Moderate-income , , , Middle-income , , , Upper-income , , , Unknown-income Total Assessment Area , , , Housing Units by Tract Housing Types by Tract Owner-occupied Rental Vacant # % % # % # % Low-income 64,375 12, , , Moderate-income 447, , , , Middle-income 621, , , , Upper-income 460, , , , Unknown-income Total Assessment Area 1,593, , , , Businesses by Tract & Revenue Size Total Businesses by Less Than or = $1 Revenue Not Tract Over $1 Million Million Reported # % # % # % # % Low-income 12, , Moderate-income 61, , , , Middle-income 102, , , , Upper-income 103, , , , Unknown-income Total Assessment Area 280, , , , Percentage of Total Businesses: Geographic Distribution: The geographic distribution of HMDA-related and small business loans was good based primarily on good performance of small business lending in LMI geographies and good HMDArelated lending penetration in moderate-income census tracts. Adequate HMDA-related penetration was noted in low-income census tracts. The table on the next page summarizes lending performance in these tracts. BPNA made no HMDA-related loans in low-income geographies in 2009, 2008 or 2010 and performance was significantly below the aggregate. Home purchase and refinance performance was rated very poor given that aggregate lending volumes for these loans indicate that some opportunities to lend existed. Home improvement performance was considered adequate since the market aggregate made only 13 home improvement loans in low-income geographies, indicating limited lending opportunities. BB49
53 Performance for HMDA-related loans in low-income geographies for 2008 and 2010 was comparable to 2009 performance in low-income geographies. Product Home Purchase Refinance Home Improvement MSA (Miami-Fort Lauderdale-Pompano Beach, FL) Low-Income Census Tracts BPNA Performance VERY POOR VERY POOR ADEQUATE 2009 Aggregate Comparison BELOW BELOW BELOW Moderate-Income Census Tracts BPNA Performance EXCELLENT POOR ADEQUATE 2009 Aggregate Comparison ABOVE BELOW BELOW Small Business GOOD SIMILAR GOOD SIMILAR BPNA made 4, or 25%, of its home purchase loans and 1, or 9%, of its home improvement loans, in moderate-income geographies in 2009, exceeding the aggregate s 17% of home purchase loans and below the aggregate s 15% for home improvement loans. BPNA s home purchase lending also compared well to the demographics of the assessment area, which indicate that 22% of the available owner-occupied housing units are located within moderate-income geographies. BPNA made no refinance loans in moderate-income geographies in 2009 and 2010 but did make 4, or 11%, of its refinance loans in moderate-income geographies in 2008, indicating overall poor refinance performance for the evaluation period. Refinance lending performance was significantly below the aggregate s refinance lending performance in moderate-income geographies. Performance for 2008 and 2010 was comparable to 2009 for home purchase lending in moderateincome geographies while performance for home improvement lending in moderate-income geographies in 2009 was stronger than 2010 performance but weaker than 2008 performance refinance lending in moderate-income geographies was comparable to 2010 performance but weaker than 2008 performance. BPNA originated 4% and 18% of its small business loans in low- and moderate-income geographies, respectively, similar to the aggregate s 4% and 18%. BPNA s performance in low and moderate-income geographies is slightly below the demographics of the assessment area, where 5% of all small businesses operate in low-income geographies and 22% of all businesses operate in moderate-income geographies. BPNA s 2008 and 2010 small business performance in low-income geographies was comparable to 2009 performance. BPNA s 2008 small business performance in moderate-income geographies was stronger than 2009 performance while 2010 performance was weaker. BB50
54 Distribution by Borrower Income and Revenue Size of Business: BPNA s overall lending to low and moderate-income borrowers and businesses of different sizes in MSA was good based on good lending to moderate-income borrowers and small businesses and adequate lending to low-income borrowers, as indicated in the chart below. Low-Income Borrowers BPNA s lending performance to low-income borrowers was adequate overall when compared to the 22% of families in the MSA which are of low-income and the performance of the aggregate. During the examination period BPNA made 1, or 6%, of its home purchase loans to low-income borrowers in 2009, significantly above the aggregate. The aggregate made 4% of its home purchase loans to low-income borrowers indicating the limited lending opportunities due to housing costs and the weak economic environment. BPNA made no refinance or home improvement loans to low-income borrowers in 2009, significantly below the aggregate s performance to low-income borrowers. Product Home Purchase Refinance Home Improvement MSA (Miami- Ft. Lauderdale- Pompano Beach, FL) Low-Income Borrowers BPNA 2009 Aggregate Performance Comparison POOR ABOVE POOR BELOW ADEQUATE BELOW Lending to Businesses with GAR <= $1 million Moderate-Income Borrowers BPNA Performance ADEQUATE VERY POOR EXCELLENT 2009 Aggregate Comparison BELOW BELOW ABOVE 2009 Aggregate Comparison Small Business GOOD ABOVE While BPNA made no home improvement loans to low-income borrowers in 2009, home improvement performance was adequate since the market aggregate made only 63 home improvement loans to low-income borrowers, indicating very limited lending opportunities home purchase and refinance performance to low-income borrowers was stronger than 2008 and 2010 performance home improvement performance to moderate-income borrowers was stronger than 2008 performance but weaker than 2010 performance. BB51
55 Moderate-Income Borrowers HMDA-lending performance to moderate-income borrowers was good overall when compared to the 18% of families in the MSA who are of moderate-income. BPNA made 2, or 13% and 2, or 18% of its home purchase and home improvement loans to moderate-income borrowers respectively, in BPNA s performance for home purchase loans was below the aggregate while its performance for home improvement loans was above. In 2009, the aggregate made 15% and 13% of its home purchase and home improvement loans to moderate-income borrowers, respectively. BPNA made no refinance loans to moderate-income borrowers in 2009 and performance was significantly below the aggregate 2010 home purchase performance to moderate-income borrowers was stronger than 2009 and 2008 performance home improvement performance to moderate-income borrowers was comparable to 2009 performance and stronger than 2008 performance and 2010 refinance performance to moderate-income borrowers was comparable to 2009 performance. Lending to Businesses of Different Sizes BPNA provided a good overall level of lending to small business borrowers with gross annual revenue (GAR) of $1 million or less. BPNA made 52% of its small business loans to these businesses, compared to the 90% of business establishments in the MSA with GAR of $1 million or less. Performance was significantly above the aggregate which made 20% of its small business loans to businesses with GAR of $1 million or less. BPNA made 80% of its small business loans in amounts of $100,000 or less, which was just somewhat below the aggregate which made 95% of its small business loans in amounts of $100,000 or less. The average loan size was $117,000. Small business performance in 2008 and 2010 was compatible to Community Development Lending: BPNA s overall community development lending activity in MSA was good with 31 loan originations totaling $43 million or 9% of BPNA s total community development lending. New community development lending originated during the examination period totaled $32 million or 74% of MSA community development lending. Community Development Lending Purpose # $( 000s) Affordable Housing 28 28,781 Community Services 1 50 Economic Development 1 1,980 Revitalize and Stabilize 1 12,600 Totals 31 43,411 The majority of lending performance within the MSA was directed at affordable housing initiatives and revitalization and stabilization of low- and moderate-income areas. Community development lending performance was comparable to that of similarly-situated large retail banks in the MSA. BB52
56 Examples of community development lending initiatives included: A $2 million loan to purchase three McDonald s restaurants located in moderate-income census tracts. Acquisition of these restaurants will create jobs for low-and moderateincome residents. A $13 million loan to acquire and renovate commercial property located in a low-income tract in Miami-Dade s empowerment zone. After completion of the renovations the development of the project will bring needed jobs for low-and moderate-income residents. A $4 million loan to acquire a 140 unit apartment complex in Broward County. The property is located in a moderate-income tract and rents are all affordable to moderateincome tenants. BB53
57 2009 Aggregate Comparison Loan Distribution Table Assessment Area: MSA HMDA Income Categories By Tract Income By Borrower Income Bank Aggregate Bank Aggregate # % % $(000s) % % $(000s) # % % $(000s) % % $(000s) Home Purchase Low 0 0.0% 0.0% 2.4% 2.0% 1 6.3% 2.5% 3.7% 1.4% Moderate % 15.5% 17.0% 11.7% % 7.9% 15.0% 8.6% Middle % 46.0% 39.7% 31.9% % 13.0% 20.5% 15.8% Upper % 38.5% 40.5% 54.0% % 69.9% 43.1% 59.4% Unknown 0 0.0% 0.0% 0.4% 0.5% % 6.7% 17.8% 14.8% Total % 100.0% 100.0% 100.0% % 100.0% 100.0% 100.0% Refinance Low 0 0.0% 0.0% 1.2% 1.0% 0 0.0% 0.0% 4.2% 2.6% Moderate 0 0.0% 0.0% 12.9% 9.2% 0 0.0% 0.0% 9.0% 5.0% Middle % 8.7% 33.1% 27.7% % 13.4% 15.7% 11.1% Upper % 91.3% 52.7% 62.0% % 68.4% 49.1% 59.2% Unknown 0 0.0% 0.0% 0.1% 0.1% % 18.2% 22.0% 22.1% Total % 100.0% 100.0% 100.0% % 100.0% 100.0% 100.0% Home Improvement Low 0 0.0% 0.0% 0.9% 0.7% 0 0.0% 0.0% 4.5% 1.4% Moderate 1 9.1% 5.1% 15.1% 8.3% % 3.2% 12.7% 6.5% Middle % 60.6% 33.5% 25.0% 1 9.1% 5.4% 21.3% 14.7% Upper % 34.3% 50.4% 66.1% % 91.3% 55.8% 70.0% Unknown 0 0.0% 0.0% 0.0% 0.0% 0 0.0% 0.0% 5.7% 7.4% Total % 100.0% 100.0% 100.0% % 100.0% 100.0% 100.0% Multi-Family Low 0 0.0% 0.0% 12.6% 7.5% 0 0.0% 0.0% 0.0% 0.0% Moderate % 100.0% 48.0% 42.9% 0 0.0% 0.0% 0.0% 0.0% Middle 0 0.0% 0.0% 24.4% 39.5% 0 0.0% 0.0% 0.0% 0.0% Upper 0 0.0% 0.0% 15.0% 10.2% 0 0.0% 0.0% 0.0% 0.0% Unknown 0 0.0% 0.0% 0.0% 0.0% % 100.0% 100.0% 100.0% Total % 100.0% 100.0% 100.0% % 100.0% 100.0% 100.0% HMDA Totals Low 0 0.0% 0.0% 1.9% 1.7% 1 2.8% 0.7% 3.9% 1.9% Moderate % 44.4% 15.3% 11.4% % 2.6% 12.4% 6.8% Middle % 21.7% 36.8% 30.2% % 7.1% 18.4% 13.4% Upper % 33.9% 45.7% 56.4% % 44.4% 45.8% 57.8% Unknown 0 0.0% 0.0% 0.2% 0.3% % 45.1% 19.5% 20.2% Total % 100.0% 100.0% 100.0% % 100.0% 100.0% 100.0% SMALL BUSINESS By Tract Income Bank Aggregate # % % $(000s) % % $(000s) Low 5 3.9% 3.5% 3.6% 5.9% Moderate % 17.3% 17.9% 19.9% Middle % 21.9% 34.8% 32.8% Upper % 54.8% 42.5% 40.1% Unknown 3 2.4% 2.5% 0.3% 0.7% Tract Unknown 0 0.0% 0.0% 0.9% 0.6% Total % 100.0% 100.0% 100.0% By Revenue $1 Million or Less % 35.3% 20.3% 24.1% By Loan Size $100,000 or less % 41.0% 94.8% 32.5% $100,001-$250, % 16.0% 2.4% 15.1% $250,001-$1 Million % 43.0% 2.8% 52.4% Total % 100.0% 100.0% 100.0% Originations and Purchases BB54
58 INVESTMENT TEST Investment test performance was low satisfactory. Qualified investments in this MSA totaled $188 thousand or 3% of Florida s total qualified investments compared to $262 thousand at the last examination. This represents a decrease of 52% on an annualized basis. BPNA s community development investment performance was below other similarly-situated banks operating in the assessment area. Qualified investments in MSA focused on affordable housing initiatives, particularly activities in the broader statewide region that benefited the MSA and the overall Florida assessment area. Examples of qualified investments include: A $100 thousand deposit in a minority-owned community development bank located in a moderate-income census tract. A $25 thousand equity investment in a consortium of financial institutions established for the purpose of funding loan programs to non-profit groups for the development of affordable housing. 15 charitable grants and contributions totaling $ 63 thousand to organizations that provide services including small business development, assistance to the homeless, and scholarships to LMI students. State-wide investments including six collateralized mortgage obligations totaling $5 million which consist of underlying mortgages to LMI borrowers. SERVICE TEST BPNA s overall performance is considered outstanding. Retail Services BPNA s delivery systems were readily accessible to all portions of the MSA, including LMI areas. Overall, BPNA has 11 branches in this MSA, of which 4, or 36 percent, are located in LMI areas. This compares favorably with the 32 percent of the MSA population residing in LMI areas. BPNA has no offsite ATMs in the assessment area. Changes in branch locations during the evaluation period did not adversely affect the accessibility of its delivery systems. During the evaluation period, BPNA closed 2 branches in an upper and middle-income census tract. No branches were opened. BPNA continued to meet the needs of its assessment area with its existing branch network. Services are tailored to the convenience and needs of BPNA s assessment area, particularly LMI geographies and/or LMI individuals. Five, 45%, of the 11 branches in the MSA had Saturday hours. In LMI areas, 3 out of the 4 total LMI branches in the MSA, 75%, have Saturday hours. BB55
59 Community Development Services BPNA provides an adequate level of community development services throughout the assessment area. BPNA provided 29 services, an increase of 38% from the previous evaluation period. BPNA sponsored and participated in seminars and presentations relating to affordable mortgages, small business development, financial literacy, and community organizations. Additionally, 8 BPNA staff members serve on the boards of directors or act as key members of approximately 14 community development organizations. Eight, or 57%, of these organizations are located in LMI census tracts. BPNA s community development activities entailed BPNA staff providing financial management expertise and technical assistance to these organizations. BB56
60 METROPOLITAN AREA (FULL REVIEW) MSA (ORLANDO-KISSIMMEE-SANFORD, FL) DESCRIPTION OF INSTITUTION S OPERATIONS BPNA operates nine of its 20 Florida-based branches in MSA (Orlando-Kissimmee- Sanford, FL), also referred to as the Orlando MSA. As of June 30, 2010, the MSA branch network held $264 million in deposits, which represented 24% of BPNA s deposits in the state of Florida. Five of the nine MSA branches are located in LMI geographies. BPNA holds less than 1% of the market share of total deposits in the MSA, ranking 19 th among deposit institutions in the MSA. Of the combined HMDA-related and small business originations in the state of Florida, 22% were extended in the Orlando MSA. The MSA is home to a number of large regional institutions competing with BPNA for retail lending and deposit activity. The top five financial institutions account for 67% of the market share PERFORMANCE CONTEXT Demographic Characteristics The Orlando MSA is Florida s third-largest metropolitan area. The area encompasses Orange, Osceola, Seminole and Lake Counties. As of the 2000 Census, the MSA has a population of 1,379,311 and is estimated to have increased by 51% according to the July 2009 U.S. Census estimated population count. Orlando is the fifth largest city in Florida and is the lead city of the Orlando-Kissimmee-Sanford, Florida MSA. The city of Orlando has a diverse population of immigrants, including large Puerto Rican, Colombian, Venezuelan, Haitian, Indian, and Vietnamese communities, and a growing number of Russian and British residents. As of the 2000 census, the population of Orlando was 185,951 and is estimated to have increased by 23% to 227,961 as of the July 2009 U.S. Census estimate population count. The city of Orlando is best known for the many tourist attractions in the area, particularly the nearby Walt Disney World Resort. BB57
61 Income Characteristics According to the 2000 Census, there are 351,942 families residing in the MSA, of which 18% are considered low-income, 18% moderate-income, and 8% live below the poverty level. The proportion of families living in poverty in the Orlando area is lower than the 11% of families living below the poverty level in BPNA s overall Florida assessment areas. The 2010 HUDadjusted median family income in the Orlando MSA is $60,900. Housing Characteristics According to the 2000 Census, there are 558,187 total housing units in the Orlando MSA, of which 59% are owner-occupied, 34% are rental units, and 7% are vacant. Of the available owner-occupied units, less than 1% are located in low-income areas and 16% are in moderateincome areas. Housing prices continue to decrease in the Orlando MSA. The National Association of Realtors reported the 2010 median sales price of an existing single-family home in the MSA at $134,700, a decrease of 36% since Home ownership nonetheless remains a challenge for LMI borrowers as the median housing price for 2010 was about three times the income of a moderateincome family and four times the income of a low-income family. Labor, Employment and Economic Characteristics Since the prior examination and over the course of this evaluation period, the unemployment rate for the Orlando MSA has increased significantly. In 2010, the MSA reported unemployment at 11.5%, compared to 5.8% in The weak economy has reduced the availability of lending opportunities in this assessment area. Tourism is the primary industry of the Orlando area economy, with the city s wide range of attractions, which includes Disney World, Universal Studios Orlando, and Sea World Orlando. It is estimated that 46.6 million visitors came to the Orlando area in Unemployment Statistics Area Florida 10.2% 11.5% MSA % 11.4% Source: Bureau of Labor Statistics Tourism accounts for 31% of the jobs in the region, with Disney World Company as the largest employer in the area. The area s economy also includes other industries such as manufacturing and the film, television, and electronic gaming industries, which are aided by the presence of Universal Studios, Disney- MGM Studios, Full Sail School, the Florida Interactive Entertainment Academy, and other entertainment companies and schools. Additional demographic data can be found in the assessment area demographic chart on the next page. BB58
62 CONCLUSIONS WITH RESPECT TO PERFORMANCE TESTS IN MSA (ORLANDO-KISSIMMEE-SANFORD, FL) LENDING TEST BPNA s performance under the lending test in MSA was rated low satisfactory. Income Categories Assessment Area Demographics Tract Distribution Assessment Area: MSA Families by Tract Income Families < Poverty Level as % of Families by Tract Families by Family Income # % # % # % # % Low-income , , , Moderate-income , , , Middle-income , , , Upper-income , , , Unknown-income Total Assessment Area , , , Housing Units by Tract Housing Types by Tract Owner-occupied Rental Vacant # % % # % # % Low-income 10,103 2, , Moderate-income 126,386 53, , , Middle-income 249, , , , Upper-income 172, , , , Unknown-income Total Assessment Area 558, , , , Businesses by Tract & Revenue Size Total Businesses by Less Than or = $1 Revenue Not Tract Over $1 Million Million Reported # % # % # % # % Low-income 1, , Moderate-income 20, , , , Middle-income 41, , , , Upper-income 38, , , , Unknown-income Total Assessment Area 102, , , , Percentage of Total Businesses: Lending Activity: BPNA s lending activity performance in the Orlando MSA was poor overall based on comparisons to peer banks and the market aggregate. BPNA s overall lending activity demonstrated poor responsiveness to the retail credit needs of MSA For the three year evaluation period, lending activity totaled 277 loans consisting of 43 home purchase, 24 refinance, 25 home improvement and 185 small business loans. BB59
63 Lending activity declined significantly compared to the prior evaluation, during which over a two year period lending activity totaled 952 loans, consisting of 194 home purchase, 274 refinance, 91 home improvement and 393 small business loans. BPNA had a deposit market share of 0.91% of all deposits in the MSA, compared to a market share of 0.05% in home purchase lending, 0.06% in refinance lending, 0.92% in home improvement lending and 0.07% in small business lending. Comparison of BPNA s HMDA and small business lending with local peers based on the number of loans per billion dollars of deposits indicates that BPNA s performance was below that of other similarly situated banks. Geographic Distribution: The overall geographic distribution of HMDA-related and small business loans was good based on good HMDA-related and small business loan penetration in moderate-income census tracts and adequate HMDA-related and small business loan penetration in low-income census tracts. The following table summarizes geographic lending performance: MSA (Orlando-Kissimmee-Sanford, FL) Product Home Purchase Refinance Home Improvement Small Business Low-Income Census Tracts BPNA 2009 Aggregate Performance Comparison ADEQUATE BELOW ADEQUATE BELOW ADEQUATE BELOW GOOD ABOVE Moderate-Income Census Tracts BPNA Performance EXCELLENT VERY POOR EXCELLENT EXCELLENT 2009 Aggregate Comparison SIMILAR BELOW ABOVE ABOVE While BPNA made no HMDA-related loans in low-income geographies in 2009 and performance was significantly below the aggregate, lending in low-income geographies was considered adequate given the limited lending opportunities as indicated by the low level of HMDA-related lending conducted by the aggregate. Performance for HMDA-related lending in low-income geographies in 2009 was comparable to 2008 and 2010 performance in low-income geographies. BPNA made 2, or 14%, of its home purchase loans and 2, or 40%, of its home improvement loans in moderate-income geographies, similar to the aggregate s 13% for home purchase loans and significantly above the aggregate s 10% for home improvement loans. BPNA s home improvement and home purchase loan performance also compares well to the demographics of the assessment area, which indicate that 16% of the available owner-occupied housing units are located within moderate-income geographies. BPNA made no refinance loans in moderateincome geographies in 2009 and none in 2008 and As a result, refinance lending performance was very poor as aggregate refinance lending volumes indicated opportunities to lend. BB60
64 BPNA originated 4% and 33% of its small business loans in low- and moderate-income geographies, respectively, significantly above the aggregate s 2% and 17%. BPNA s performance in low and moderate-income geographies was above the demographics of the assessment area, where 2% of all small businesses operate in low-income geographies and 20% of all small businesses operate in moderate-income geographies. While 2008 small business performance in moderate-income geographies was comparable to 2009 performance, 2010 performance was very poor with no small business loans extended. As such, overall performance was lowered to good to reflect lending over the entire evaluation period. Home purchase and refinance performance in moderate-income geographies in 2009 was comparable to 2008 and 2010 performance in moderate-income geographies home improvement performance in moderate-income geographies was comparable to 2008 performance and stronger than 2010 performance. Distribution by Borrower Income and Revenue Size of the Business: Lending to LMI borrowers and businesses of different sizes in MSA was excellent based on excellent lending to low and moderate-income borrowers and small businesses, as indicated in the chart below: Product Home Purchase Refinance Home Improvement MSA (Orlando-Kissimmee-Sanford, FL) Low-Income Borrowers BPNA 2009 Aggregate Performance Comparison EXCELLENT ABOVE GOOD ABOVE EXCELLENT ABOVE Lending to Businesses with GAR <= $1 million Moderate-Income Borrowers BPNA Performance EXCELLENT EXCELLENT EXCELLENT 2009 Aggregate Comparison ABOVE ABOVE ABOVE 2009 Aggregate Comparison Small Business EXCELLENT ABOVE Low-Income Borrowers BPNA s HMDA-related lending performance to low-income borrowers was excellent overall when compared to the 18% of families in the MSA which are of low-income and to the performance of the aggregate. During the examination period BPNA made 2, or 14%, 2, or 15%, and 1, or 20% of its home purchase, refinance, and home improvement loans to low-income borrowers, respectively. BPNA s performance for HMDA-related lending was significantly above the aggregate. The aggregate made 7%, 5%, and 7% of its home purchase, refinance, and home improvement loans to low-income borrowers, respectively. BB61
65 BPNA s 2008 and 2010 home purchase performance to low-income borrowers was comparable to 2009 performance refinance performance to low-income borrowers was comparable to 2010 performance but weaker than 2008 performance home improvement performance to low-income borrowers was comparable to 2008 performance but weaker than 2010 performance. Moderate-Income Borrowers BPNA s HMDA-lending performance to moderate-income borrowers was excellent when compared to the 18% of families in the MSA who are of moderate-income. The bank made 4, or 29%, 3, or 23%, and 3, or 60% of its home purchase, refinance, and home improvement loans to moderate-income borrowers, respectively. BPNA s HMDA-related performance exceeded the aggregate, which made 22%, 13%, and 19% of its home purchase, refinance, and home improvement loans to moderate-income borrowers, respectively. Overall, 2008 and 2010 HMDA-related performance was comparable to 2009 performance home purchase and refinance performance to moderate-income borrowers was comparable to 2010 performance and stronger than 2008 performance home improvement performance to moderate-income borrowers was comparable to 2008 and 2010 performance to moderate-income borrowers. Lending to Businesses of Different Sizes BPNA provided an adequate level of lending to small business borrowers with gross annual revenue (GAR) of $1 million or less. BPNA made 75% of its small business loans to these businesses, compared to the 90% of business establishments in the MSA with GAR of $1 million or less. Performance was significantly above the aggregate which made 19% of its small business loans to businesses with GAR of $1 million or less. BPNA made 71% of its small business loans in amounts of $100,000 or less, which was somewhat below the aggregate which made 95% of its small business loans in amounts of $100,000 or less. The average loan size was $148, small business performance was compatible to 2008 performance and stronger than 2010 performance. Community Development Lending: BPNA s community development lending activity in MSA (Orlando-Kissimmee, FL) was good, with 8 loan originations totaling $21 million or 4% of BPNA s total community development lending. New community development lending consisted of four loans totaling $16 million, or 76% of total community development lending. Performance exceeded Community Development Lending Purpose # $( 000s) Affordable Housing 5 16,025 Community Services 2 1,223 Economic Development 1 3,771 Revitalize and Stabilize 0 0 Totals 8 21,019 the last examination where community development lending totaled $15 million. Peer comparisons with other large retail banks indicated good performance by BPNA. BB62
66 Affordable housing initiatives represented 76% and economic development efforts represented 18% of community development lending activity. Examples of community development initiatives included: Renewal of a $5 million line of credit to a non-profit corporation that develops affordable housing throughout Florida. A $4 million loan to purchase three restaurants which will provide jobs for low-and moderate-income residents of Orlando. A $2 million loan to acquire a 104 unit apartment complex located in a moderate-income census tracts. All units are currently receiving payments under HUD s Section 8 program. INVESTMENT TEST The investment test is rated low satisfactory. BPNA had an adequate level of qualified community development investment activity, which consisted of 21 grants in the Orlando MSA totaling $92,000, or 1% of Florida s total qualified investments. The majority of these investments, 72%, were targeted to providing community development services to LMI persons. Investments made in the broader statewide area that included BPNA s Florida assessment areas totaled $6.9 million. BPNA s community development investment performance was below other similarly-situated banks operating in the assessment area. An example of a qualified investment includes: A $10,000 grant to a community organization that constructs affordable housing for LMI individuals. SERVICE TEST BPNA s overall performance is considered outstanding. Retail Services BPNA s delivery systems were readily accessible to all portions of the MSA, including LMI areas. Overall, BPNA has 9 branches in this MSA, of which 5, or 56 percent, are located in LMI areas. This compares very favorably with the 25 percent of the MSA population residing in LMI areas. Changes in branch locations during the evaluation period did not adversely affect the accessibility of its delivery systems. During the evaluation period, BPNA closed 2 branches in a low and a moderate-income census tract and opened two branches in a low and a moderateincome census tract. Services are tailored to the convenience and needs of BPNA s assessment area, particularly LMI geographies and/or LMI individuals. Seven, 78%, of the 9 branches in the MSA had Saturday hours. In LMI areas, 3 out of the 5 total LMI branches in the MSA, 60%, have Saturday hours. BB63
67 Community Development Services: BPNA provided an adequate level of community development services throughout the assessment area. BPNA provided 65 community development services. BPNA sponsored and participated in seminars and presentations relating to affordable mortgages, small business development, financial literacy, and community organizations. Additionally, approximately 6 BPNA staff members participate on boards of directors or act as key members of approximately 9 community development organizations. One, 11%, of these organizations is located in an LMI census tract. BPNA membership activities entailed BPNA staff providing financial management expertise and technical assistance to these organizations. BB64
68 2009 Aggregate Comparison Loan Distribution Table Assessment Area: MSA HMDA Income Categories By Tract Income By Borrower Income Bank Aggregate Bank Aggregate # % % $(000s) % % $(000s) # % % $(000s) % % $(000s) Home Purchase Low 0 0.0% 0.0% 0.2% 0.1% % 9.1% 6.5% 3.3% Moderate % 10.7% 13.4% 9.1% % 27.8% 22.1% 16.4% Middle % 36.8% 43.9% 37.7% % 16.5% 23.3% 21.7% Upper % 52.5% 42.5% 53.1% % 22.6% 34.5% 48.0% Unknown 0 0.0% 0.0% 0.0% 0.0% % 24.1% 13.5% 10.5% Total % 100.0% 100.0% 100.0% % 100.0% 100.0% 100.0% Refinance Low 0 0.0% 0.0% 0.3% 0.2% % 7.4% 5.0% 2.8% Moderate 0 0.0% 0.0% 9.4% 6.6% % 14.2% 12.5% 8.1% Middle % 22.8% 36.6% 30.6% % 7.8% 17.8% 14.4% Upper % 77.2% 53.7% 62.6% % 25.6% 43.3% 52.8% Unknown 0 0.0% 0.0% 0.0% 0.0% % 44.9% 21.4% 21.9% Total % 100.0% 100.0% 100.0% % 100.0% 100.0% 100.0% Home Improvement Low 0 0.0% 0.0% 0.3% 0.3% % 0.6% 7.4% 3.9% Moderate % 43.9% 10.1% 6.7% % 78.9% 18.5% 13.0% Middle % 55.6% 38.9% 33.3% % 20.5% 23.0% 17.6% Upper % 0.6% 50.8% 59.7% 0 0.0% 0.0% 45.4% 56.5% Unknown 0 0.0% 0.0% 0.0% 0.0% 0 0.0% 0.0% 5.7% 9.0% Total % 100.0% 100.0% 100.0% % 100.0% 100.0% 100.0% Multi-Family Low 0 0.0% 0.0% 0.0% 0.0% 0 0.0% 0.0% 0.0% 0.0% Moderate 0 0.0% 0.0% 26.1% 5.7% 0 0.0% 0.0% 0.0% 0.0% Middle 0 0.0% 0.0% 43.5% 53.0% 0 0.0% 0.0% 0.0% 0.0% Upper 0 0.0% 0.0% 30.4% 41.2% 0 0.0% 0.0% 0.0% 0.0% Unknown 0 0.0% 0.0% 0.0% 0.0% 0 0.0% 0.0% 100.0% 100.0% Total 0 0.0% 0.0% 100.0% 100.0% 0 0.0% 0.0% 100.0% 100.0% HMDA Totals Low 0 0.0% 0.0% 0.3% 0.2% % 7.7% 5.9% 3.0% Moderate % 6.0% 11.6% 7.9% % 22.3% 17.9% 12.3% Middle % 29.6% 40.7% 34.8% % 11.7% 20.9% 17.9% Upper % 64.3% 47.5% 57.2% % 23.3% 38.5% 49.2% Unknown 0 0.0% 0.0% 0.0% 0.0% % 34.9% 16.8% 17.6% Total % 100.0% 100.0% 100.0% % 100.0% 100.0% 100.0% SMALL BUSINESS By Tract Income Bank Aggregate # % % $(000s) % % $(000s) Low 1 4.2% 1.9% 1.5% 2.2% Moderate % 58.9% 16.7% 20.4% Middle % 34.1% 38.2% 36.5% Upper % 5.1% 42.5% 40.0% Unknown 0 0.0% 0.0% 0.0% 0.0% Tract Unknown 0 0.0% 0.0% 1.1% 0.9% Total % 100.0% 100.0% 100.0% By Revenue $1 Million or Less % 64.1% 18.5% 27.7% By Loan Size $100,000 or less % 25.3% 94.8% 34.9% $100,001-$250, % 6.6% 2.3% 13.3% $250,001-$1 Million % 68.0% 2.9% 51.8% Total % 100.0% 100.0% 100.0% Originations and Purchases BB65
69 CRA APPENDIX A SCOPE OF EXAMINATION BANCO POPULAR NORTH AMERICA TIME PERIOD REVIEWED January 1, 2008-December 31, 2010 FINANCIAL INSTITUTION * 9600 West Bryn Mawr Rosemont, Illinois PRODUCTS REVIEWED Home purchase Multifamily Refinancings Home Improvement Small business Community Development AFFILIATE(S) AFFILIATE RELATIONS PRODUCTS REVIEWED Banco Popular National Association, Florida** Holding Company subsidiary Home Purchase Refinancings Home Improvement E Loan Inc.*** Bank subsidiary Purchase Refinancings Home Improvement * Branch Examined. ** BP National Association dissolved 12/31/2008. ***E-Loan ceased all activity except deposits effective 12/31/2008. BB66
70 CRA APPENDIX B Summary of State and Multistate MSA Ratings State or Multistate Metropolitan Area Lending Test Rating Investment Test Rating Service Test Rating Overall State Rating MSA Low Satisfactory Low Satisfactory Outstanding Satisfactory California Low Satisfactory Low Satisfactory Outstanding Satisfactory Illinois Low Satisfactory Low Satisfactory Outstanding Satisfactory Florida Low Satisfactory Low Satisfactory Outstanding Satisfactory BB67
71 CRA APPENDIX C SUMMARY OF BRANCH LOCATIONS AS OF DECEMBER 31, 2010 ASSESSMENT AREA Total Branches Total Branches in LMI Tracts % of Branches in LMI Tracts % of Pop. In LMI Tracts STATE OF NEW YORK MSA % 49% STATE OF CALIFORNIA MSA % 37% MSA % 32% STATE OF ILLINOIS MSA % 36% STATE OF FLORIDA MSA % 32% MSA % 25% TOTAL BRANCHES % 40% BB68
72 CRA APPENDIX D BANCO POPULAR NORTH AMERICA Community Development Loans January 1, December 31, 2010 Affordable Housing Economic Development Community Services Revitalize and Stabilize Combined Totals Assessment Area # ('$000) # ('$000) # ('$000) # ('$000) # ('$000) New York- Northern New Jersey - Long Island MSA , , , , ,681 Statewide 2 1, ,783 Totals MSA , , , , ,464 STATE OF CALIFORNIA MSA , , , ,362 MSA , ,832 Statewide 17 15, , ,442 Totals California , , , ,636 STATE OF FLORIDA MSA , , , ,019 MSA , , ,411 Statewide 10 5, ,049 Totals Florida 43 49, , , , ,479 STATE OF ILLINOIS MSA , , , ,087 Statewide 2 1, ,430 Totals Illinois 74 58, , , ,517 STATE OF TEXAS Totals Texas 4 1, ,175 TOTAL COMMUNITY DEVELOPMENT LOANS , , , , ,271 BB69
73 CRA APPENDIX E BANCO POPULAR NORTH AMERICA Community Development Investments January 1, December 31, 2010 Affordable Housing Economic Development Community Services Revitalize and Stabilize Combined Totals Assessment Area # ('$000) # ('$000) # ('$000) # ('$000) # ('$000) New York- Northern New Jersey - Long Island MSA , ,257 Statewide 5 4, ,228 Totals MSA , ,485 STATE OF CALIFORNIA MSA MSA Statewide 6 9, ,133 Totals California 6 9, ,037 STATE OF FLORIDA MSA MSA Statewide 7 6, ,924 Totals Florida 9 6, ,204 STATE OF ILLINOIS MSA , ,750 Statewide 4 5, ,142 Totals Illinois 7 7, ,892 STATE OF TEXAS State of Texas 1 1, ,926 TOTAL COMMUNITY DEVELOPMENT INVESTMENTS 37 43, , , ,544 BB70
74 APPENDIX F State of California - Limited Scope Assessment Areas 2009 Aggregate Comparison Loan Distribution Table Assessment Area: MSA HMDA Income Categories By Tract Income By Borrower Income Bank Aggregate Bank Aggregate # % % $(000s) % % $(000s) # % % $(000s) % % $(000s) Home Purchase Low 0 0.0% 0.0% 5.8% 3.9% 0 0.0% 0.0% 4.0% 1.7% Moderate 0 0.0% 0.0% 13.9% 9.5% 0 0.0% 0.0% 16.2% 10.0% Middle 0 0.0% 0.0% 41.1% 35.5% % 100.0% 25.0% 21.1% Upper % 100.0% 39.2% 51.2% 0 0.0% 0.0% 44.8% 58.8% Unknown 0 0.0% 0.0% 0.0% 0.0% 0 0.0% 0.0% 9.9% 8.4% Total % 100.0% 100.0% 100.0% % 100.0% 100.0% 100.0% Refinance Low 0 0.0% 0.0% 1.8% 1.3% 0 0.0% 0.0% 2.9% 1.5% Moderate 0 0.0% 0.0% 6.9% 5.1% 0 0.0% 0.0% 8.6% 5.3% Middle 0 0.0% 0.0% 30.5% 24.8% 0 0.0% 0.0% 18.1% 14.0% Upper % 100.0% 60.8% 68.8% % 100.0% 55.3% 63.7% Unknown 0 0.0% 0.0% 0.0% 0.0% 0 0.0% 0.0% 15.0% 15.4% Total % 100.0% 100.0% 100.0% % 100.0% 100.0% 100.0% Home Improvement Low 0 0.0% 0.0% 1.6% 0.7% 0 0.0% 0.0% 4.8% 2.2% Moderate 0 0.0% 0.0% 7.1% 4.3% 0 0.0% 0.0% 12.2% 7.8% Middle 0 0.0% 0.0% 36.1% 27.9% 0 0.0% 0.0% 21.7% 17.5% Upper 0 0.0% 0.0% 55.2% 67.1% 0 0.0% 0.0% 55.7% 67.7% Unknown 0 0.0% 0.0% 0.0% 0.0% 0 0.0% 0.0% 5.5% 4.9% Total 0 0.0% 0.0% 100.0% 100.0% 0 0.0% 0.0% 100.0% 100.0% Multi-Family Low 0 0.0% 0.0% 26.2% 14.3% 0 0.0% 0.0% 0.0% 0.0% Moderate 0 0.0% 0.0% 28.2% 21.8% 0 0.0% 0.0% 0.0% 0.0% Middle 0 0.0% 0.0% 33.1% 34.2% 0 0.0% 0.0% 0.0% 0.0% Upper 0 0.0% 0.0% 12.5% 29.6% 0 0.0% 0.0% 0.0% 0.0% Unknown 0 0.0% 0.0% 0.0% 0.0% 0 0.0% 0.0% 100.0% 100.0% Total 0 0.0% 0.0% 100.0% 100.0% 0 0.0% 0.0% 100.0% 100.0% HMDA Totals Low 0 0.0% 0.0% 3.3% 2.5% 0 0.0% 0.0% 3.4% 1.5% Moderate 0 0.0% 0.0% 9.6% 6.9% 0 0.0% 0.0% 11.4% 6.9% Middle 0 0.0% 0.0% 34.5% 28.7% % 39.3% 20.6% 16.2% Upper % 100.0% 52.6% 62.0% % 60.7% 51.3% 60.9% Unknown 0 0.0% 0.0% 0.0% 0.0% 0 0.0% 0.0% 13.3% 14.5% Total % 100.0% 100.0% 100.0% % 100.0% 100.0% 100.0% SMALL BUSINESS By Tract Income Bank Aggregate # % % $(000s) % % $(000s) Low 0 0.0% 0.0% 4.1% 5.4% Moderate % 38.2% 15.0% 17.0% Middle 1 9.1% 28.2% 35.3% 34.3% Upper % 33.6% 45.6% 43.3% Unknown 0 0.0% 0.0% 0.0% 0.0% Tract Unknown 0 0.0% 0.0% 0.0% 0.0% Total % 100.0% 100.0% 100.0% By Revenue $1 Million or Less % 9.9% 34.3% 34.1% By Loan Size $100,000 or less % 26.2% 95.5% 47.9% $100,001-$250, % 16.8% 2.4% 13.8% $250,001-$1 Million % 57.0% 2.1% 38.3% Total % 100.0% 100.0% 100.0% Originations and Purchases BB71
75 CRA APPENDIX G GLOSSARY Aggregate lending: The number of loans originated and purchased by all reporting lenders in specified income categories as a percentage of the aggregate number of loans originated and purchased by all reporting lenders in the metropolitan area/assessment area. Census tract: A small, relatively permanent statistical subdivision of a county or statistically equivalent entity delineated for data presentation purposes by a local group of census data users or the geographic staff of a regional census center in accordance with Census Bureau guidelines. Designed to be relatively homogeneous units with respect to population characteristics, economic status, and living conditions at the time they are established, census tracts generally contain between 1,000 and 8,000 people, with an optimum size of 4,000 people. Census tract boundaries are delineated with the intention of being stable over many decades, so they generally follow relatively permanent visible features. However, they may follow governmental unit boundaries and other invisible features in some instances; the boundary of a state or county (or statistically equivalent entity) is always a census tract boundary. Community development: Affordable housing (including multifamily rental housing) for lowor moderate-income individuals; community services targeted to low- or moderate-income individuals; activities that promote economic development by financing businesses or farms that meet the size eligibility standards of the Small Business Administration s Development Company or Small Business Investment Company programs (13 CFR ) or have gross annual revenues of $1 million or less; or, activities that revitalize or stabilize low- or moderateincome geographies. Effective September 1, 2005, the Board of Governors of the Federal Reserve System, Office of the Comptroller of the Currency, and the Federal Deposit Insurance Corporation have adopted the following additional language as part of the revitalize or stabilize definition of community development. Activities that revitalize or stabilize- (i) Low-or moderate-income geographies; (ii) (iii) Designated disaster areas; or Distressed or underserved nonmetropolitan middle-income geographies designated by the Board, Federal Deposit Insurance Corporation, and Office of the Comptroller of the Currency, based ona. Rates of poverty, unemployment, and population loss; or b. Population size, density, and dispersion. Activities that revitalize and stabilize geographies designated based on population size, density, and dispersion if they help to meet essential community needs, including needs of low- and moderate-income individuals. Family: A family is a group of two or more people related by birth, marriage, or adoption and residing together; all such people (including related subfamily members) are considered as members of one family. Full review: Performance is analyzed considering performance context, quantitative factors and qualitative factors. BB72
76 Geography: A census tract delineated by the United States Bureau of the Census in the most recent decennial census. Home Mortgage Disclosure Act ( HMDA ): The statute that requires certain mortgage lenders that do business or have banking offices in a metropolitan statistical area to file annual summary reports of their mortgage lending activity. The reports include such data as the race, gender, and income of applicants, the amount of loan requested, and the disposition of the application (e.g., approved, denied, and withdrawn). Home mortgage loans: Includes home purchase and home improvement loans as defined in the HMDA regulation. This definition also includes multifamily (five or more families) dwelling loans, loans for the purchase of manufactured homes, and refinancings of home improvement and home purchase loans. Household: A household consists of all the people who occupy a housing unit. A household includes the related family members and all the unrelated people, if any, such as lodgers, foster children, wards, or employees who share the housing unit. A person living alone in a housing unit, or a group of unrelated people sharing a housing unit such as partners or roomers, is also counted as a household. The count of households excludes group quarters. Limited-scope review: Performance is analyzed using only quantitative factors. Low-income: Individual income that is less than 50% of the area median income, or a median family income that is less than 50%, in the case of a geography. Metropolitan Statistical Area ( MSA ): A geographic entity defined by the federal Office of Management and Budget for use by federal statistical agencies, based on the concept of a core area with a large population nucleus, plus adjacent communities having a high degree of economic and social integration with that core. Metropolitan Division: A county or group of counties within a Metropolitan Statistical Area that contains a population of at least 2.5 million and represents an employment center(s) associated through commuting ties. Middle-income: Individual income that is at least 80% and less than 120% of the area median income, or a median family income that is at least 80% and less than 120%, in the case of a geography. Moderate-income: Individual income that is at least 50% and less than 80% of the area median income, or a median family income that is at least 50% and less than 80%, in the case of a geography. Multifamily: Refers to a residential structure that contains five or more units. Owner-occupied units: Includes units occupied by the owner or co-owner, even if the unit has not been fully paid for or is mortgaged. BB73
77 Qualified investment: A qualified investment is defined as any lawful investment, deposit, membership share or grant that has as its primary purpose community development. Rated area: A rated area is a state or multistate metropolitan area. For an institution with domestic branches in only one state, the institution s CRA rating would be the state rating. If an institution maintains domestic branches in more than one state, the institution will receive a rating for each state in which those branches are located. If an institution maintains domestic branches in two or more states within a multistate metropolitan area, the institution will receive a rating for the multistate metropolitan area. Small loan(s) to business(es): A loan included in loans to small businesses as defined in the Consolidated Report of Condition and Income ( Call Report ) and the Thrift Financial Reporting ( TFR ) instructions. These loans have original amounts of $1 million or less and typically are either secured by nonfarm or nonresidential real estate or are classified as commercial and industrial loans. However, thrift institutions may also exercise the option to report loans secured by nonfarm residential real estate as "small business loans" if the loans are reported on the TFR as nonmortgage, commercial loans. Upper-income: Individual income that is more than 120% of the area median income, or a median family income that is more than 120%, in the case of a geography. BB74

78 New York Assessment Area 2010 Legend ElAssessment,M_a El County 0 Branch BB75
79 New Jersey Assessment Area 2010 BB76
80 California Assessment Area 2010 Los Angeles ^ F 0 0 S0.. 0 Orange ' l San Diego 0 Legend Assessment Area 11 County Branch Miles a BB77
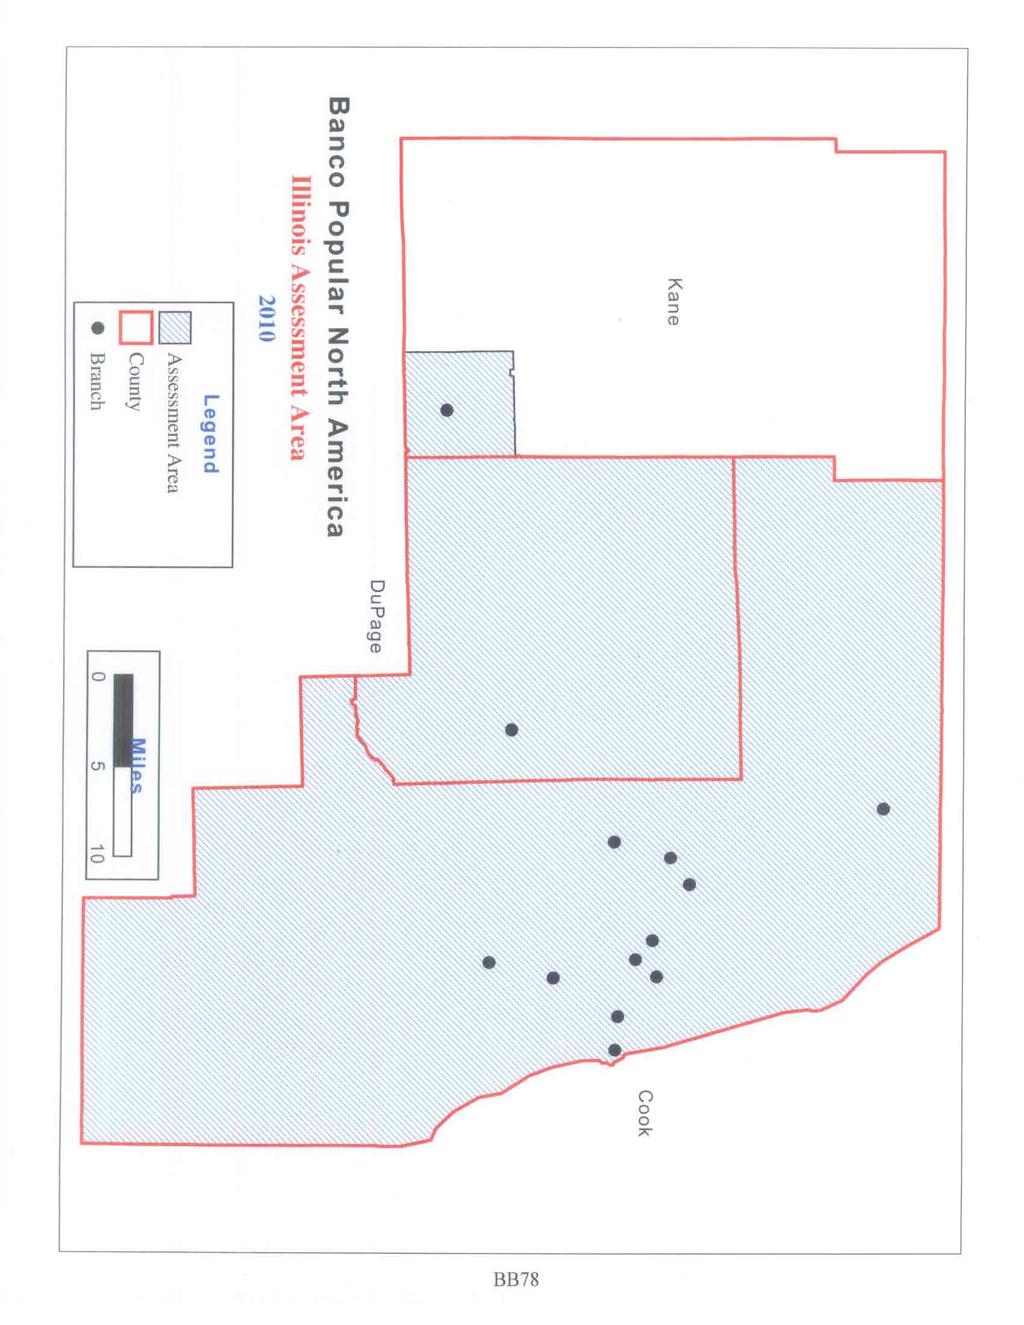
81 BB78

82 Central Florida Assessment Area 2010 Seminole Orange Legend County Assessment Area Branch BB79

83 / Broward 0 // it Legend As,essment An..i County. 0 %i-;. Branch iami-dade On BB80 South Florida Assessment Area 2010
PUBLIC DISCLOSURE COMMUNITY REINVESTMENT ACT PERFORMANCE EVALUATION
 PUBLIC DISCLOSURE March 9, 2009 COMMUNITY REINVESTMENT ACT PERFORMANCE EVALUATION RSSD No. 2736291 9600 West Bryn Mawr Rosemont, Illinois 60018 Federal Reserve Bank of New York 33 Liberty Street New York,
PUBLIC DISCLOSURE COMMUNITY REINVESTMENT ACT PERFORMANCE EVALUATION
 PUBLIC DISCLOSURE August 1, 2011 COMMUNITY REINVESTMENT ACT PERFORMANCE EVALUATION Five Star Bank RSSD No. 601416 55 North Main Street Warsaw, NY 14203 Federal Reserve Bank of New York 33 Liberty Street
PUBLIC DISCLOSURE COMMUNITY REINVESTMENT ACT PERFORMANCE EVALUATION
 PUBLIC DISCLOSURE October 31, 2005 COMMUNITY REINVESTMENT ACT PERFORMANCE EVALUATION RSSD No. 236706 158 U.S. Highway 206 North Gladstone, New Jersey 07934 Federal Reserve of New York 33 Liberty Street
PUBLIC DISCLOSURE COMMUNITY REINVESTMENT ACT PERFORMANCE EVALUATION
 PUBLIC DISCLOSURE August 1, 2011 COMMUNITY REINVESTMENT ACT PERFORMANCE EVALUATION Empire State Bank RSSD No. 3277241 68 North Plank Road Newburgh, New York 12550 FEDERAL RESERVE BANK OF NEW YORK 33 LIBERTY
PUBLIC DISCLOSURE COMMUNITY REINVESTMENT ACT PERFORMANCE EVALUATION
 PUBLIC DISCLOSURE January 9, 2012 COMMUNITY REINVESTMENT ACT PERFORMANCE EVALUATION Peapack-Gladstone Bank RSSD No. 236706 500 Hills Drive Suite 300 Bedminster, New Jersey 07921 FEDERAL RESERVE BANK OF
PUBLIC DISCLOSURE COMMUNITY REINVESTMENT ACT PERFORMANCE EVALUATION
 PUBLIC DISCLOSURE August 10, 2015 COMMUNITY REINVESTMENT ACT PERFORMANCE EVALUATION Amboy Bank RSSD No. 9807 3890 U.S. Hwy 9 Old Bridge, New Jersey 08859 FEDERAL RESERVE BANK OF NEW YORK 33 LIBERTY STREET
PUBLIC DISCLOSURE COMMUNITY REINVESTMENT ACT PERFORMANCE EVALUATION
 PUBLIC DISCLOSURE March 6, 2017 COMMUNITY REINVESTMENT ACT PERFORMANCE EVALUATION RSSD No. 101671 185 Genesee Street Utica, New York 13501 FEDERAL RESERVE BANK OF NEW YORK 33 LIBERTY STREET NEW YORK, NY
PUBLIC DISCLOSURE COMMUNITY REINVESTMENT ACT PERFORMANCE EVALUATION
 PUBLIC DISCLOSURE November 5, 2003 COMMUNITY REINVESTMENT ACT PERFORMANCE EVALUATION RSSD No. 236706 158 U.S. Highway 206 North Gladstone, New Jersey 07934 Federal Reserve of New York 33 Liberty Street
PUBLIC DISCLOSURE COMMUNITY REINVESTMENT ACT PERFORMANCE EVALUATION
 PUBLIC DISCLOSURE January 26, 2009 COMMUNITY REINVESTMENT ACT PERFORMANCE EVALUATION Amboy Bank RSSD No. 9807 3590 Highway 9 Old Bridge, NJ 08859 Federal Reserve Bank of New York 33 Liberty Street New
COMMUNITY REINVESTMENT ACT PERFORMANCE EVALUATION
 PUBLIC DISCLOSURE December 6, 2010 COMMUNITY REINVESTMENT ACT PERFORMANCE EVALUATION Alden State Bank RSSD No. 414102 13216 Broadway Alden, New York 14004 FEDERAL RESERVE BANK OF NEW YORK 33 LIBERTY STREET
PUBLIC DISCLOSURE. October 10, 2006 COMMUNITY REINVESTMENT ACT PERFORMANCE EVALUATION. BPD BANK RSSD No
 PUBLIC DISCLOSURE October 10, 2006 COMMUNITY REINVESTMENT ACT PERFORMANCE EVALUATION BPD BANK RSSD No. 66015 90 BROAD STREET NEW YORK, NEW YORK 10004 Federal Reserve Bank of New York 33 Liberty Street
COMMUNITY REINVESTMENT ACT PERFORMANCE EVALUATION
 PUBLIC DISCLOSURE July 25, 2011 COMMUNITY REINVESTMENT ACT PERFORMANCE EVALUATION Bank of Millbrook RSSD No. 175609 3263 Franklin Avenue Millbrook, New York 12545 FEDERAL RESERVE BANK OF NEW YORK 33 LIBERTY
PUBLIC DISCLOSURE COMMUNITY REINVESTMENT ACT PERFORMANCE EVALUATION
 PUBLIC DISCLOSURE February 22, 2016 COMMUNITY REINVESTMENT ACT PERFORMANCE EVALUATION Empire State Bank RSSD No. 3277241 68 Plank Road Newburgh, New York 12550 FEDERAL RESERVE BANK OF NEW YORK 33 LIBERTY
PUBLIC DISCLOSURE COMMUNITY REINVESTMENT ACT PERFORMANCE EVALUATION
 PUBLIC DISCLOSURE June 6, 2016 COMMUNITY REINVESTMENT ACT PERFORMANCE EVALUATION Mizuho Bank (USA) RSSD No. 229913 1251 Avenue of the Americas New York, NY 10020 FEDERAL RESERVE BANK OF NEW YORK 33 LIBERTY
PUBLIC DISCLOSURE COMMUNITY REINVESTMENT ACT PERFORMANCE EVALUATION
 PUBLIC DISCLOSURE January 14, 2008 COMMUNITY REINVESTMENT ACT PERFORMANCE EVALUATION Orange County Trust Company RSSD No. 176101 212 Dolson Avenue Middletown, NY 10940 FEDERAL RESERVE BANK OF NEW YORK
PUBLIC DISCLOSURE COMMUNITY REINVESTMENT ACT PERFORMANCE EVALUATION
 PUBLIC DISCLOSURE February 22, 2010 COMMUNITY REINVESTMENT ACT PERFORMANCE EVALUATION Orange County Trust Company RSSD No. 176101 212 Dolson Avenue Middletown, NY 10940 FEDERAL RESERVE BANK OF NEW YORK
PUBLIC DISCLOSURE COMMUNITY REINVESTMENT ACT
 PUBLIC DISCLOSURE March 31, 2014 COMMUNITY REINVESTMENT ACT PERFORMANCE EVALUATION First Bank & Trust RSSD# 2333298 820 Church Street Evanston, IL 60201 Federal Reserve Bank of Chicago 230 South LaSalle
COMMUNITY REINVESTMENT ACT PERFORMANCE EVALUATION
 PUBLIC DISCLOSURE Date of Evaluation: MARCH 09, 2015 COMMUNITY REINVESTMENT ACT PERFORMANCE EVALUATION Name of Depository Institution: UNIVEST BANK AND TRUST Co. Institution s Identification Number: 354310
PUBLIC DISCLOSURE COMMUNITY REINVESTMENT ACT PERFORMANCE EVALUATION
 PUBLIC DISCLOSURE March 10, 2008 COMMUNITY REINVESTMENT ACT PERFORMANCE EVALUATION Tioga State Bank RSSD No. 910118 1 Main Street P.O. Box 386 Spencer, NY 14883 FEDERAL RESERVE BANK OF NEW YORK 33 LIBERTY
PUBLIC DISCLOSURE COMMUNITY REINVESTMENT ACT PERFORMANCE EVALUATION
 PUBLIC DISCLOSURE January 18, 2017 COMMUNITY REINVESTMENT ACT PERFORMANCE EVALUATION Sterling National Bank Charter Number 25075 400 Rella Boulevard Montebello, NY 10901-4243 Office of the Comptroller
PUBLIC DISCLOSURE COMMUNITY REINVESTMENT ACT PERFORMANCE EVALUATION
 PUBLIC DISCLOSURE August 20, 2007 COMMUNITY REINVESTMENT ACT PERFORMANCE EVALUATION RSSD No. 101671 185 Genesee Street Utica, New York 13501 FEDERAL RESERVE BANK OF NEW YORK 33 LIBERTY STREET NEW YORK,
PUBLIC DISCLOSURE COMMUNITY REINVESTMENT ACT PERFORMANCE EVALUATION
 PUBLIC DISCLOSURE August 25, 2003 COMMUNITY REINVESTMENT ACT PERFORMANCE EVALUATION ORANGE COUNTY TRUST COMPANY RSSD 176101 212 Dolson Avenue Middletown, New York 10940 FEDERAL RESERVE BANK OF NEW YORK
PUBLIC DISCLOSURE COMMUNITY REINVESTMENT ACT PERFORMANCE EVALUATION
 PUBLIC DISCLOSURE April 15, 2013 COMMUNITY REINVESTMENT ACT PERFORMANCE EVALUATION RSSD# 311845 75 North East Street Fayetteville, Arkansas 72701 Federal Reserve Bank of St. Louis P.O. Box 442 St. Louis,
PUBLIC DISCLOSURE COMMUNITY REINVESTMENT ACT PERFORMANCE EVALUATION
 PUBLIC DISCLOSURE January 6, 2014 COMMUNITY REINVESTMENT ACT PERFORMANCE EVALUATION LegacyTexas Bank RSSD Number: 913267 5000 Legacy Drive Plano, Texas 75024 Federal Reserve Bank of Dallas 2200 North Pearl
PUBLIC DISCLOSURE. September 13, 1999 COMMUNITY REINVESTMENT ACT PERFORMANCE EVALUATION. BPD INTERNATIONAL BANK RSSD No
 PUBLIC DISCLOSURE September 13, 1999 COMMUNITY REINVESTMENT ACT PERFORMANCE EVALUATION BPD INTERNATIONAL BANK 152 West 57 th Street Carnegie Hall Tower, 5 th Floor New York, NY 10019 FEDERAL RESERVE BANK
PUBLIC DISCLOSURE COMMUNITY REINVESTMENT ACT PERFORMANCE EVALUATION
 PUBLIC DISCLOSURE February 17,1998 COMMUNITY REINVESTMENT ACT PERFORMANCE EVALUATION Chemung Canal Trust Company 2362400 P.O. Box 1522 One Chemung Canal Plaza Elmira, New York 14902-1522 Federal Reserve
PUBLIC DISCLOSURE COMMUNITY REINVESTMENT ACT PERFORMANCE EVALUATION
 PUBLIC DISCLOSURE September 30, 2013 COMMUNITY REINVESTMENT ACT PERFORMANCE EVALUATION The Bank of New York Mellon RSSD No. 541101 225 Liberty Street New York, New York 10286 FEDERAL RESERVE BANK OF NEW
PUBLIC DISCLOSURE COMMUNITY REINVESTMENT ACT PERFORMANCE EVALUATION CHEMUNG CANAL TRUST COMPANY RSSD:
 PUBLIC DISCLOSURE (FEBRUARY 4, 2002) COMMUNITY REINVESTMENT ACT PERFORMANCE EVALUATION CHEMUNG CANAL TRUST COMPANY RSSD: 884303 One Chemung Canal Plaza Elmira, New York 14901 Federal Reserve Bank of New
PUBLIC DISCLOSURE. September 27, 2004 COMMUNITY REINVESTMENT ACT PERFORMANCE EVALUATION. BPD Bank RSSD No
 PUBLIC DISCLOSURE September 27, 2004 COMMUNITY REINVESTMENT ACT PERFORMANCE EVALUATION RSSD No. 66015 90 BROAD STREET NEW YORK, NEW YORK 10045 Federal Reserve Bank of New York 33 Liberty Street New York,
PUBLIC DISCLOSURE COMMUNITY REINVESTMENT ACT PERFORMANCE EVALUATION
 PUBLIC DISCLOSURE November 26, 2012 COMMUNITY REINVESTMENT ACT PERFORMANCE EVALUATION Southern Bancorp Bank RSSD# 852544 601 Main Street Arkadelphia, Arkansas 71923 Federal Reserve Bank of St. Louis P.O.
PUBLIC DISCLOSURE COMMUNITY REINVESTMENT ACT PERFORMANCE EVALUATION
 PUBLIC DISCLOSURE December 3, 2007 COMMUNITY REINVESTMENT ACT PERFORMANCE EVALUATION RSSD: 368522 201 North Warren Avenue Apollo, Pennsylvania 15613 Federal Reserve Bank of Cleveland P.O. Box 6387 Cleveland,
PUBLIC DISCLOSURE. August 5, 2013 COMMUNITY REINVESTMENT ACT PERFORMANCE EVALUATION. Pacific Enterprise Bank RSSD #
 PUBLIC DISCLOSURE August 5, 2013 COMMUNITY REINVESTMENT ACT PERFORMANCE EVALUATION Pacific Enterprise Bank RSSD # 3490871 17748 Sky Park Circle, Suite 100 Irvine, California 92614 Federal Reserve Bank
PUBLIC DISCLOSURE AUGUST 16, 2010 COMMUNITY REINVESTMENT ACT PERFORMANCE EVALUATION AMERICAN HERITAGE BANK RSSD#
 PUBLIC DISCLOSURE AUGUST 16, 2010 COMMUNITY REINVESTMENT ACT PERFORMANCE EVALUATION AMERICAN HERITAGE BANK RSSD# 311050 2 SOUTH MAIN SAPULPA, OKLAHOMA 74066 Federal Reserve Bank of Kansas City 1 Memorial
PUBLIC DISCLOSURE COMMUNITY REINVESTMENT ACT PERFORMANCE EVALUATION
 PUBLIC DISCLOSURE April 30, 2007 COMMUNITY REINVESTMENT ACT PERFORMANCE EVALUATION Five Star Bank RSSD No. 601416 55 North Main Street Warsaw, New York 14203 Federal Reserve Bank of New York 33 Liberty
PUBLIC DISCLOSURE. July 7, 2008 COMMUNITY REINVESTMENT ACT PERFORMANCE EVALUATION. 135 North Robles Avenue Pasadena, California 91101
 PUBLIC DISCLOSURE July 7, 2008 COMMUNITY REINVESTMENT ACT PERFORMANCE EVALUATION East West Bank RSSD #197478 135 North Robles Avenue Pasadena, California 91101 Federal Reserve Bank of San Francisco 101
PUBLIC DISCLOSURE. December 6, 2004 COMMUNITY REINVESTMENT ACT PERFORMANCE EVALUATION BANK OF EUFAULA RSSD#
 PUBLIC DISCLOSURE COMMUNITY REINVESTMENT ACT PERFORMANCE EVALUATION BANK OF EUFAULA RSSD# 343051 P.O. BOX 607 EUFAULA, OKLAHOMA 74432-0607 Federal Reserve Bank of Kansas City 925 Grand Boulevard Kansas
PUBLIC DISCLOSURE COMMUNITY REINVESTMENT ACT PERFORMANCE EVALUATION
 PUBLIC DISCLOSURE May 21, 2007 COMMUNITY REINVESTMENT ACT PERFORMANCE EVALUATION The Bank of New York RSSD No. 541101 One Wall Street New York, New York 10286 FEDERAL RESERVE BANK OF NEW YORK 33 LIBERTY
PUBLIC DISCLOSURE COMMUNITY REINVESTMENT ACT PERFORMANCE EVALUATION
 PUBLIC DISCLOSURE April 28, 2014 COMMUNITY REINVESTMENT ACT PERFORMANCE EVALUATION Solvay Bank RSSD No. 722816 1537 Milton Avenue Solvay, New York 13209 FEDERAL RESERVE BANK OF NEW YORK 33 LIBERTY STREET
PUBLIC DISCLOSURE. November 30, 2009 COMMUNITY REINVESTMENT ACT PERFORMANCE EVALUATION. Solvay Bank RSSD No
 PUBLIC DISCLOSURE November 30, 2009 COMMUNITY REINVESTMENT ACT PERFORMANCE EVALUATION Solvay Bank RSSD No. 722816 1537 Milton Avenue Solvay, New York 13209 Federal Reserve Bank of New York 33 Liberty Street
BANK NAME YEAR CENSUS TRACT LOAN TYPE PROGRAM NO. OF LOANS VALUE OF LOANS BNY Mellon N.A HM NONE BNY Mellon N.A
 BANK NAME YEAR CENSUS TRACT LOAN TYPE PROGRAM NO. OF LOANS VALUE OF LOANS BNY Mellon N.A. 2015 2612.00 HM NONE 1 700 BNY Mellon N.A. 2015 2162.00 HM NONE 1 500 BNY Mellon N.A. 2015 2641.02 HM NONE 1 784
November 20, 2006 COMMUNITY REINVESTMENT ACT PERFORMANCE EVALUATION. 60 Wall Street New York, New York 10006
 PUBLIC DISCLOSURE November 20, 2006 COMMUNITY REINVESTMENT ACT PERFORMANCE EVALUATION DEUTSCHE BANK TRUST COMPANY AMERICAS RSSD No. 214807 60 Wall Street New York, New York 10006 Federal Reserve Bank of
COMMUNITY REINVESTMENT ACT PERFORMANCE EVALUATION
 PUBLIC DISCLOSURE August 24, 2009 COMMUNITY REINVESTMENT ACT PERFORMANCE EVALUATION First State Bank of Red Bud RSSD # 356949 115 West Market Street Red Bud, Illinois 62278 Federal Reserve Bank of St.
PUBLIC DISCLOSURE COMMUNITY REINVESTMENT ACT PERFORMANCE EVALUATION
 PUBLIC DISCLOSURE June 13, 2011 COMMUNITY REINVESTMENT ACT PERFORMANCE EVALUATION Adirondack Trust Company RSSD No. 645317 473 Broadway Saratoga Springs, NY 12866 Federal Reserve Bank of New York 33 Liberty
PUBLIC DISCLOSURE COMMUNITY REINVESTMENT ACT PERFORMANCE EVALUATION
 PUBLIC DISCLOSURE January 19, 2016 COMMUNITY REINVESTMENT ACT PERFORMANCE EVALUATION RSSD# 856748 200 South Third Street Batesville, Arkansas 72501 Federal Reserve Bank of St. Louis P.O. Box 442 St. Louis,
COMMUNITY REINVESTMENT ACT PERFORMANCE EVALUATION
 PUBLIC DISCLOSURE August 26, 2013 COMMUNITY REINVESTMENT ACT PERFORMANCE EVALUATION BNY Mellon, National Association Charter Number 6301 One Mellon Center, 500 Grant Street Pittsburgh, PA 15258 Office
PUBLIC DISCLOSURE COMMUNITY REINVESTMENT ACT PERFORMANCE EVALUATION
 PUBLIC DISCLOSURE December 4, 2006 COMMUNITY REINVESTMENT ACT PERFORMANCE EVALUATION ALDEN STATE BANK RSSD No. 414102 13216 Broadway Alden, New York 14004 FEDERAL RESERVE BANK OF NEW YORK 33 Liberty Street
COMMUNITY REINVESTMENT ACT PERFORMANCE EVALUATION
 PUBLIC DISCLOSURE June 2, 2008 COMMUNITY REINVESTMENT ACT PERFORMANCE EVALUATION Legacy Bank & Trust Company RSSD # 397755 10603 Highway 32 P.O. Box D Plato, Missouri 65552 Federal Reserve Bank of St.
PUBLIC DISCLOSURE COMMUNITY REINVESTMENT ACT PERFORMANCE EVALUATION
 PUBLIC DISCLOSURE April 5, 2010 COMMUNITY REINVESTMENT ACT PERFORMANCE EVALUATION The Callaway Bank RSSD #719656 5 East Fifth Street Fulton, Missouri 65251 Federal Reserve Bank of St. Louis P.O. Box 442
PUBLIC DISCLOSURE COMMUNITY REINVESTMENT ACT PERFORMANCE EVALUATION
 CapitalMark Bank & Trust CRA PUBLIC EVALUATION PUBLIC DISCLOSURE May 7, 2012 COMMUNITY REINVESTMENT ACT PERFORMANCE EVALUATION CapitalMark Bank &Trust 801 Broad Street Chattanooga, Tennessee 37402 RSSD
PUBLIC DISCLOSURE. January 17, 2006 COMMUNITY REINVESTMENT ACT PERFORMANCE EVALUATION. 500 Linden Avenue South San Francisco, California 94080
 PUBLIC DISCLOSURE January 17, 2006 COMMUNITY REINVESTMENT ACT PERFORMANCE EVALUATION Liberty Bank RSSD - 478766 500 Linden Avenue South San Francisco, California 94080 Federal Reserve Bank of San Francisco
PUBLIC DISCLOSURE COMMUNITY REINVESTMENT ACT PERFORMANCE EVALUATION
 PUBLIC DISCLOSURE September 29, 2014 COMMUNITY REINVESTMENT ACT PERFORMANCE EVALUATION MainSource Bank Certificate #5766 201 North Broadway Greensburg, Indiana 47240 Federal Deposit Insurance Corporation
PUBLIC DISCLOSURE COMMUNITY REINVESTMENT ACT PERFORMANCE EVALUATION
 PUBLIC DISCLOSURE July 15, 2013 COMMUNITY REINVESTMENT ACT PERFORMANCE EVALUATION Meridian Bank Texas Certificate Number: 11895 100 Lexington Street, Suite 100 Fort Worth, Texas 76102 Federal Deposit Insurance
PUBLIC DISCLOSURE. June 4, 2012 COMMUNITY REINVESTMENT ACT PERFORMANCE EVALUATION. Utah Independent Bank RSSD #
 PUBLIC DISCLOSURE June 4, 2012 COMMUNITY REINVESTMENT ACT PERFORMANCE EVALUATION Utah Independent RSSD # 256179 55 South State Street Salina, Utah 84654 Federal Reserve of San Francisco 101 Market Street
PUBLIC DISCLOSURE COMMUNITY REINVESTMENT ACT PERFORMANCE EVALUATION
 PUBLIC DISCLOSURE August 17, 2009 COMMUNITY REINVESTMENT ACT PERFORMANCE EVALUATION Midland States Bank RSSD #773247 133 West Jefferson Street Effingham, Illinois 62401 Federal Reserve Bank of St. Louis
PUBLIC DISCLOSURE COMMUNITY REINVESTMENT ACT PERFORMANCE EVALUATION
 PUBLIC DISCLOSURE April 22, 2013 COMMUNITY REINVESTMENT ACT PERFORMANCE EVALUATION RSSD #2552099 1001 Gibson Bay Drive, Suite #101 Richmond, Kentucky 40475 Federal Reserve Bank of Cleveland P.O. Box 6387
PUBLIC DISCLOSURE. August 30, 2004 COMMUNITY REINVESTMENT ACT PERFORMANCE EVALUATION FARMERS STATE BANK RSSD#
 PUBLIC DISCLOSURE COMMUNITY REINVESTMENT ACT PERFORMANCE EVALUATION FARMERS STATE BANK RSSD# 542854 P.O. BOX 458 PINE BLUFFS, WYOMING 82082 Federal Reserve Bank of Kansas City 925 Grand Boulevard Kansas
PUBLIC DISCLOSURE COMMUNITY REINVESTMENT ACT PERFORMANCE EVALUATION
 PUBLIC DISCLOSURE January 22, 2013 COMMUNITY REINVESTMENT ACT PERFORMANCE EVALUATION Bank of Texas RSSD: 925653 306 West Wall Midland, Texas 79701 Federal Reserve Bank of Dallas 2200 North Pearl Street
PUBLIC DISCLOSURE COMMUNITY REINVESTMENT ACT PERFORMANCE EVALUATION
 PUBLIC DISCLOSURE COMMUNITY REINVESTMENT ACT PERFORMANCE EVALUATION Mizuho Bank (USA) RSSD No. 229913 1251 Avenue of the Americas New York, NY 10020 FEDERAL RESERVE BANK OF NEW YORK 33 LffiERTY STREET
PUBLIC DISCLOSURE COMMUNITY REINVESTMENT ACT PERFORMANCE EVALUATION
 PUBLIC DISCLOSURE November 5, 2012 COMMUNITY REINVESTMENT ACT PERFORMANCE EVALUATION RSSD: 2747279 115 Third Street Marietta, Ohio 45750 Federal Reserve Bank of Cleveland P.O. Box 6387 Cleveland, OH 44101-1387
() Office of the Comptroller of the Currency
 Office of the Comptroller of the Currency") () Office of the Comptroller of the Currency Washington, DC 20219 August 16, 2017 Board of Directors City National Bank 400 North Roxbury Drive Beverly Hills, CA 90210 Dear Members of the Board: Enclosed
() Office of the Comptroller of the Currency Washington, DC 20219 August 16, 2017 Board of Directors City National Bank 400 North Roxbury Drive Beverly Hills, CA 90210 Dear Members of the Board: Enclosed
PUBLIC DISCLOSURE. February 7, 2011 COMMUNITY REINVESTMENT ACT PERFORMANCE EVALUATION. Webster Bank, National Association Charter Number: 24469
 O LARGE BANK Comptroller of the Currency Administrator of National Banks Washington, DC 20219 PUBLIC DISCLOSURE February 7, 2011 COMMUNITY REINVESTMENT ACT PERFORMANCE EVALUATION Webster Bank, National
PUBLIC DISCLOSURE. October 9, 2012 COMMUNITY REINVESTMENT ACT PERFORMANCE EVALUATION. United Security Bank RSSD #
 PUBLIC DISCLOSURE October 9, 2012 COMMUNITY REINVESTMENT ACT PERFORMANCE EVALUATION United Security Bank RSSD # 1162017 2126 Inyo Street Fresno, California 93721 Federal Reserve Bank of San Francisco 101
PUBLIC DISCLOSURE. March 5, 2012 COMMUNITY REINVESTMENT ACT PERFORMANCE EVALUATION. Bay Commercial Bank RSSD #
 PUBLIC DISCLOSURE March 5, 2012 COMMUNITY REINVESTMENT ACT PERFORMANCE EVALUATION Bay Commercial Bank RSSD # 3281510 1280 Civic Drive, Suite 100 Walnut Creek, California 94596 Federal Reserve Bank of San
Objectives Upon completion of the CRA overview, you should:
 CRA Basics Objectives Upon completion of the CRA overview, you should: Understand the purpose of the CRA; Understand terms and definitions under the CRA regulation including bank exam types Be generally
PUBLIC DISCLOSURE. September 3, 2013 COMMUNITY REINVESTMENT ACT PERFORMANCE EVALUATION. Farmers and Merchants Bank RSSD #
 PUBLIC DISCLOSURE September 3, 2013 COMMUNITY REINVESTMENT ACT PERFORMANCE EVALUATION Farmers and Merchants RSSD # 871769 302 Pine Avenue Long Beach, California 90802 Federal Reserve of San Francisco 101
PUBLIC DISCLOSURE COMMUNITY REINVESTMENT ACT PERFORMANCE EVALUATION
 PUBLIC DISCLOSURE July 24, 2017 COMMUNITY REINVESTMENT ACT PERFORMANCE EVALUATION First Financial Bank, National Association Charter Number 4166 400 Pine Street Abilene, TX 79601 Office of the Comptroller
PUBLIC DISCLOSURE COMMUNITY REINVESTMENT ACT PERFORMANCE EVALUATION
 PUBLIC DISCLOSURE COMMUNITY REINVESTMENT ACT PERFORMANCE EVALUATION RSSD No. 645317 473 Broadway 12866 Federal Reserve Bank of New York 33 Liberty Street New York, NY 10045 NOTE: This document is an evaluation
Lafayette, Louisiana August 5, 2013 PUBLIC DISCLOSURE. August 5, 2013 COMMUNITY REINVESTMENT ACT PERFORMANCE EVALUATION
 Iberia CRA Public Evaluation Lafayette, Louisiana August 5, 2013 PUBLIC DISCLOSURE August 5, 2013 COMMUNITY REINVESTMENT ACT PERFORMANCE EVALUATION IBERIABANK RSSD ID NUMBER: 808176 Lafayette, Louisiana
COMMUNITY REINVESTMENT ACT PERFORMANCE EVALUATION
 PUBLIC DISCLOSURE Date of Evaluation: FEBRUARY 2, 2009 COMMUNITY REINVESTMENT ACT PERFORMANCE EVALUATION Name of Depository Institution: SUSQUEHANNA BANK Institution s Identification Number: 682611 Address:
PUBLIC DISCLOSURE COMMUNITY REINVESTMENT ACT PERFORMANCE EVALUATION
 PUBLIC DISCLOSURE September 6, 2016 COMMUNITY REINVESTMENT ACT PERFORMANCE EVALUATION Valley National Bank Charter Number 15790 615 Main Avenue Passaic, NJ 07055 Office of the Comptroller of the Currency
PUBLIC DISCLOSURE COMMUNITY REINVESTMENT ACT PERFORMANCE EVALUATION
 PUBLIC DISCLOSURE October 29, 2007 COMMUNITY REINVESTMENT ACT PERFORMANCE EVALUATION First Financial Bank RSSD# 48374 214 North Washington El Dorado, Arkansas 71730 Federal Reserve Bank of St. Louis P.O.
CRA PERFORMANCE EVALUATION
 THE CRA PUBLIC FILE CHINO COMMERCIAL BANK CRA PERFORMANCE EVALUATION The Community Reinvestment Act regulation requires each financial institution to include in the public file a copy of the public section
PUBLIC DISCLOSURE. May 9, 2005 COMMUNITY REINVESTMENT ACT PERFORMANCE EVALUATION COMMUNITY BANK & TRUST RSSD #
 PUBLIC DISCLOSURE May 9, 2005 COMMUNITY REINVESTMENT ACT PERFORMANCE EVALUATION COMMUNITY BANK & TRUST RSSD # 957757 100 SOUTH WOOD STREET, P.O. BOX 400 NEOSHO, MISSOURI 64850-1819 Federal Reserve Bank
COMMUNITY REINVESTMENT ACT PERFORMANCE EVALUATION
 PUBLIC DISCLOSURE August 23, 1999 COMMUNITY REINVESTMENT ACT PERFORMANCE EVALUATION Bank of Cairo and Moberly RSSD# 833646 27 E. Rollins Street Moberly, Missouri 6527-2 Federal Reserve Bank of St. Louis
PUBLIC DISCLOSURE. January 20, 2009 COMMUNITY REINVESTMENT ACT PERFORMANCE EVALUATION. Heritage Bank of Commerce RSSD #
 PUBLIC DISCLOSURE January 20, 2009 COMMUNITY REINVESTMENT ACT PERFORMANCE EVALUATION Heritage Bank of Commerce RSSD #2209553 150 Almaden Boulevard San Jose, California 95113 Federal Reserve Bank of San
PUBLIC DISCLOSURE COMMUNITY REINVESTMENT ACT PERFORMANCE EVALUATION
 PUBLIC DISCLOSURE October 27, 2003 COMMUNITY REINVESTMENT ACT PERFORMANCE EVALUATION First Financial Bank RSSD #48374 214 North Washington El Dorado, Arkansas 71730 Federal Reserve Bank of St. Louis P.O.
COMMUNITY REINVESTMENT ACT PERFORMANCE EVALUATION
 PUBLIC DISCLOSURE May 18, 2009 COMMUNITY REINVESTMENT ACT PERFORMANCE EVALUATION RSSD No. 645317 473 Broadway Saratoga Springs, New York 12866 Federal Reserve Bank of New York 33 Liberty Street New York,
PUBLIC DISCLOSURE COMMUNITY REINVESTMENT ACT PERFORMANCE EVALUATION
 PUBLIC DISCLOSURE September 17, 2007 COMMUNITY REINVESTMENT ACT PERFORMANCE EVALUATION Belgrade State Bank RSSD #761244 410 Main Street Belgrade, Missouri 63622 Federal Reserve Bank of St. Louis P.O. Box
PUBLIC DISCLOSURE COMMUNITY REINVESTMENT ACT PERFORMANCE EVALUATION
 PUBLIC DISCLOSURE March 2, 2015 COMMUNITY REINVESTMENT ACT PERFORMANCE EVALUATION Stifel Bank and Trust RSSD# 3076248 501 North Broadway St. Louis, Missouri 63102 Federal Reserve Bank of St. Louis P.O.
PUBLIC DISCLOSURE. September 4, 2001 COMMUNITY REINVESTMENT ACT PERFORMANCE EVALUATION CITIZENS BANK OF EDMOND RSSD#
 PUBLIC DISCLOSURE COMMUNITY REINVESTMENT ACT PERFORMANCE EVALUATION CITIZENS BANK OF EDMOND RSSD# 172457 ONE EAST 1 st STREET, P.O. BOX 30 EDMOND, OKLAHOMA 73034 Federal Reserve Bank of Kansas City 925
PUBLIC DISCLOSURE COMMUNITY REINVESTMENT ACT PERFORMANCE EVALUATION
 PUBLIC DISCLOSURE April 13, 1998 COMMUNITY REINVESTMENT ACT PERFORMANCE EVALUATION Arab American Bank 02-36-5490 52 East 52nd Street New York, New York 10022 Federal Reserve Bank of New York 33 Liberty
COMMUNITY REINVESTMENT ACT PERFORMANCE EVALUATION
 PUBLIC DISCLOSURE May 21, 2001 COMMUNITY REINVESTMENT ACT PERFORMANCE EVALUATION Arvest Bank RSSD# 970242 201 West Walnut Street Rogers, Arkansas 72757 Federal Reserve Bank of St. Louis P.O. Box 442 St.
PUBLIC DISCLOSURE. April 2, 2007 COMMUNITY REINVESTMENT ACT PERFORMANCE EVALUATION. Four Oaks Bank & Trust Company U.S.
 PUBLIC DISCLOSURE April 2, 2007 COMMUNITY REINVESTMENT ACT PERFORMANCE EVALUATION Four Oaks Bank & Trust Company 292524 6144 U.S. Highway 301 South Four Oaks, North Carolina 27524 Federal Reserve Bank
PUBLIC DISCLOSURE. December 4, 2006 COMMUNITY REINVESTMENT ACT PERFORMANCE EVALUATION. 101 North Main Street Logan, Utah 84321
 PUBLIC DISCLOSURE December 4, 2006 COMMUNITY REINVESTMENT ACT PERFORMANCE EVALUATION Cache Valley Bank RSSD #995076 101 North Main Street Logan, Utah 84321 Federal Reserve Bank of San Francisco 101 Market
PUBLIC DISCLOSURE COMMUNITY REINVESTMENT ACT PERFORMANCE EVALUATION
 PUBLIC DISCLOSURE COMMUNITY REINVESTMENT ACT PERFORMANCE EVALUATION RSSD No. 176101 212 Dolson Avenue 10940 FEDERAL RESERVE BANK OF NEW YORK 33 LIBERTY STREET NEW YORK, NY 10045 NOTE: This document is
PUBLIC DISCLOSURE COMMUNITY REINVESTMENT ACT PERFORMANCE EVALUATION
 PUBLIC DISCLOSURE July 1, 2013 COMMUNITY REINVESTMENT ACT PERFORMANCE EVALUATION Whitaker Bank, Incorporated RSSD# 1445943 2001 Pleasant Ridge Drive Lexington, Kentucky Federal Reserve Bank of Cleveland
PUBLIC DISCLOSURE COMMUNITY REINVESTMENT ACT PERFORMANCE EVALUATION
 PUBLIC DISCLOSURE June 14, 2004 COMMUNITY REINVESTMENT ACT PERFORMANCE EVALUATION Manufacturers and Traders Trust Company RSSD No. 501105 One M&T Plaza Buffalo, New York 14203 Federal Reserve Bank of New
PUBLIC DISCLOSURE COMMUNITY REINVESTMENT ACT PERFORMANCE EVALUATION
 PUBLIC DISCLOSURE December 6, 2010 COMMUNITY REINVESTMENT ACT PERFORMANCE EVALUATION Metamora State Bank RSSD #533227 120 East Main Street Metamora, Ohio 43540 Federal Reserve Bank of Cleveland P.O. Box
PUBLIC DISCLOSURE. October 11, 2011 COMMUNITY REINVESTMENT ACT PERFORMANCE EVALUATION. Pacific Premiere Bank RSSD #
 PUBLIC DISCLOSURE COMMUNITY REINVESTMENT ACT PERFORMANCE EVALUATION Pacific Premiere Bank RSSD # 431172 1600 Sunflower Avenue, 2 nd Floor 92626 Federal Reserve Bank of San Francisco 101 Market Street San
PUBLIC DISCLOSURE. June 22, 2009 COMMUNITY REINVESTMENT ACT PERFORMANCE EVALUATION. The Bank of Monroe. 39 Main Street. Union, West Virginia 24983
 PUBLIC DISCLOSURE June 22, 2009 COMMUNITY REINVESTMENT ACT PERFORMANCE EVALUATION The Bank of Monroe 849432 39 Main Street Union, West Virginia 24983 Federal Reserve Bank of Richmond P. O. Box 27622 Richmond,
COMMUNITY REINVESTMENT ACT PERFORMANCE EVALUATION
 PUBLIC DISCLOSURE February 26, 2001 COMMUNITY REINVESTMENT ACT PERFORMANCE EVALUATION Central Bank and Trust RSSD# 1821024 801 Technology Drive Little Rock, Arkansas 72221 Federal Reserve Bank of St. Louis
PUBLIC DISCLOSURE COMMUNITY REINVESTMENT ACT PERFORMANCE EVALUATION
 PUBLIC DISCLOSURE August 25, 2008 COMMUNITY REINVESTMENT ACT PERFORMANCE EVALUATION RSSD: 2747279 115 Third Street Marietta, Ohio 45750 Federal Reserve Bank of Cleveland P.O. Box 6387 Cleveland, OH 44101-1387
PUBLIC DISCLOSURE COMMUNITY REINVESTMENT ACT PERFORMANCE EVALUATION
 PUBLIC DISCLOSURE July 13, 2015 COMMUNITY REINVESTMENT ACT PERFORMANCE EVALUATION MUFG Union Bank, N.A. Charter Number: 21541 1251 Avenue of the Americas New York, NY 10020 Office of the Comptroller of
 Page 1 of 20 Advanced Search Search FDIC... Su Home Deposit Insurance Consumer Protection Industry Analysis Regulations & Examinations Asset Sales News & Events About FDIC Home > Regulation & Examinations
PUBLIC DISCLOSURE COMMUNITY REINVESTMENT ACT PERFORMANCE EVALUATION
 PUBLIC DISCLOSURE April 27, 2015 COMMUNITY REINVESTMENT ACT PERFORMANCE EVALUATION Banco Popular de Puerto Rico RSSD No. 940311 209 Munoz Rivera Avenue San Juan, Puerto Rico 00918 FEDERAL RESERVE BANK
GENERAL INFORMATION. INSTITUTION'S CRA RATING: This institution is rated "Satisfactory."
 GENERAL INFORMATION The Community Reinvestment Act (CRA) requires each federal financial supervisory agency to use its authority when examining financial institutions subject to its supervision, to assess
PUBLIC DISCLOSURE. March 14, 2005 COMMUNITY REINVESTMENT ACT PERFORMANCE EVALUATION. Placer Sierra Bank RSSD #33772
 PUBLIC DISCLOSURE March 14, 2005 COMMUNITY REINVESTMENT ACT PERFORMANCE EVALUATION Placer Sierra Bank RSSD #33772 649 Lincoln Way Auburn, California 95603 Federal Reserve Bank of San Francisco 101 Market
CRA Basics and the Exam Process
 CRA Basics and the Exam Process Objectives Upon completion of the CRA overview, you should understand: l Purpose of the CRA l Terms and definitions under the CRA regulation including bank exam types l
PUBLIC DISCLOSURE. January 23, 2006 COMMUNITY REINVESTMENT ACT PERFORMANCE EVALUATION GUARANTY BANK AND TRUST COMPANY RSSD#
 PUBLIC DISCLOSURE January 23, 2006 COMMUNITY REINVESTMENT ACT PERFORMANCE EVALUATION GUARANTY BANK AND TRUST COMPANY RSSD# 666657 1331 SEVENTEENTH STREET DENVER, COLORADO 80202 Federal Reserve Bank of
PUBLIC DISCLOSURE COMMUNITY REINVESTMENT ACT PERFORMANCE EVALUATION
 PUBLIC DISCLOSURE July 28, 2015 COMMUNITY REINVESTMENT ACT PERFORMANCE EVALUATION Bangor Savings Bank Certificate Number: 18408 3 State Street Bangor, Maine 04401 Federal Deposit Insurance Corporation