Monthly Economic Insight. Prepared by : TMB Analytic Date: 21 May 2018
|
|
|
- Lucas Randall
- 5 years ago
- Views:
Transcription
1 Monthly Economic Insight Prepared by : TMB Analytic Date: 21 May 2018
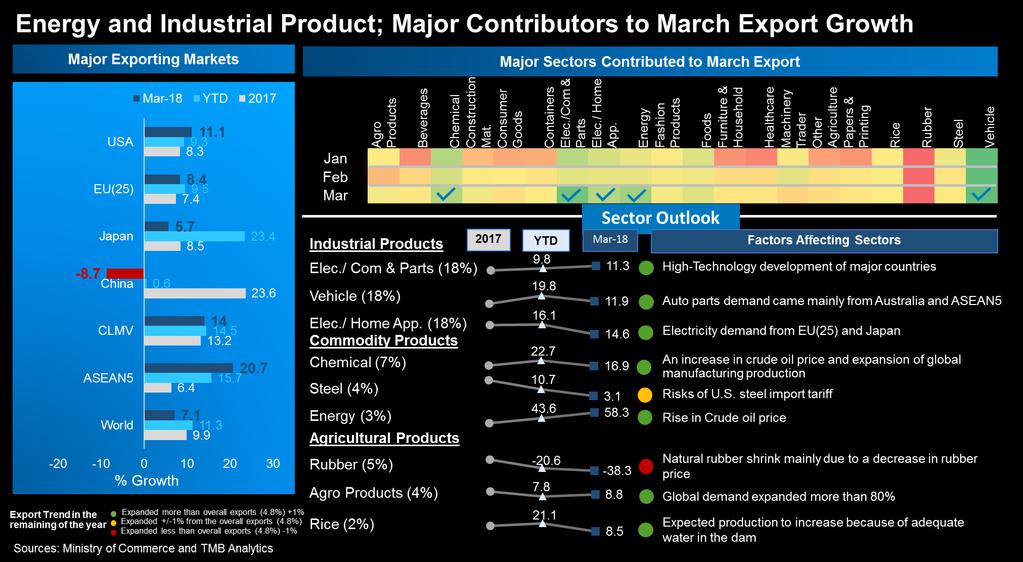
2 Executive Summary Synchronized global economic growth remain intact. However, some economies especially Eurozone members start to show some signs of slow-down in activities as reflected by negative economic surprise index. Moreover, trade tension between the US and China could possibly threaten global trade growth and affect global economy. Nevertheless, continual expansion in the US economy could lead to more tightening monetary from the Fed which raise a probability of 4 rate hikes. As a result, Fed s 4 rate hikes assumptions among some market participants could further drive bond yields such that UST-10Y yield could test 3% psychological level and potentially trigger foreign outflows again. In March, Thai economy continued to expand, driven mainly by solid growth of exports and service sector. Private consumption continued to expand especially from durable consumption and services, while private investment contracted strongly albeit elevated business sentiment. March exports expanded at slower pace of 7.1% due to high base of March 2017 export, which amounted to 22.4 bn USD. Only 33% of export growth driven by quantity. The major sectors contributed to export growth were energy and industrial products ( electronics/ computer & parts, electronics/ Home appliance, and vehicle). Exports to ASEAN5, CLMV, and USA registered 2-digit positive growth, whereas exports to China shrank 8.7%. However, US trade protectionism policies, (the restrictions on the importation of steel and aluminum) and US-China trade war may present risks to Thai exports. -1-
3 Executive Summary March MPI increased by 2.6%yoy with capacity utilization rate of 76.06%, it was mainly supported by domestic demand in car, sugar, medical & equipment, petroleum, plastics, meat and cooking oil. However, fashion product, jewelry, rubber product, seafood dropped due to slowdown in export. Foreign tourists increased by 15.4%yoy to 10.6 mil. with occupancy rate of 77% in Q1/2018. The key markets were China (+30.2%), Europe(+12.8%) and Asian (+8%) respectively. Thailand tourism confidence index was 101 point in Q1/2018 remained stable compared with the previous quarter. Because of tourism growth, the most entrepreneurs will increase target sales in the next quarter. April inflation rate was 1.1%. Price increase was from higher energy prices as well as recovering fresh food prices Inflation is expected to average at 1.1% as energy prices are expected to rise due to oil-supply disruptions and strong demand for oil. The GDP growth of the 1 st quarter of 2018 announced by NESDB was 4.8% yoy or 2.0% qoq (seasonally adjusted) driven by both domestic demand, namely private consumption and investment, as well as external demand, i.e. exports of goods and services. -2-
4 Executive Summary Year-to-date, Thai baht appreciated against the USD by almost 1.5% due to weak US dollar and hefty current account surplus (from exports of goods and services). Though, Thai baht recently depreciated above THB/USD due to strength in US dollar index and dollar-demands due to foreign outflows, concerns over US twin deficits (Trade deficit and Budget deficit), economic ramifications from global trade war and US political risk could keep suppressing the US dollar over medium to long term. Additionally, improved economic fundamental such as resilient economic growth, robust current account surplus among Asian economies should attract fund inflows further and boost Asian currencies strength against USD. Thai baht could reach THB/USD by the end of 2018 and could test 30 THB/USD mark, depending on how strong the fund inflow will be. However, financial market especially FX market could face increasing volatility environment from uncertainty over global trade policy as well as major central banks monetary policies which will gradually reduce liquidity in the market and trigger assets repricing. -3-
5 Global Economy
 9.3 4.0 9.6 8.")

6 Synchronized Global Recovery Boost Global Trade US EU GDP Growth (% YoY) Unemployment (%) Pre-Crisis Global Trade Value Trillion 30 USD Months forecast JP Months Actual JP F F 0 '08 '09 '16 '17 Source: Bloomberg, CEIC, IMF, World Bank and TMB Analytics -5-
7 US Trade Policy could Disrupt Global Economic Growth Trend United States Eurozone US trade protectionism could spark global trade war and create volatility in economic projection Inflation could edge toward Fed s target from wage growth, tight labor market and rises in commodities prices Economy is projected to expand 2.8% in 2018, higher from +2.3% in 2017 due to Tax cut policy and US spending plans Source: Bloomberg, IMF WEO, CEIC and TMB Analytics Latest Releases Activity 2.3% QoQ SAAR Real GDP 1Q18 Price 1.9% YoY SA Core PCE Mar 18 Labor Mkt 3.9% Unemployment Rate Apr 18 Inverted yields curve accurately predict previous 7 recessions 5.0 % Spread between UST-10Y and UST-3M US Recessions -2.0 Jan-67 Jan-77 Jan-87 Jan-97 Jan-07 Jan-17 UK economy expands without significant impacts from Brexit which could help BoE to hike rate this year Continual expansion among manufacturing and service sectors (PMI above 50) sustain EU s growth Growth in 2018 is expected to be around +2.3%, however, global trade protectionism could be a major risk for economic outlook Decreased Increased Unchanged EU Activity 2.5% YoY SWDA GDP 1Q18 UK Activity Industry -100 Citi Economic -150 Surprise Index -200 '07 '08 '09 '10 '11 '12 '13 '14 '15 '16 '17 '18 Latest Releases 1.2% YoY SWDA GDP 4Q EU Service PMI Apr 18 Slews of worse-than-expected data spark some concerns IFO German Business Climate From previous reading
8 Trade Tensions could Impact Economic Expansion in Asia Japan China Economy is likely to sustain above 1.0% expansion in 2018, however, trade protectionism could affect exports growth Inflation and consumer spending gradually improve which could prompt the Bank of Japan to reduce asset purchases program next year Strong yen could be a headwind for Exports and ongoing recovery Latest Releases Activity 1.6% QoQ SAAR Real GDP 4Q17 Price 1.1% YoY SA CPI Mar 18 Export +2.1% YoY NSA Mar 18 BoJ could taper their QQE as inflation moves toward 2% target 4.0 % GDP is likely to grow by 6.6% in 2018 where growth story could be altered from quantitative-focus to qualitative-focus Economic & financial reforms could prevent hard-landing and retain growth Nevertheless, trade rhetoric between the US and China which might not escalate to trade war but still negatively impact trade outlook Latest Releases Activity 6.8% YoY SWDA GDP 1Q18 Price 1.8% YoY CPI Apr 18 Industry Higher profits reflects higher producer prices 52.9 Caixin Serv. PMI Apr % 8.0 % Tax hike Japan Core CPI YoY BoJ s 2% target Japan CPI YoY -1.0 Jan-14 Jul-14 Jan-15 Jul-15 Jan-16 Jul-16 Jan-17 Jul-17 Jan-18 Source: Bloomberg, IMF WEO, CEIC and TMB Analytics Decreased Increased Unchanged 20 0 China Industrial Enterprises total profits YoY (LHS) China PPI YoY (RHS) -40 Jan-12 Jan-13 Jan-14 Jan-15 Jan-16 Jan-17 From previous reading
9 Warning Signs: Global Synchronized Slowdown? As All PMIs Drop Sharply EU manufacturing sector faces some headwind? Industry activities in Asia also start to slowdown US Mfg. PMI Japan Mfg. PMI EU Mfg. PMI Expansion Contraction China Mfg. PMI Mar-15 Sep-15 Mar-16 Sep-16 Mar-17 Sep-17 Mar-18 Activities in EU services sectors tank sharply US Services PMI EU Services PMI Expansion 50 Contraction 45 Mar-15 Sep-15 Mar-16 Sep-16 Mar-17 Sep-17 Mar-18 Source: Bloomberg, CEIC and TMB Analytics 45 Mar-15 Sep-15 Mar-16 Sep-16 Mar-17 Sep-17 Mar-18 Asia Services will eventually face contraction? China Services PMI Japan Services PMI 45 Mar-15 Sep-15 Mar-16 Sep-16 Mar-17 Sep-17 Mar-18-8-
10 Global Monetary Policy Tightening could Lead to Thai Market Liquidity Squeeze Central Banks Balance Sheet Trillion USD Fed s balance sheet expansion caused acceleration in Thai market liquidity BOJ s Balance Sheet Future balance sheet reductions will decelerate Thai market liquidity Trillion THB Thai Market Liquidity (Cumulative foreign net inflows) ECB s Balance Sheet Fed s Balance Sheet '08 '10 '12 '14 '16 '18 ' Source: Bloomberg, Fed, BoJ, ECB and TMB Analytics -9-


11 Why? No More CB s Money Via QE in 2019 FED Short-term rate: Fed Fund Dovish Hawkish 1H/2018 2H/2018 1H/ Rate Hike 1 Rate Hike 1 Rate Hike $ -20 bn $ -30 bn $ -40 bn $ -50 bn $ -50 bn B/S run-off ECB Short-term rate: Refin Rate Dovish Hawkish 0 Rate Hike 0 Rate Hike 0 Rate Hike Start QE Tapering *we expect 1 st hike in 2019 EUR 30 bn EUR 15 bn EUR 15 bn BOJ 0 Rate Hike 0 Rate Hike 0 Rate Hike Short-term rate: PR-Balances Dovish Hawkish Source: Bloomberg, Fed, BoJ, ECB, CEIC Bloomberg and and TMB Analytics JPY 80 Trillion / year JPY 80 Trillion / year JPY 40 Trillion / year -10-
12 When Central Banks Unplug Money Bonds Seem to be Unnerved 500 Index Trillion 16 USD 490 Global-Aggregate Bond Total Return Index (LHS) Fed+ECB+BOJ Balance Sheets (RHS) Jan-16 Jul-16 Jan-17 Jul-17 Jan-18 Source: Bloomberg and TMB Analytics
13 Tightening Liquidity and Bond Rout will Drive Yields Higher As UST-10Y Marches Near 3%... Sign of Trouble Ahead? Correlation Coefficient 100% 80% 60% 40% 20% Positive relationship between yield changes and stock returns When UST-10Y Yield below 4%, rising yield has been associated with rising stock prices Rolling 2-year correlation between all US Stock returns (Wilshire 5000 Index) and Change in UST-10Y yield 0% -20% -40% -60% -80% Negative relationship between yield changes and stock returns -100% UST-10Y Yield (%) Source: Bloomberg and TMB Analytics -12-

 LT Bonds Net Equity Foreign Flows Fading s")

14 Warning! Risk of Fund Flow Reversal and Volatile FX Market In 2017 Foreign fund continuously flew into Emerging market and Thailand What s about 2018? bn. THB Inflows to EM from unclear Trumponomics ST Bonds (TTM < 1y) LT Bonds Net Equity Foreign Flows Fading s Fed s Hike probability MPC HOLD rate 2018YTD Net Inflows = bn. THB Equity = bn. THB Bond = bn. THB Jan-17 Apr-17 Jul-17 Oct-17 Jan-18 Apr-18 Inflow Factors Outflow Factors Fund Flow 2018 Source: Bloomberg, CEIC and TMB Analytics GDP Robust Thai economy General Election Rate TARIFF CB s tightening monetary policies & 4x Fed Hikes Trade Protectionsim* -13-


15 Still More Demands for Thai Baht in FDI 10% Foreign net buy 10% EEC, BOI attract more investment Increasing EPS growth of listed firms & Excessive liquidity in the market 2018 Outlook Inflow Net Export Services 31% Continual expansion of Thai tourism Surplus Net Export Goods 15% No More Robust Trade Surplus Outflow Outflow Deficit TDI 22% Growing economy lures more investments from Thai firms Inflow Thai net buy 13% Brightening outlook of Foreign Investment Fund Industry Source: Bank of Thailand, CEIC and TMB Analytics -14-

16 Thai Baht is a New Safe Haven as Domestic Fundamentals Lessen External Impacts Trump started presidency term Sell USD Theme GDP Source: Bloomberg and TMB Analytics Fed hiked policy rate by 25bps Macron won French election Fading EU political risk ECB s unintentionally signal QE tapering? 17Q1 17Q2 17Q3 17Q4 Strong THB Factors Robust Thai economy Geopolitical Risks USDTHB 2017 VS ECB finally tapered QE and extended QE until Sep Fed Hikes in December 2017 & Tightening dollar liquidity TARIFF Fed 1 st hike of 2018 under Jerome Powell Fund inflows from improving economy The End of ECB s QE? 18Q Q2 Weak THB Factors CB s tightening monetary policies Pro-growth Trumponomics* & Trade Protectionism USDTHB Fed s rate hikes Continual fund inflows High C/A surplus Dollar liquidity squeeze US Political risk Q3 3 Hikes & Robust Thai Economy period-end 2018 Dollar Liquidity Squeeze fuels Baht selling 18Q4-15-
17 Warning! Tightening Interest Rate Gap Mean Decreasing Swap Points THB/USD 0.4 Swap Points = Forward Price Spot Price Swap point 3M Swap point 6M Repo rate - Fed Fund rate % TMBA forecasted negative swap point in May If RP > FFR => Positive Swap point -0.1 If RP < FFR => Negative Swap point Exporters favor Positive Swap point Importers favor Negative Swap Point '04 '05 '06 '07 '08 '09 '10 '11 '12 '13 '14 '15 '16 '17 ' Source: CEIC and TMB Analytics -16-

18 2018 Key Events to Keep Eyes On EU Political Uncertainty Trade Protectionism Trio-CBs* Ready to Tighten Policy Robust Thai Economic growth Likelihood Low Medium High Medium Severity* *Impact to financial market EM Fund Flows IN OUT OUT IN THB Bullish Bearish Source: TMB Analytics *Trio-CBs: the Fed, ECB, and BoJ -17-
19 Domestic Economy
20 Thailand s GDP 1Q18: +4.8%yoy, +2.0%qoq (sa) GDP Private C (51%) Private I (18%) Public C (15%) Q Index 14Q1 = 100, SA Non-durable Durable Services 200 Private Consumption Investment Public I (6%) Export Goods (58%) Export Services (19%) Import Goods (55%) Private-Construction Private-Equipment Public-Construction Public-Equipment External 145 Import Services (12%) %yoy ( ) indicates share to total GDP in 2017 Source: NESDB and TMB Analytics Ex-good Im-good Im-service Ex-service (RHS)
21 Significant Drop in Private Investment, Albeit Elevated Business Sentiment Robust Service and Durable Consumption Strong Contraction in Private Investment %yoy 20 Index Mar-16 Sep-16 Mar-17 Sep-17 Mar-18 Services Durable Cons Confidence (RHS) %yoy 5 Index Mar-16 Sep-16 Mar-17 Sep-17 Mar Private Investment Biz Sentiment (RHS) Farm Income Dropped Mainly from Price Effect %yoy Mar-16 Sep-16 Mar-17 Sep-17 Mar-18 Source: BOT and TMB Analytics Price Quantity Farm Income Private consumption continued to expand in almost every product type especially in service and durable consumption, while consumer confidence remained elevated. Farm income continued to be pushed down by depressing agricultural price due to strong production growth especially rubber and palm oil. Private investment faced the strongest contraction since 2016 mainly from drops in imports of capital goods and domestic machinery sales despite optimistic business sentiment. -20-
22 %YoY Thailand Industrial Outputs Continued to Grow Up Manufacturing Production Index 2018Q1 Petroluem Agricultural Machinery Autopart Healthcare Consumer Goods Vehicle Chemical Food Papers & Printing Electronic/Computer & Parts Steel Construction Material Packaging Electronic/Electric Home Appliance Rubber Product Furniture and Household Fashion Products Plastics Beverage Source: OIE and TMB Analytics Mar %YoY Q1/2018, MPI expanded by 3.9%yoy driven by petroleum, agri. machinery, vehicle and part, healthcare, consumer goods and chemical. MPI increased by 2.6%yoy with capacity utilization rate of 76.06% in March, it was mainly supported by domestic economy recovery Manufacturing Production Index (MPI) By Export Share March car, sugar, medical & equipment, petroleum, plastics, meat, cooking oil March MPI (Export 30-60%) MPI (Export < 30%) MPI (Export > 60%) fashion product, jewelry, rubber product, seafood Jan-17 Apr-17 Jul-17 Oct-17 Jan-18 Apr
, Europe(+12.8%) and Asian (+8%) respectively. Thailand tourism confidence index was 101 point in Q1/2018 remained stable compared with the previous quarter.")
23 No. Tourist Arrivals (Mil. person) (%) Occupancy Rate International Tourist Arrivals Still Gradually Increase Q1/2018, Foreign tourists increased by 15.4%yoy to 10.6 mil. with occupancy rate of 77%. The key markets were China (+30.2%), Europe(+12.8%) and Asian (+8%) respectively. Thailand tourism confidence index was 101 point in Q1/2018 remained stable compared with the previous quarter. Because of tourism growth, the most entrepreneurs will increase target sales in the next quarter. Foreign Tourist Arrivals Still Grown Up No. Foreign Tourists in 2018Q1 by Market (%YoY) unit: thousand persons (+30.2%) (+12.2%) (+8.0%) (+12.9%) (+16.1%) (+4.8%) (+3.4%) (-3.2%) Foreign Tourist Occupancy Rate Source: MOTS, The Tourism Council of Thailand and TMB Analytics -22-
24 Thai Export..Continuing Expand in All Major Markets and Products What is 2018 outlook for Thai Export? Markets China +8.0 ( ) CLMV +7.5 ( ) USA EU Japan +7.0 ( ) +5.5 ( ) +5.0 ( ) ASEAN ( ) Total +4.8 ( ) Continual economic growth supported by fundamental and high technological development Strong economic expansion Strong domestic consumption Recovery in household consumption and business Growth in domestic consumption and industrial production Continual economic and export growth from a raise in oil price Continuing Growth of trading partners Oil Price still affect on export growth Computer & Parts +6.5 ( ) +6.5 ( ) +6.0 ( ) Electricals Appliance Steel Chemical Rubber Food +6.0 ( ) +5.0 ( ) +5.0 ( ) Products Strong consumption supported by digital economy Solid expansion in global manufacturing production and major economies consumption Continued consumption growth from major trading partners Rising demand for tire mfg from China Expect better consumption, especially form EU and USA Sources: Ministry of Commerce and TMB Analytics -23-

25 Sources: Ministry of Commerce and TMB Analytics -24-
26 -25-

27 Sources: Ministry of Commerce and TMB Analytics -26-
 Furniture (7%) Footwear and Garments (3%) The color below represents Thai-China supply-chain products Total Export Value USD 26 bn US Exports to China Total")
 Rubber: Natural Rubber and Polymer Products (11%) Fashion Products: Jewelry(4%) Foods: Shrimp and Tuna (4%)")
 Chemical: Aromatics and Chemical Base (10%) Other Agriculture: Woods(6%) Note: ( ) represents share of total export value Sources: Trade Map, Ministry of Commerce and TMB")
28 US-China-Thailand Trade Relations China Exports to US Total Export Value USD 385 bn Electronic/ Computer & Parts: cell phone, computer parts, CPU (50%) Toys and Plastics Products (8%) Furniture (7%) Footwear and Garments (3%) The color below represents Thai-China supply-chain products Total Export Value USD 26 bn US Exports to China Total Export Value USD 130 bn Electrics and Electronics (21%) Aircraft (12%) Agricultural products (Fruit and beans) (10%) Total Export Value USD 29 bn Thai Exports to US Electronic/ Computer & Parts: Monitors, routers, HDD, printers, PC parts (48%) Rubber: Natural Rubber and Polymer Products (11%) Fashion Products: Jewelry(4%) Foods: Shrimp and Tuna (4%) Beverage: Vegetable & Fruit Juice (3%) Thai Exports to China Electronic/ Computer & Parts: IC, camera, LCD, computer parts (23%) Rubber: Natural Rubber and Polymer Products (20%) Chemical: Aromatics and Chemical Base (10%) Other Agriculture: Woods(6%) Note: ( ) represents share of total export value Sources: Trade Map, Ministry of Commerce and TMB Analytics -27-
29 1,333 Chinese products under proposed 25% of tariff US-China Trade War: Impact on Thai Exports China exports to US of Goods subject to proposed tariffs( about USD 50bn) Televisions (8528) Printers (8443) Electrical Circuit Apparatus(8536) Pumps (8413) Motor Vehicles (8703) Computers (8471) Heavy Machinery Parts (8431) Medical Instruments (9018) Semiconductors (8541) Rolled Aluminum (7606) US exports to China of Goods subjected to proposed tariffs ( about USD 53 bn) Actioned on128 US Goods (USD 3 bn) 25% on Pork products (0203,0206) and Aluminum scrap (7602) 15% on Fruit and nut products ( , 2204, 2207, 1211) and Steel piping (7304) Additional 106 US goods (USD 50 bn) 25% on 14 additional categories, including soybean, cars, chemicals, some type of aircraft and corn products. Sources: Ministry of Commerce and TMB Analytics Possible Exposure to Thai Exports from US-China Trade Wars Impact from US proposed 25% tariff on 1,333 Chinese products Key Major Affected Products HDD (37%) Electrical Machinery (17%) Electronic Office Equipment (16%) Industrial Machinery (9%) Consumer Electronics (6%) Electronic Parts (4%) Other Machinery (3%) Electrical Components & Equipment (2%) Note: (share%) is share of product under proposed of US 25% tariff exports to China Thailand could benefit from Thai pork products export to China (new exporting market). Current Existing Markets Hong Kong (42%) Laos (35%) Malaysia (14%) Myanmar (7%) There could be a trade opportunity for Thai exporter to ship more goods to US such as Electronic/ Computer & Parts (Monitors, routers, HDD, printers, PC parts), which amount to 48% of total Thai exports to US. -28-
30 Expect More Public Investment to Drive Growth In 1Q18, investment spending increased by 7% from the previous quarter due to speed-up disbursement measure and we expect over 70% of disbursement rate for FY2018. Stronger disbursement is expected for mega projects in the second-half of Y2018, supporting private sector confidence. Capital Budget Disbursement Capital Budget Disbursement Rate Billion THB % 6MFY18 Disbursed % FY17 Disbursed 10 Jan Feb Mar Apr May Jun Jul Aug Sep Oct Nov Dec Source: Fiscal Policy Office and TMB Analytics -29-
31 Policy Rate Normalization is Expected to Begin Later This Year Inflation Rate Reached BOT s Target for the First Time since Early 2017 Avg17 = 0.7% Apr18 = 1.1% April inflation rate was 1.1% due to energy price increase as well as recovering fresh food prices. It is the first time inflation hit BOT target since early As energy prices are expected to rise further due to oil-supply disruptions and stronger demand, inflation is expected to gradually rise and averaged at 1.1% this year. However, lower-than-expected fresh food prices could cause delay in inflation rate recovery. 1.5% Policy Rate is Expected in the First Half of 2018 to Accommodate Economic Recovery % We expect the rate normalization to begin later this year as global interest rate is on an upward trend following 3 fed rate hikes in 2017 and expected other 3 hikes this year. Thai policy rate is forecasted to increase to % at the end of However, there is still concern over recovery of private investment, which can delay Thai rate normalization. Source: MOC, BOT, CEIC and TMB Analytics -30-
32 THANK YOU Disclaimer This document is issued by TMB Analytics, a division of TMB Bank PCL. All analyses are based on information available to the public. Although the information contained herein is believed to be gathered from reliable sources, TMB makes no guarantee to its accuracy and completeness. TMB may have issued, and may in the future issue, other reports that are inconsistent with, and reach different conclusions from, the information presented in this report. Opinions or predictions expressed herein reflect the authors views, not that of TMB, as of date of the analysis and are subject to change without notice. TMB shall not be responsible for the use of contents and its implication.
Monthly Economic Insight
 Monthly Economic Insight Prepared by : TMB Analytics Date: 22 February 2018 Executive Summary Synchronized global economic growth continued to brighten global economic outlook and global trade outlook.
Monthly Economic Insight
 Monthly Economic Insight Prepared by : TMB Analytics Date: 21 March 2018 Executive Summary Synchronized global economic growth continued to brighten global economic outlook and global trade outlook. Globalwide
KASIKORNBANK. Investor Presentation. Monthly Economic Information By KASIKORN RESEARCH CENTER. June 2017
 KASIKORNBANK Investor Presentation Monthly Economic Information By KASIKORN RESEARCH CENTER June 7 For further information, please contact Investor Relations Unit or visit our website at www.kasikornbankgroup.com
Quarterly Economic Outlook: Quarter on 25 September 2018 Strong Economic Expansions amidst Uncertainty of Trade War
 Foregin Direct Investment (Billion USD) China U.S. Asia World Quarterly Economic Outlook: Quarter 3 2018 on 25 September 2018 Strong Economic Expansions amidst Uncertainty of Trade War Thai Economy: Thai
B-GUIDE: Economic Outlook
 Aug-12 Apr-13 Dec-13 Aug-14 Apr-15 Dec-15 Aug-16 Apr-17 Jul-15 Nov-15 Mar-16 Jul-16 Nov-16 Mar-17 Jul-17 Quarterly Economic Outlook: Quarter 4 2017 4 January 2018 B-GUIDE: Economic Outlook The economy
Oct 2017 = 20.0 Bn USD Ex. Gold = 19.9 Bn USD
 1 Sep = 21.9 Bn USD Ex. Gold = 20.6 Bn USD %YoY Oct = 20.0 Bn USD Ex. Gold = 19.9 Bn USD Share P P P H1 Q2 Q3 Sep Oct %MoM sa Agriculture 7.0-6.2 19.8 19.2 28.4 9.8 10.2-5.2 Fishery 1.0 15.1 6.5 10.4 11.5
Sep 2017 = 21.9 Bn USD Ex. Gold = 20.6 Bn USD. H1 H2 Q1 Q2 Q3 Aug Sep %MoM
 1 Aug = 21.0 Bn USD Ex. Gold = 20.0 Bn USD Source: Compiled from Customs Department s data P = Preliminary data Sep = 21.9 Bn USD Ex. Gold = 20.6 Bn USD P P Share %YoY P P H1 H2 Q1 Q2 Q3 Aug Sep %MoM sa
Nielsen s FMCG Index & Fuel Index Jan 2014 = 100 Jan 2014 = 100. Service Index* & Net Tourist Spending Index Jan 2014 = 100
 1 = Nielsen s FMCG Index & Fuel Index = = 115 105 95 85 Durable and Semi-durable Indices Nielsen s FMCG Index sa, 3mma Fuel Index, sa Fuel Index sa, 3mma (RHS) Semi-durable Index sa,3mma Durable Index
Jul 2018 = 20.3 Bn USD Ex. Gold = 20.1 Bn USD. H1 H2 H1 Q1 Q2 Jun Jul
 1 Jun = 21.8 Bn USD Ex. Gold = 21.3 Bn USD %YoY Export Value Source: Compiled from Customs Department s data P = Preliminary data = 20.3 Bn USD Ex. Gold = 20.1 Bn USD P P Share P P H1 H2 H1 Q1 Q2 Jun %MoM
Nielsen s FMCG Index & Fuel Index Jan 2014 = 100 Jan 2014 = 100. Service Index* & Net Tourist Spending Index Jan 2014 = 100
 1 = Nielsen s FMCG Index & Fuel Index = = 115 15 95 85 Durable and Semi-durable Indices Nielsen s FMCG Index sa, 3mma Fuel Index, sa Fuel Index sa, 3mma (RHS) Semi-durable Index sa,3mma Durable Index sa,
Jun 2018 = 21.8 Bn USD Ex. Gold = 21.3 Bn USD
 1 May = 22.3 Bn USD Ex. Gold = 21.9 Bn USD %YoY Source: Compiled from Customs Department s data P = Preliminary data Jun = 21.8 Bn USD Ex. Gold = 21.3 Bn USD P P Share P P H1 H2 H1 Q1 Q2 May Jun %MoM sa
2.1 Supply. Nominal Farm Income. Bank of Thailand, October 2017
 Bank of Thailand, October 2.1 Supply Farm income contracted from both decreased agricultural prices and output. Manufacturing production remained unchanged from the same period last year. The overall services
2.1 Supply. Nominal Farm Income. Bank of Thailand, November Real Farm Income
 Bank of Thailand, November 2.1 Supply Farm income contracted from both decreased agricultural prices and production. Manufacturing and services sector activities expanded from the same period last year.
Thailand Macroeconomic Assessment Bank of Thailand, June Jun. (%MoM) -0.3% -4.2% +1.3% (%) (%MoM)
 -0.3% -4.2% +1.3% (%) (%MoM)") Thailand Macroeconomic Assessment Bank of Thailand, June Farm income increased due mainly to higher farm prices while farm production remained low. Manufacturing production expanded slightly from the previous
Thailand Macroeconomic Assessment Bank of Thailand, June Farm income increased due mainly to higher farm prices while farm production remained low. Manufacturing production expanded slightly from the previous
Supply. Nominal Farm Income. Economic and Monetary Conditions, Febuary Real Farm Income. Manufacturing Production Index (MPI)
") Economic and Monetary Conditions, Febuary Supply Farm income continued to contract, attributed mainly to decreased agricultural prices which outweighed the expansion in agricultural production. Manufacturing
Economic and Monetary Conditions, Febuary Supply Farm income continued to contract, attributed mainly to decreased agricultural prices which outweighed the expansion in agricultural production. Manufacturing
Supply. Bank of Thailand, December Nominal Farm Income. Real Farm Income. Manufacturing Production Index (MPI)
") Bank of Thailand, December Supply Farm income continued to decline from decreased agricultural prices which outweighed the expansion in agricultural production Manufacturing production expanded from the
Bank of Thailand, December Supply Farm income continued to decline from decreased agricultural prices which outweighed the expansion in agricultural production Manufacturing production expanded from the
2.1 Supply. Economic and Monetary Conditions, July Nominal Farm Income. Real Farm Income
 Economic and Monetary Conditions, y 2.1 Supply Farm income expanded from the same period last year as supported mainly by increased agricultural production, while agricultural prices slightly contracted.
2.1 Supply. Bank of Thailand, January Nominal Farm Income. Manufacturing Production Index (MPI)
") Bank of Thailand, uary 2.1 Supply Farm income continually increased but concentrated in certain crops and regions. Service sector continued to expand, especially for tourism-related activities on the back
Bank of Thailand, uary 2.1 Supply Farm income continually increased but concentrated in certain crops and regions. Service sector continued to expand, especially for tourism-related activities on the back
Supply. Nominal Farm Income. Economic and Monetary Conditions, March Real Farm Income. Manufacturing Production Index (MPI)
") Economic and Monetary Conditions, March Supply Farm income continued to decline from the same period last year albeit at a decelerated rate, attributed mainly to decreased agricultural prices which outweighed
Economic and Monetary Conditions, March Supply Farm income continued to decline from the same period last year albeit at a decelerated rate, attributed mainly to decreased agricultural prices which outweighed
KBank Capital Markets Perspectives 29 February 2016
 KBank Capital Markets Perspectives 29 February 2016 Thailand Economic Monitor and BoT Forecast : March 2016 Thailand s economy steadied in February, though domestic demand decelerated slightly from January
2.1 Supply. Nominal Farm Income. Economic and Monetary Conditions, June Real Farm Income. Manufacturing Production Index (MPI)
") Economic and Monetary Conditions, June 2.1 Supply Farm income expanded from the same period last year as supported mainly by increased agricultural production, while agricultural prices continued to contract
Economic and Monetary Conditions, June 2.1 Supply Farm income expanded from the same period last year as supported mainly by increased agricultural production, while agricultural prices continued to contract
Economic Outlook Economic Intelligence Center 27 th November 2015
 Economic Outlook 2016 Economic Intelligence Center 27 th November 2015 Global outlook Domestic outlook 2 In 2016, recovery pace in most regions are expected to pick up except for China Eurozone 2.0 1.5
Global Equites declined from Concern over Trade War
 Quarterly Market Outlook: Quarter 2 2018 on 3 April 2018 Global Equites declined from Concern over Trade War Investment Outlook for 2 nd Quarter 2018 Equity Thailand U.S. Europe Japan Asia Bond Thailand
Key developments and outlook
 1/17 Key developments and outlook Economic growths in 2016 and 2017 remain close to the previous assessment. Better-than-expected merchandise exports and private consumption compensate for weaker-than-expected
Service Index* & Net Tourist Spending Index. Nielsen s FMCG Index & Fuel Index Jan 2014 = 100 Jan 2014 = 100. Durable and Semi-durable Indices
 1 Nielsen s FMCG Index & Fuel Index = = 115 15 95 85 = Durable and Semi-durable Indices Nielsen s FMCG Index sa, 3mma Fuel Index, sa Fuel Index sa, 3mma (RHS) Semi-durable Index sa,3mma Durable Index sa,
Nielsen s FMCG Index & Fuel Index Jan 2014 = 100 Jan 2014 = 100. Service Index* & Net Tourist Spending Index. Durable and Semi-durable Indices
 1 = Nielsen s FMCG Index & Fuel Index = = 115 15 95 Durable and Semi-durable Indices Nielsen s FMCG Index sa, 3mma Fuel Index, sa Fuel Index sa, 3mma (RHS) Semi-durable Index sa,3mma Durable Index sa,
Moderating External Trade Caused IPI to Hit 3-Month Low at 3%
 12 July 2018 ECONOMIC REVIEW May 2018 Industrial Production Index Moderating External Trade Caused IPI to Hit 3-Month Low at 3% IPI meets market estimates. Malaysia s industrial production expands by 3%yoy
Investor Presentation. December 2013
 Investor Presentation December 2013 24.02.2014 Table of Contents 1. Thai economy 2. Strengthening bank and client base 3. BBL s financial results Thai economy in 2014-2015 Thailand is facing short-term
Thailand Macroeconomic Assessment Bank of Thailand, October 2015
 Thailand Macroeconomic Assessment Bank of Thailand, October Agricultural output picked up from last month as rice harvesting was delayed to this month by rain. However, farm income was still affected by
Thai Economy in Q1/2014 and the Outlook for 2014
 Press Release 19 th May 2014 1 Thai Economy in Q1/2014 and the Outlook for 2014 Office of the National Economic and Social Development Board (NESDB) 2 Thai Economic Performance in Q1/2014 GDP Growth (%)
B-GUIDE: Market Outlook
 Quarterly Market Outlook: Quarter 1 2018 on 5 th January 2018 Investment Outlook for 1 st Quarter 2018 Accelerating Global Economy Supports the Rising Earnings Equity Thailand US Europe Japan Asia Bond
Macro Research Economic outlook
 Macro Research Economic outlook Macroeconomic Research Itaú Unibanco April 2017 Roadmap Global Economy The global outlook remains favorable Global growth positive momentum continues, with a synchronized
Nielsen s FMCG Index & Fuel Index Jan 2014 = 100 Jan 2014 = 100. Service Index* & Net Tourist Spending Index Jan 2014 = 100
 1 = Nielsen s FMCG Index & Fuel Index = = 115 15 95 85 Durable and Semi-durable Indices Nielsen s FMCG Index sa, 3mma Fuel Index, sa Fuel Index sa, 3mma (RHS) Semi-durable Index sa,3mma Durable Index sa,
Key developments and outlook
 1/22 Key developments and outlook Economic growth projection is revised up from a stronger recovery of exports. Meanwhile, government spending remains an important growth driver. Private spending gradually
Mexico Economic Outlook 3Q18. August 2018
 Mexico Economic Outlook 3Q18 August 2018 Key messages Global growth continues, but risks are intensifying. The economy grew 2.1% in the first half of the year. Downward bias in our growth forecast for
Macroeconomic Assessment. 30 April 2015
 Macroeconomic Assessment 30 April Source : Office of Agricultural Economics, calculated by Bank of Thailand Supply Side Policy Team Tel. 0 2283 6190 2 200 150 100 50 0 (%YoY) P = Preliminary Data H1 H2
Eurozone Economic Watch. July 2018
 Eurozone Economic Watch July 2018 Eurozone: A shift to more moderate growth with increased downward risks BBVA Research - Eurozone Economic Watch July 2018 / 2 Hard data improved in May but failed to recover
Leumi. Global Economics Monthly Review. Arie Tal, Research Economist. July 12, Capital Markets Division, Economics Department. leumiusa.
 Global Economics Monthly Review July 12, 2018 Arie Tal, Research Economist Capital Markets Division, Economics Department Leumi leumiusa.com Please see important disclaimer on the last page of this report
Key developments and outlook
 This Monetary Policy Report contains the information available as of June 19, 218 the day before the fourth Monetary Policy Committee meeting this year 1 / 24 Key developments and outlook The Thai economy
Zenith Monthly Economic Report October 2011
 Zenith Monthly Economic Report October 211 ECONOMIC STATISTICS SUMMARY Cash Rate Inflation Rate (%) Unemployment Rate (%) GDP Annual Growth (%) Country Latest Last Change Latest Change Latest Change Past
Economic and Monetary Conditions, December Economic and Monetary Conditions December 2018
 Economic and Monetary Conditions December Monetary Policy Group uary 2019 Content 1 Executive Summary 1 2 The Thai Economy 3 2.1 Supply 3 Agricultural sector Manufacturing sector Service sector Real Estate
The Forex Market in March 2007
 1 The Forex Market in March 2007 US Dollar : USD The US dollar in March continued to weaken from prior month compared with the euro and the yen with exchange rates averaging at US$ 1.3251 per euro and
considered by the MPC 2. Key developments to monitor for monetary policy going forward considered by the MPC 2. Key developments to monitor for
 1. Economic and inflation outlook considered by the MPC. Key developments to monitor for monetary policy going forward 1 1. Economic and inflation outlook considered by the MPC. Key developments to monitor
ECONOMIC OUTLOOK FINALLY, SYNCHRONIZED GLOBAL GROWTH
 ECONOMIC OUTLOOK FINALLY, SYNCHRONIZED GLOBAL GROWTH Augustine Faucher Chief Economist November 13, 2017 Senior Economic Advisor Chief Economist BETTER GROWTH THIS YEAR, AND AN UPGRADE TO 2018 World output,
Eurozone Economic Watch Higher growth forecasts for January 2018
 Eurozone Economic Watch Higher growth forecasts for 2018-19 January 2018 Eurozone Economic Watch January 2018 Eurozone: Higher growth forecasts for 2018-19 Our MICA-BBVA model estimates a broadly stable
Latin America Outlook. 1st QUARTER 2018
 Latin America Outlook 1st QUARTER Main messages 1. Strong global growth continues. Forecasts revised up in in most areas. Growth stabilizing in. 2. Growth recovers in Latin America, reaching close to potential
Flood Damage and Post-Flood Rehabilitation. Economic Performance in Q1/2012 and Outlook for 2012
 Presentation Outline 1 Flood Damage and Post-Flood Rehabilitation 2 Investment Plans of Strategic Committee for Reconstruction and Future Development 3 Economic Performance in Q1/2012 and Outlook for 2012
Asian Insights Third quarter 2016 Asia s commitment in policies and reforms
 Asian Insights Third quarter 2016 Asia s commitment in policies and reforms One of the commonalities between most Asian governments is the dedicated commitment they have in using policies and initiatives
Monthly Update of the ASEAN+3 Regional Economic Outlook (AREO)
") Monthly Update of the ASEAN+3 Regional Economic Outlook (AREO) Special Edition ASEAN+3 Macroeconomic Research Office (AMRO) Singapore January 2018 This Monthly Update of the AREO was prepared by the Regional
Monthly Update of the ASEAN+3 Regional Economic Outlook (AREO) Special Edition ASEAN+3 Macroeconomic Research Office (AMRO) Singapore January 2018 This Monthly Update of the AREO was prepared by the Regional
Economic Outlook. Thai Economic Performance in Q3 and Outlook for 2013 and 2014
 Thai Economic Performance in Q3 and Outlook for 2013 and 2014 Macroeconomic Strategy and Planning Office Press Release 9.30 a.m. November 18, 2013 Economic Projection for 2013 and 2014 2012 2013 Projection
NESDB ECONOMIC REPORT
 ECONOMIC REPORT Thai Economic Performance in Q3 and Outlook for 217-218 Press Release 9.3 a.m. Nov 2, 217 (%YoY) Economic Projection of 217-218 216 217 Projection Year Q2 Q3 217 218 GDP (CVM) 3.2 3.8 4.3
The Global Economic Crisis: Asia and the role of China Elliott School of International Affairs, George Washington University March 31, 2009
 The Global Economic Crisis: Asia and the role of China Elliott School of International Affairs, George Washington University March 31, 29 Anoop Singh Asia and Pacific Department IMF 1 Five key questions
Part. Situation and Economic Indicators of SMEs in 2012 and 2013
 Part 01 Situation and Economic Indicators of SMEs in 2012 and 2013 Chapter 1 + Gross Domestic Product of SMEs 1 Gross Domestic Product of SMEs The overall gross domestic product (GDP) of 2012 expanded
Asia Bond Monitor November 2018
 7 December 8 Key Developments in Asian Local Currency Markets T he monetary board of the Bangko Sentral ng Pilipinas decided to keep its key policy rates steady during its final meeting for the year on
Macro outlook March 2019
 Macro outlook 219 March 219 Asia: Brace, brace Asia has started to loose some steam of late PMI manufacturing orders (3 mma) 54 53 52 51 5 49 48 47 46 Dec-11 Aug-12 Apr-13 Dec-13 Aug-14 Apr-15 Dec-15 Aug-16
Monthly Economic Report
 Monthly Economic Report April 19, 2018 Copyright Mizuho Research Institute Ltd. All Rights Reserved. 1. The Japanese Economy: the business conditions DI deteriorated; FY2018 fixed investment plans were
NESDB ECONOMIC REPORT
 ECONOMIC REPORT Thai Economic Performance in Q1 and Outlook for 218 (%YoY) Economic Projection of 218 216 217 218 Year Year Year Q3 Q4 Q1 (f) GDP (CVM) 3.3 3.9 4.3 4. 4.8 4.2-4.7 GFCF 2.8.9 1.2.3 3.4 4.7
Investor Presentation. For 2017
 Investor Presentation For 2017 Bangkok Bank 1. Operating Environment 2. Our Key Focus and Position 3. Our Financial Result 2017 2 For 2018, global economic expansion is synchronous with rising global investment
Economic and Monetary Conditions, September Economic and Monetary Conditions September 2018
 Economic and Monetary Conditions September Monetary Policy Group October Content 1 Executive Summary 1 2 The Thai Economy 3 2.1 Supply 3 Agricultural sector Manufacturing sector Service sector Real estate
GLOBAL OUTLOOK ECONOMIC WATCH. July 2017
 GLOBAL OUTLOOK ECONOMIC WATCH July 2017 Positive global outlook, with projections revised across areas The global outlook remains positive. Our BBVA-GAIN model estimates global GDP growth at 1% QoQ in,
NESDB ECONOMIC REPORT
 ECONOMIC REPORT Thai Economic Performance in Q4 and 217 and Outlook for 218 Press Release 9.3 a.m. Feb 19, 218 (%YoY) Economic Projection of 218 216 217 Projection Year Year Q3 Q4 218 GDP (CVM) 3.3 3.9
Improved Macroeconomic Conditions Boost Consumer Sentiment to Its Highest Level in 3½-Year
 ECONOMIC REPORT Business & Consumer Confidence 17 April 2018 Improved Macroeconomic Conditions Boost Consumer Sentiment to Its Highest Level in 3½-Year MIER s CSI rebounded to 3.5-year high. Underpin by
MonitorING Turkey ING BANK A.Ş. Further fiscal support in the Medium Term Plan. Emerging Markets 4 October 2017
 q ING BANK A.Ş. ECONOMIC RESEARCH GROUP MonitorING Turkey October 17 Emerging Markets October 17 USD/TRY MonitorING Turkey Further fiscal support in the Medium Term Plan In 17, accelerated spending and
Growth and Inflation Prospects and Monetary Policy
 Growth and Inflation Prospects and Monetary Policy 1. Growth and Inflation Prospects and Monetary Policy The Thai economy expanded by slightly less than the previous projection due to weaker-than-anticipated
Economic Outlook. William Strauss Senior Economist and Economic Advisor Federal Reserve Bank of Chicago
 Economic Outlook CRF Credit & A/R Forum & EXPO Salt Lake City, UT October 23, 218 William Strauss Senior Economist and Economic Advisor Federal Reserve Bank of Chicago What I said In August The outlook
SEPTEMBER Overview
 Overview SEPTEMBER 214 Global growth. Global growth has been weaker than expected so far this year, as economic activity disappointed in a number of major countries in the first six months (Figure 1).
Economic activity gathers pace
 Produced by the Economic Research Unit October 2014 A quarterly analysis of trends in the Irish economy Economic activity gathers pace Positive data flow Recovery broadening out GDP growth revised up to
Edited Minutes of the Monetary Policy Committee Meeting (No. 2/2018) 28 March 2018, Bank of Thailand Publication Date: 11 April 2018
 28 March 2018, Bank of Thailand Publication Date: 11 April 2018") Edited Minutes of the Monetary Policy Committee Meeting (No. 2/2018) Members Present 28 March 2018, Bank of Thailand Publication Date: 11 April 2018 Veerathai Santiprabhob (Chairman), Mathee Supapongse
Edited Minutes of the Monetary Policy Committee Meeting (No. 2/2018) Members Present 28 March 2018, Bank of Thailand Publication Date: 11 April 2018 Veerathai Santiprabhob (Chairman), Mathee Supapongse
The Korean Economy: Resilience amid Turbulence
 The Korean Economy: Resilience amid Turbulence Dr. Il SaKong Special Economic Advisor Adviser to the President Republic of Korea November 17, 17, 2008 November 17, 2008 1. Recent Macroeconomic Developments
Thailand. Yield Movements. 126 Asia Bond Monitor
 126 Asia Bond Monitor Thailand Yield Movements Thailand s local currency (LCY) government bond yields rose across all tenors between 31 August and 15 October (Figure 1). Double-digit increases in yields
AsianBondsOnline WEEKLY DEBT HIGHLIGHTS
 AsianBondsOnline WEEKLY 9 January 7 asianbondsonline.adb.org Key Developments in Asian Local Currency Markets Consumer price inflation in Indonesia eased to.% year-on-year (y-o-y) in December from.6% y-o-y
Economic Monthly ASEAN & India
 Economic Monthly ASEAN & India AKI FUKUCHI ECONOMIC RESEARCH OFFICE TOKYO YUMA TSUCHIYA ECONOMIC RESEARCH OFFICE SINGAPORE APRIL 8 (ORIGINAL JAPANESE VERSION RELEASED ON APRIL 8) MUFG Bank, Ltd. A member
World Bank Thailand Economic Monitor November Press Launch November 4, 2009
 World Bank Thailand Economic Monitor November 2009 Press Launch November 4, 2009 overview The Thai economy is rebounding from a rocky first half of 2009, but the medium-term outlook is uncertain. The Thai
All the BRICs dampening world trade in 2015
 Aug Weekly Economic Briefing Emerging Markets All the BRICs dampening world trade in World trade in has been hit by an unexpectedly sharp drag from the very largest emerging economies. The weakness in
BNM Maintains OPR at 3.25%, Hawkish About Economic Outlook
 7 March 2018 ECONOMIC REVIEW March 2018 BNM MPC BNM Maintains OPR at 3.25%, Hawkish About Economic Outlook Overnight Policy Rate maintained at 3.25%. In line with our expectation, overnight policy rate,
Europe Outlook. Third Quarter 2015
 Europe Outlook Third Quarter 2015 Main messages 1 2 3 4 5 Moderation of global growth and slowdown in emerging economies, with downside risks The recovery continues in the eurozone, but still marked by
Eurozone Economic Watch. February 2018
 Eurozone Economic Watch February 2018 Eurozone: Strong growth continues in 1Q18, but confidence seems to peak GDP growth moderated slightly in, but there was an upward revision to previous quarters. Available
The Greek economy comes out of recession much more gradually than anticipated, while structural weaknesses inhibit growth.
 ISSUE 23 15 May 2017 INDEX Main indicators 3 Economic climate 4 Employment, prices, wages 5 Industry, trade, services 6 Exports, tourism 7 European Commission s spring forecasts for Greece (European Commission,
Three-speed recovery. GDP growth. Percent Emerging and developing economies. World
 Three-speed recovery GDP growth Percent 1 8 6 4 2-2 -4-6 198 1985 199 1995 2 25 21 215 Source: IMF WEO; Milken Institute. Emerging and developing economies Advanced economies World Output is still below
Leumi. Global Economics Monthly Review. Arie Tal, Research Economist. May 8, The Finance Division, Economics Department. leumiusa.
 Global Economics Monthly Review May 8, 2018 Arie Tal, Research Economist The Finance Division, Economics Department Leumi leumiusa.com Please see important disclaimer on the last page of this report Key
Year in review Summary
 Summary Canadian equities declined in 2018 and underperformed their global peers in Canadian dollar terms. U.S. equities also corrected as the risk of slowing pace of economic expansion, higher interest
Bualuang Exclusive Investment Outlook. March 2017
 Bualuang Exclusive Investment Outlook March 2017 1 Theme: Trump support global equities Positive Risk Many countries return to stimulate economies. Many government will increase spending and support economy.
APPENDIX ECONOMIC INDICATORS DEVELOPED ECONOMIES
 16 QUARTERLY INVESTMENT STRATEGY APPENDIX ECONOMIC INDICATORS DEVELOPED ECONOMIES Purchasing Managers Index EMERGING ECONOMIES Purchasing Managers Index US Eurozone Japan Brazil Russia India China Industrial
L-1 Part 2 Introduction to Indonesia Case Study
 L-1 Part 2 Introduction to Indonesia Case Study IMF Singapore Regional Training Institute OT 18.52 Macroeconomic Diagnostics February 26 March 2, 2018 Presenter Stephan Danninger This training material
Q QUARTERLY PERSPECTIVES
 Q2-219 QUARTERLY PERSPECTIVES Tavistock Wealth - Investment Team Outlook Christopher Peel - John Leiper - Andrew Pottie - Sekar Indran - Alex Livingstone India Turnbull - Jonah Levy - James Peel Welcome
Implementation of Pheu Thai Party Policy Key to Thailand s Success
 Analyst Tan Xuan +6631179 tanx@phillip.com.sg 14 Jul 211 Implementation of Pheu Thai Party Policy Key to Thailand s Success Executive Summary Bright spot in private consumption to be supported by rising
Investor Presentation. For 3Q18
 Investor Presentation For 3Q18 Bangkok Bank 1. Operating Environment 2. Our Key Focus and Position 3. Our Financial Result 3Q18 2 For 2018, global economic expansion remains solid However, the outlook
Investor Presentation. For 2016
 Investor Presentation For 216 Bangkok Bank 1. Operating Environment 2. Our Financial Results 216 3. Bangkok Bank s Position 4. Our Key Focus & Strategy 2 The Thai Economy: Steady Trend of Moderate Recovery
Key Economic Challenges in Japan and Asia. Changyong Rhee IMF Asia and Pacific Department February
 Key Economic Challenges in Japan and Asia Changyong Rhee IMF Asia and Pacific Department February 2017 1 Global and Asia Outlook 2 Global activity strengthening, with rising dispersion and uncertainty
Key takeaways. What it may mean for investors WEEKLY GUIDANCE ON ECONOMIC AND GEOPOLITICAL EVENTS. Veronica Willis Investment Strategy Analyst
 Veronica Willis Investment Strategy Analyst WEEKLY GUIDANCE ON ECONOMIC AND GEOPOLITICAL EVENTS May 8, 2018 Monetary Policy Divergence Could Last a Little Longer Key takeaways» Recent economic improvement
Japan: The impact of QQE2
 JP: The impact of QQE2 7 November 214 Economics Japan: The impact of QQE2 DBS Group Research 7 November 214 The BOJ will expand its quantitative and qualitative (QQE) program The yen has fallen and the
Indonesia Economic Outlook and Policy Challenges
 Indonesia Economic Outlook and Policy Challenges Daniel A. Citrin Asia and Pacific Department, IMF April 3, 28 Global Financial Stability Map: risks have risen; conditions have deteriorated October 27
Inflation Remains Tepid in November at 0.2% as Transport Cost Trending Downward
 19 December 2018 ECONOMIC REVIEW November 2018 Consumer Price Index Inflation Remains Tepid in November at 0.2% as Transport Cost Trending Downward Headline inflation back to near 4-year low. Consumer
FY2018, FY2019 Economic Outlook - Despite slower growth in 2019, the economy should remain firm. Keep a close eye upon the rise of uncertainties -
 Summary FY2018, FY2019 Economic Outlook - Despite slower growth in 2019, the economy should remain firm. Keep a close eye upon the rise of uncertainties - November 15, 2018 Copyright Mizuho Research Institute
NESDB ECONOMIC REPORT
 ECONOMIC REPORT Thai Economic Performance in Q4 and 2016 and Outlook for 2017 Macroeconomic Strategy and Planning Office Press Release 9.30 a.m. February 20, 2017 Economic Projection of 2017 (%YoY) 2015
AUGUST 2018 Summary growth remains above trend, but risks a concern
 EMBARGOED UNTIL: 11.3AM THURSDAY 1 AUGT 1 THE FORWARD VIEW GLOBAL AUGT 1 Summary growth remains above trend, but risks a concern As expected, after hitting a soft patch in Q1, major advanced economy growth
Global Investment Outlook & Strategy
 PRUDENTIAL INTERNATIONAL INVESTMENTS ADVISERS, LLC. Global Investment Outlook & Strategy March 2017 Global Stock Markets Rally likely to Continue, Driven by Strong Earnings & Strengthening GDP Growth.
Malaysia Bond Flows Update
 Malaysia Bond Flows Update Foreign net selloff lower in August, foreign buying to increase on improving fundamentals Economics Kenanga Investment Bank Berhad T: 603-2172 0880 OVERVIEW Foreign selloff moderated.
Investor Presentation. For 2017
 Investor Presentation For 2017 Bangkok Bank 1. Operating Environment 2. Our Key Focus and Position 3. Our Financial Result 2017 2 For 2018, global economic expansion is synchronous with rising global investment
Market Insight Economy and Asset Classes December Oil Prices Downtrending: The Real Global Economic Stimulus
 Market Insight Economy and Asset Classes December 2014 Oil Prices Downtrending: The Real Global Economic Stimulus 2 Equities Markets Feature In Citi analysts view, the expansion phase the US are enjoying