BUENA VISTA INVESTMENT MANAGEMENT
|
|
|
- Marlene Justina Walsh
- 5 years ago
- Views:
Transcription

1 BUENA VISTA INVESTMENT MANAGEMENT FOURTH QUARTER 2015 FINANCIAL MARKET REVIEW Buena Vista Investment Management LLC P.O. Box rd Street South Wisconsin Rapids, WI buenavistainv@buenavistainv.com
2 BUENA VISTA INVESTMENT MANAGEMENT FOURTH QUARTER 2015 THE STOCK MARKET
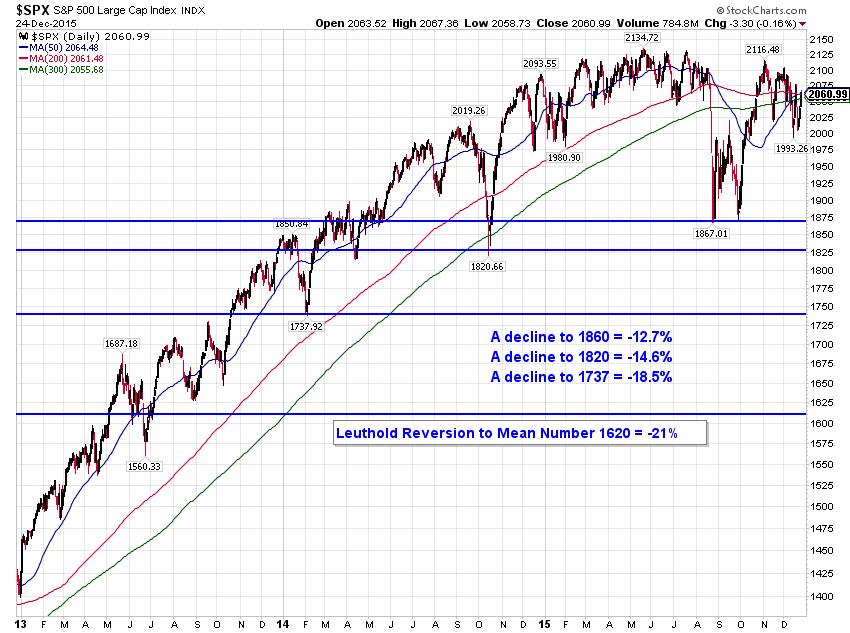
3 Disclosures The strategic investment tools listed below are used by Buena Vista Investment Management to assist in its investment process. The tools are primarily used in the formulation of asset allocation decisions relating to the allocation between equity investments and risk free money market investments. The tools are focused on intermediate to long term market trends and do not forecast shortterm movements. Do not rely on these tools to make investment decisions. December 24, 2015 Leuthold Major Trend Index Neutral 0.89 (as of Dec3mber 18th) The index status is considered to be positive, neutral or negative based on its underlying components. A reading above 1.05 is considered positive, between 0.95 and 1.05 is considered neutral and a reading below 0.95 is negative. The Leuthold Major Trend Index is considered by Buena Vista Investment Management to be a leading indicator. Investech Negative Leadership Composite Negative Selling Vacuum +0 Bearish Distribution 100 The Composite has two components: 1) Selling Vacuum (Bullish) A reading of +20 is considered very bullish and may signal the start of a new bull market. Readings of above zero signals an ongoing bullish stock environment; and 2) Distribution (Bearish) A reading below zero is considered to be bearish. The Investech Negative Leadership Composite is considered by Buena Vista Investment Management to be a leading indicator. Buena Vista Conservative Buy/Sell Discipline Negative 5 S&P POINTS / 0% To Sell The Buena Vista Conservative Buy/Sell Discipline utilizes the 300 day moving average of the S&P 500 stock index as a trigger for longterm buy and sell decisions. The discipline is either Bullish or Bearish depending on the relationship of the moving average and the index. The Buena Vista Conservative Buy/Sell Discipline is considered by Buena Vista Investment Management to be a lagging indicator.
4 HISTORIC DATA FOR STRATEGIC INVESTMENT TOOLS BUENA VISTA LEUTHOLD INVESTECH CONSERVATIVE MAJOR TREND NEGATIVE LEADERSHIP BUY/SELL DATE INDEX COMPOSITE DISCIPLINE December 24, 2015 Negative +0/ 100 Negative 5 points / 0% To Sell December 18, Negative +0/ 100 Negative 0 points / 0% To Sell December 11, Negative +0/ 97 Negative 0 points / 0% To Sell December 4, Neutral +0/ 71 Negative 40 points / 1.91% To Sell November 27, Neutral +0/ 78 Negative 42 points / 2.00% To Sell November 20, Neutral +0/ 80 Negative 42 points / 2.01% To Sell November 13, Neutral +0/ 75 Negative 0 points / 0% To Sell November 6, Neutral +0/ 75 Negative 54 points / 2.57% To Sell October 30, Neutral +0/ 92 Negative 36 points / 1.73% To Sell October 23, Negative +0/ 100 Negative 34 points / 1.63% To Sell October 16, Negative +0/ 100 Negative 0 points / 0% Negative October 9, Negative +0/ 100 Negative 0 points / 0% Negative October 2, Negative +0/ 100 Negative 0 points / 0% Negative September 25, Negative +0/ 100 Negative 0 points / 0% Negative September 18, Negative +0/ 100 Negative 0 points / 0% Negative September 11, Negative +0/ 100 Negative 0 points / 0% Negative September 4, Negative +0/ 100 Negative 0 points / 0% Negative August 28, Negative +0/ 100 Negative 0 points / 0% Negative August 21, Negative +0/ 100 Negative 0 points / 0% Negative August 14, Negative +0/ 100 Negative 53 points / 2.53% To Sell August 7, Negative +0/ 100 Negative 42 points / 2.02% To Sell July 31, Neutral +0/ 100 Negative 71 points / 3.37% To Sell July 24, Neutral +1/ 82 Negative 51 points / 2.45% To Sell July 17, Neutral +1/ 44 Negative 97 points / 4.57% To Sell July 10, Neutral +4/ 46 Negative 55 points / 2.64% To Sell July 2, Neutral +6/ 23 Negative 58 points / 2.79% To Sell
5
6 S&P 500 valuation measures GTM U.S. 5 Equities S&P 500 Index: Forward P/E ratio 26x 24x 22x Valuation measure Description Latest 25-year avg.* Std. dev. over/undervalued P/E Forward P/E 16.4x 15.7x 0.2 CAPE Shiller s P/E Div. Yield Dividend yield 2.0% 2.1% 0.1 P/B Price to book P/CF Price to cash flow x +1 Std. dev.: 19.0x EY Spread EY minus Baa yield 1.3% -0.6% x Current: 16.4x 16x Average: 15.7x 14x 12x -1 Std. dev.: 12.4x 10x 8x '90 '92 '94 '96 '98 '00 '02 '04 '06 '08 '10 '12 '14 5 Source: FactSet, FRB, Robert Shiller, Standard & Poor s, J.P. Morgan Asset Management. Price to Earnings is price divided by consensus analyst estimates of earnings per share for the next 12 months. Shiller s P/E uses trailing 10-years of inflation adjusted earnings as reported by companies. Dividend Yield is calculated as the trailing 12-month average dividend divided by price. Price to Book Ratio is the price divided by book value per share. Price to Cash Flow is price divided by NTM cash flow. EY Minus Baa Yield is the forward earnings yield (consensus analyst estimates of EPS over the next 12 months divided by price) minus the Moody s Baa seasoned corporate bond yield. Std. dev. over/undervalued is calculated using the average and standard deviation over 25-years for each measure. *P/CF is a 20-year avg. due to cash flow data availability. Guide to the Markets U.S. Data are as of June 30, 2015.
7 Corporate profits and leverage GTM U.S. 7 Equities S&P 500 earnings per share Index quarterly operating earnings $34 S&P consensus analyst estimates $29 $24 1Q15*: $25.81 Profit margins 11% S&P 500 operating EPS % of sales per share** 10% After-tax, adj. corp. profits, % of GDP 9% 8% 7% 6% 1Q15*: 9.4% 1Q15: 8.0% 5% $19 $14 $9 4% '60 '65 '70 '75 '80 '85 '90 '95 '00 '05 '10 '15 Total leverage S&P 500, ratio of total debt to total equity, quarterly 220% 200% 180% $4 -$1 '01 '02 '03 '04 '05 '06 '07 '08 '09 '10 '11 '12 '13 '14 '15 160% 140% 120% 100% 80% Average: 161% '96 '98 '00 '02 '04 '06 '08 '10 '12 '14 Source: BEA, Compustat, FactSet, Standard & Poor s, J.P. Morgan Asset Management. EPS levels are based on operating earnings per share. *Most recently available data is 1Q15 which is a Standard & Poor s estimate. Future earnings estimates are Standard & Poor s consensus analyst expectations. **S&P 500 Operating EPS % of Sales per Share fell to 0% in 4Q2008 and is adjusted on the chart. Past performance is not indicative of future returns. Guide to the Markets U.S. Data are as of June 30, Q15: 105% 7
8 BUENA VISTA INVESTMENT MANAGEMENT FOURTH QUARTER 2015 EMPLOYMENT
9 Unemployment and wages GTM U.S. 24 Civilian unemployment rate and year-over-year growth in wages of production and non-supervisory workers Seasonally adjusted, percent 12% Economy 10% 8% Unemployment Oct. 2009: 10.0% 6% 50-yr. average: 6.1% 4% 50-yr. average: 4.3% Jun. 2015: 5.3% 2% 0% Wage growth '70 '80 '90 '00 '10 Jun. 2015: 1.9% Source: BLS, FactSet, J.P. Morgan Asset Management.. Guide to the Markets U.S. Data are as of June 30,
10 Labor market perspectives GTM U.S. 25 Employment Total private payroll Total job gain/loss, thousands Labor force participation rate 68% 67% 66% Economy mm jobs lost 12.4mm jobs gained 65% 64% 63% Jun. 2015: 62.6% 62% '90 '92 '94 '96 '98 '00 '02 '04 '06 '08 '10 '12 '14 Net job creation since Feb Millions of jobs ,000 '06 '07 '08 '09 '10 '11 '12 '13 '14-1 Info. Fin & Bus. Svcs. Mfg. Trade & Trans. Leisure, Hospt. & Other Svcs. Edu. & Health Svcs. Mining & Construct. Gov't Source: BLS, FactSet, J.P. Morgan Asset Management. Guide to the Markets U.S. Data are as of June 30,
11 BUENA VISTA INVESTMENT MANAGEMENT FOURTH QUARTER 2015 ENERGY & THE DOLLAR
12 Energy: Supply, demand and prices GTM U.S. 29 Change in production and consumption of oil Production, consumption and inventories, million barrels per day Price of oil Brent crude, nominal prices, USD/barrel Production * 2016* Growth since 2013 $160 $140 Jun. 2008: $ Economy U.S % OPEC % Other % Global % $120 $100 Jun. 2014: $ Consumption $80 U.S % Europe % $60 Japan % China % Other % Global % $40 $20 Dec. 2008: $39.53 Jan. 2015: $48.40 Jun. 2015: $61.18 Inventory Change Source: EIA, IMF, FactSet, J.P. Morgan Asset Management. Brent crude are monthly averages in USD using global spot ICE prices. *Forecasts are from the April 2015 EIA Short-Term Energy Outlook and start in Guide to the Markets U.S. Data are as of June 30, $0 '96 '98 '00 '02 '04 '06 '08 '10 '12 '14 29
13 $USD us DoI<Ir ndex _ CM h Settle (EOO) ICE High ""."" ", ", "." " '"," "'l' StockO,",.<om,~ ' M,ro ' M,. Ic linton Administration I IBUSh Administration I '" '" Db.m. Administration 1015 ' 00 IReg.n Administration I 03 (14 OIl OIl 07 OQ
14 Trade and the U.S. dollar GTM U.S. 28 Economy Trade balance Current account balance, % of GDP -7% -6% -5% 4Q05: -6.3% U.S. Dollar Index Monthly avg. of major currencies nominal trade-weighted index % 95 Jun. 2015: % 1Q15: -2.6% Mar. 2009: % % 0% '96 '98 '00 '02 '04 '06 '08 '10 '12 ' Mar. 2008: 70.3 Aug. 2011: 69.0 '96 '98 '00 '02 '04 '06 '08 '10 '12 '14 Source: BEA, Federal Reserve, FactSet, J.P. Morgan Asset Management. Currencies in the Trade Weighted U.S. Dollar Major Currencies Index are: British Pound, Euro, Swedish Kroner, Australian Dollar, Canadian Dollar, Japanese Yen, and Swiss Franc. Guide to the Markets U.S. Data are as of June 30,
15 BUENA VISTA INVESTMENT MANAGEMENT FOURTH QUARTER 2015 INTEREST RATES
16 0,1"'" 00' $UST2Y 2_ Yo", US TroMC<Y YieO:i (EOO) '"OX 24S.,_201O - $UST2Y (o. H,) 0,6]0 0,4100 Open OU O High OU O Low OU O Close OU O 0,'200 0,''''',-. StockO' '''.<om Chg _0.= (_4.20") ~ - ---lo.s70 0,8200 '-SW O.S20 0= ono W,.= ono OU O 0= 0."20 0= = = O ~ O ~ W , = 0= W 0,2100 0, = = 0.170
17
18 BUENA VISTA INVESTMENT MANAGEMENT FOURTH QUARTER 2015 ECONOMIC GROWTH
19 Economic growth and the composition of GDP GTM U.S. 18 Real GDP Year-over-year % change 10% Real GDP 1Q15 Components of GDP 1Q15 nominal GDP, USD trillions $19 3.3% Housing 8% YoY % chg: 2.9% QoQ % chg: -0.2% $ % Investment ex-housing Economy 6% 4% Average: 2.9% $15 $13 $ % Gov t spending 2% $9 0% -2% Expansion average: 2.2% $7 $5 68.5% Consumption $3-4% $1-6% '70 '75 '80 '85 '90 '95 '00 '05 '10 '15 -$1-3.2% Net exports Source: BEA, FactSet, J.P. Morgan Asset Management. Values may not sum to 100% due to rounding. Quarter over quarter percent changes are at an annualized rate. Average represents the annualized growth rate for the full period. Expansion average refers to the period starting in the second quarter of Guide to the Markets U.S. Data are as of June 30,
20 Consumer finances GTM U.S. 19 Economy Consumer balance sheet 1Q15, trillions of dollars outstanding, not seasonally adjusted $100 $90 $80 $70 $60 Total Assets: $99.1tn Homes: 24% Other tangible: 6% Deposits: 9% 3Q- 07 Peak: $82.0tn 1Q- 09 Low: $69.1tn Household debt service ratio Debt payments as % of disposable personal income, SA 14% 13% 12% 11% 10% 1Q80: 10.6% 4Q07: 13.2% 2Q15**: 9.9% 9% '80 '85 '90 '95 '00 '05 '10 '15 $50 $40 $30 $20 Pension funds: 21% Other financial assets: 39% Other non-revolving: 1% Revolving*: 6% Auto loans: 7% Other liabilities: 9% Student debt: 10% Total liabilities: $14.2tn Household net worth Not seasonally adjusted, USD billions $90,000 $80,000 $70,000 $60,000 $50,000 $40,000 2Q07: $67,866 2Q15**: $85,772 $10 $0 Mortgages: 68% $30,000 $20,000 $10,000 '90 '92 '94 '96 '98 '00 '02 '04 '06 '08 '10 '12 '14 Source: BEA, FactSet, FRB, J.P. Morgan Asset Management. Data include households and nonprofit organizations.sa seasonally adjusted. *Revolving includes credit cards. **1Q15 household debt service ratio and 1Q15 household net worth are J.P. Morgan Asset Management estimates. Values may not sum to 100% due to rounding. Guide to the Markets U.S. Data are as of June 30,
21 Consumer confidence and the stock market GTM U.S. 31 Consumer Sentiment Index University of Michigan Economy Aug % Impact on Consumer Sentiment from a 10% y-o-y rise in gasoline prices 10% y-o-y rise in home prices 10% y-o-y rise in the S&P 500 1% y-o-y rise in the unemployment rate May % Mar % -1.4 pts Jan % Jan % Jan % Jun. 2015: Average: Mar % Oct % Feb % May % Oct % Sentiment cycle low and subsequent 12-month S&P 500 Index return Nov % Aug % 40 '72 '74 '76 '78 '80 '82 '84 '86 '88 '90 '92 '94 '96 '98 '00 '02 '04 '06 '08 '10 '12 '14 Source: Standard & Poor s, University of Michigan, FactSet, J.P. Morgan Asset Management. Peak is defined as the highest index value before a series of lower lows, while a trough is defined as the lowest index value before a series of higher highs. Subsequent 12-month S&P 500 returns are price returns only, which excludes dividends. Impact on consumer sentiment is based on a multivariate monthly regression between 1/31/2000 5/31/2015. Guide to the Markets U.S. Data are as of June 30,
22 Cyclical sectors GTM U.S. 20 Economy Light vehicle sales Millions, seasonally adjusted annual rate Average: 15.3 Jun. 2015: 17.2 '96 '98 '00 '02 '04 '06 '08 '10 '12 '14 Manufacturing and trade inventories Days of sales, seasonally adjusted Apr. 2015: 41.4 '96 '98 '00 '02 '04 '06 '08 '10 '12 '14 Housing starts Thousands, seasonally adjusted annual rate 2,400 2,000 1,600 Real capital goods orders Non-defense capital goods orders ex. aircraft, USD billions, SA $70 $65 $60 1, Average: 1,337 May 2015: 1,036 0 $40 '96 '98 '00 '02 '04 '06 '08 '10 '12 '14 '95 '97 '99 '01 '03 '05 '07 '09 '11 '13 '15 Source: BEA, Census Bureau, FactSet, J.P. Morgan Asset Management. SA seasonally adjusted. Capital goods orders deflated using the producer price index for capital goods with a base year of Guide to the Markets U.S. Data are as of June 30, $55 $50 $45 Average: 56.5 May 2015:
23 Residential real estate GTM U.S. 21 Home prices Indexed to 100, seasonally adjusted 115 Housing Affordability Index Avg. mortgage payment as a % of household income 40% Economy Case Shiller 20-city FHFA purchase only Average existing home 35% 30% 25% 20% 15% Average: 19.7% May 2015: 12.2% % '75 '78 '81 '84 '87 '90 '93 '96 '99 '02 '05 '08 '11 '14 Lending standards for approved mortgage loans Average FICO score based on origination date Jun. 2015: '05 '06 '07 '08 '09 '10 '11 '12 '13 ' '04 '05 '06 '07 '08 '09 '10 '11 '12 '13 '14 '15 Sources: (Left) National Association of Realtors, Standard & Poor s, FHFA, FactSet, J.P. Morgan Asset Management. (Top right) Census Bureau, J.P. Morgan Asset Management. Monthly mortgage payment assumes the prevailing 30-year fixed-rate mortgage rates and average new home prices excluding a 20% down payment. (Bottom Right) McDash, J.P. Morgan Securitized Product Research, J.P. Morgan Asset Management. Guide to the Markets U.S. Data are as of June 30,
 Net Int.: $229bn (6%) Non-defense disc.")
24 Federal finances GTM U.S. 23 The 2015 federal budget CBO Baseline forecast, USD trillions $4.0 Federal budget surplus/deficit % of GDP, , 2015 CBO Baseline -12% Forecast Economy $3.5 $3.0 $2.5 $2.0 $1.5 $1.0 $0.5 Total Spending: $3.7tn Other $619bn (17%) Net Int.: $229bn (6%) Non-defense disc.: $536bn (15%) Defense: $586bn (16%) Social Security: $738bn (20%) Medicare & Medicaid: $969bn (26%) Borrowing: $486bn (13%) Other: $302bn (8%) Social insurance: $1,056bn (29%) Corp.: $328bn (9%) Income: $1,506bn (41%) -10% -8% -6% -4% -2% 0% 2% 4% 120% 100% 80% 60% 40% 2015: -2.7% '90 '95 '00 '05 '10 '15 '20 '25 Federal net debt (accumulated deficits) % of GDP, , 2015 CBO Baseline, end of fiscal year 2015: 74.2% Forecast 2025: 77.1% $0.0 Total Government Spending Sources of Financing 20% '40 '48 '56 '64 '72 '80 '88 '96 '04 '12 '20 Source: U.S. Treasury, BEA, CBO, St. Louis Fed, J.P. Morgan Asset Management Federal Budget is based on the CBO s March 2015 Baseline Budget Forecast. Other spending includes, but is not limited to, health insurance subsidies, income security, and federal civilian and military retirement. Note: Years shown are fiscal years (Oct. 1 through Sep. 30) numbers are CBO estimates as of March Guide to the Markets U.S. Data are as of June 30,


25 Voya Global Perspectives World Economy Gross Domestic Product (GDP) Global economic growth has more than doubled in the last 11 years driven by growth in emerging and developing economies. Fundamentals % of World GDP 2003 $38.1 Trillion 2008 $56.8Trillion 2014 $77.6Trillion Advanced Economies 80% 72% 61% Emerging and Developing Economies 20% 28% 39% Advanced economies: Comprised of 36 countries. Developing economies: Comprised of 153 countries. Source: International Monetary Fund (IMF) as of
26 Voya Global Perspectives Global Consumer Global household consumption of goods and services has increased 100% in the last decade but 95% of consumers reside outside the U.S. China is now the largest auto market in the world. Fundamentals Global Retail Sales Y/Y % Change Global Automobile Sales (Monthly Level Millions Annualized) U.S. Recession China Auto Sales 5 0 Great Britain Germany Greece Brazil Japan U.S. Auto Sales Global Retail Sales: Brazil, Germany and Japan as of 04/30/15; Greece as of 03/31/15; Great Britain as of 04/30/15. Global Automobile Sales: China auto as of 05/29/15; U.S. auto sales as of 05/29/15. Source: The World Bank, OICA, Factset 12
27 Voya Global Perspectives Developing Markets Drive Growth World GDP accelerated in the last decade, supported by the largest emerging markets, which now outproduce the largest developed economies, where generally higher debt levels hinder economic growth. Fundamentals World GDP 100 Gross Government Debt to GDP G7 $ Trillions % of GDP All Advanced Economies Emerging and Developing Economies Data as of 12/31/14. Source: IMF World Economic Outlook database Note: The G7 countries are comprised of the U.S., U.K., France, Germany, Italy, Canada and Japan 14
December 2014 FINANCIAL MARKET REVIEW
 December 2014 FINANCIAL MARKET REVIEW Buena Vista Investment Management LLC 241 Third Street South Wisconsin Rapids, WI 54494 715-422-0700 http://buenavistainv.com December 2014 Why Portfolios Remain Diversified
May 2015 FINANCIAL MARKET REVIEW
 May 2015 FINANCIAL MARKET REVIEW Buena Vista Investment Management LLC 241 Third Street South Wisconsin Rapids, WI 54494 715-422-0700 http://buenavistainv.com Volume 13 Issue 1 March 2015 MOVING TO A MORE
JPMorgan American Investment Trust plc Annual General Meeting. 13 May 2015
 JPMorgan American Investment Trust plc Annual General Meeting 13 May 2015 Agenda Performance Review Current Economic and Market Data Current Asset Allocation and Fund Structure 1 2014 Results NAV return
JPM US Equity Income Fund
 J.P. Morgan Asset Management Investment Summit 2016 JPM US Equity Income Fund HALF IMAGE PLACEMENT HOLDER (HORIZONTAL) Resize image to cover grey box Clare Hart, Managing Director, Portfolio Manager #JPMsummit
CAPITAL MARKETS REVIEW
 CAPITAL MARKETS REVIEW Reviewing the quarter ended June 30, 2017 Patrick H. Yanke, CFP 3737 Glenwood Ave, Ste 100 // Raleigh, NC 27612 800-513-2812 // patrick.yanke@yankefinancial.com // www.yankefinancial.com
2Q Commencement: A Guide to the Markets. David Kelly, Chief Global Strategist, JPMorgan Funds
 FOR INSTITUTIONAL USE ONLY NOT FOR PUBLIC DISTRIBUTION 2Q 2013 Commencement: A Guide to the Markets David Kelly, Chief Global Strategist, JPMorgan Funds Summary Even at new all-time highs the stock market
SHAMBLING FORWARD. 02/13/2014 WORLD POPULATION 2 WALL STREET, MAIN STREET, AND CAPITOL HILL: AN ECONOMIC UPDATE
 SHAMBLING FORWARD. WALL STREET, MAIN STREET, AND CAPITOL HILL: AN ECONOMIC UPDATE Shamble: To walk in an awkward, lazy, or unsteady manner, shuffling the feet FEBRUARY 12, 2014 David B. Hanson, CPA, CFA
As of December 31, Guide to the Markets
 1Q 2013 As of December 31, 2012 Guide to the Markets Table of Contents EQUITIES ECONOMY FIXED INCOME INTERNATIONAL ASSET CLASS 4 16 34 42 55 U.S. Market Strategy Team Dr. David P. Kelly, CFA david.p.kelly@jpmorgan.com
Economic Outlook June Economic Policy Division
 Economic Outlook June 215 Economic Policy Division U.S. GDP Actual and Potential Quarterly, Q1 198 to Q4 215 Real GDP Trillion 29 Dollars Log Scale $18. Forecast $15. $12.5 Actual Potential $9. $6.5 198
Solutions Conference Year End Global Economy & World Political Outlook Leon C. LaBrecque, JD, CPA, CFP, CFA RAIN IN EUROPE?
 Solutions Conference Year End 2014 Global Economy & World Political Outlook Leon C. LaBrecque, JD, CPA, CFP, CFA RAIN IN EUROPE? Global Equity Markets: Returns EAFE Return to Reach 2007 peak* EME Return
Economic Outlook June Economic Policy Division
 Economic Outlook June 215 Economic Policy Division U.S. GDP Actual and Potential Quarterly, Q1 198 to Q4 215 Real GDP Trillion 29 Dollars Log Scale $18. Forecast $15. $12.5 Actual Potential $9. $6.5 198
U.S. Chamber of Commerce Economic Outlook
 U.S. Chamber of Commerce Economic Outlook December 211 Economic Policy Division Real GDP Outlook Percent Change, Annual Rate 2 1 1 - -1 197 197 198 198 199 199 2 2 21 U.S. GDP Actual and Potential Quarterly,
There has been considerable discussion of the possibility
 NationalEconomicTrends February Housing and the R Word There has been considerable discussion of the possibility that ongoing troubles in the housing market could push the economy into recession 1 But
With the tax filing season in full swing, these summary
 NationalEconomicTrends March Income Taxes: Who Pays and How Much? With the tax filing season in full swing, these summary figures may provide some perspective on the issue of who is paying federal individual
The Federal Reserve has set the target range for the federal
 NationalEconomicTrends October Monetary Policy Stance: The View from Consumption Spending The Federal Reserve has set the target range for the federal funds at to 5 percent and intends to keep this near
The relatively slow growth of employment has
 NationalEconomicTrends August Please go to researchstlouisfedorg/publications/net for important information about your subscription Labor s Share The relatively slow growth of employment has been a prominent
Economic and Housing Outlook
 Economic and Housing Outlook Volusia Building Industry Association July 18, 218 Robert Dietz, Ph.D. NAHB Chief Economist Housing Market Growing; Single-Family Lags Tax reform changes Macroeconomics post-tax
Sharp declines in home prices, followed by a financial
 NationalEconomicTrends April Household Retrenchment Sharp declines in home prices, followed by a financial crisis and a steep recession, rattled US households in Economic misfortunes have caused many to
The First Phase of the U.S. Recovery and Beyond
 The First Phase of the U.S. Recovery and Beyond James Bullard President and CEO Federal Reserve Bank of St. Louis Global Interdependence Center Shanghai, China January 11, 2010 Any opinions expressed here
House prices in the United States were 14.1 percent
 NationalEconomicTrends August How Much Have US House Prices Fallen? House prices in the United States were 11 percent lower in the first quarter of than they were a year earlier, according to a widely
Real GDP Growth Compounded annual rates of change. Consumer Price Index Percent change
 National Economic Trends Real Gross Domestic Product (DISCONTINUED) Real GDP Growth Compounded annual rates of change 6 5 Compounded Annual Rate of Change 4 3 2 1-1 Q1 214 Q1 215 Q1 216 Q1 217 195 196
Economic and Market Outlook
 Economic and Market Outlook Third Quarter 2018 Investment Products: Not FDIC Insured No Bank Guarantee May Lose Value Past performance is no guarantee of future results. Financial term and index definitions
ECONOMIC AND MARKET COMMENTARY OUR MISSION
 ECONOMIC AND MARKET COMMENTARY OUR MISSION Smith Shellnut Wilson is a registered investment adviser* specializing in managing investment portfolios for banks, individuals, corporations, foundations and
The U.S. Economic Outlook
 The U.S. Economic Outlook Gering/Scottsbluff Economic Forum August 23, 216 George A. Kahn Vice President and Economist The views expressed are those of the author and do not necessarily reflect the opinions
Decline in Economic Activity Larger Than Advance GDP Estimate February 27, 2009
 Northern Trust Global Economic Research 5 South LaSalle Chicago, Illinois 663 northerntrust.com Asha G. Bangalore agb3@ntrs.com Decline in Economic Activity Larger Than Advance GDP Estimate February 27,
ECONOMIC AND FINANCIAL HIGHLIGHTS
 ECONOMIC AND FINANCIAL HIGHLIGHTS LABOR MARKET Contributions to Change in Nonfarm Payrolls 2 Unemployment and Labor Force Participation Rate 3 MANUFACTURING ISM Manufacturing Index 4 CONSUMERS Light Vehicle
MARKET INSIGHTS. Guide to the Markets. U.S. 2Q 2016 As of March 31, 2016
 MARKET INSIGHTS Guide to the Markets U.S. 2Q 2016 As of March 31, 2016 Global Market Insights Strategy Team GTM U.S. 2 Americas Europe Asia Dr. David P. Kelly, CFA New York Andrew D. Goldberg New York
MARKET INSIGHTS. Guide to the Markets. U.S. 4Q 2015 As of September 30, 2015
 MARKET INSIGHTS Guide to the Markets U.S. 4Q 2015 As of September 30, 2015 Global Market Insights Strategy Team GTM U.S. 2 Americas Europe Asia Dr. David P. Kelly, CFA New York Andrew D. Goldberg New York
THE ECONOMIC OUTLOOK RECESSION AND RECOVERY. Paul Darby Executive Director & Deuty Chief Economist Twitter hashtag: #psforum
 THE ECONOMIC OUTLOOK RECESSION AND RECOVERY Paul Darby Executive Director & Deuty Chief Economist Darby@conferenceboard.ca US OUTLOOK US recession is coming to an end Q3 likely to be positive due to inventory
MARKET INSIGHTS. Guide to the Markets. U.S. 1Q 2018 As of December 31, 2017
 MARKET INSIGHTS Guide to the Markets U.S. 1Q 2018 As of December 31, 2017 Global Market Insights Strategy Team 2 Dr. David Kelly, CFA New York Samantha Azzarello New York Alex Dryden, CFA New York David
2018 MACRO OVERVIEW. More of the Same, Yet Less of the Same. March 9, 2018
 2018 MACRO OVERVIEW More of the Same, Yet Less of the Same March 9, 2018 RICHARD FARR MERION CAPITAL GROUP 484-436-4764 rfarr@merioncapitalgroup.com Jan-04 Oct-04 Jul-05 Apr-06 Jan-07 Oct-07 Jul-08 Apr-09
U.S. Economic Update and Outlook. Laurel Graefe, REIN Director Federal Reserve Bank of Atlanta October 2, 2013
 1 U.S. Economic Update and Outlook Laurel Graefe, REIN Director Federal Reserve Bank of Atlanta October 2, 213 Following the deepest recession since the 193s, the economic recovery is well under way, though
MARKET INSIGHTS. Guide to the Markets. U.S. 3Q 2018 As of June 30, 2018
 MARKET INSIGHTS Guide to the Markets U.S. 3Q 2018 As of June 30, 2018 Global Market Insights Strategy Team 2 Dr. David Kelly, CFA New York David Lebovitz New York Dr. Cecelia Mundt New York Gabriela Santos
Welcome to the Guide to the Markets for the first quarter of 2018.
 FOR INSTITUTIONAL USE ONLY NOT FOR PUBLIC DISTRIBUTION MARKET INSIGHTS Guide to the Markets 1Q 2018 Welcome to the Guide to the Markets for the first quarter of 2018. MARKET INSIGHTS Guide to the Markets
MARKET INSIGHTS. Guide to the Markets. U.S. 1Q 2017 As of December 31, 2016
 MARKET INSIGHTS Guide to the Markets U.S. 1Q 2017 As of December 31, 2016 Global Market Insights Strategy Team 2 Americas Europe Asia Dr. David P. Kelly, CFA New York Anastasia V. Amoroso, CFA New York
THE SKINNY. CG s Market Commentary
 THE SKINNY CG s Market Commentary Third Quarter 2016 THE SKINNY Third Quarter 2016 U.S. EQUITY MARKETS ENDED SEPTEMBER WITH MIXED RESULTS. The Dow Jones Industrial Average posted a 0.41% loss for the month,
Damn the End of QE! Buy the Dollar and Treasurys!
 Damn the End of QE! Buy the Dollar and Treasurys! Dr. A. Gary Shilling President A. Gary Shilling & Company, Inc. A. Gary Shilling & Co., Inc. Economic Consultants Chart 1 Historic Inflation and Deflation
Economic and Market Outlook
 Economic and Market Outlook Fourth Quarter 2018 Investment Products: Not FDIC Insured No Bank Guarantee May Lose Value Past performance is no guarantee of future results. Financial term and index definitions
ECONOMIC & REVENUE UPDATE
 January 11, 2018 Summary summary The U.S. labor market gained 148,000 net new jobs in December. U.S. housing starts in November 2017 were 12.9% above their year-ago level. Consumer confidence declined
The chorus from Travis s 1947 song about the
 NationalEconomicTrends December 7 What Do You Get for Sixteen Tons? You load sixteen tons, and what do you get? Another day older and deeper in debt Merle Travis The chorus from Travis s 197 song about
In 2010, the first of the Baby Boom generation will
 NationalEconomicTrends September 7 Can Social Security Survive the Baby Boomers? In 1, the first of the Baby Boom generation will reach age Many will choose to begin what they hope will be a long and financially
MARKET INSIGHTS. Guide to the Markets. U.S. 2Q 2017 As of March 31, 2017
 MARKET INSIGHTS Guide to the Markets U.S. 2Q 2017 As of March 31, 2017 Global Market Insights Strategy Team 2 Americas Europe Asia Dr. David P. Kelly, CFA New York Julio C. Callegari São Paulo Samantha
The President s Report to the Board of Directors
 The President s Report to the Board of Directors April 4, 214 Current Economic Developments - April 4, 214 Data released since your last Directors' meeting show the economy was a bit stronger in the fourth
Moving On Up Today s Economic Environment
 Moving On Up Today s Economic Environment Presented by PFM Asset Management LLC Gray Lepley, Senior Analyst, Portfolio Strategies November 8, 2018 PFM 1 U.S. ECONOMY Today s Agenda MONETARY POLICY GEOPOLITICAL
On October 4, 2006, President Bush signed the
 NationalEconomicTrends December Political Economy of State Homeland Security Grants On October,, President Bush signed the Department of Homeland Security (DHS) Appro pri - ations Act for fiscal year 7
Modest Economic Growth and Falling GDP Gap
 Modest Economic Growth and Falling GDP Gap -. -. U.S. Economic Output (Real GDP - Quarterly Growth Rate).................................... : : : : : : : : : : -. -. -. -. -. -. -. -. -. -. -. -. -. -.
Nonfarm Payroll Employment
 PRESIDENT'S REPORT TO THE BOARD OF DIRECTORS, FEDERAL RESERVE BANK OF BOSTON Current Economic Developments - June 10, 2004 Data released since your last Directors' meeting show the economy continues to
Executive Cotton Update U.S. Macroeconomic Indicators & the Cotton Supply Chain
 Executive Cotton Update U.S. Macroeconomic Indicators & the Cotton Supply Chain May 2018 www.cottoninc.com Macroeconomic Overview: The International Monetary Fund (IMF) publishes comprehensive sets of
ECONOMIC AND FINANCIAL HIGHLIGHTS
 ECONOMIC AND FINANCIAL HIGHLIGHTS FEDERAL RESERVE BALANCE SHEET Assets and Liabilities 2-3 REAL ESTATE Construction Spending 4 CoreLogic Home Price Index 5 Mortgage Rates and Applications 6-7 CONSUMER
MARKET INSIGHTS. Guide to the Markets. U.S. 2Q 2018 As of March 31, 2018
 MARKET INSIGHTS Guide to the Markets U.S. 2Q 2018 As of March 31, 2018 Global Market Insights Strategy Team 2 Dr. David Kelly, CFA New York David Lebovitz New York Dr. Cecelia Mundt New York Gabriela Santos
Michigan Economic Update
 Michigan Economic Update Federal Reserve Bank of Chicago Detroit Branch October 30, 2015 Paul Traub Senior Business Economist The Midwest Economy declined to -0.15 in September while Michigan s contribution
Individual households and firms, as well as local, state,
 NationalEconomicTrends February 9 How Accu Are Forecasts in a Recession? Individual households and firms, as well as local, state, and federal governments, make economic decisions based on their view of
ECONOMIC OUTLOOK FINALLY, SYNCHRONIZED GLOBAL GROWTH
 ECONOMIC OUTLOOK FINALLY, SYNCHRONIZED GLOBAL GROWTH Augustine Faucher Chief Economist November 13, 2017 Senior Economic Advisor Chief Economist BETTER GROWTH THIS YEAR, AND AN UPGRADE TO 2018 World output,
Muhlenkamp & Company. Webcast November 30, Ron Muhlenkamp, Portfolio Manager Jeff Muhlenkamp, Portfolio Manager Tony Muhlenkamp, President
 Muhlenkamp & Company Webcast November 3, 217 Ron Muhlenkamp, Portfolio Manager Jeff Muhlenkamp, Portfolio Manager Tony Muhlenkamp, President Muhlenkamp & Company, Inc. Intelligent Investment Management
The U.S. Economic Outlook
 The U.S. Economic Outlook November, Economic Club of Sheboygan George A. Kahn Vice President and Economist Federal Reserve Bank of Kansas City Outlook themes Growth has rebounded following a soft first
2015 Market Review & Outlook. January 29, 2015
 2015 Market Review & Outlook January 29, 2015 Economic Outlook Jason O. Jackman, CFA President & Chief Investment Officer Percentage Interest Rates Unexpectedly Decline 4.5 10-Year Government Yield 4 3.5
B-GUIDE: Market Outlook
 Quarterly Market Outlook: Quarter 1 2018 on 5 th January 2018 Investment Outlook for 1 st Quarter 2018 Accelerating Global Economy Supports the Rising Earnings Equity Thailand US Europe Japan Asia Bond
The U.S. and Washington Area Economic Performance and Outlook
 // The U.S. and Washington Area Economic Performance and Outlook Center for Regional Analysis School of Public Policy George Mason University January, 3 Recession Recovery Patterns of GDP Past Four Recessions
How to Earn Double-Digit Returns While Avoiding Major Down Markets in a Safety-First Approach
 AAII Orange County Chapter Meeting Saturday April 27, 2013 How to Earn Double-Digit Returns While Avoiding Major Down Markets in a Safety-First Approach 9:00 10:30 Presentation 10:30 o 11:00 Q&A Today
Economic and Housing Outlook
 Economic and Housing Outlook Home Builders Association of Virginia June 22, 2018 Robert Dietz, Ph.D. NAHB Chief Economist Housing Market Growing; Single-Family Lags Tax reform changes Macroeconomics post-tax
The Economic & Financial Outlook
 The Economic & Financial Outlook James Marple Director & Senior Economist TD Economics May 3, 2018 Global Economies Break Pattern Of Serial Disappointment 4.0 World GDP, Year/Year % Change 3.9 3.8 3.7
Chart 1. U.S. Personal Saving Rate and Household Debt (consu plus mortgage) as a % of Disposable Personal Incom
 as a % of Disposable Personal Incom") Chart 1 U.S. Personal Saving Rate and Household Debt (consu plus mortgage) as a % of Disposable Personal Incom 16% 14% 12% 10% 8% 6% 4% Last Points 4Q 2015- Saving Rate, 5.4%; HH Debt, 1 140% 130% 120%
Chart 1 U.S. Personal Saving Rate and Household Debt (consu plus mortgage) as a % of Disposable Personal Incom 16% 14% 12% 10% 8% 6% 4% Last Points 4Q 2015- Saving Rate, 5.4%; HH Debt, 1 140% 130% 120%
Marquette Associates Market Environment
 M Marquette Associates Market Environment April 2010 U.S. Economy Fixed Income Markets U.S. Equity Markets International Equity Markets Hedge Fund Markets Real Estate Markets Private Equity and Hedge Fund
Economic Conditions and Outlook for the U.S. and Greater Kansas City Area
 Economic Conditions and Outlook for the U.S. and Greater Kansas City Area Mid-America Planned Giving Council Kansas City, MO January 9, 215 Kelly D. Edmiston Federal Reserve Bank of Kansas City Economic
Single-family home sales and construction are not expected to regain 2005 peaks
 Single-family home sales and construction are not expected to regain 25 peaks Millions of units 8. 7. 6. 5. Housing starts (right axis) 4. Home sales (left axis) 3. 2. 1. 198 1985 199 1995 2 25 21 215
THE CONFERENCE BOARD LEADING ECONOMIC INDEX (LEI) FOR FRANCE AND RELATED COMPOSITE ECONOMIC INDEXES FOR JANUARY
 FOR FRANCE AND RELATED COMPOSITE ECONOMIC INDEXES FOR JANUARY") FOR RELEASE: 10:00 A.M. CET, TUESDAY, MARCH 17, 2009 The Conference Board France Business Cycle Indicators SM THE CONFERENCE BOARD LEADING ECONOMIC INDEX (LEI) FOR FRANCE AND RELATED COMPOSITE ECONOMIC
FOR RELEASE: 10:00 A.M. CET, TUESDAY, MARCH 17, 2009 The Conference Board France Business Cycle Indicators SM THE CONFERENCE BOARD LEADING ECONOMIC INDEX (LEI) FOR FRANCE AND RELATED COMPOSITE ECONOMIC
Vermont Tax Seminar. Comments on the 2017 Economic Outlook Presentation to the. December 8, 2016
 Comments on the 2017 Economic Outlook Presentation to the Vermont Tax Seminar December 8, 2016 Jeffrey B. Carr President and Senior Economist Economic & Policy Resources, Inc. Now the 4 th Longest Up-Cycle
National Economic Indicators. May 7, 2018
 National Economic Indicators May 7, 18 Table of Contents GDP Release Date Latest Period Page Table: Real Gross Domestic Product Apr-7-18 8:31 Q1-18 Real Gross Domestic Product Apr-7-18 8:31 Q1-18 5 Decomposition
Since the financial crisis began in mid-2007, media
 NationalEconomicTrends August Commercial Bank Lending Data during the Crisis: Handle with Care Since the financial crisis began in mid-7, media sources and academics alike have scrutinized data from the
NationalEconomicTrends
 NationalEconomicTrends January 000 The Economic Outlook for 000: Bulls on Parade? The heartening U.S. economic performance during the past four years has seemingly benefited everyone except those in the
2008 Economic and Market Outlook
 Economic and Market Outlook Presented by: Gareth Watson Warren Jestin Vincent Delisle December 7 Economic Outlook Warren Jestin The Global Economic Landscape is Changing Rapidly Gears Down Emerging Powerhouses
Economic Outlook. Presented to IPMA Executive Seminar. Steve Lerch Chief Economist & Executive Director. September 25, 2012 Chelan, Washington
 Presented to IPMA Executive Seminar Steve Lerch Chief Economist & Executive Director Chelan, Washington WASHINGTON STATE ECONOMIC AND REVENUE FORECAST COUNCIL Summary The updated economic forecast is very
Recent Recent Developments 0
 Recent Developments 0 Global activity has slowed noticeably World Trade (annualized percent change of three month moving average over previous three month moving average) Purchasing Managers Index (PMI)
Global Themes and Risks
 The Goldman Sachs Group, Inc. Goldman Sachs Research Global Themes and Risks April 2013 Abby Joseph Cohen, CFA Goldman, Sachs & Co. 1-212-902-4095 abby.cohen@gs.com Rachel Siu Goldman, Sachs & Co. 1-212-357-0493
THE CONFERENCE BOARD LEADING ECONOMIC INDEX (LEI) FOR FRANCE AND RELATED COMPOSITE ECONOMIC INDEXES FOR FEBRUARY
 FOR FRANCE AND RELATED COMPOSITE ECONOMIC INDEXES FOR FEBRUARY") FOR RELEASE: 10:00 A.M. CET, WEDNESDAY, APRIL 22, 2009 The Conference Board France Business Cycle Indicators SM THE CONFERENCE BOARD LEADING ECONOMIC INDEX (LEI) FOR FRANCE AND RELATED COMPOSITE ECONOMIC
FOR RELEASE: 10:00 A.M. CET, WEDNESDAY, APRIL 22, 2009 The Conference Board France Business Cycle Indicators SM THE CONFERENCE BOARD LEADING ECONOMIC INDEX (LEI) FOR FRANCE AND RELATED COMPOSITE ECONOMIC
United States. Gross Domestic Product Percent change over year-ago level. Industrial Production Index, 2010=100. Unemployment Rate Percent
 United States Summary Indicators Gross Domestic Product Percent change over year-ago level Industrial Production Index, 2010=100 1.0 1.5 2.0 2.5 3.0 3.5 4.0 2.5 108 110 112 114 114.9 4.0 4.5 5.0 5.5 6.0
ctrends Nominal Vs. Real Wage Growth Growth of Wages Percent Change From Year Ago August 1997
 ctrends August 1997 Nominal Vs. Real Wage Growth Nominal wages, measured by nonfarm compensation per hour, grew at an average annual rate of 5.5 percent between 1947 and 1973 and 6 percent between 1973
In the past three decades, the share of foreign-born
 NationalEconomicTrends June New Views on Immigration In the past three decades, the share of foreign-born workers in US total employment has increased markedly, from percent in 197 to 1 percent in Among
NationalEconomicTrends
 NationalEconomicTrends January 00 Stag-nations Economic growth in the United States has slowed substantially since the days of rapid expansion during the mid to late 1990s. According to preliminary estimates,
Weekly Macroeconomic Review
 16/10/2012 Weekly Macroeconomic Review Expectations derived from the capital market Our forecast Inflation in the coming months Inflation through September 2013 CPI (average annual rate) Inflation through
AFTERSHOCKS. Benjamin Tal, Managing Director, Deputy-Chief Economist CIBC World Markets Inc. Will Investment in Renewable Energy Follow Oil Prices?
 , Managing Director, Deputy-Chief Economist CIBC World Markets Inc 67 th Annual Tax Conference 67e Conférence fiscale annuelle 2 Will Investment in Renewable Energy Follow Oil Prices? Source: UNEB, CIBC
The effect that housing has on the economy has received
 NationalEconomicTrends May Boom & Gloom in Housing Markets: The Sequel The effect that housing has on the economy has received increased attention in recent years first for the recordhigh boom in house
Data current as of: April 4, % 10.0% 8.0% 6.0% 4.0% 2.0% 250, , , ,000 50, , , , , ,000
 Forecast current as of: January 213 Economic Indicators U.S. unemployment decreased to 7.7% in February from 7.9% last month, as nonfarm payroll employment increased by 236,. In the previous 3 months,
U.S. and Regional Economic Conditions and Outlook
 U.S. and Regional Economic Conditions and Outlook CFA Society of Nebraska Omaha, NE January 14, 215 Kelly D. Edmiston Federal Reserve Bank of Kansas City Outline Structure and Role of the Federal Reserve
Three-speed recovery. GDP growth. Percent Emerging and developing economies. World
 Three-speed recovery GDP growth Percent 1 8 6 4 2-2 -4-6 198 1985 199 1995 2 25 21 215 Source: IMF WEO; Milken Institute. Emerging and developing economies Advanced economies World Output is still below
Snapshot of SA Economy
 Snapshot of SA Economy Kgotso Radira 1 September 29 Economic Outlook Global share indices 2 Indices 18 16 14 12 1 8 6 4 25 26 27 28 29 S&P 5 FTSE 1 DAX Nikkei 3 Global interest rates 7 % 6 5 4 3 2 1 1999
Economic Indicators December 2017
 Economic Indicators December 2017 General Economy GDP % Change U.S. GDP Growth First two consecutive quarters over 3% in 3 years 6.0% 4.0% 2.0% 0.0% -2.0% -4.0% -6.0% Last 3 quarters: 3Q17: 3.2% 2Q17:
The Economic & Financial Outlook
 The Economic & Financial Outlook Beata Caranci SVP & Chief Economist TD Economics September 217 Key Themes Synchronized global economic acceleration has put monetary policy normalization in focus Canada
The Bull Market: Six Years Old And Not Over
 The Bull Market: Six Years Old And Not Over April 22-24, 2015 FOR PROFESSIONAL USE ONLY. FURTHER DISTRIBUTION OF THE INFORMATION CONTAINED HEREIN IS PROHIBITED WITHOUT PRIOR PERMISSION. Disclosures This
Economic Update and Outlook
 1 Economic Update and Outlook NAIOP Vancouver Chapter Breakfast Seminar Thursday, November 17, 2011 Helmut Pastrick Chief Economist Central 1 Credit Union 2 Outline: Global and U.S. economies Canadian
Quarterly Update. Jessica Burbrink, CFP, CTFA. Clayton Bill, CFA. Kathy Clark. Andrew Heck, JD, CTFA, CFIRS
 Quarterly Update Jessica Burbrink, CFP, CTFA Clayton Bill, CFA Kathy Clark Andrew Heck, JD, CTFA, CFIRS RATE OF RETURN (%) Capital markets PERIODS ENDING DECEMBER 2017 Capital Market Returns 40 37.3 30
The World Economic & Financial System: Risks & Prospects
 The World Economic & Financial System: Risks & Prospects Dr. Jacob A. Frenkel Chairman & CEO Group of Thirty (G30).Bank Indonesia 7th Annual International Seminar Global Financial Tsunami: What Can We
Aug-12. Oct-13. Dec-14. Feb-16
 Feb-2 Apr-3 Jun-4 Aug-5 Oct-6 Feb-9 Apr-1 Jun-11 Aug-12 Feb-16 Dec-1 Dec-2 Dec-3 Dec-4 Dec-5 Dec-6 Richard Farr Jim McGovern U.S. Trading European Trading Chief Market Strategist Market Strategist Tourmaline
Many analysts have argued that a housing boom preceded
 NationalEconomicTrends September The Financial Services Sector: Boom and Recession Many analysts have argued that a housing boom preceded the recent financial crisis and economic slowdown Innovations in
Global House View: Market Outlook
 HSBC GLOBAL ASSET MANAGEMENT September 29 Global House View: Market Outlook Contents 1688/HSB1395a Market performance Macro-economic Picture Market Views: high level asset allocation Market Views: Equity
INVESTMENT MARKET UPDATE UBC FACULTY PENSION PLAN
 INVESTMENT MARKET UPDATE UBC FACULTY PENSION PLAN MIKE LESLIE, FACULTY PENSION PLAN NEIL WATSON, LEITH WHEELER FEBRUARY 11, 2015 Presenters Mike Leslie Executive Director, Investments Faculty Pension Plan
 Robert D. Cruz, PhD, Chief Economist Miami-Dade County 305-375-1879 cruzr1@miamidade.gov www.miamidade.gov/economicdevelopment Department of Regulatory and Economic Resources Page 1 Local economic indicators
RBC Global Asset Management Daniel E. Chornous, CFA Chief Investment Officer RBC Global Asset Management
 RBC Global Asset Management Daniel E. Chornous, CFA Chief Investment Officer RBC Global Asset Management November 212 % Global Investment Outlook PMIs swing upward 65 Global Purchasing Manager's Indices
FOR RELEASE: 10:00 A.M. AEST, THURSDAY, APRIL 30, 2009
 FOR RELEASE: 10:00 A.M. AEST, THURSDAY, APRIL 30, 2009 The Conference Board Australia Business Cycle Indicators SM THE CONFERENCE BOARD LEADING ECONOMIC INDEX (LEI) FOR AUSTRALIA AND RELATED COMPOSITE
The U.S. and Washington Area Economic Performance and Outlook
 /8/ The U.S. and Washington Area Economic Performance and Outlook Center for Regional Analysis School of Public Policy George Mason University November 8, Recession Recovery Patterns of GDP Past Four Recessions