December 2014 FINANCIAL MARKET REVIEW
|
|
|
- Edwin Gardner
- 5 years ago
- Views:
Transcription
1 December 2014 FINANCIAL MARKET REVIEW Buena Vista Investment Management LLC 241 Third Street South Wisconsin Rapids, WI
2 December 2014 Why Portfolios Remain Diversified Buena Vista Investment Management LLC 241 Third Street South Wisconsin Rapids, WI

3 Voya Investment Management Global Perspectives World Economy Gross Domestic Product (GDP) Global economic growth has nearly doubled in the last decade and increased by nearly one third since the peak just before the Great Recession. Fundamentals % of World GDP 2003 $37.9 Trillion 2007 $56.4 Trillion 2013 $73.4 Trillion United States Emerging and Developing Economies Source: International Monetary Fund (IMF) as of
4 Voya Investment Management Global Perspectives Developing Markets Drive Growth World GDP accelerated in the last decade, supported by the largest emerging markets, which now outproduce the largest developed economies, where generally higher debt levels hinder economic growth. Fundamentals World GDP 80,000 Gross Government Debt to GDP , G7 $ Billions 40,000 % of GDP All Advanced Economies 60 20, Emerging and Developing Economies Data as of 12/31/13. Note: The G7 countries are comprised of the U.S., U.K., France, Germany, Italy, Canada and Japan Source: IMF World Economic Outlook database 14
 45 40 35 World $41.")
5 Global Perspectives Global Consumer Global household consumption of goods and services has increased 100% in the last decade. The consumer contribution to global expansion is prodigious. Emerging markets now account for more than 50% of auto sales. Fundamentals Global and U.S. Consumption Automobile Sales (84.7 million units 2012) World $41.6 AFRICA, 2% EUROPE, 23% $ Trillions Global consumption increased 100% in the last decade U.S. consumption increased 50% in the last decade U.S. $11.1 ASIA/OCEANIA/ MIDDLE EAST, 47% CENTRAL & SOUTH AMERICA, 7% CANADA/ MEXICO, 3% UNITED STATES, 18% China is the number one auto market in the world and U.S. only accounts for 18% of global sales Data as of 12/31/12. Source: The World Bank, OICA 12
6 Voya Investment Management Global Perspectives Global Stock Fundamentals Emerging market equities appear to offer competitive profitability and balance sheet strength with valuations at or below those of S&P 500 and EAFE stocks. Valuation S&P 500 MSCI EAFE MSCI Emerging Markets P/E (next fiscal year estimated earnings) Price to Book Ratio Price to Cash Flow Ratio Price to Sales Ratio Profitability Return on Equity (ROE) % Balance Sheet Strength Long-term Debt to Capital Ratio % International Note: Valuation and Profitability figures are weighted harmonic averages, a statistical technique that reduces the effects of extreme outlying data on the average. Long-term Debt to Capital figures are weighted averages. Source: FactSet 53
7 Voya Investment Management Global Perspectives World Market Returns by Region USD Emerging market equity (EME) has often been a top performer but lagged in Pacific ex-japan and the EME are again market leaders this year, while Japan and Europe-Ex-U.K. are the laggards Pac Europe Pac EME EME EME Japan EME EME S&P 500 Ex-Japan Ex-UK Ex-Japan S&P 500 Pac Ex-Japan 56.3% 29.6% 34.5% 36.4% 39.8% -29.1% 79.0% 19.2% 2.1% 21.7% 32.4% 11.8% Pac Ex-Japan EME Japan Pac Ex-Japan Pac Ex-Japan S&P 500 Pac Ex-Japan Pac Ex-Japan UK Europe Ex-UK Europe Ex-UK 47.0% 26.0% 25.6% 33.2% 31.7% -37.0% 73.0% 17.1% -2.5% 18.7% 28.7% 10.9% Europe Europe Pac Europe Europe Pac EME UK Japan S&P 500 Japan S&P 500 Ex-UK Ex-UK Ex-Japan Ex-UK Ex-UK Ex-Japan 43.6% 22.4% 14.8% 32.6% 17.5% -45.0% 43.4% 15.6% -12.7% 15.0% 27.3% 9.9% Europe Europe Japan UK UK UK UK S&P 500 Japan EME UK UK Ex-UK Ex-UK 36.2% 19.6% 11.3% 30.7% 8.4% -48.3% 33.9% 15.1% -14.2% 13.1% 20.7% 4.3% Europe Pac Europe UK Japan UK S&P 500 S&P 500 EME S&P 500 UK UK Ex-UK Ex-Japan Ex-UK 32.1% 16.0% 7.4% 15.8% 5.5% -47.1% 26.5% 8.8% -14.5% 13.0% 5.6% 1.5% EME International Pac Europe S&P 500 S&P 500 S&P 500 Japan Japan Japan EME Japan EME Japan Ex-Japan Ex-UK 28.7% 10.9% 4.9% 6.3% -4.1% -50.0% 6.4% 2.4% -18.2% 2.9% -2.3% -0.8% Note: All data are based on equity indexes for each regional or country index and are total returns including dividends for each calendar year or partial year. Source: MSCI, Standard & Poor s, FactSet 47
8 December 2014 Two Important Economic Trends Buena Vista Investment Management LLC 241 Third Street South Wisconsin Rapids, WI
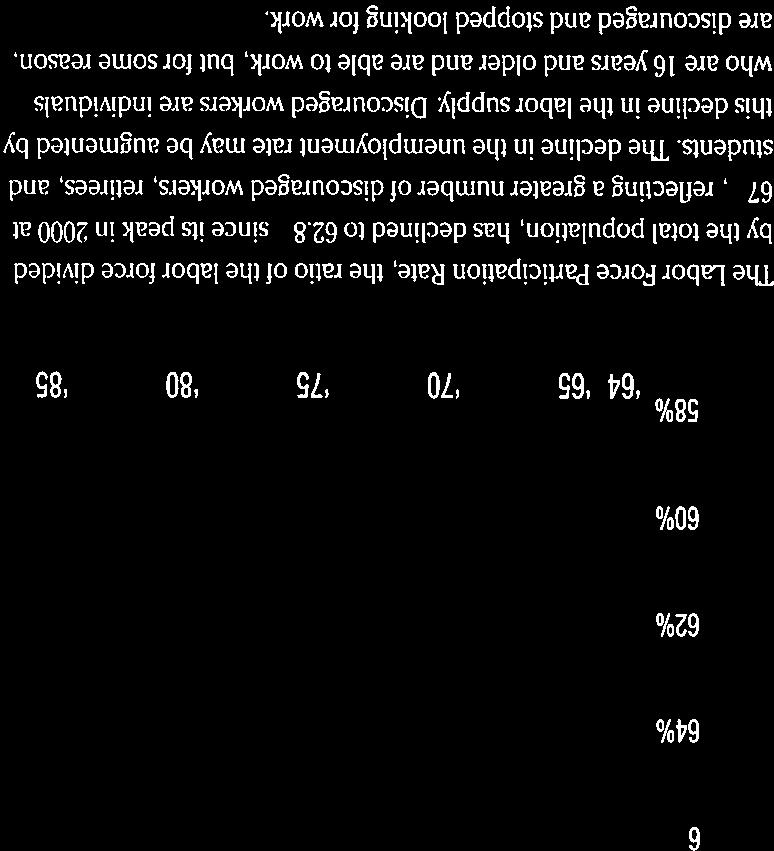
9 Economic Growth and the Composition of GDP Real GDP Year-over-year % chg 10% Real GDP 2Q14 Components of GDP 2Q14 nominal GDP, trillions USD $18 3.2% Housing 8% YoY % chg: 2.6% QoQ % chg: 4.6% $ % Investment Ex-housing Econom my 6% 4% 2% Average: 3.0% $14 $12 $10 $8 18.3% Gov t Spending 0% $6 68.5% Consumption -2% -4% Expansion Average: 2.2% -6% '65 '70 '75 '80 '85 '90 '95 '00 '05 '10 Source: BEA, FactSet, J.P. Morgan Asset Management. Values may not sum to 100% due to rounding. Quarter over quarter percent changes are at an annualized rate. Average represents the annualized growth rate for the full period. Expansion average refers to the period starting in the second quarter of Guide to the Markets U.S. Data are as of 9/30/14. $4 $2 $0 -$2-3.2% Net Exports 17


10
11 December 2014 US Equity Market Valuation Buena Vista Investment Management LLC 241 Third Street South Wisconsin Rapids, WI
12 Stock Valuation Measures: S&P 500 Index Equities 7 U.S. Equity: Valuation Measures Historical Averages Valuation 1-year 5-year 10-year 25-year Latest Measure Description ago avg. avg. avg.* P/E Price to Earnings 15.2x 14.2x 13.4x 13.8x 15.6x CAPE Shiller's P/E Div. Yield Dividend Yield 1.9% 2.0% 2.0% 2.0% 2.1% REY Real Earnings Yield 3.8% 3.7% 4.2% 3.2% 2.2% P/B Price to Book P/CF Price to Cash Flow EY Spread EY Minus Baa Yield 1.8% 1.5% 2.1% 1.2% -0.7% S&P 500 Index: Forward P/E Ratio 26x 14% 24x 22x 20x 18x 16x 14x 12x 10x 8x Average: 15.6x Current: 15.2x '90 '92 '94 '96 '98 '00 '02 '04 '06 '08 '10 '12 '14 S&P 500 Earnings Yield vs. Baa Bond Yield 12% 10% 8% 6% 4% S&P 500 Earnings Yield (Inverse of fwd. P/E): 6.6% Moody s Baa Yield: 4.8% 2% '90 '92 '94 '96 '98 '00 '02 '04 '06 '08 '10 '12 '14 Source: Standard & Poor s, FactSet, Robert Shiller Data, FRB, J.P. Morgan Asset Management. Price to Earnings is price divided by consensus analyst estimates of earnings per share for the next 12 months. Shiller s P/E uses trailing 10-years of inflation adjusted earnings as reported by companies. Dividend Yield is calculated as the trailing 12- month average dividend divided by price. Price/Earnings to Growth Ratio is calculated as NTM P/E divided by NTM earnings growth. Price to Book Ratio is the price divided by book value per share. Price to Cash Flow is price divided by NTM cash flow. EY Minus Baa Yield is the forward earnings yield (consensus analyst estimates of EPS over the next 12 months divided by price) minus the Moody s Baa seasoned corporate bond yield. *P/CF is a 20-year avg. due to cash flow data availability. Guide to the Markets U.S. Data are as of 9/30/2014.


13
14 Corporate Profits and Leverage Equities S&P 500 Earnings Per Share Operating basis, quarterly $27 $23 2Q07: $ Q14*: $29.45 Profit Margins 12% 10% S&P 500 Operating EPS % of Sales per Share 8% 6% 2Q14*: 10.0% 2Q14: 8.7% $19 4% 2% After-Tax, Adj. Corp. Profits, % of GDP $15 $11 0% '60 '65 '70 '75 '80 '85 '90 '95 '00 '05 '10 Total Leverage S&P 500, ratio of total debt to total equity, quarterly 240% 220% 8 $7 $3 -$1 '01 '02 '03 '04 '05 '06 '07 '08 '09 '10 '11 '12 '13 '14 80% '96 '98 '00 '02 '04 '06 '08 '10 '12 '14 Source: BEA, Standard & Poor s, Compustat, J.P. Morgan Asset Management. EPS levels are based on operating earnings per share. *Most recently available data is 1Q14 as 2Q14 are Standard & Poor s preliminary estimates. Past performance is not indicative of future returns. Guide to the Markets U.S. Data are as of 9/30/ % 180% 160% 140% 120% 100% Average: 169% 3Q14: 101%
15 Voya Investment Management Global Perspectives U.S. Manufacturing The latest U.S. manufacturing report shows the highest level of manufacturing shipments and industrial production ever. Fundamentals U.S. Manufacturing (Value of Shipments in $ Billions) Highest level ever Industrial Production United States Highest level ever Index Level U.S. recessionary periods U.S. Manufacturing data as of 09/30/14; Industrial Production data as of 08/31/14. Source: FactSet 11
16 Voya Investment Management Global Perspectives Tectonic Shift: Global Trade Economic growth fuels demand for imports, aggravating the trade deficit, which hit a 10-year low in the great recession as demand dwindled. Exports have since expanded, reaching their highest level ever Trade Deficit (left axis) Recessions 250 Highest Export Level $198B 200 Tectonic Shifts $USD Billions Imports (right axis) 150 $USD Billions Exports (right axis) Data as of 07/31/14. Source: FactSet 21
17 Voya Investment Management Global Perspectives Consumer as Game Changer At about 70% of GDP, the U.S. consumer is the game changer in the economic recovery. Consumption, income and retail sales have achieved all-time highs. Fundamentals U.S. Personal Income 12, ,000 10,000 9, Highest level ever 8,000 $ Billions ,000 6,000 $ Billions 400 5, U.S. Personal Consumption Expenditures 4,000 3,000 2, U.S. Retail Sales , Data as of 08/31/14. Source: FactSet 13
18 Consumer Confidence and the Stock Market Consumer Sentiment Index University of Michigan 130 Econom my Aug % Impact on Consumer Sentiment from a 10% y-o-y rise in gasoline prices 10% y-o-y rise in home prices 10% y-o-y rise in the S&P 500 1% y-o-y rise in the unemployment rate May % Mar % pts Jan % Average: 84.8 Jan % Jan % Sep. 2014: Mar % Oct % Feb % Oct % Nov % Aug % 50 May 1980 Sentiment Cycle Low and +19.2% subsequent 12-month S&P 500 Index return 40 '72 '74 '76 '78 '80 '82 '84 '86 '88 '90 '92 '94 '96 '98 '00 '02 '04 '06 '08 '10 '12 '14 Source: University of Michigan, FactSet, J.P. Morgan Asset Management. Peak is defined as the highest index value before a series of lower lows, while a trough is defined as the lowest index value before a series of higher highs. Subsequent 12-month S&P 500 returns are price returns only, which excludes dividends. Impact on consumer sentiment is based on a multivariate monthly regression between 1/31/2000 5/31/2014. Guide to the Markets U.S. Data are as of 9/30/14.
May 2015 FINANCIAL MARKET REVIEW
 May 2015 FINANCIAL MARKET REVIEW Buena Vista Investment Management LLC 241 Third Street South Wisconsin Rapids, WI 54494 715-422-0700 http://buenavistainv.com Volume 13 Issue 1 March 2015 MOVING TO A MORE
BUENA VISTA INVESTMENT MANAGEMENT
 BUENA VISTA INVESTMENT MANAGEMENT FOURTH QUARTER 2015 FINANCIAL MARKET REVIEW Buena Vista Investment Management LLC P.O. Box 1206 241 3 rd Street South Wisconsin Rapids, WI 54495-1206 715-422-0700 buenavistainv@buenavistainv.com
JPMorgan American Investment Trust plc Annual General Meeting. 13 May 2015
 JPMorgan American Investment Trust plc Annual General Meeting 13 May 2015 Agenda Performance Review Current Economic and Market Data Current Asset Allocation and Fund Structure 1 2014 Results NAV return
2Q Commencement: A Guide to the Markets. David Kelly, Chief Global Strategist, JPMorgan Funds
 FOR INSTITUTIONAL USE ONLY NOT FOR PUBLIC DISTRIBUTION 2Q 2013 Commencement: A Guide to the Markets David Kelly, Chief Global Strategist, JPMorgan Funds Summary Even at new all-time highs the stock market
Economic and Market Outlook
 Economic and Market Outlook Third Quarter 2018 Investment Products: Not FDIC Insured No Bank Guarantee May Lose Value Past performance is no guarantee of future results. Financial term and index definitions
ECONOMIC AND MARKET COMMENTARY OUR MISSION
 ECONOMIC AND MARKET COMMENTARY OUR MISSION Smith Shellnut Wilson is a registered investment adviser* specializing in managing investment portfolios for banks, individuals, corporations, foundations and
Quarterly Update. Jessica Burbrink, CFP, CTFA. Clayton Bill, CFA. Kathy Clark. Andrew Heck, JD, CTFA, CFIRS
 Quarterly Update Jessica Burbrink, CFP, CTFA Clayton Bill, CFA Kathy Clark Andrew Heck, JD, CTFA, CFIRS RATE OF RETURN (%) Capital markets PERIODS ENDING DECEMBER 2017 Capital Market Returns 40 37.3 30
SHAMBLING FORWARD. 02/13/2014 WORLD POPULATION 2 WALL STREET, MAIN STREET, AND CAPITOL HILL: AN ECONOMIC UPDATE
 SHAMBLING FORWARD. WALL STREET, MAIN STREET, AND CAPITOL HILL: AN ECONOMIC UPDATE Shamble: To walk in an awkward, lazy, or unsteady manner, shuffling the feet FEBRUARY 12, 2014 David B. Hanson, CPA, CFA
J.P. Morgan Asset Management US Investment Range
 FOR PROFESSIONAL CLIENTS ONLY NOT FOR RETAIL USE OR DISTRIBUTION. J.P. Morgan Asset Management US Investment Range A century of experience in J.P. Morgan s home market Investing with J.P. Morgan Asset
As of December 31, Guide to the Markets
 1Q 2013 As of December 31, 2012 Guide to the Markets Table of Contents EQUITIES ECONOMY FIXED INCOME INTERNATIONAL ASSET CLASS 4 16 34 42 55 U.S. Market Strategy Team Dr. David P. Kelly, CFA david.p.kelly@jpmorgan.com
Three-speed recovery. GDP growth. Percent Emerging and developing economies. World
 Three-speed recovery GDP growth Percent 1 8 6 4 2-2 -4-6 198 1985 199 1995 2 25 21 215 Source: IMF WEO; Milken Institute. Emerging and developing economies Advanced economies World Output is still below
Economic and Market Outlook
 Economic and Market Outlook Fourth Quarter 2018 Investment Products: Not FDIC Insured No Bank Guarantee May Lose Value Past performance is no guarantee of future results. Financial term and index definitions
THE SKINNY. CG s Market Commentary
 THE SKINNY CG s Market Commentary Third Quarter 2016 THE SKINNY Third Quarter 2016 U.S. EQUITY MARKETS ENDED SEPTEMBER WITH MIXED RESULTS. The Dow Jones Industrial Average posted a 0.41% loss for the month,
MAY 2018 Capital Markets Update
 MAY 2018 Market commentary U.S. ECONOMICS The U.S. added 223,000 jobs to payrolls in May, well above the consensus estimate of 180,000 and the expansion average of around 200,000. Sector job gains were
Decline in Economic Activity Larger Than Advance GDP Estimate February 27, 2009
 Northern Trust Global Economic Research 5 South LaSalle Chicago, Illinois 663 northerntrust.com Asha G. Bangalore agb3@ntrs.com Decline in Economic Activity Larger Than Advance GDP Estimate February 27,
Moving On Up Today s Economic Environment
 Moving On Up Today s Economic Environment Presented by PFM Asset Management LLC Gray Lepley, Senior Analyst, Portfolio Strategies November 8, 2018 PFM 1 U.S. ECONOMY Today s Agenda MONETARY POLICY GEOPOLITICAL
Capital Markets: Observations and Insights Earnings Resurgence Spring 2017
 Capital Markets: Observations and Insights Earnings Resurgence Spring 2017 Key Observations After diverging in 2016, fundamentals once again drove performance in 1Q17 There is a resurgence in earnings
Vanguard economic and market outlook for 2018: Rising risks to the status quo. Vanguard Research December 2017
 Vanguard economic and market outlook for 2018: Rising risks to the status quo Vanguard Research December 2017 Market consensus has finally embraced the low secular trends Note: The Group of Seven (G7)
2015 Market Review & Outlook. January 29, 2015
 2015 Market Review & Outlook January 29, 2015 Economic Outlook Jason O. Jackman, CFA President & Chief Investment Officer Percentage Interest Rates Unexpectedly Decline 4.5 10-Year Government Yield 4 3.5
CAPITAL MARKETS REVIEW
 CAPITAL MARKETS REVIEW Reviewing the quarter ended June 30, 2017 Patrick H. Yanke, CFP 3737 Glenwood Ave, Ste 100 // Raleigh, NC 27612 800-513-2812 // patrick.yanke@yankefinancial.com // www.yankefinancial.com
How to Earn Double-Digit Returns While Avoiding Major Down Markets in a Safety-First Approach
 AAII Orange County Chapter Meeting Saturday April 27, 2013 How to Earn Double-Digit Returns While Avoiding Major Down Markets in a Safety-First Approach 9:00 10:30 Presentation 10:30 o 11:00 Q&A Today
Market Review and Outlook. Todd Centurino, CFA
 Market Review and Outlook Todd Centurino, CFA Q1 2017 Global Economy: On the Upswing Ranked Returns (%) Emerging Market Equities 11.40 European Equities 7.40 US Equities 6.10 Global Bonds 2.00 US Treasuries
The Compelling Case for Value
 The Compelling Case for Value July 2, 2018 SOLELY FOR THE USE OF INSTITUTIONAL INVESTORS AND PROFESSIONAL ADVISORS 0 Jan-75 Jan-77 Jan-79 Jan-81 Jan-83 Jan-85 Jan-87 Jan-89 Jan-91 Jan-93 Jan-95 Jan-97
INVESTMENT MARKET UPDATE UBC FACULTY PENSION PLAN
 INVESTMENT MARKET UPDATE UBC FACULTY PENSION PLAN MIKE LESLIE, FACULTY PENSION PLAN NEIL WATSON, LEITH WHEELER FEBRUARY 12, 2014 Presenters Mike Leslie Executive Director, Investments Faculty Pension Plan
OUTLOOK 2014/2015. BMO Asset Management Inc.
 OUTLOOK 2014/2015 BMO Asset Management Inc. We would like to take this opportunity to provide our capital markets outlook for the remainder of 2014 and the first half of 2015 and our recommended asset
Investing in Today s World with Thoughts of Tomorrow. Presented by: Jeff Matthias, CFA
 Investing in Today s World with Thoughts of Tomorrow Presented by: Jeff Matthias, CFA Wisconsin Coalition of Annuitants May 11, 2018 Today s Key Takeaways Investor Inputs Market Recap Investment Outlook
Muhlenkamp & Company. Webcast November 30, Ron Muhlenkamp, Portfolio Manager Jeff Muhlenkamp, Portfolio Manager Tony Muhlenkamp, President
 Muhlenkamp & Company Webcast November 3, 217 Ron Muhlenkamp, Portfolio Manager Jeff Muhlenkamp, Portfolio Manager Tony Muhlenkamp, President Muhlenkamp & Company, Inc. Intelligent Investment Management
A LONG-TERM CASE FOR EMERGING MARKETS
 A LONG-TERM CASE FOR EMERGING MARKETS An Extraordinary Long-Term Opportunity Emerging markets have displayed significant evolution in terms of economic development and capital markets deepening in the
A Global Economic and Market Outlook
 A Global Economic and Market Outlook Presented by Dr Chris Caton December 2008 US Housing starts and Permits 2.3 (Millions) Permits Starts 2.1 1.9 1.7 1.5 1.3 1.1 0.9 0.7 96 97 98 99 00 01 02 03 04 05
INVESTMENT MARKET UPDATE UBC FACULTY PENSION PLAN
 INVESTMENT MARKET UPDATE UBC FACULTY PENSION PLAN MIKE LESLIE, FACULTY PENSION PLAN NEIL WATSON, LEITH WHEELER FEBRUARY 11, 2015 Presenters Mike Leslie Executive Director, Investments Faculty Pension Plan
JPM US Equity Income Fund
 J.P. Morgan Asset Management Investment Summit 2016 JPM US Equity Income Fund HALF IMAGE PLACEMENT HOLDER (HORIZONTAL) Resize image to cover grey box Clare Hart, Managing Director, Portfolio Manager #JPMsummit
Global Equities. Q&A roadshow #QAroadshow2016. Gavin Marriott Product Manager
 Global Equities Q&A roadshow 216 #QAroadshow216 Gavin Marriott Product Manager June 216 For professional advisers only. This material is not suitable for retail clients Questions What will drive global
The Linhart Group Second Half 2017 Outlook. GIC Slides
 The Linhart Group Second Half 2017 Outlook GIC Slides S&P 500 Sectors YTD 2017 Total Return Energy Telecom -12.6% -10.7% Real Estate Financials Staples Utilities Materials Industrials Discretionary 6.4%
Emerging markets the equities perspective. Scott Berg, T. Rowe Price
 Emerging markets the equities perspective Scott Berg, T. Rowe Price Audience voting about to begin Proudly supported by our Gold Industry Partner Question What is your fund's weight in Emerging Markets?
Weekly Macroeconomic Review
 16/10/2012 Weekly Macroeconomic Review Expectations derived from the capital market Our forecast Inflation in the coming months Inflation through September 2013 CPI (average annual rate) Inflation through
Perspectives JAN Market Preview: Non-U.S. Equities
 Perspectives JAN 2018 2018 Market Preview: Non-U.S. Equities SUSTAINED STRENGTH OR ONE HIT WONDER? Non-U.S. equity investors patience was finally rewarded with a banner year in 2017, as both strong economic
UNDERSTANDING THE STOCK MARKET CORRECTION
 UNDERSTANDING THE STOCK MARKET CORRECTION EmergingWealth Investment Management, Inc. 5700 Corporate Drive, Suite 360 Pittsburgh, PA 15237-5829 Phone: (412) 548-1386 E-mail: wealth@emergingwealth.com Legend
THE CONFERENCE BOARD LEADING ECONOMIC INDEX (LEI) FOR FRANCE AND RELATED COMPOSITE ECONOMIC INDEXES FOR JANUARY
 FOR FRANCE AND RELATED COMPOSITE ECONOMIC INDEXES FOR JANUARY") FOR RELEASE: 10:00 A.M. CET, TUESDAY, MARCH 17, 2009 The Conference Board France Business Cycle Indicators SM THE CONFERENCE BOARD LEADING ECONOMIC INDEX (LEI) FOR FRANCE AND RELATED COMPOSITE ECONOMIC
FOR RELEASE: 10:00 A.M. CET, TUESDAY, MARCH 17, 2009 The Conference Board France Business Cycle Indicators SM THE CONFERENCE BOARD LEADING ECONOMIC INDEX (LEI) FOR FRANCE AND RELATED COMPOSITE ECONOMIC
SEPTEMBER 2018 Capital Markets Update
 SEPTEMBER 2018 Market commentary U.S. ECONOMICS Non-farm payrolls added 134,000 jobs in September, missing the consensus estimate of 185,000. However, net revisions to the two months prior totaled +87,000
There has been considerable discussion of the possibility
 NationalEconomicTrends February Housing and the R Word There has been considerable discussion of the possibility that ongoing troubles in the housing market could push the economy into recession 1 But
2008 Economic and Market Outlook
 Economic and Market Outlook Presented by: Gareth Watson Warren Jestin Vincent Delisle December 7 Economic Outlook Warren Jestin The Global Economic Landscape is Changing Rapidly Gears Down Emerging Powerhouses
The First Phase of the U.S. Recovery and Beyond
 The First Phase of the U.S. Recovery and Beyond James Bullard President and CEO Federal Reserve Bank of St. Louis Global Interdependence Center Shanghai, China January 11, 2010 Any opinions expressed here
THE ECONOMIC OUTLOOK RECESSION AND RECOVERY. Paul Darby Executive Director & Deuty Chief Economist Twitter hashtag: #psforum
 THE ECONOMIC OUTLOOK RECESSION AND RECOVERY Paul Darby Executive Director & Deuty Chief Economist Darby@conferenceboard.ca US OUTLOOK US recession is coming to an end Q3 likely to be positive due to inventory
Economic Indicators. Roland Berger Institute
 Economic Indicators Roland Berger Institute October 2017 Overview Key points Economic Indicators A publication, compiled by the Roland Berger Institute, that provides you with the most important macroeconomic
Olivier Blanchard Economic Counsellor and Director of the Research Department, International Monetary Fund
 Centre for Economic Performance 21st Birthday Lecture Series The State of the World Economy Olivier Blanchard Economic Counsellor and Director of the Research Department, International Monetary Fund Lord
Capital Markets: Observations and Insights Searching for Yield and Asking for Trouble? As of June 30, 2016
 Capital Markets: Observations and Insights Searching for Yield and Asking for Trouble? As of June 30, 2016 Key Observations Strong bond performance has supported bond-like equities and hurt growth stocks
Economic and Financial Markets Monthly Review & Outlook Detailed Report January 2018
 Economic and Financial Markets Monthly Review & Outlook Detailed Report January 1 NOT FDIC INSURED NO BANK GUARANTEE MAY LOSE VALUE Overview of the Economy Business and economic confidence continue to
The World Economic & Financial System: Risks & Prospects
 The World Economic & Financial System: Risks & Prospects Dr. Jacob A. Frenkel Chairman & CEO Group of Thirty (G30).Bank Indonesia 7th Annual International Seminar Global Financial Tsunami: What Can We
Global Themes and Risks
 The Goldman Sachs Group, Inc. Goldman Sachs Research Global Themes and Risks April 2013 Abby Joseph Cohen, CFA Goldman, Sachs & Co. 1-212-902-4095 abby.cohen@gs.com Rachel Siu Goldman, Sachs & Co. 1-212-357-0493
Global Market Overview
 First Quarter 219 First Quarter 219: March Madness, or Just an Incredible Rebound? Global Market Overview MSCI All Country World S&P Russell 2 MSCI EAFE MSCI Emerging Markets MSCI ACWI ex USA Small BBgBarc
U.S. Economic Update and Outlook. Laurel Graefe, REIN Director Federal Reserve Bank of Atlanta October 2, 2013
 1 U.S. Economic Update and Outlook Laurel Graefe, REIN Director Federal Reserve Bank of Atlanta October 2, 213 Following the deepest recession since the 193s, the economic recovery is well under way, though
MULTI-ASSET CLASS 1 EQUITIES: DEVELOPED COUNTRIES 1 EQUITY EMERGING COUNTRIES 2
 10 2 3 6 8 9 13 14 MULTI-ASSET CLASS 1 EQUITIES: DEVELOPED COUNTRIES 1 EQUITY EMERGING COUNTRIES 2 Alpha Current Previous Alpha Current Previous Alpha Current Previous weight weight weight weight weight
Eurozone Economic Watch. February 2018
 Eurozone Economic Watch February 2018 Eurozone: Strong growth continues in 1Q18, but confidence seems to peak GDP growth moderated slightly in, but there was an upward revision to previous quarters. Available
Economic Outlook June Economic Policy Division
 Economic Outlook June 215 Economic Policy Division U.S. GDP Actual and Potential Quarterly, Q1 198 to Q4 215 Real GDP Trillion 29 Dollars Log Scale $18. Forecast $15. $12.5 Actual Potential $9. $6.5 198
FOR RELEASE: 10:00 A.M. AEST, THURSDAY, APRIL 30, 2009
 FOR RELEASE: 10:00 A.M. AEST, THURSDAY, APRIL 30, 2009 The Conference Board Australia Business Cycle Indicators SM THE CONFERENCE BOARD LEADING ECONOMIC INDEX (LEI) FOR AUSTRALIA AND RELATED COMPOSITE
GLOBAL EQUITY MARKET OUTLOOK: FAVOR U.S.; STICK WITH EM
 LPL RESEARCH WEEKLY MARKET COMMENTARY KEY TAKEAWAYS U.S. economic and earnings growth continue to stand out globally and support our positive view of U.S. equities. We continue to see upside potential
Economic Outlook June Economic Policy Division
 Economic Outlook June 215 Economic Policy Division U.S. GDP Actual and Potential Quarterly, Q1 198 to Q4 215 Real GDP Trillion 29 Dollars Log Scale $18. Forecast $15. $12.5 Actual Potential $9. $6.5 198
Emerging Markets Outlook
 Mark Mobius, Ph.D. Executive Chairman Templeton Emerging Markets Group Emerging Markets Outlook Dealer Use Only / Not for Distribution to the Public Agenda Performance Emerging Markets Equities: Demand
Chart 1 Productivity of Major Economies
 1980 1981 1982 1983 1984 1985 1986 1987 1988 1989 1990 1991 1992 1993 1994 1995 1996 1997 1998 1999 2000 2001 2002 2003 2004 2005 2006 2007 2008 2009 2010 2011 2013 2014 2015 2016 Chart 1 Productivity
PRESENTATION BY JACOB A. FRENKEL AT THE FORUM: INTELLIGENCE ON THE WORLD, EUROPE, AND ITALY. Villa d'este, Cernobbio - September 7, 8 and 9, 2012
 PRESENTATION BY JACOB A. FRENKEL AT THE FORUM: INTELLIGENCE ON THE WORLD, EUROPE, AND ITALY Villa d'este, Cernobbio - September 7, 8 and 9, 1 Working paper, September 1. Kindly authorized by the Author.
THE CONFERENCE BOARD LEADING ECONOMIC INDEX (LEI) FOR FRANCE AND RELATED COMPOSITE ECONOMIC INDEXES FOR FEBRUARY
 FOR FRANCE AND RELATED COMPOSITE ECONOMIC INDEXES FOR FEBRUARY") FOR RELEASE: 10:00 A.M. CET, WEDNESDAY, APRIL 22, 2009 The Conference Board France Business Cycle Indicators SM THE CONFERENCE BOARD LEADING ECONOMIC INDEX (LEI) FOR FRANCE AND RELATED COMPOSITE ECONOMIC
FOR RELEASE: 10:00 A.M. CET, WEDNESDAY, APRIL 22, 2009 The Conference Board France Business Cycle Indicators SM THE CONFERENCE BOARD LEADING ECONOMIC INDEX (LEI) FOR FRANCE AND RELATED COMPOSITE ECONOMIC
The U.S. Economic Outlook
 The U.S. Economic Outlook Gering/Scottsbluff Economic Forum August 23, 216 George A. Kahn Vice President and Economist The views expressed are those of the author and do not necessarily reflect the opinions
Solutions Conference Year End Global Economy & World Political Outlook Leon C. LaBrecque, JD, CPA, CFP, CFA RAIN IN EUROPE?
 Solutions Conference Year End 2014 Global Economy & World Political Outlook Leon C. LaBrecque, JD, CPA, CFP, CFA RAIN IN EUROPE? Global Equity Markets: Returns EAFE Return to Reach 2007 peak* EME Return
Martha Leiper Senior Vice President & Deputy Chief Investment Officer
 Investment Strategies Corporate Level Martha Leiper Senior Vice President & Deputy Chief Investment Officer Southeastern Actuaries Conference November 21, 2008 Table of Contents Current Environment The
Fourth Quarter 2015 Market Review. March 2016
 Fourth Quarter 2015 Market Review March 2016 Agenda Market Review Investment Outlook and Portfolio Positioning 2 2015 was a Challenging Year for Investment Returns Last year was the first time since 2001
B-GUIDE: Market Outlook
 Quarterly Market Outlook: Quarter 1 2018 on 5 th January 2018 Investment Outlook for 1 st Quarter 2018 Accelerating Global Economy Supports the Rising Earnings Equity Thailand US Europe Japan Asia Bond
JPMorgan Asian Investment Trust plc Investment Manager Presentation Annual General Meeting
 JPMorgan Asian Investment Trust plc Investment Manager Presentation Annual General Meeting 26th February 2018 Richard Titherington, Managing Director Chief Investment Officer of Emerging Markets and Asia
FOR RELEASE: 10:00 A.M. (BRUSSELS TIME), MONDAY, SEPTEMBER 27, 2010
, MONDAY, SEPTEMBER 27, 2010") FOR RELEASE: 10:00 A.M. (BRUSSELS TIME), MONDAY, SEPTEMBER 27, 2010 The Conference Board Euro Area Business Cycle Indicators SM THE CONFERENCE BOARD LEADING ECONOMIC INDEX (LEI) FOR THE EURO AREA AND RELATED
FOR RELEASE: 10:00 A.M. (BRUSSELS TIME), MONDAY, SEPTEMBER 27, 2010 The Conference Board Euro Area Business Cycle Indicators SM THE CONFERENCE BOARD LEADING ECONOMIC INDEX (LEI) FOR THE EURO AREA AND RELATED
Nonfarm Payroll Employment
 PRESIDENT'S REPORT TO THE BOARD OF DIRECTORS, FEDERAL RESERVE BANK OF BOSTON Current Economic Developments - June 10, 2004 Data released since your last Directors' meeting show the economy continues to
Economic Update and Outlook
 Economic Update and Outlook NAIOP Vancouver Chapter Breakfast Seminar Thursday, November 18, 2010 Helmut Pastrick Chief Economist Central 1 Credit Union Outline: Global and U.S. economies Canadian economy
Economic Forecast 2018
 Economic Forecast 2018 Economic Outlook 2018 Featured Speaker: Daniel Morgan Senior Portfolio Manager This report has been prepared from sources and data believed to be reliable but is not guaranteed to
ECONOMIC & REVENUE UPDATE
 January 11, 2018 Summary summary The U.S. labor market gained 148,000 net new jobs in December. U.S. housing starts in November 2017 were 12.9% above their year-ago level. Consumer confidence declined
GLOBAL EMERGING MARKETS: IT IS THE STOCKS THAT MATTER ANWAAR WAGNER
 GLOBAL EMERGING MARKETS: IT IS THE STOCKS THAT MATTER ANWAAR WAGNER Portfolio Manager at Electus AGENDA Emerging Markets (EM) Crises? EM vs Developed Markets (DM) OM GEM Fund It s the shares that matter
THE CONFERENCE BOARD LEADING ECONOMIC INDEX (LEI) FOR FRANCE AND RELATED COMPOSITE ECONOMIC INDEXES FOR MAY
 FOR FRANCE AND RELATED COMPOSITE ECONOMIC INDEXES FOR MAY") FOR RELEASE: 10:00 A.M. (PARIS TIME), MONDAY, JULY 19, 2010 The Conference Board France Business Cycle Indicators SM THE CONFERENCE BOARD LEADING ECONOMIC INDEX (LEI) FOR FRANCE AND RELATED COMPOSITE ECONOMIC
FOR RELEASE: 10:00 A.M. (PARIS TIME), MONDAY, JULY 19, 2010 The Conference Board France Business Cycle Indicators SM THE CONFERENCE BOARD LEADING ECONOMIC INDEX (LEI) FOR FRANCE AND RELATED COMPOSITE ECONOMIC
Equity Markets in a Late-Cycle Environment: Balancing Opportunity and Risk
 Equity Markets in a Late-Cycle Environment: Balancing Opportunity and Risk Speaker: Olivia Engel, CFA Senior Managing Director, CIO, Active Quantitative Equity State Street Global Advisors 2 Content What
Five years into the crisis. Is the world more stable or more unstable? Page 2 I Dublin, June 2013 Pioneer Investment Conference.
 Five years into the crisis. Is the world more stable or more unstable? Page 2 I Dublin, June 2013 Pioneer Investment Conference. % of GDP The Debt Issue in Developed Markets Developed Markets Debt-to-GDP
Single-family home sales and construction are not expected to regain 2005 peaks
 Single-family home sales and construction are not expected to regain 25 peaks Millions of units 8. 7. 6. 5. Housing starts (right axis) 4. Home sales (left axis) 3. 2. 1. 198 1985 199 1995 2 25 21 215
THE CONFERENCE BOARD LEADING ECONOMIC INDEX (LEI) FOR THE EURO AREA AND RELATED COMPOSITE ECONOMIC INDEXES FOR JUNE
 FOR THE EURO AREA AND RELATED COMPOSITE ECONOMIC INDEXES FOR JUNE") FOR RELEASE: 10:00 A.M. (BRUSSELS TIME), MONDAY, JULY 26, 2010 The Conference Board Euro Area Business Cycle Indicators SM THE CONFERENCE BOARD LEADING ECONOMIC INDEX (LEI) FOR THE EURO AREA AND RELATED
FOR RELEASE: 10:00 A.M. (BRUSSELS TIME), MONDAY, JULY 26, 2010 The Conference Board Euro Area Business Cycle Indicators SM THE CONFERENCE BOARD LEADING ECONOMIC INDEX (LEI) FOR THE EURO AREA AND RELATED
FOR RELEASE: 10:00 A.M. AEST, THURSDAY, AUGUST 26, 2010
 FOR RELEASE: 10:00 A.M. AEST, THURSDAY, AUGUST 26, 2010 The Conference Board Australia Business Cycle Indicators SM THE CONFERENCE BOARD LEADING ECONOMIC INDEX (LEI) FOR AUSTRALIA AND RELATED COMPOSITE
Quarterly Investment Briefing February 5, 2014
 Quarterly Investment Briefing February 5, 2014 Clayton T. Bill, CFA Stephen J. Nilles, CFP Agenda Topic Page 2013 Review 3 Corporate Earnings and Profit Margins 5 Equity Market Valuations 7 Bonds and Expected
U.S. Chamber of Commerce Economic Outlook
 U.S. Chamber of Commerce Economic Outlook December 211 Economic Policy Division Real GDP Outlook Percent Change, Annual Rate 2 1 1 - -1 197 197 198 198 199 199 2 2 21 U.S. GDP Actual and Potential Quarterly,
Economic Update and Outlook
 1 Economic Update and Outlook NAIOP Vancouver Chapter Breakfast Seminar Thursday, November 17, 2011 Helmut Pastrick Chief Economist Central 1 Credit Union 2 Outline: Global and U.S. economies Canadian
The External Environment for Developing Countries
 d Public Disclosure Authorized Public Disclosure Authorized Public Disclosure Authorized The External Environment for Developing Countries July 2009 The World Bank Development Economics Prospects Group
Hurtling Towards Financial Armageddon. Veneroso Associates April 18, 2018
 Hurtling Towards Financial Armageddon Veneroso Associates April 18, 2018 SocGen shows a doubling in net debt for the S&P 1500 ex financials Figure 1: US Corporate Net Debt Has Exploded and Exceeds Earnings
The Stimulus Didn t Work An Overlooked Fact that Needs Mention September 18, 2009
 Northern Trust Global Economic Research 0 South LaSalle Chicago, Illinois northerntrust.com Asha G. Bangalore agb@ntrs.com The Stimulus Didn t Work An Overlooked Fact that Needs Mention September 18, 9
Outlook for 2014 Title 1. David Greene, Pioneer Investments
 Outlook for 2014 Title 1 David Greene, Pioneer Investments 2014 A year of Transition Transitioning from fiscal tightening to less austerity. Transitioning from Euro-area recession to growth. Transitioning
How do we define cash on the sidelines? Global M2 minus M1 Money Supply ($ Millions) US Money Supply European Money Supply Chinese Money Supply
 US Money Supply European Money Supply Chinese Money Supply") How do we define cash on the sidelines? Global M2 minus M1 Money Supply ($ Millions) 30000 25000 20000 15000 US Money Supply European Money Supply Chinese Money Supply 10000 5000 0 Source: Bloomberg, Credit
How do we define cash on the sidelines? Global M2 minus M1 Money Supply ($ Millions) 30000 25000 20000 15000 US Money Supply European Money Supply Chinese Money Supply 10000 5000 0 Source: Bloomberg, Credit
Global House View: Market Outlook
 HSBC GLOBAL ASSET MANAGEMENT September 29 Global House View: Market Outlook Contents 1688/HSB1395a Market performance Macro-economic Picture Market Views: high level asset allocation Market Views: Equity
The Asia Pacific Fund, Inc.
 Baring Asset Management (Asia) Limited 19th Floor Edinburgh Tower 15 Queen s Road Central Hong Kong Tel: (852) 2841 1411 Fax: (852) 2868 411 The Asia Pacific Fund, Inc. Investment Outlook & Strategy www.asiapacificfund.com
Nationwide Funds. A Nationwide Financial White Paper. Executive summary
 Nationwide Funds A Nationwide Financial White Paper Emerging Markets Executive summary Emerging market economies have experienced faster population and economic growth than developed markets; a trend that
United States. Gross Domestic Product Percent change over year-ago level. Industrial Production Index, 2010=100. Unemployment Rate Percent
 United States Summary Indicators Gross Domestic Product Percent change over year-ago level Industrial Production Index, 2010=100 1.0 1.5 2.0 2.5 3.0 3.5 4.0 2.5 108 110 112 114 114.9 4.0 4.5 5.0 5.5 6.0
Global Equity. Third Quarter 2018 Review
 Global Equity Third Quarter 2018 Review COMPOSITE PERFORMANCE SUMMARY As of September 30, 2018 Performance (% Total Return) 1 Annualized Returns; 2 Inception date: November 30, 1989; 3 The Benchmark Index;
Washington & The Investment Landscape Daniel Clifton February 2019 Macro Research
 Washington & The Investment Landscape Daniel Clifton February 2019 Macro Research Investment Strategy Economics Policy Research Quantitative Research Technical Research Fixed Income Research Industry Surveys
The Conference Board Australia Business Cycle Indicators SM AUSTRALIA LEADING ECONOMIC INDICATORS AND RELATED COMPOSITE INDEXES FOR SEPTEMBER 2008
 FOR RELEASE: 6:00 P.M. ET, MONDAY, NOVEMBER 24, 2008 The Conference Board Australia Business Cycle Indicators SM AUSTRALIA LEADING ECONOMIC INDICATORS AND RELATED COMPOSITE INDEXES FOR SEPTEMBER 2008 The
December 2014 Economic Outlook. All data as of November 30, 2014 unless otherwise noted.
 December 2014 Economic Outlook All data as of November 30, 2014 unless otherwise noted. -4-2 0 2 4 6 8 10 12 14 16 18 20 22 24 Economic Outlook and Capital Markets Slow growth has characterized the current
Malaysia. abc. *Employed by a non-us affiliate of HSBC Securities (USA) Inc, and is not registered/qualified pursuant to FINRA regulations
 Inc, and is not registered/qualified pursuant to FINRA regulations") July 212 Neel Sinha* Head of Research, Southeast Asia The Hongkong and Shanghai Banking Corporation Limited, Singapore Branch +65 6658 658 neelsinha@hsbc.com.sg *Employed by a non-us affiliate of HSBC
July 212 Neel Sinha* Head of Research, Southeast Asia The Hongkong and Shanghai Banking Corporation Limited, Singapore Branch +65 6658 658 neelsinha@hsbc.com.sg *Employed by a non-us affiliate of HSBC
2018 Investment and Economic Outlook
 2018 Investment and Economic Outlook Presented 3/19/18 Jeffrey Neer, CFA Client Portfolio Manager 410-237-5592 jeffrey.neer@pnc.com 1 Monetary Policy: Key Factors Inflation U.S. U.S. Labor Market 2.4%
The Economic & Financial Outlook
 The Economic & Financial Outlook Beata Caranci SVP & Chief Economist TD Economics September 217 Key Themes Synchronized global economic acceleration has put monetary policy normalization in focus Canada
FOMC Stresses Importance of Data-Dependent Policy in October Minutes
 Economic Analysis FOMC Stresses Importance of Data-Dependent Policy in October Minutes Kim Fraser Chase The minutes from October s FOMC meeting revealed some further discussion on forward guidance and
The Global Economic Crisis: Asia and the role of China Elliott School of International Affairs, George Washington University March 31, 2009
 The Global Economic Crisis: Asia and the role of China Elliott School of International Affairs, George Washington University March 31, 29 Anoop Singh Asia and Pacific Department IMF 1 Five key questions