May 2015 FINANCIAL MARKET REVIEW
|
|
|
- Horatio Robinson
- 5 years ago
- Views:
Transcription

1 May 2015 FINANCIAL MARKET REVIEW Buena Vista Investment Management LLC 241 Third Street South Wisconsin Rapids, WI

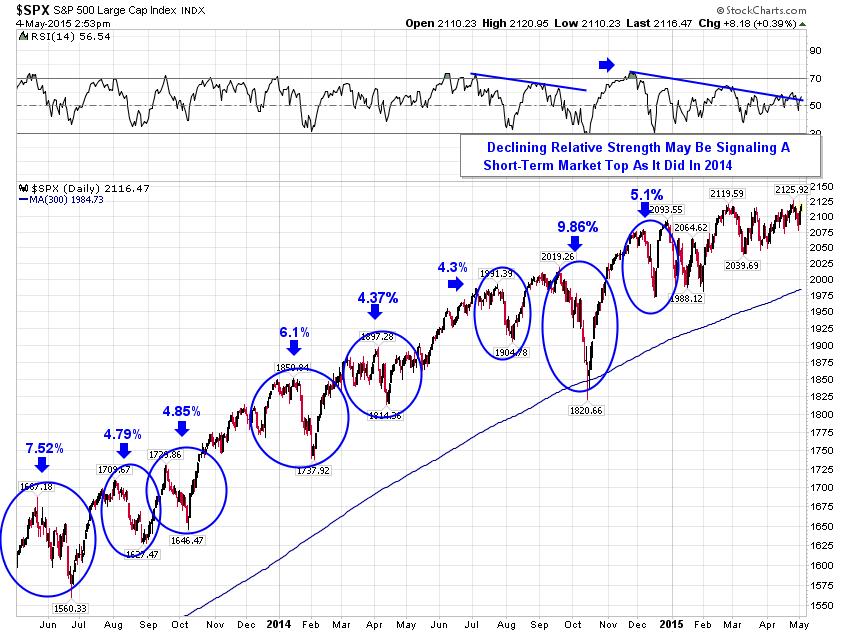
2 Volume 13 Issue 1 March 2015 MOVING TO A MORE DEFENSIVE POSTURE Anticipating More Volatility in 2015 In March 2009, six years ago, the title of our March newsletter read as follows: Confidence & Economic Activity Will Recover The Seeds of Economic Recovery are now in Place Since that time we have remained bullish on US equities as economic activity, corporate earnings and consumer confidence rebounded from their respective lows back in Over the last six years the S&P 500 stock index has produced double-digit gains in five out of the last six years, generating an average annual gain of 15%. Equally important is the fact that over that period of time the index has not had one negative year, with only 2011 s 0.00% not being a double-digit return. It has been a great run for equity investors over the last six years but we are now of the opinion that it is time to take a more defensive position in our portfolios. Our position is not driven by the opinion that the US economy is in bad shape or that we are heading into a recession. Our position on the US economy is the exact opposite. The US economy is one of the strongest in the world and economic activity, with the exception of the oil and gas industry, is exceptionally strong. If the US economy is healthy then why the change of opinion? As always with the stock market the answer is never simple. In this issue we will look at some of the reasons for putting our defensive team on the field. Expensive Valuations - We have seen basic stock market valuation measures such as price to book, price to cash flow, dividend yields and price/earnings ratios go from 25 year lows in 2009 to at or above their 25 year averages. Although valuations are not stretched to levels we saw in 2000 and could very well expand more in the short term, it is always better to buy stocks when valuations are at lower levels than today s valuations. (See on-line version of this newsletter for specific valuation information.) No Growth in Corporate Earnings - From the bottom in 2009, corporate earnings for companies in the S&P 500 have more than doubled due to improving sales and margins. Improving corporate earnings are always the foundation for a good stock market. But in 2015 we may be looking at a change in this dynamic, due to the fall in the price of oil and the strength of the US dollar. In the last half of 2014 the US dollar went on a tear in currency markets, rising over 20% against most currencies. This massive move will most likely negatively impact earnings results of US multinational companies in Also, during the first quarter we have seen analysts lowering earnings estimates for oil and gas companies, companies themselves lowering expectations for 2015 earnings, and small oil and gas companies filing for bankruptcy. So with large multinational companies and oil/gas companies facing a challenging environment in 2015, we could be in for a year with little to no earnings growth. This is already showing up as Wall Street market strategists are lowering earnings estimates according to Yardeni Research and Factset. (Over)
3 Moving to a More Defensive Posture as we Anticipate More Volatility The Fed Will Finally Raise Rates most likely will be the year that the Fed changes its easy money policies and begins to raise the Fed Funds rate. It is our position that we will finally see an increase in interest rates during This major change in market dynamics will ultimately be a positive for equities, as rising interest rates usually mean a better economy and higher corporate profits. While in the intermediate-term we think that rising interest rates should be good for our investment portfolios. In the short run markets will most likely respond negatively to a change in the accommodative policies of the Fed. Market Psychology - On a day to day basis, stock market movements don t always correlate exactly to what is happening economically or to the prospects of specific companies. Rather as Benjamin Graham and David Dodd pointed out in their 1934 book Security Analysis... The stock market is a voting machine rather than a weighing machine. It responds to factual data not directly but only as they affect the decision of buyers and sellers... While we consider ourselves intermediate-term investors we are aware of short-term market psychology and its impact on our investments. In recent months, a whole host of technical and fundamental market indicators have begun to weaken. This is evident in a number of indicators such as the Leuthold Major Trend Index, Investech s Negative Leadership Composite, advance/decline lines, relative strength numbers, recent weakness in the Dow Jones Transport Index, changes in margin debt to name few. (See on-line version of this newsletter for additional information on these indicators.) The Defensive Team - Taking volatility risk out of a portfolio can be accomplished in a number of different ways. Moving to a higher cash/money market position is the easiest and most effective way to reduce portfolio risk, As Steve Leuthold said... Cash is not trash as cash reserves provide the investor with ammunition to take advantage of opportunities... But cash is not the only member of the defensive team. In a diversified portfolio, we can purchase fixed income investments with a stated maturity or structured notes with a buffer percentage. We can also move to more defensive mutual funds. Dividend paying stocks may not be considered defensive in a traditional definition but in today s low income world, a 3% -5% yield looks attractive to us as investors, as we wait for or ride through a period of market volatility. As no one size fits all, investment portfolios will be tailored to fit client risk tolerances and personal preferences. As we enter the second quarter of 2015 we begin to move to a more defensive posture in our portfolios. For additional supporting data on this newsletter please see the Communications section of the Buena Vista Investment Management website. BUENA VISTA INVESTMENT MANAGEMENT LLC LONG-TERM MARKET INDICATORS Buena Vista Conservative Buy/Sell Discipline: Bullish (turned positive ) Leuthold Major Trend Index: Bullish (turned positive ) InvesTech Negative Leadership Composite: Neutral (turned neutral ) S&P 500 Stock Index: 2, (0.44% thru ) Dow Jones Total Market Index: 21, (1.32% thru ) Important Disclosure The performance numbers contained on this page are provided for informational purposes only. Returns may vary depending on personal objectives and timing of invested dollars. The performance numbers contained on this page are net of Buena Vista management fees and are based on investments held in a composite of accounts with like investment strategy. Contact Buena Vista Investment Management LLC for more specific information concerning performance and market data. Do not rely on this information to make investments. BUENA VISTA INVESTMENT MANAGEMENT LLC P.O. Box 1206 Wisconsin Rapids, WI buenavista@buenavistainv.com
4 Stock Valuation Measures: S&P 500 Index GTM U.S. 5 Equities U.S. Equity: Valuation Measures Historical Averages Valuation 1-year 5-year 10-year 25-year Measure Description Latest ago avg. avg. avg.* P/E Price to Earnings 16.9x 15.5x 13.6x 13.8x 15.7x CAPE Shiller's P/E Div. Yield Dividend Yield 1.9% 1.9% 2.0% 2.0% 2.1% REY Real Earnings Yield 3.9% 4.2% 5.0% 4.5% 2.9% P/B Price to Book P/CF Price to Cash Flow EY Spread EY Minus Baa Yield 1.4% 1.7% 2.2% 1.3% -0.6% 5 S&P 500 Index: Forward P/E Ratio 26x 24x 22x 20x 18x 16x 14x 12x 10x 8x Average: 15.7x +1 Std. Dev.: 19.0x -1 Std. Dev.: 12.4x Current: 16.9x '92 '94 '96 '98 '00 '02 '04 '06 '08 '10 '12 '14 S&P 500 Earnings Yield vs. Baa Bond Yield 2% '90 '92 '94 '96 '98 '00 '02 '04 '06 '08 '10 '12 '14 Source: Standard & Poor s, FactSet, Robert Shiller, FRB, J.P. Morgan Asset Management. Price to Earnings is price divided by consensus analyst estimates of earnings per share for the next 12 months. Shiller s P/E uses trailing 10-years of inflation adjusted earnings as reported by companies. Dividend Yield is calculated as the trailing 12-month average dividend divided by price. Real Earnings Yield is defined as (trailing four quarters of reported earnings/price) - year over year core CPI inflation. Price to Book Ratio is the price divided by book value per share. Price to Cash Flow is price divided by NTM cash flow. EY Minus Baa Yield is the forward earnings yield (consensus analyst estimates of EPS over the next 12 months divided by price) minus the Moody s Baa seasoned corporate bond yield. *P/CF is a 20-year avg. due to cash flow data availability. Data are as of March 31, % 12% 10% 8% 6% 4% S&P 500 Earnings Yield (Inverse of fwd. P/E): 5.9% Moody s Baa Yield: 4.5%
5 Corporate Profits and Leverage GTM U.S. 6 Equities S&P 500 Earnings Per Share Index quarterly operating earnings $31 $27 $23 2Q07: $ Q14*: $26.77 Profit Margins 11% 10% 9% 8% 7% 6% S&P 500 Operating EPS % of Sales per Share** After-Tax, Adj. Corp. Profits, % of GDP 4Q14*: 9.0% 4Q14: 8.7% $19 5% 4% '86 '91 '96 '01 '06 '11 $15 Total Leverage S&P 500, ratio of total debt to total equity, quarterly $11 220% 200% $7 180% $3 160% 140% 120% Average: 161% 1Q15: 103% -$1 '01 '02 '03 '04 '05 '06 '07 '08 '09 '10 '11 '12 '13 '14 100% 80% '96 '98 '00 '02 '04 '06 '08 '10 '12 '14 Source: BEA, Standard & Poor s, Compustat, FactSet, J.P. Morgan Asset Management. EPS levels are based on operating earnings per share. *Most recently available data is 4Q14, which is a Standard & Poor s estimate. **S&P 500 Operating EPS % of Sales per Share fell to 0% in 4Q2008 and is adjusted on the chart. Past performance is not indicative of future returns. Data are as of March 31,
6
7
8
9 Voya Investment Management Global Perspectives World Market Returns by Region USD Emerging market equity (EME) has often been a top performer but lagged in ific ex-japan and the EME are again market leaders this year, while Japan and -Ex-U.K. are the laggards EME EME EME Japan EME EME S&P 500 S&P % 29.6% 34.5% 36.4% 39.8% -29.1% 79.0% 19.2% 2.1% 21.7% 32.4% 11.8% EME Japan S&P 500 UK 47.0% 26.0% 25.6% 33.2% 31.7% -37.0% 73.0% 17.1% -2.5% 18.7% 28.7% 10.9% EME UK Japan S&P 500 Japan S&P % 22.4% 14.8% 32.6% 17.5% -45.0% 43.4% 15.6% -12.7% 15.0% 27.3% 9.9% Japan UK UK UK UK S&P 500 Japan EME UK UK 36.2% 19.6% 11.3% 30.7% 8.4% -48.3% 33.9% 15.1% -14.2% 13.1% 20.7% 4.3% UK Japan UK S&P 500 S&P 500 EME S&P 500 UK UK 32.1% 16.0% 7.4% 15.8% 5.5% -47.1% 26.5% 8.8% -14.5% 13.0% 5.6% 1.5% EME International S&P 500 S&P 500 S&P 500 Japan Japan Japan EME Japan EME Japan 28.7% 10.9% 4.9% 6.3% -4.1% -50.0% 6.4% 2.4% -18.2% 2.9% -2.3% -0.8% Note: All data are based on equity indexes for each regional or country index and are total returns including dividends for each calendar year or partial year. Source: MSCI, Standard & Poor s, FactSet 47
10 Voya Investment Management Global Perspectives Global Stock Fundamentals Emerging market equities appear to offer competitive profitability and balance sheet strength with valuations at or below those of S&P 500 and EAFE stocks. Valuation S&P 500 MSCI EAFE MSCI Emerging Markets P/E (next fiscal year estimated earnings) Price to Book Ratio Price to Cash Flow Ratio Price to Sales Ratio Profitability Return on Equity (ROE) % Balance Sheet Strength Long-term Debt to Capital Ratio % International Note: Valuation and Profitability figures are weighted harmonic averages, a statistical technique that reduces the effects of extreme outlying data on the average. Long-term Debt to Capital figures are weighted averages. Source: FactSet 53

11 Economic Growth and the Composition of GDP Real GDP Year-over-year % chg 10% Real GDP 2Q14 Components of GDP 2Q14 nominal GDP, trillions USD $18 3.2% Housing 8% YoY % chg: 2.6% QoQ % chg: 4.6% $ % Investment Ex-housing Econom my 6% 4% 2% Average: 3.0% $14 $12 $10 $8 18.3% Gov t Spending 0% $6 68.5% Consumption -2% -4% Expansion Average: 2.2% -6% '65 '70 '75 '80 '85 '90 '95 '00 '05 '10 Source: BEA, FactSet, J.P. Morgan Asset Management. Values may not sum to 100% due to rounding. Quarter over quarter percent changes are at an annualized rate. Average represents the annualized growth rate for the full period. Expansion average refers to the period starting in the second quarter of Guide to the Markets U.S. Data are as of 9/30/14. $4 $2 $0 -$2-3.2% Net Exports 17


12
December 2014 FINANCIAL MARKET REVIEW
 December 2014 FINANCIAL MARKET REVIEW Buena Vista Investment Management LLC 241 Third Street South Wisconsin Rapids, WI 54494 715-422-0700 http://buenavistainv.com December 2014 Why Portfolios Remain Diversified
BUENA VISTA INVESTMENT MANAGEMENT
 BUENA VISTA INVESTMENT MANAGEMENT FOURTH QUARTER 2015 FINANCIAL MARKET REVIEW Buena Vista Investment Management LLC P.O. Box 1206 241 3 rd Street South Wisconsin Rapids, WI 54495-1206 715-422-0700 buenavistainv@buenavistainv.com
JPMorgan American Investment Trust plc Annual General Meeting. 13 May 2015
 JPMorgan American Investment Trust plc Annual General Meeting 13 May 2015 Agenda Performance Review Current Economic and Market Data Current Asset Allocation and Fund Structure 1 2014 Results NAV return
ECONOMIC AND MARKET COMMENTARY OUR MISSION
 ECONOMIC AND MARKET COMMENTARY OUR MISSION Smith Shellnut Wilson is a registered investment adviser* specializing in managing investment portfolios for banks, individuals, corporations, foundations and
MARKET VOLATILITY DOMINATES INVESTMENT MARKETS Building Portfolios to Cope with Volatility
 MARKET VOLATILITY DOMINATES INVESTMENT MARKETS Building Portfolios to Cope with Volatility Volume 14 Issue 2 June 2016 Volatility has certainly dominated the investment landscape in 2016. The first two
Quarterly Update. Jessica Burbrink, CFP, CTFA. Clayton Bill, CFA. Kathy Clark. Andrew Heck, JD, CTFA, CFIRS
 Quarterly Update Jessica Burbrink, CFP, CTFA Clayton Bill, CFA Kathy Clark Andrew Heck, JD, CTFA, CFIRS RATE OF RETURN (%) Capital markets PERIODS ENDING DECEMBER 2017 Capital Market Returns 40 37.3 30
J.P. Morgan Asset Management US Investment Range
 FOR PROFESSIONAL CLIENTS ONLY NOT FOR RETAIL USE OR DISTRIBUTION. J.P. Morgan Asset Management US Investment Range A century of experience in J.P. Morgan s home market Investing with J.P. Morgan Asset
2Q Commencement: A Guide to the Markets. David Kelly, Chief Global Strategist, JPMorgan Funds
 FOR INSTITUTIONAL USE ONLY NOT FOR PUBLIC DISTRIBUTION 2Q 2013 Commencement: A Guide to the Markets David Kelly, Chief Global Strategist, JPMorgan Funds Summary Even at new all-time highs the stock market
CAPITAL MARKETS REVIEW
 CAPITAL MARKETS REVIEW Reviewing the quarter ended June 30, 2017 Patrick H. Yanke, CFP 3737 Glenwood Ave, Ste 100 // Raleigh, NC 27612 800-513-2812 // patrick.yanke@yankefinancial.com // www.yankefinancial.com
Playing The Bull Market s Final Inning(s)
") Playing The Bull Market s Final Inning(s) Douglas Ramsey, CFA, CMT Mid-September 2013 FOR PROFESSIONAL USE ONLY. FURTHER DISTRIBUTION OF THE INFORMATION CONTAINED HEREIN IS PROHIBITED WITHOUT PRIOR PERMISSION.
Playing The Bull Market s Final Inning(s) Douglas Ramsey, CFA, CMT Mid-September 2013 FOR PROFESSIONAL USE ONLY. FURTHER DISTRIBUTION OF THE INFORMATION CONTAINED HEREIN IS PROHIBITED WITHOUT PRIOR PERMISSION.
How to Earn Double-Digit Returns While Avoiding Major Down Markets in a Safety-First Approach
 AAII Orange County Chapter Meeting Saturday April 27, 2013 How to Earn Double-Digit Returns While Avoiding Major Down Markets in a Safety-First Approach 9:00 10:30 Presentation 10:30 o 11:00 Q&A Today
Market Bulletin. 1Q15 Earnings season recap: The value of a dollar. May 13, In Brief. Summary
 Market Bulletin May 13, 2015 1Q15 Earnings season recap: The value of a dollar James C. Liu, CFA Executive Director Global Market Strategist Abigail B. Dwyer Market Analyst In Brief We estimate that first
The Bull Market: Six Years Old And Not Over
 The Bull Market: Six Years Old And Not Over April 22-24, 2015 FOR PROFESSIONAL USE ONLY. FURTHER DISTRIBUTION OF THE INFORMATION CONTAINED HEREIN IS PROHIBITED WITHOUT PRIOR PERMISSION. Disclosures This
Capital Markets Outlook 100 LOWDER BROOK DRIVE SUITE 1100 WESTWOOD MA FAX
 M E K E T A I N V E S T M E N T G R O U P 00 LOWDER BROOK DRIVE SUITE 00 WESTWOOD MA 02090 78 47 3500 FAX 78 47 34 Investors are faced with three primary issues in the near-term: ) historically low bond
As of December 31, Guide to the Markets
 1Q 2013 As of December 31, 2012 Guide to the Markets Table of Contents EQUITIES ECONOMY FIXED INCOME INTERNATIONAL ASSET CLASS 4 16 34 42 55 U.S. Market Strategy Team Dr. David P. Kelly, CFA david.p.kelly@jpmorgan.com
Capital Market Review
 Capital Market Review September 3, 215 Percent Percent MARKET/ECONOMIC OVERVIEW Risk Reprices Rapidly 2,2 1,9 1,6 1,3 S&P 5 April 29, 211 to Oct 3, 211 157 Days -19.4% May 21, 215 to Sep 3, 215 132 Days
THE SKINNY. CG s Market Commentary
 THE SKINNY CG s Market Commentary Third Quarter 2016 THE SKINNY Third Quarter 2016 U.S. EQUITY MARKETS ENDED SEPTEMBER WITH MIXED RESULTS. The Dow Jones Industrial Average posted a 0.41% loss for the month,
Economic and Market Outlook
 Economic and Market Outlook Third Quarter 2018 Investment Products: Not FDIC Insured No Bank Guarantee May Lose Value Past performance is no guarantee of future results. Financial term and index definitions
Taking Stock of the Market s Mood
 LEADERSHIP SERIES JUNE 2017 A feature article from our U.S. partners Taking Stock of the Market s Mood International stocks continue to outperform, while U.S. equity returns may be choppy and more subdued
Quarterly Asset Class Report Global Equity
 Quarterly Asset Class Report Global Equity canterburyconsulting.com Canterbury Consulting ( CCI ) is an SEC registered Investment Adviser. Information pertaining to CCI's advisory operations, services,
Quarterly Asset Class Report Global Equity
 Quarterly Asset Class Report Global Equity canterburyconsulting.com Canterbury Consulting ( CCI ) is an SEC registered Investment Adviser. Information pertaining to CCI's advisory operations, services,
Economic and Market Outlook
 Economic and Market Outlook Fourth Quarter 2018 Investment Products: Not FDIC Insured No Bank Guarantee May Lose Value Past performance is no guarantee of future results. Financial term and index definitions
Third Quarter Market Review
 Third Quarter Market Review The S&P 500 continued its winning streak, with the index appreciating in value by 3.96% for the quarter (see chart below). This market barometer was up all three months of the
Lazard Asset Management Factor Report SEP Factor Returns¹ (%)
") Lazard Asset Management Factor Report SEP 8 The global equity markets posted a positive month in August as corporate earnings continued to outpace expectations and earlier fears of inflation abated. The
Lazard Asset Management Factor Report SEP 8 The global equity markets posted a positive month in August as corporate earnings continued to outpace expectations and earlier fears of inflation abated. The
JPM US Equity Income Fund
 J.P. Morgan Asset Management Investment Summit 2016 JPM US Equity Income Fund HALF IMAGE PLACEMENT HOLDER (HORIZONTAL) Resize image to cover grey box Clare Hart, Managing Director, Portfolio Manager #JPMsummit
Global Market Overview
 First Quarter 219 First Quarter 219: March Madness, or Just an Incredible Rebound? Global Market Overview MSCI All Country World S&P Russell 2 MSCI EAFE MSCI Emerging Markets MSCI ACWI ex USA Small BBgBarc
Prudential International Investments Advisers, LLC. Global Investment Strategy October 2009
 Prudential International Investments Advisers, LLC. Global Investment Strategy October 2009 By John Praveen, Chief Investment Strategist For Market Commentary Interviews Contact: Lisa Villareal, 973-367-2503/lisa.villareal@prudential.com
INTERNATIONAL EQUITIES
 2018 Global Market Outlook Press Briefing INTERNATIONAL EQUITIES Justin Thomson Portfolio Manager, CIO, Equity November 14, 2017 FOR 2018 GLOBAL MARKET OUTLOOK PRESS BRIEFING. PROVIDED TO DESIGNATED MEMBERS
Navigating the New Environment
 Navigating the New Environment May 12, 2018 by Liz Ann Sonders, Jeffrey Kleintop & Brad Sorensen of Charles Schwab Key Points U.S. stock indexes have rebounded from their correction lows, although remain
QUARTERLY MARKET UPDATE January 2019
 Year-End Market Reversal Symbol Name 2018 Return (%) AGG ishares Core US Aggregate Bond ETF 0.0 HYG ishares iboxx $ High Yield Corp Bd ETF -1.9 LQD ishares iboxx $ Invmt Grade Corp Bd ETF -3.8 SPY SPDR
Table 1: Economic Growth Measures
 US Equities continued to advance in the second quarter, with the S&P 500 returning 5.2% for the quarter and 7.1% for the first half. Energy was by far the best performing sector in the quarter, returning
SHAMBLING FORWARD. 02/13/2014 WORLD POPULATION 2 WALL STREET, MAIN STREET, AND CAPITOL HILL: AN ECONOMIC UPDATE
 SHAMBLING FORWARD. WALL STREET, MAIN STREET, AND CAPITOL HILL: AN ECONOMIC UPDATE Shamble: To walk in an awkward, lazy, or unsteady manner, shuffling the feet FEBRUARY 12, 2014 David B. Hanson, CPA, CFA
Finding Value in US Equities
 Investment Research Finding Value in US Equities Nicholas Sordoni, CFA, Director, Portfolio Manager/Analyst Following strong performance in recent years, US equities may not be the most obvious asset class
Market Snapshot. Liz Ann Sonders Senior Vice President Chief Investment Strategist Charles Schwab & Co., Inc. December, 2014
 Market Snapshot Liz Ann Sonders Senior Vice President Chief Investment Strategist Charles Schwab & Co., Inc. December, 2014 GDP s components and latest reading % of real GDP 2Q14 annualized Q/Q % change
Market Review and Outlook. Todd Centurino, CFA
 Market Review and Outlook Todd Centurino, CFA Q1 2017 Global Economy: On the Upswing Ranked Returns (%) Emerging Market Equities 11.40 European Equities 7.40 US Equities 6.10 Global Bonds 2.00 US Treasuries
Comparative Profile. Style Map. Managed Account Select
 Comparative Profile Managed Account Select Quarterly Highlights The S&P 500 Index was virtually flat in the second quarter, gaining 0.10% as concerns about the end of the Federal Reserve s QE2 program,
PCA INVESTMENT MARKET RISK METRICS. Monthly Report
 PCA INVESTMENT MARKET RISK METRICS Monthly Report June 2017 Takeaways Equity volatility measure (VIX) ended the month at extremely low levels, lowest since the global financial crisis, after a brief inter-month
Market Outlook As of March 4, 2016
 Financial & Investment Newsletter Market Outlook As of March 4, 2016 By George M. Hiller JD, LLM, MBA, CFP The 7-year old bull market, got off to a rocky start in early 2016 moving into correction territory,
ACG Market Review. Second Quarter Global Highlights: Economy Announced tariffs have so far failed to slow down economic activity
 ACG Market Review Second Quarter 2018 Global Highlights: Economy Announced tariffs have so far failed to slow down economic activity Equities U.S. equites turn positive for the year backed by strong corporate
OUT OF THE WOODS? COMMENTARY STRONG FUNDAMENTALS KEY TAKEAWAYS LPL RESEARCH WEEKLY MARKET. February
 LPL RESEARCH WEEKLY MARKET COMMENTARY February 20 2018 OUT OF THE WOODS? John Lynch Chief Investment Strategist, LPL Financial Jeffrey Buchbinder, CFA Equity Strategist, LPL Financial KEY TAKEAWAYS Stocks
All-Country Equity Allocator February 2018
 Leila Heckman, Ph.D. lheckman@dcmadvisors.com 917-386-6261 John Mullin, Ph.D. jmullin@dcmadvisors.com 917-386-6262 Charles Waters cwaters@dcmadvisors.com 917-386-6264 All-Country Equity Allocator February
BCA 4Q 2018 Review and 2019 Outlook Russ Allen, CIO. Summary Outlook
 BCA 4Q 2018 Review and 2019 Outlook Russ Allen, CIO Summary Outlook January 15, 2019 Markets in 2019 will be choppy with volatility more like this past year than the placid trading of 2017. The Fed is
Stock Rover Profile Metrics
 Stock Rover Profile Metrics Average Volume (3m) The average number of shares traded per day over the past 3 months. Company Unit: Name The full name of the company. Employees The number of direct employees.
The Linhart Group Second Half 2017 Outlook. GIC Slides
 The Linhart Group Second Half 2017 Outlook GIC Slides S&P 500 Sectors YTD 2017 Total Return Energy Telecom -12.6% -10.7% Real Estate Financials Staples Utilities Materials Industrials Discretionary 6.4%
Economic Outlook in 2010
 Economic Outlook in 2010 Presented to: Institute of Internal Auditors April 1, 2010 Harvey Rosenblum Executive Vice President & Director of Research Jessica Renier Senior Economic Analyst Federal Reserve
Lazard Asset Management Factor Report NOV Factor Returns¹ (%)
") Lazard Asset Management Factor Report NOV 8 October lived up to its notorious reputation as the global equity markets suffered through their worst month in over seven years as every developed market declined
Lazard Asset Management Factor Report NOV 8 October lived up to its notorious reputation as the global equity markets suffered through their worst month in over seven years as every developed market declined
Capital Market Outlook Q4 2017
 It amazes me how people are often more willing to act based on little or no data than to use data that is a challenge to assemble. - Robert Shiller Summary Capital Market Outlook Q4 207 The Yale Nobel
MAY 2018 Capital Markets Update
 MAY 2018 Market commentary U.S. ECONOMICS The U.S. added 223,000 jobs to payrolls in May, well above the consensus estimate of 180,000 and the expansion average of around 200,000. Sector job gains were
Financial Market Outlook: Stock Rally Continues with Faster & Stronger GDP Rebound, Earnings Recovery & Liquidity
 For Market Commentary Interviews Contact: Lisa Villareal, 973-367-2503/lisa.villareal@prudential.com Financial Market Outlook & Strategy: Further Stock Gains with Macro Sweet Spot & Earnings Recovery.
Capital Markets: Observations and Insights Earnings Resurgence Spring 2017
 Capital Markets: Observations and Insights Earnings Resurgence Spring 2017 Key Observations After diverging in 2016, fundamentals once again drove performance in 1Q17 There is a resurgence in earnings
U.S. Equities Outlook Will the Secular Bull Run Continue?
 December 14, 217 U.S. Equities Outlook Will the Secular Bull Run Continue? Moderated by: Chuck Alberton, CFA, CAIA Managing Director, Senior Portfolio Manager Presented by: Tom Galvin Managing Director,
The Puget Sound Group Quarterly Newsletter June 2014
 The Puget Sound Group Quarterly Newsletter June 2014 It isn t what you earn it is what you keep that matters in investing. While systematically underwriting too little risk may mean that you do not earn
The Asia Pacific Fund, Inc.
 Baring Asset Management (Asia) Limited 19th Floor Edinburgh Tower 15 Queen s Road Central Hong Kong Tel: (852) 2841 1411 Fax: (852) 2868 411 The Asia Pacific Fund, Inc. Investment Outlook & Strategy www.asiapacificfund.com
MARKET INSIGHTS. Guide to the Markets. U.S. 3Q 2018 As of June 30, 2018
 MARKET INSIGHTS Guide to the Markets U.S. 3Q 2018 As of June 30, 2018 Global Market Insights Strategy Team 2 Dr. David Kelly, CFA New York David Lebovitz New York Dr. Cecelia Mundt New York Gabriela Santos
Market Outlook By Mark Connolly, Principal, New Castle Investment Advisors, LLC. Prepared January 15, 2018
 Prepared January 15, 2018 Market Outlook 2018 By Mark Connolly, Principal, New Castle Investment Advisors, LLC Last year s stock market performance was nothing less than spectacular. The Dow Jones Industrial
The Year of the Snake: Investing in a Rising Rate Environment
 The Year of the Snake: Investing in a Rising Rate Environment Duncan W. Richardson, CFA Chief Equity Investment Officer 13 th February 2013 1 Inflation Deflation 2 Depressing Cycle 3 Source: Baseline as
MARKET INSIGHTS. Guide to the Markets. U.S. 2Q 2016 As of March 31, 2016
 MARKET INSIGHTS Guide to the Markets U.S. 2Q 2016 As of March 31, 2016 Global Market Insights Strategy Team GTM U.S. 2 Americas Europe Asia Dr. David P. Kelly, CFA New York Andrew D. Goldberg New York
1st INVESTMENT MANAGEMENT UPDATE. Investment Outlook Cautious optimism follows extraordinary year
 INVESTMENT MANAGEMENT UPDATE A QUARTERLY NEWSLETTER FROM BREMER ASSET MANAGEMENT 1st 2018 Investment Outlook Cautious optimism follows extraordinary year Beyond Stocks and Bonds How alternative assets
Investment Market Risk Metrics August 2011
 Investment Market Risk Metrics August 2011 Takeaways Data is as of Monday August 8, 2011 Interest rate risk increased to levels not seen since Dec 2008 Equity market volatility spiked after U.S. Treasury
All-Country Equity Allocator July 2018
 Leila Heckman, Ph.D. lheckman@dcmadvisors.com 917-386-6261 John Mullin, Ph.D. jmullin@dcmadvisors.com 917-386-6262 Allison Hay ahay@dcmadvisors.com 917-386-6264 All-Country Equity Allocator July 2018 A
Capital Markets: Observations and Insights Searching for Yield and Asking for Trouble? As of June 30, 2016
 Capital Markets: Observations and Insights Searching for Yield and Asking for Trouble? As of June 30, 2016 Key Observations Strong bond performance has supported bond-like equities and hurt growth stocks
First Quarter 2017 Investment Review. Prepared by: Meketa Investment Group CHICAGO, IL (312)
") First Quarter 2017 Investment Review Prepared by: Meketa Investment Group CHICAGO, IL 60661 (312) 474-0900 MARKET SUMMARY - 1Q17 CAPITAL MARKETS Index MARKET SNAPSHOT MARCH 31, 2017 Qtr One Year Three
First Quarter 2017 Investment Review Prepared by: Meketa Investment Group CHICAGO, IL 60661 (312) 474-0900 MARKET SUMMARY - 1Q17 CAPITAL MARKETS Index MARKET SNAPSHOT MARCH 31, 2017 Qtr One Year Three
MARKET INSIGHTS. Guide to the Markets. U.S. 4Q 2015 As of September 30, 2015
 MARKET INSIGHTS Guide to the Markets U.S. 4Q 2015 As of September 30, 2015 Global Market Insights Strategy Team GTM U.S. 2 Americas Europe Asia Dr. David P. Kelly, CFA New York Andrew D. Goldberg New York
Emerging markets the equities perspective. Scott Berg, T. Rowe Price
 Emerging markets the equities perspective Scott Berg, T. Rowe Price Audience voting about to begin Proudly supported by our Gold Industry Partner Question What is your fund's weight in Emerging Markets?
Capital Market Outlook Q3 2017
 Economic progress, in capitalist society, means turmoil Josef A. Schumpeter Summary Capital Market Outlook Q 207 We are not sure that the economist and long time Harvard professor envisaged the type of
Five years into the crisis. Is the world more stable or more unstable? Page 2 I Dublin, June 2013 Pioneer Investment Conference.
 Five years into the crisis. Is the world more stable or more unstable? Page 2 I Dublin, June 2013 Pioneer Investment Conference. % of GDP The Debt Issue in Developed Markets Developed Markets Debt-to-GDP
SunTrust Advisory Services, Inc. Market Perspective The Pain Trade. Keith Lerner, CFA, CMT Director, Chief Market Strategist March 6, 2017
 SunTrust Advisory Services, Inc. Market Perspective The Pain Trade Keith Lerner, CFA, CMT Director, Chief Market Strategist March 6, 2017 The Pain Trade Far more money has been lost by investors preparing
Investment Research Team Update
 Economic & Market Commentary Market Update February 2015 February was a great month for global stocks! The S&P 500 ( large cap stocks) was up 5.7% and small stocks (Russell 2000) gained 5.9%. The jobs
Have We Hit An Inflection Point?
 Insights may 2016 Have We Hit An Inflection Point? William w. Priest, cfa Chief Executive Officer, Co-Chief Investment Officer & Portfolio Manager David N. Pearl Executive Vice President, Co-Chief Investment
UNDERSTANDING THE STOCK MARKET CORRECTION
 UNDERSTANDING THE STOCK MARKET CORRECTION EmergingWealth Investment Management, Inc. 5700 Corporate Drive, Suite 360 Pittsburgh, PA 15237-5829 Phone: (412) 548-1386 E-mail: wealth@emergingwealth.com Legend
California Association of Joint Powers Authorities
 California Association of Joint Powers Authorities Economic Update April 28, 2016 Scott Prickett, CTP EVP, Portfolio Strategist CHANDLER ASSET MANAGEMENT info@chandlerasset.com chandlerasset.com 800.317.4747
Solid Sales Growth and Margins At New Highs Drive 3Q17 Results
 Solid Sales Growth and Margins At New Highs Drive 3Q17 Results November 14, 2017 by Urban Carmel of The Fat Pitch Summary: For the third quarter (3Q17), S&P earnings rose 12% yoy, sales grew 6% and profit
Insights. Location, Location, Location
 February 2016 UNCERTAINTY = OPPORTUNITY Location, Location, Location Richard Bernstein, Chief Executive and Chief Investment Officer Richard Bernstein Advisors Richard Bernstein Advisors LLC (RBA) is an
The Multiple Mystery: At what P/E should the market trade?
 October 1, 2009 United States: Portfolio Strategy US Equity Views The Multiple Mystery: At what P/E should the market trade? Investor focus has shifted from earnings to valuation. We are now most often
Emerging Market Equities SPRING The Current Opportunity SBH INTERNATIONAL EQUITY TEAM WHITE PAPER
 Emerging Market Equities The Current Opportunity SPRING 2017 SBH INTERNATIONAL EQUITY TEAM WHITE PAPER KEY POINTS Emerging market (EM) equities have offered significant return and diversification potential
Raymond James & Associates, Inc., member New York Stock Exchange/SIPC
 Kevin W. Byrne, CTFA, CIMA Senior Vice President, Investments Kevin.Byrne@RaymondJames.com October 20 th, 2016 BCM Q3-2016 Market and Economic Review Economic Review: GDP: Real GDP increased at an annual
Trailing PE Forward PE Buy 13 Analysts. 1-Year Return: 5.0% 5-Year Return: 115.5%
 ALGONQUIN POWER & UTILITIES (-T) Last Close 13.75 (CAD) Avg Daily Vol 950,518 52-Week High 14.40 Trailing PE 25.9 Annual Div 0.67 ROE 7.0% LTG Forecast 6.1% 1-Mo 3.3% September 21 TORONTO Exchange Market
The Compelling Case for Value
 The Compelling Case for Value July 2, 2018 SOLELY FOR THE USE OF INSTITUTIONAL INVESTORS AND PROFESSIONAL ADVISORS 0 Jan-75 Jan-77 Jan-79 Jan-81 Jan-83 Jan-85 Jan-87 Jan-89 Jan-91 Jan-93 Jan-95 Jan-97
Fresno County Employees' Retirement Association
 Fresno County Employees' Retirement Association Investment Performance Review Period Ending: December 31, 2006 999 Third Avenue, Suite 3650 2321 Rosecrans Avenue, Suite 2250 Seattle, Washington 98104 El
Profit Margins Expand to New Highs to Boost 2Q17 Results
 Profit Margins Expand to New Highs to Boost 2Q17 Results August 7, 2017 by Urban Carmel of The Fat Pitch Summary: The headline numbers for 2Q17 financial reports are good: S&P profits are up 19% yoy; sales
October Stock Indexes September 2009 Market Indexes September S&P 500 Index +3.6% +17.0% HFRX Global Hedge Fund Index +2.2% +11.
 October 2009 Dear Investor, In September, stocks continued modestly higher, both in the US and globally. There have been a few notable exceptions to the gains, as stock indexes in China and Japan (among
Table Of Contents. Table Of Contents. OAK ASSOCIATES, ltd.
 Table Of Contents Table Of Contents Tables A: Scenarios 1 B & C: S&P Earnings Forecasts 2 D & E: Top 12 & Bottom 12 3 F: S&P Industry Overweights 4 G: S&P Industry Underweights H: S&P Industry Performance
Top 10 Reasons This Remains A Misunderstood and Underutilized Asset Class. Please see last page for important disclosures.
 18 INTERNATIONAL SMALL CAP Top 10 Reasons This Remains A Misunderstood and Underutilized Asset Class Please see last page for important disclosures. 1 INTERNATIONAL INVESTING IS RISKY. 2 INTERNATIONAL
Market Expects 6% CAIGR (Cyclically Adjusted Implied Growth Rate) Dr. G. Kevin Spellman, CFA Coach Investing.com Date: 2/21/17
 Dr. G. Kevin Spellman, CFA Coach Investing.com Date: 2/21/17") 1/97 2/98 3/99 4/ /1 6/2 7/3 8/4 9/ /6 11/7 12/8 1/ 2/11 3/12 4/13 /14 6/1 7/16 9/16 3/1 9/13 3/12 9/ 3/9 9/7 3/6 9/4 3/3 9/1 3/3 9/98 3/97 9/9 3/94 9/92 3/91 9/89 Market Expects 6% CAIGR (Cyclically Adjusted
1/97 2/98 3/99 4/ /1 6/2 7/3 8/4 9/ /6 11/7 12/8 1/ 2/11 3/12 4/13 /14 6/1 7/16 9/16 3/1 9/13 3/12 9/ 3/9 9/7 3/6 9/4 3/3 9/1 3/3 9/98 3/97 9/9 3/94 9/92 3/91 9/89 Market Expects 6% CAIGR (Cyclically Adjusted
Vanguard economic and market outlook for 2018: Rising risks to the status quo. Vanguard Research December 2017
 Vanguard economic and market outlook for 2018: Rising risks to the status quo Vanguard Research December 2017 Market consensus has finally embraced the low secular trends Note: The Group of Seven (G7)
Financial Market Outlook: Further Stock Gain on Faster GDP Rebound and Earnings Recovery. Year-end Target Raised
 For Market Commentary Interviews Contact: Lisa Villareal, 973-367-2503/lisa.villareal@prudential.com Financial Market Outlook & Strategy: FurtherStock Gains Likely, Year-end Target Raised. Bond Under Pressure
Malaysia. abc. *Employed by a non-us affiliate of HSBC Securities (USA) Inc, and is not registered/qualified pursuant to FINRA regulations
 Inc, and is not registered/qualified pursuant to FINRA regulations") July 212 Neel Sinha* Head of Research, Southeast Asia The Hongkong and Shanghai Banking Corporation Limited, Singapore Branch +65 6658 658 neelsinha@hsbc.com.sg *Employed by a non-us affiliate of HSBC
July 212 Neel Sinha* Head of Research, Southeast Asia The Hongkong and Shanghai Banking Corporation Limited, Singapore Branch +65 6658 658 neelsinha@hsbc.com.sg *Employed by a non-us affiliate of HSBC
52-Week High Trailing PE Week Low Forward PE Hold 13 Analysts. 1-Year Return: -13.7% 5-Year Return: 52.
 COGECO COMMUNICATIONS INC (-T) Last Close 68.26 (CAD) Avg Daily Vol 83,763 52-Week High 95.21 Trailing PE 9.3 Annual Div 1.90 ROE 21.7% LTG Forecast 1.5% 1-Mo -3.4% 2018 May 01 TORONTO Exchange Market
Chapter 7. Analyzing Common Stocks. Security Analysis. Top-Down Approach Kaplan Financial
 Chapter 7 Analyzing Common Stocks Security Analysis Process of gathering, organizing, and using information to determine the intrinsic value of a common stock. Intrinsic value is the underlying or inherent
ASIA EX JAPAN: NEITHER BOOM NOR DOOM
 2016 Global Market Outlook Press Briefing ASIA EX JAPAN: NEITHER BOOM NOR DOOM Anh Lu Portfolio Manager (Asia ex Japan Equity Strategy) The Good news, the Bad News, Our Outlook The Good News Not a crisis
Key takeaways. What it may mean for investors FIRST A NALYSIS NEWS OR EVENTS T HAT MAY AFFECT Y OUR INVESTMENTS. Global Investment Strategy Team
 FIRST A NALYSIS NEWS OR EVENTS T HAT MAY AFFECT Y OUR INVESTMENTS Global Investment Strategy Team February 5, 2018 Market Sell-off What Investors Need to Know Now Key takeaways» A swift climb in the 10-year
INVESTMENT MARKET UPDATE UBC FACULTY PENSION PLAN
 INVESTMENT MARKET UPDATE UBC FACULTY PENSION PLAN MIKE LESLIE, FACULTY PENSION PLAN NEIL WATSON, LEITH WHEELER FEBRUARY 11, 2015 Presenters Mike Leslie Executive Director, Investments Faculty Pension Plan
Emerging market equities: Bounce or breakout?
 FOR INSTITUTIONAL/WHOLESALE/PROFESSIONAL CLIENTS AND QUALIFIED INVESTORS ONLY NOT FOR RETAIL USE OR DISTRIBUTION Emerging market equities: Bounce or breakout? Emerging Market Strategy 2Q 216 IN BRIEF The
2014 Mid-Year Market Outlook
 2014 Mid-Year Market Outlook Moving Into a New Phase 2014 MID-YEAR MARKET OUTLOOK Since the end of the Great Recession, economists have repeatedly predicted that the United States would soon step onto
Economic, Business & Markets Focus on Investors
 1//13 Economic, Business & Markets Focus on Investors John Augustine, CFA Chief Economic & Market Strategist Fifth Third Bank November 13 Fifth Third Bank All Rights Reserved Fifth Third Bank Overview
U.S. Debt Tops $20 Trillion - Stocks Soar To Record Highs
 U.S. Debt Tops $20 Trillion - Stocks Soar To Record Highs September 20, 2017 by Gary Halbert of Halbert Wealth Management 1. National Debt Tops $20 Trillion, Equal to 107% of GDP 2. Debt Held by the Public
Rebalancing International Equities: What to Know. What to Consider.
 Success Should Not Be Cyclical Perspective Rebalancing International Equities: What to Know. What to Consider. Executive Summary Diversified investors may be frustrated by the underperformance of their
Mike Leslie, Faculty Pension Plan David Ayriss, Leith Wheeler
 Investment Market Update UBC Faculty Pension Plan Mike Leslie, Faculty Pension Plan David Ayriss, Leith Wheeler February 6, 2013 Agenda Introductions Investment Market Update Balanced Fund Equity Exposure
Trailing PE Forward PE Buy 4 Analysts. 1-Year Return: 9.8% 5-Year Return: 573.1%
 MAGELLAN AEROSPACE CORP (-T) Last Close 21.00 (CAD) Avg Daily Vol 22,979 52-Week High 21.39 Trailing PE 11.9 Annual Div 0.34 ROE 16.6% LTG Forecast -- 1-Mo 8.7% November 30 TORONTO Exchange Market Cap
ASSET ALLOCATION REPORT
 2018 ASSET ALLOCATION REPORT INTRODUCTION We invite you to review Omnia Family Wealth s 2018 report on expected asset class returns for the next 10 years. While we believe these forecasts reflect a reasonable