ASSET ALLOCATION REPORT
|
|
|
- Ambrose McDaniel
- 5 years ago
- Views:
Transcription
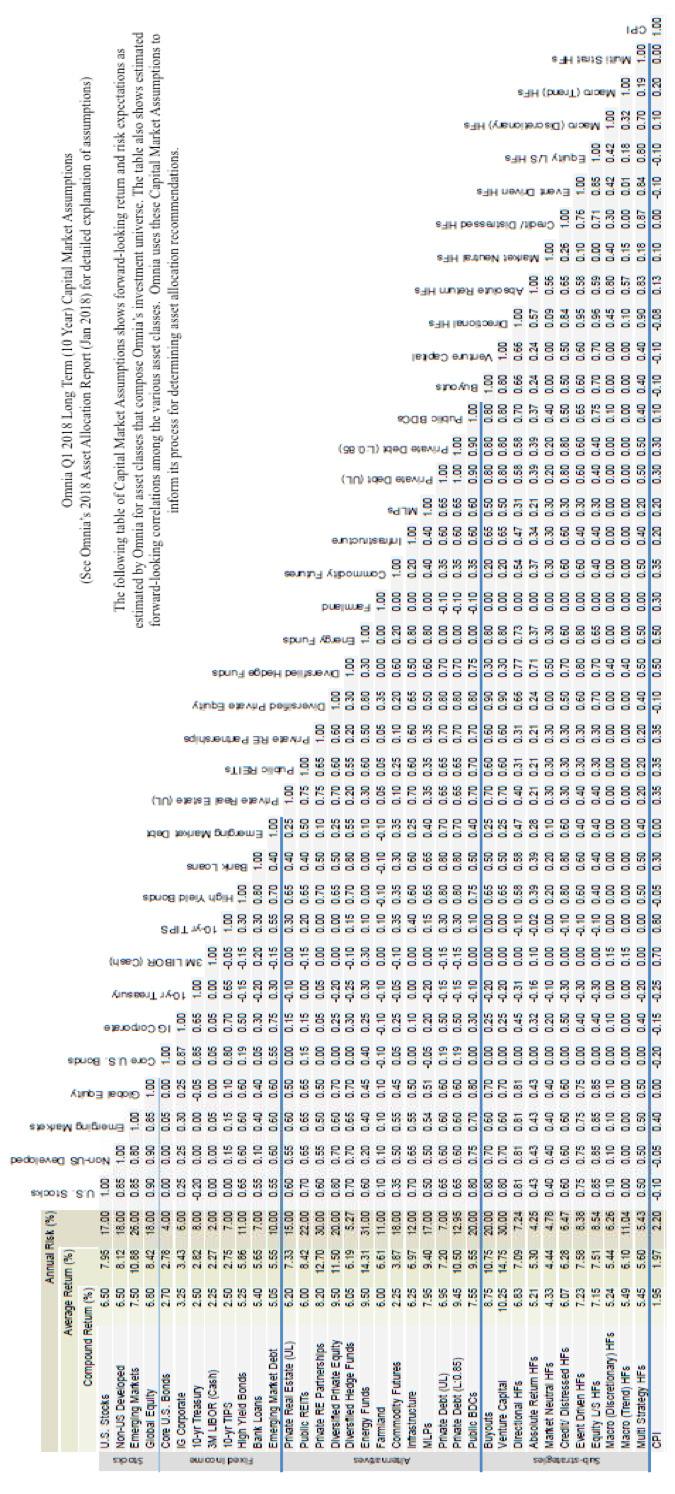
1 2018 ASSET ALLOCATION REPORT INTRODUCTION We invite you to review Omnia Family Wealth s 2018 report on expected asset class returns for the next 10 years. While we believe these forecasts reflect a reasonable framework with which we can make long-term asset allocation decisions, the path is never a straight line. So with that in mind, we also offer some thoughts on shorter-term relative values. We ll discuss our views on equity markets (we see relative value in international stocks), why bond returns could be very challenged for years to come, and our thoughts on how to position hedge funds, private equity, and real estate. We ll also discuss our thoughts on master limited partnerships (MLPs), which we view as one of the most undervalued investments to own in today s markets. We encourage you to reach out to us with any thoughts, comments, or questions that you may have. EXECUTIVE SUMMARY This report presents Omnia s recommendations for asset class return and risk (standard deviation) assumptions, intended for asset allocation use in setting long-term portfolio asset class targets. While these forward-looking or expected asset return and risk assumptions are intended for investment horizons of 10 years or longer, they can change as market conditions change and therefore should be used for asset allocation work conducted near the date of the report. 1 Exhibit 1 on the following page provides return forecasts for the major asset classes as of January 1, 2018 (column 1), and compares them with our year earlier forecasts at January 1, 2017 (column 2). Also included are the calendar 2017 returns (column 4) of the asset class benchmarks (column 5), which were selected as representative of each asset class. Decreases (increases) in expected returns are often, but not always, driven by prior performance gains (losses). A full listing of asset class return, risk, and correlation forecasts is provided at the end of this report. Key observations from our 2018 Report along with some thoughts on shorter-term relative value: 1. STOCKS a. Year-over-year stock expected returns declined modestly, from 6.7% to 6.5%. The S&P 500 climbed 19% over the year, lowering expected returns. The expected return would have been even lower, but for a strong 21% climb in earnings per share in Stocks returns could be higher if growth achieves a new above-trend trajectory. b. On valuation measures alone (i.e. P/E) non-u.s. and emerging markets represent good value relative to U.S. stocks. 1 The terms expected return and return forecast are used interchangeably throughout the report. 1
2 2. RATES our 2.7% expected return remains low and less attractive. 3. STOCK/BOND SPREAD the 3.8% difference between stock and bond expected return is down from 4.1% one year ago and 4.45% in 2016 but remains above the 3.0% historical spread. 4. CREDIT for the second year in a row, narrowing credit spreads reduced expected returns for three of our four credit asset classes. Two years ago, we judged high yield having a positive outlook. Today, we judge high yield having a neutral to negative outlook. 5. INFLATION expected 10-year inflation, measured by the Treasury/TIPs breakeven rate, fell modestly, after climbing significantly in the prior year. Headline inflation has actually risen over the last year, but core inflation is down, holding back the market-implied forward-looking inflation rates, despite expected stimulus from the recent tax cut. 6. PRIVATE EQUITY expected returns have declined to 9.5% in line with the decline in expected returns for equities. Consistent with this, we have observed higher private market transaction prices. Our expectation continues to be that private equity will generate a net 3% return over public stocks over longer time periods, an achievement that has been documented in studies of pension returns. 7. HEDGE FUNDS we increased expected returns modestly, from 5.85% to 6.05%, due largely to cash rates. We favor strategies that have very little beta to equity and fixed income markets. 8. PRIVATE DEBT our expected return for unlevered private loan assets fell slightly from 7.05% to 6.95%. Lower credit spreads were partially offset by rising LIBOR benchmarks. We judge our 6.95% expected return for unlevered private loan asset as an attractive alternative to lower yielding traditional fixed income. 9. REAL ASSETS our expected return for MLPs increased along with higher yields as prices declined. Our forecast for commodity returns likewise increased, driven by higher LIBOR rates. 10. REAL ESTATE we have a positive outlook on both real estate debt and equity despite lower cap rates. Based on these return assumptions we would expect liquid 60/40 portfolios to return 5.55% and endowment-style portfolio returns to average 7.25% 2
3 EXHIBIT 1: Long Term (10 Year) Expected Returns for Major Asset Classes 2 Stocks JAN 1, 2018 JAN 1, 2017 YOY CHANGE 2017 RETURN U.S. Stock % Russell 3000 Non-U.S. Developed % MSCI EAFE Emerging Markets % MSCI EM Global Equity % MSCI ACWI Rates BENCHMARK INDEX Core U.S. Bonds % Bloomberg Barclays U.S. Aggregate Bond IG Corporate % Bloomberg Barclay s U.S. Corporate Bond 10-yr Treasury % Bloomberg Barclays 10y U.S. Treasury 10-yr TIPS % Bloomberg Barclays 5-10y U.S. TIPS Credit High Yield Bonds % Bloomberg Barclays U.S. High Yield Bond Bank Loans % S&P/LSTA U.S. Leveraged Loan Emerging Market Debt % J.P. Morgan EMBI Global Diversified Public BDCs e % Cliffwater BDC Real Estate Public REITs % FTSE/NAREIT Equity REITs Private (Unlevered) % NCREIF Property Private Partnerships % Cambridge Opportunistic RE Private Equity Diversified % Cambridge Global PE & VC Buyout % Cambridge U.S. Buy out Venture Capital % Cambridge Global Venture Energy % Cambridge Global Energy Private Debt Unlevered % Cliffwater Direct Lending Levered % Cliffwater After Fee Estimate Hedge Funds Diversified % HFRI FOF Composite Absolute Return % HFRI FOF Conservative Directional % HFRI FOF Strategic Other Real Assets Commodity Futures % Bloomberg Commodity MLPs % Alerian MLP Farmland (core) % NCREIF Farmland Property Infrastructure % Cambridge Infrastructure Cash 3M T-bill % 3M T-Bill 3M LIBOR % Bloomberg 3M Libor Inflation % CPI-U 3 * Expected geometric annual return over the next 10 years. e Business Development Companies, a liquid investment in private middle market corporate debt One quarter lagged Two quarters lagged One month lagged 2 There can be no assurance that any expected rates of return will be achieved. Expected rates of return and risk may be based upon assumptions regarding future events and conditions that prove to be inaccurate. Expected rates of return and risk should not be relied upon as an indication of future performance and should not form the primary basis for an investment decision. The index returns are provided for information only. Reference to an index does not imply that a portfolio will achieve returns, volatility, or other results similar to the index. Please see additional disclosure at the end of this report.
4 Exhibit 2 plots 10-year expected asset class return and risk. EXHIBIT 2: 2018 Asset Class Expected Return and Risk The dashed line in Exhibit 2 represents what is known as the capital market line representing the market tradeoff between expected return and risk. Asset classes that plot above the line offer higher risk-adjusted returns (or Sharpe Ratios) compared to asset classes below the line. We find that asset classes are now plotting closer to the capital market line compared to prior years. Exhibit 3 plots actual historical asset class return and risk for the 10 years ending December 31, EXHIBIT 3: 10-Year Historical Asset Class Benchmark Return and Risk 3 Returns for private debt (UL), private real estate (UL), and farmland are lagged by one quarter and returns for diversified private equity, energy funds, private RE partnerships, and infrastructure are lagged two quarters. Historical risk calculations are unsmoothed for private instruments, excluding hedge funds. See Cliffwater Expected Return and Risk Methodology. 4
5 US STOCKS Omnia uses a long-term stock return assumption of 6.5%, down from a 6.7% assumption last year. The S&P 500 climbed 19% year-over-year, lowering future return expectations. With the new corporate tax cuts driving up expected earnings projections for 2018 and the stock market hitting all-time highs on what seems like almost a daily basis, it is important to view this asset class from a long-term perspective. Proper risk controls can be distorted by the natural overweighting of an asset class that occurs when its prices rise dramatically. Exhibit 4 shows S&P 500 price-earnings multiples over the last 66 years. Over that period they average 17.1 but have been subject to significant swings, falling to 7 during the 1970s, climbing to 28 at their peak in 1999 (except for a reported 120 price-earnings spike in 2009 as earnings fell from write-offs and the recession), then falling again to 13 at the end of Today, as measured by reported earnings, the price-earnings ratio is 23.30, which represents a 36% premium to the 17.1 historical average mentioned above. This does not necessarily mean that stocks are overvalued. In the context of low interest rates and low inflation, a higher price-earnings ratio may be justified. EXHIBIT 4: S&P 500 Price-Earnings Ratio, 1952 to
6 NON-U.S. EQUITY (DEVELOPED AND EMERGING MARKETS) Omnia is assuming a 6.5% return for non-u.s. stocks, the same as for U.S. stocks. Studies of the major global stock markets, which date back over a century, show that the non-u.s. markets perform no better than the U.S. market when returns are measured over long periods of time. In fact, the U.S. market was the best performing market of all the developed stock markets during the prior century. Exhibit 5 illustrated the similar long-term performance of U.S. stocks (S&P 500) and non-u.s. stocks (MSCI EAFE) starting December 31, 1969, the longest period for which MSCI EAFE returns are available. With the exception of the Japanese stock market bubble in the 1980s and the current strong U.S. market, U.S. and foreign markets have shown very similar performance over the last 48 years. EXHIBIT 5: S&P 500 and MSCI EAFE Returns, 1969 to 2017 Omnia is assuming a 7.5% return for the emerging stock markets or 1% above our return assumptions for the U.S. and other developed equity markets. The higher return for emerging markets is based upon an expectation of greater growth in those markets. Geographic diversification by balancing U.S. and non-u.s. stocks in an equity portfolio has been a major trend among institutional investors over many years. The belief is that by doing so, risk can be significantly reduced. Unfortunately, the benefits of global diversification diminished in 2000 and generally remained low (high correlation) until very recently. Exhibit 6 captures these diversification shifts visually by showing cross-correlations between the S&P 500, the MSCI EAFE, and the MSCI Emerging Markets indices over the last 29 years. 6

7 EXHIBIT 6: Rolling 12 Month Correlations between U.S., EAFE, and Emerging Market Equity Indices, 1989 to 2017 With the recent decline in correlation close to 0.50, global equity diversification is again meaningful. Furthermore, non-u.s. stocks have begun achieving returns comparable to or above U.S. stocks, making diversification potentially accretive from both a return and risk perspective. In addition, price-earnings ratios for non-u.s. stocks versus U.S. stocks have become attractive. Exhibit 7 provides price-earnings ratios over time for U.S, and non-u.s. stocks. After 2008, U.S. price-earnings ratios climbed considerably relative to price-earnings ratios for non-u.s. stocks. Current differences in price-earnings multiples point to more attractive valuations for non-u.s. stocks compared to U.S. stocks. EXHIBIT 7: Price-Earnings Ratios for U.S. and non-u.s. stocks 7

8 U.S. BONDS Omnia s long-term assumption for core U.S. bond returns is 2.7%, equal to the Bloomberg Barclays U.S. aggregate index s yield to maturity at the end of the year. The Fed has been the largest global investor in recent years, growing its balance sheet from under $1 billion before QE started in 2008, to $4.5 billion today. But the Fed is not a traditional economically rational investor that would balance return and risk across multiple asset classes to contribute to efficient markets. Instead, its actions are driven by public policy goals which can create market distortions that investors need to understand and factor into their asset allocation decisions. Specifically, we believe that Treasury rates have been distorted to the low side at least by any historical measure and that this presents investment risks that do not fall under the investor-driven speculative bubble category. The risk is that rising rates could bring down all asset prices and that the length and severity of such a change could cause market disruptions. The good news is that there has been no disruption, and stock markets have continued to be strong despite the end to Fed bond-buying and several rate increases. Furthermore, we believe that while the Fed may prefer to take the additional step of reducing, rather than maintaining, the size of its balance sheet, any such measures are likely to be gradual given the known risks. HIGH YIELD BONDS, BANK LOANS, AND EMERGING MARKET DEBT High yield bond spreads narrowed another 0.66% in 2017, following a precipitous 2.51% spread decline in Exhibit 8 plots the reduction in U.S. High Yield Bond spreads (relative to comparable maturity Treasuries) over the last two years. EXHIBIT 8: Yield Spreads on Bloomberg Barclays U.S. High Yield, Emerging Market USD Debt, U.S. Corporate Bond, and U.S. Aggregate Bond Indices, 1996 to
9 PRIVATE EQUITY Private equity is commonly divided into four subcategories: U.S. Buyout, Venture Capital, Distressed, and Non-U.S. Private Equity. Our forecast of a 9.5% annual return for Diversified Private Equity is intended to reflect a diversified portfolio that included all the subcategories. Surveys of private equity portfolios managed by large institutional pension systems show that they have been able to earn returns 3% to 5% above public stock returns, after fees, by investing in a diversified portfolio of institutional quality private equity. Our forecast of 9.5% represents a 3% excess return over our assumption of public stock returns. In the U.S. Buyout category, we would underweight large-cap buyout as prices and leverage levels remain elevated. We believe that opportunities remain for managers with a focused approach in the mid/small cap buyout arena and have an overweight there. Other areas of private assets that we currently favor include both equity and debt real estate partnerships. HEDGE FUNDS Traditional assets like stocks and bonds derive most, if not all, of their return from the types of securities they represent. The buy-and-hold returns generated by these traditional asset classes are referred to as beta. Our thoughts on hedge funds, in general, are that far too many managers generate a good portion of their returns from beta. In other words, this market beta can be attained with much less expense than hedge funds typically charge. Therefore, we believe that the value proposition of many hedge funds is challenged in today s world. We also believe this has been evidenced by the disappointing returns from many strategies employed in the hedge fund universe. We do, however, believe that the hedge funds that do not derive their return streams from this market beta factor can be invaluable in reducing overall portfolio risk while also producing an independent source of return. We like to think of these strategies as the third leg of the stool, where stocks and bonds are the other two legs. We believe that a well-curated portfolio of top quality hedge funds can provide a long-term return on par with our long-term expectations for stocks while having the volatility of bonds and an extremely low correlation to either traditional asset class. 9
10 MASTER LIMITED PARTNERSHIPS (MLPS) Created by Congress in the 1980s, these publicly traded partnership interests are tax-free at the entity level, provided that 90% of their income comes from natural resources such as oil, natural gas, coal, and timber. Income-generating MLP activities include exploration and production, mining, as well as midstream services such as gathering & processing, transportation, storage, and distribution, but exclude most downstream services such as gas stations and utilities. MLPs continue to be one of the best performing asset classes over their history, but as illustrated in Exhibits 9 and 10, experienced sharp drawdowns in 2014, 2015, and again in 2017 EXHIBIT 9: MLP Performance versus Other Asset Classes, 1996 to 2017 MLPS have demonstrated strong performance over the 22 years since the inception of the Alerian MLP Index, returning an annualized 12.04%. As reported in exhibit 10, this return is well above the 8.94% S&P 500 return for the same period and higher than selected other inflation-sensitive asset classes such as REITs (FTSE/NAREIT All Equity REIT Index) and commodity futures (S&P GSCI). While MLPs do belong in the risk-on category, their volatility and correlation characteristics are relatively attractive, as shown in section (b) of Exhibit
11 EXHIBIT 10: MLP Return and Risk versus Other Asset Classes, Periods ending Dec 2017 MLP REITs S&P500 CPI S&P GSCI (a) Returns ending December % 5.23% 21.83% 1.96% 5.77% 3 Years -9.33% 5.62% 11.41% 1.57% -7.52% 5 Years -0.06% 9.46% 15.79% 1.37% % 10 Years 6.05% 7.44% 8.50% 1.58% % Since Jan 1996 (22 Yrs) 12.04% 10.52% 8.94% 2.18% -0.18% Year % % % -0.04% % (b) Risk and Correlation since Jan 1996 Risk 16.17% 19.78% 14.80% 0.99% 22.14% Correlations: MLPs REITs S7P CPI S&P GSCI (c) Sensitivity to Oil Prices since Jan 1996 Oil Beta MLP correlations are also attractive from a portfolio construction perspective, particularly their lower 0.39 correlation to the S&P 500. By comparison, REITs have a much higher 0.56 correlation to the S&P 500. Also noteworthy is the positive 0.17 correlation between MLPs and the CPI. While low, it is positive and higher than the 0.05 correlation between REITs and the CPI. An important question is the sensitivity of MLP earnings and returns to commodity prices, particularly oil and natural gas. This touches on the commodity risk embedded in MLPs and whether they can be a reliable inflation hedge. The conventional wisdom is that most MLPs follow a toll-road business model where revenues are more sensitive to the volume of oil and gas put through the pipes and other transport assets and less sensitive to the price of oil and gas themselves. Another reason for the interest in MLPs is their high current yield. A high yield appeals to investors who want liquidity and/or current income and also provides some inflation protection as cash flow can be reinvested at higher rates during periods of rising inflation. MLP yields are consistently high and exceed most other yield-oriented asset classes, even high yield bonds over the last three years. MLP yields rose in 2017 from 7.07% to 7.64% as a result of declining prices, and are not at high spread levels relative to high yield bonds and other yield-oriented asset classes. 11
12 12
13 DISCLOSURE Omnia Family Wealth LLC ( Omnia ) is a registered investment advisor with the U.S. Securities and Exchange Commission. This content is provided for informational purposes only and is not intended as a recommendation to invest in any particular asset class or strategy or as a promise of future performance. Note that these asset class and strategy assumptions are passive only, and they do not consider the impact of active management. References to future returns are not promises or even estimates of actual returns a client portfolio may achieve. The views expressed herein are the view of Omnia only through the date of this report and are subject to change based on market or other conditions. All information has been obtained from sources believed to be reliable, but its accuracy is not guaranteed. Omnia has not conducted an independent verification of the information. Due to various factors, including the inherent possibility of human or mechanical error, the accuracy, completeness, timeliness and correct sequencing of such information and the results obtained from its use are not guaranteed by Omnia. Statements that are non factual in nature, including opinions, projections and estimates, assume certain economic conditions and industry developments and constitute only current opinions that are subject to change without notice. Further, all information, including opinions and facts expressed herein are current as of the date appearing in this report and is subject to change without notice. Unless otherwise indicated, dates indicated by the name of a month and a year are end of month. Past performance may not be indicative of future results. There can be no assurance that any expected rates of return or risk will be achieved. Expected rates of return and risk are subjective determinations by Cliffwater LLC based on a variety of factors, including, among other things, investment strategy, prior performance of similar strategies, and market conditions. Expected rates of return may be based upon assumptions regarding future events and conditions that prove to be inaccurate. Expected rates of return and risk should not be relied upon as an indication of future performance and should not form the primary basis for an investment decision. No representation or assurance is made that the expected rates of return or risk will be achieved. 13
2014 CAPITAL MARKET ASSUMPTIONS. January SEATTLE LOS ANGELES
 2014 CAPITAL MARKET ASSUMPTIONS January 2014 SEATTLE 206.622.3700 LOS ANGELES 310.297.1777 www.wurts.com TABLE OF CONTENTS Summary Page 3 Overview of Methodology Page 7 Inflation Page 9 Fixed Income Page
University of North Florida Foundation, Inc. Statement of Investment Objectives and Policies
 University of North Florida Foundation, Inc. Statement of Investment Objectives and Policies This Investment Policy Statement has been established by the University of North Florida Foundation, Inc. (the
Asset Strategy Consultants. MARKET ENVIRONMENT First Quarter 2017
 MARKET ENVIRONMENT First Quarter 2017 Market Environment: Economy Economies in the U.S. and Europe continued to gain traction. Expectations for lower taxes, reduced regulation, and other pro-growth reforms
Investment Perspectives. From the Global Investment Committee
 Investment Perspectives From the Global Investment Committee Introduction Domestic equities continued to race ahead during the fourth quarter of 2014 amid spikes in volatility, dramatic declines in oil
2018 TEN-YEAR CAPITAL MARKET ASSUMPTIONS
 2018 TEN-YEAR CAPITAL MARKET ASSUMPTIONS TABLE OF CONTENTS 2018 vs. 2017 Assumptions 2 Summary & Highlights 2 Detailed Assumptions 3-4 PENSION CONSULTING ALLIANCE, INC. Pension Consulting Alliance, Inc.
2017 Q3 Report on U.S. Direct Lending
 2017 Q3 Report on U.S. Direct Lending Private debt has been a rapidly growing asset class among institutional investors, a trend that Cliffwater expects to continue. This report focuses on third quarter
MAY 2018 Capital Markets Update
 MAY 2018 Market commentary U.S. ECONOMICS The U.S. added 223,000 jobs to payrolls in May, well above the consensus estimate of 180,000 and the expansion average of around 200,000. Sector job gains were
Amended as of January 1, 2018
 THE WALLACE FOUNDATION INVESTMENT POLICY Amended as of January 1, 2018 1. INVESTMENT GOAL The investment goal of The Wallace Foundation (the Foundation) is to earn a total return that will provide a steady
RBC Strategic Asset Allocation Models
 Page 1 of United States Core Very conservative Last updated: April 17 Risk Profile 1 The focus is capital preservation. The portfolio will typically be invested mainly in fixed income and other low volatility
Economic and Capital Market Update April 2018
 Economic and Capital Market Update April 2018 Apr-70 Apr-74 Apr-78 Apr-82 Apr-86 Apr-90 Apr-94 Apr-98 Apr-02 Apr-06 Apr-10 Apr-14 Apr-18 April 30, 2018 Economic Perspective The strong pace of the global
Fund Information. Partnering for Success. SSgA Real-Life Insight
 SM SSgA Real-Life Insight Fund Information Partnering for Success For Plan Participant Use only. The information contained in this document is intended as investment education only. None of the information
Aiming at a Moving Target Managing inflation risk in target date funds
 Aiming at a Moving Target Managing inflation risk in target date funds Executive Summary This research seeks to help plan sponsors expand their fiduciary understanding and knowledge in providing inflation
Eric C. Elbell, CFA, CAIA Area Senior Vice President. Kyongdo Min, CPA, CFA Area Vice President. April 11, 2018
 Eric C. Elbell, CFA, CAIA Area Senior Vice President Kyongdo Min, CPA, CFA Area Vice President April 11, 2018 Agenda We will address three key topics: Headline events that impacted markets during the quarter
ASSET ALLOCATION VIEWPOINTS
 T. Rowe Price ASSET ALLOCATION VIEWPOINTS Q2 2017 Stocks vs. Bonds We increased our underweight to stocks relative to bonds as equity valuations appear extended against a backdrop of continued modest economic
Summit Strategies Group 8182 Maryland Avenue, 6th Floor St. Louis, Missouri
 Summit Strategies Group 8182 Maryland Avenue, 6th Floor St. Louis, Missouri 63105 314.727.7211 Asset Allocation Review City of Jacksonville Police & Fire Pension Fund February 20, 2015 EXECUTIVE SUMMARY
Fresno County Employees Retirement Association
 MARCH 2017 Verus 2017 Capital Mark Assumptions Fresno County Employees Retirement Association Asset allocation forecast In January of each year, Verus prepares forward looking 10 year return assumptions
Capital Markets Outlook 100 LOWDER BROOK DRIVE SUITE 1100 WESTWOOD MA FAX
 M E K E T A I N V E S T M E N T G R O U P 00 LOWDER BROOK DRIVE SUITE 00 WESTWOOD MA 02090 78 47 3500 FAX 78 47 34 Investors are faced with three primary issues in the near-term: ) historically low bond
Passive Opportunities for Master Limited Partnerships (MLP) Investors: The Morningstar MLP Index Family
 Investors: The Morningstar MLP Index Family") Passive Opportunities for Master Limited Partnerships (MLP) Investors: The Morningstar MLP Index Family By Jason Stevens, Director of Energy Equity Research Morningstar Research Paper April 2013 Introduction
Passive Opportunities for Master Limited Partnerships (MLP) Investors: The Morningstar MLP Index Family By Jason Stevens, Director of Energy Equity Research Morningstar Research Paper April 2013 Introduction
Summit Strategies Group 8182 Maryland Avenue, 6th Floor St. Louis, Missouri Monthly Economic & Capital Market Update
 Summit Strategies Group 8182 Maryland Avenue, 6th Floor St. Louis, Missouri 63105 314.727.7211 Monthly Economic & Capital Market Update November 2015 Yield to Maturity Monthly Change Nov-63 Nov-67 Nov-71
D E F I N I T I O N O F D U T I E S O B J E C T I V E S
 UNIVERSITY OF UTAH E NDOWMENT POOL INVESTMENT IMPLEMENTATION STRATEGY CONTENTS May, 2015 O V E R V I E W D E F I N I T I O N O F D U T I E S O B J E C T I V E S A S S E T A L L O C A T I O N / I N V E
Advance with Alternative Investments. Diversification when you need it
 Advance with Alternative Investments Diversification when you need it All charts are for illustrative purposes and not intended to be representative of any specific investment vehicle. Please refer to
Is Diversification Still Relevant?
 Is Diversification Still Relevant? Examining the portfolio value of managed futures and other alternative investments after a 9-year equity bull market FOR BROKER DEALER AND RIA USE ONLY. NOT TO BE USED
Community Foundation of Northern Virginia - Pooled Investment Fund
 //207 through 3/3/207 Quarterly Performance Report 207 Black Diamond Performance Reporting, LLC - 42008 Page of 3 Portfolio Overview Portfolio Value Summary Month Quarter Year to Date Last 2 Months Last
Diversification Pays While Low Inflation Stays
 Diversification Pays While Low Inflation Stays May 2, 2016 by Brad Tank of Neuberger Berman Neither rising rates nor rising defaults would spell the end of opportunistic, diversified fixed income. There
Global Investment Committee Themes
 Global Investment Committee Themes The Global Investment Committee (GIC), which meets monthly to review the economic and political environment and asset allocation models for Morgan Stanley Wealth Management
Target Funds. SEMIANNual REPORT
 SEMIANNual REPORT November 30, 2017 T. Rowe Price Target Funds The funds invest in a diversified portfolio of T. Rowe Price mutual funds, offering a professionally managed, age-appropriate mix of stocks
Capital Market Outlook Q3 2017
 Economic progress, in capitalist society, means turmoil Josef A. Schumpeter Summary Capital Market Outlook Q 207 We are not sure that the economist and long time Harvard professor envisaged the type of
Alternative Investments: Risks & Returns
 Alternative Investments: Risks & Returns THE FAMILY ALTERNATIVE INVESTMENT CONFERENCE February 2007, Monaco Hossein Kazemi, PhD, CFA Managing Partner, AIA Professor of Finance, Univ of Massachusetts kazemi@alternativeanalytics.com
Economic and Capital Market Update November 2017
 Economic and Capital Market Update November 2017 Oct-69 Oct-73 Oct-77 Oct-81 Oct-85 Oct-89 Oct-93 Oct-97 Oct-01 Oct-05 Oct-09 Oct-13 Oct-17 November 30, 2017 Economic Perspective Economy Global economic
Income Investing basics
 Income Investing basics investment options that can offer income, growth, and diversification Key questions to consider: What are your income-oriented investment options? What is the role of income in
UNIVERSITY OF VERMONT STATEMENT OF INVESTMENT POLICIES AND OBJECTIVES
 UNIVERSITY OF VERMONT STATEMENT OF INVESTMENT POLICIES AND OBJECTIVES I. INTRODUCTION This statement is issued by the Investment Subcommittee (the ISC ) of the Board of Trustees of the University of Vermont
2013 CFA Exam. LOS 31.a SS 13
 LOS 31.a 2013 CFA Exam SS 13 Describe common features of alternative investments and their markets and how alternative investments may be grouped by the role they typically play in a portfolio. Card 1
INVESTMENT POLICY STATEMENT TEXAS ENDOWMENT FUNDS
 INVESTMENT POLICY STATEMENT TEXAS ENDOWMENT FUNDS 1 TABLE OF CONTENTS CHAPTER PAGE I. GENERAL INFORMATION 3 II. FUND OBJECTIVES & EXPECTATIONS 4 III. RISK MANAGEMENT & GUIDELINES 6 IV. INVESTMENT MANAGERS
Different Perspectives on Investment Performance Tweedy, Browne Global Value Fund
 Different Perspectives on Investment Performance Tweedy, Browne Global Value Fund This booklet provides an historical perspective concerning the year-by-year variability of investment returns for the Tweedy,
Investment Market Update (As of July 31, 2017)
") Investment Market Update (As of ) David Barnes, CFA, CAIA Senior Consultant Rhett Humphreys, CFA, Partner Index Performance Summary as of 07/31/2017 2009 2010 2011 2012 2013 2014 2015 2016 Q1 Q2 July MSCI
Investment Market Update (As of ) David Barnes, CFA, CAIA Senior Consultant Rhett Humphreys, CFA, Partner Index Performance Summary as of 07/31/2017 2009 2010 2011 2012 2013 2014 2015 2016 Q1 Q2 July MSCI
Private Equity Overview
 Private Equity Overview June 10, 2010 State Universities Retirement System Rob Parkinson, Associate Agenda Asset Class Overview Market Update SURS Private Equity Portfolio Asset Class Overview Benefits
INVESTMENT POLICY STATEMENT TEXAS ENDOWMENT FUNDS
 INVESTMENT POLICY STATEMENT TEXAS ENDOWMENT FUNDS 1 TABLE OF CONTENTS CHAPTER PAGE I. GENERAL INFORMATION 3 II. FUND OBJECTIVES & EXPECTATIONS 4 III. RISK MANAGEMENT & GUIDELINES 6 IV. INVESTMENT MANAGERS
Board of Regents Report. for July Texas Tech University System Endowment
 Board of Regents Report for July 2017 Texas Tech University System Endowment Contents Endowment Data Endowment Liquidity Market Data Asset Class Allocation: Actual vs. Target Asset Class Performance: Actual
INVESTMENT POLICY STATEMENT STATE WATER IMPLEMENTATION FUND FOR TEXAS
 INVESTMENT POLICY STATEMENT STATE WATER IMPLEMENTATION FUND FOR TEXAS 1 TABLE OF CONTENTS CHAPTER PAGE CHAPTER I. GENERAL INFORMATION 3 SECTION 1. FUND BACKGROUND & PURPOSE 3 SECTION 2. FUND ADMINISTRATION:
MARCH 2018 Capital Markets Update
 MARCH 2018 Market commentary ECONOMIC CLIMATE Hiring slowed from its fast pace last month the U.S. added 103,000 jobs to nonfarm payrolls in March, below the consensus estimate of 185,000. The U-3 unemployment
Fortigent Alternative Investment Strategies Model Wealth Portfolios Fortigent, LLC.
 Fortigent Alternative Investment Strategies Model Wealth Portfolios Important Disclaimers The information provided is for educational purposes only and is not intended to be, and should not be construed
C.1. Capital Markets Research Group Asset-Liability Study Results. December 2016
 December 2016 2016 Asset-Liability Study Results Capital Markets Research Group Scope of the Project Asset/Liability Study Phase 1 Review MCERA s current investment program. Strategic allocation to broad
Texas Tech University System
 Texas Tech University System Capital Markets Overview October 2016 Timothy Bruce, Partner Index Performance Summary as of July 29 2016 2009 2010 2011 2012 2013 2014 2015 Q1 Q2 July YTD Barclays US STRIPS
Capital Markets Review 4th Quarter 2016 December 31, 2016
 Return (%) Capital Markets Review 4th Quarter 2016 December 31, 2016 Overview The fourth quarter of 2016 was positive for US equities, but generally negative for international developed and emerging market
RBC Strategic Asset Allocation Models
 Page 1 of 7 United States Traditional Fixed Income Only Last updated: March 218 Fixed Income Only The focus is capital preservation. The portfolio is only invested in fixed income asset classes. The investor
Different Perspectives on Investment Performance Tweedy, Browne Global Value Fund
 Different Perspectives on Investment Performance Tweedy, Browne Global Value Fund This booklet provides an historical perspective concerning the year-by-year variability of investment returns for the Tweedy,
F U N D E V A L U A T I O N R E P O R T
 F U N D E V A L U A T I O N R E P O R T Santa Barbara Foundation Performance Update M E K E T A I N V E S T M E N T G R O U P BOSTON MASSACHUSETTS CHICAGO ILLINOIS MIAMI FLORIDA PORTLAND OREGON SAN DIEGO
Economic Outlook. DMS Economic Outlook for next 12 months
 Economic Outlook DMS Economic Outlook for next 12 months GDP growth has rebounded from a dismal first quarter and GDP is growing modestly at 2.6%. Personal income growth has improved in recent months and
The Next Wave of Hedge Fund Investing. Today s Discussion
 The Next Wave of Hedge Fund Investing Adam L. Berger, CFA Vice President and Head of Portfolio Solutions AQR Capital Management, LLC December 6, 2007 Today s Discussion Hedge Funds Today Bifurcation of
Endowment & Similar Funds Investment Review September 2008
 Endowment & Similar Funds Investment Review September 2008 This cover page provides a summary overview of the Pennsylvania State University Endowment and Similar Funds for fiscal year 2008. The next page
Alternative Investments in a Changing World
 NORTHERN TRUST 2010 PROGRAM SOLUTIONS CONFERENCE Investment Solutions in an Uncertain World: WHAT S NEXT? Alternative Investments in a Changing World Andrew C Smith, CFA, Chief Investment Officer, NTGA
Outlook & Perspective
 Outlook & Perspective All data and information as of June 30, 2016 Approved for current clients. May be presented to prospective clients in a one-on-one setting only. Morningstar Investment Services LLC
Retirement Funds. SEMIANNual REPORT
 SEMIANNual REPORT November 30, 2017 T. Rowe Price Retirement Funds The funds invest in a diversified portfolio of T. Rowe Price mutual funds, offering a professionally managed, age-appropriate mix of stocks
Can Active Management Make a Comeback? September 2015
 Can Active Management Make a Comeback? September 2015 Executive Summary Recent underperformance by active U.S. managers can be easily explained and, in our view, is only temporary FACTORS MAKING FOR A
DECEMBER 2018 Capital Markets Update
 DECEMBER 2018 Market commentary U.S. ECONOMICS Nonfarm payrolls jumped by 312,000 in December, well above expectations for a 176,000 increase. The healthcare sector (+50,000) led job creation, while restaurants
The Oil Connection. Key Takeaways. What It May Mean for Investors WEEKLY GUIDANCE FROM OUR I NVESTMENT STRATEGY COMMITTEE
 WEEKLY GUIDANCE FROM OUR I NVESTMENT STRATEGY COMMITTEE John LaForge Head of Real Asset Strategy The Oil Connection August 14, 217 Key Takeaways» Oil prices have an impact on other commodities, and on
Alternatives in action: A guide to strategies for portfolio diversification
 October 2015 Christian J. Galipeau Senior Investment Director Brendan T. Murray Senior Investment Director Seamus S. Young, CFA Investment Director Alternatives in action: A guide to strategies for portfolio
Betting on diversification. Any takers?
 Betting on diversification. Any takers? February 26, 2018 Ten years ago, Warren Buffett made a decade-long wager on an S&P 500 index fund and emerged triumphant. But would we make a similar bet in today
Summit Strategies Group 8182 Maryland Avenue, 6th Floor St. Louis, Missouri Economic & Capital Market Review
 Summit Strategies Group 8182 Maryland Avenue, 6th Floor St. Louis, Missouri 63105 314.727.7211 Economic & ital Market Review TABLE OF CONTENTS Page Key Highlights 1 Economic Perspective 2 Assets 5 Income
NOVEMBER 2018 Capital Markets Update
 NOVEMBER 2018 Market commentary U.S. ECONOMICS Non-farm payrolls added 155,000 jobs in November, missing expectations of 198,000, and the unemployment rate held steady at 3.7%. The labor force participation
AMP Business Superannuation Fund Fact Sheet
 AMP Business Superannuation Fund Fact Sheet 30 September 2014 AMP Business Superannuation provides extensive investor choice and flexibility. It offers access to a comprehensive range of investment portfolios.
University of Washington
 University of Washington Investment Performance Report to UWINCO Fourth Quarter Fiscal Year 200 As of June 30, 200 Treasurer Board of Regents Treasury Office Published August 200 Table of Contents Treasury
Short exposure to US equities
 Portfolio performance The All Asset Fund aims to serve as a differentiated asset allocation strategy. It focuses on third pillar assets in seeking three key outcomes: 1) long-term real return consistent
2. Investment Policies I. DEFINITIONS
 2. Investment Policies I. DEFINITIONS PURPOSE The purpose of this Investment Policy Statement is to establish a clear understanding of the philosophy and the investment objectives for The University at
SEPTEMBER 2018 Capital Markets Update
 SEPTEMBER 2018 Market commentary U.S. ECONOMICS Non-farm payrolls added 134,000 jobs in September, missing the consensus estimate of 185,000. However, net revisions to the two months prior totaled +87,000
PALM TRAN, INC./ATU LOCAL 1577 PENSION FUND INVESTMENT PERFORMANCE PERIOD ENDING MARCH 31, 2011
 PALM TRAN, INC./ATU LOCAL 1577 PENSION FUND INVESTMENT PERFORMANCE PERIOD ENDING MARCH 31, 2011 NOTE: For a free copy of Part II (mailed w/i 5 bus. days from request receipt) of Burgess Chambers and Associates,
PCA INVESTMENT MARKET RISK METRICS. Monthly Report
 PCA INVESTMENT MARKET RISK METRICS Monthly Report June 2017 Takeaways Equity volatility measure (VIX) ended the month at extremely low levels, lowest since the global financial crisis, after a brief inter-month
Summit Strategies Group 8182 Maryland Avenue, 6th Floor St. Louis, Missouri Economic & Capital Market Review
 Summit Strategies Group 8182 Maryland Avenue, 6th Floor St. Louis, Missouri 63105 314.727.7211 Economic & ital Market Review TABLE OF CONTENTS Page Key Highlights 1 Economic Perspective 2 Assets 5 Income
ASSET ALLOCATION VIEWPOINTS AND GLOBAL INVESTMENT ENVIRONMENT
 T. Rowe Price ASSET ALLOCATION VIEWPOINTS AND GLOBAL INVESTMENT ENVIRONMENT Q3 2017 Q3 2017 Global Environment MAJOR MARKET THEMES Improv ing Global Grow th Strong Earnings Results Optimistic Equity Valuations
Beyond the usual suspects: Diversified sources of income
 J.P. Morgan Asset Management Research Summit 2011 Passport to opportunity Beyond the usual suspects: Diversified sources of income Mariana Connolly, CFA Client Portfolio Manager, U.S. Equity Group Anne
Navigating the Fixed Income Minefield
 Navigating the Fixed Income Minefield Jeffrey Sherman, CFA Portfolio Manager DoubleLine Capital February 20, 2014 When all the experts and forecasts agree -- something else is going to happen. - Bob Farrell
Capital Market Review
 Capital Market Review September 3, 215 Percent Percent MARKET/ECONOMIC OVERVIEW Risk Reprices Rapidly 2,2 1,9 1,6 1,3 S&P 5 April 29, 211 to Oct 3, 211 157 Days -19.4% May 21, 215 to Sep 3, 215 132 Days
Capital Market Outlook Q4 2017
 It amazes me how people are often more willing to act based on little or no data than to use data that is a challenge to assemble. - Robert Shiller Summary Capital Market Outlook Q4 207 The Yale Nobel
Why and How to Pick Tactical for Your Portfolio
 Why and How to Pick Tactical for Your Portfolio A TACTICAL PRIMER Markets and economies have exhibited characteristics over the past two decades dissimilar to the years which came before. We have experienced
Building Hedge Fund Portfolios Capable of Generating Absolute Return within Stressful Market Environments
 Building Hedge Fund Portfolios Capable of Generating Absolute Return within Stressful Market Environments Presented to: October 20, 2011 Paul Lucek SSARIS Advisors, LLC SSARIS Advisors, LLC Wilton Corporate
An Examination of State Pension Performance: 2007 to 2016
 An Examination of State Pension Performance: 2007 to 2016 September 30, 2017 Our annual state pension performance report examines the management of state pension assets over a 10-year cycle, now updated
Economic Outlook. DMS Economic Outlook for next 12 months
 Economic Outlook DMS Economic Outlook for next 12 months GDP growth will be modest at approximately 2.5%, but the economy will experience periods of unstable growth. Consumer confidence will improve as
Master Limited Partnerships
 March 2010 Master Limited Partnerships An Outstanding Track Record And A Promising Future Malcom Day, CFA Partner, Eagle Global Advisors An Outstanding Track Record: A Quarter Century of History Master
Portfolio Management Strategies for Insurance Pools
 Portfolio Management Strategies for Insurance Pools NLC RISC Trustees Conference Presented By: Kenneth Schiebel, CFA, Managing Director Mark Yasenchak, CFA, Director May 11, 2018 PFM Asset Management LLC
Hedge Fund Strategy Education
 September 23, 2015 Hedge Fund Strategy Education Water & Power Employees Retirement Plan Introduction Introduction The Asset/Liability Study highlighted opportunities that may help the Plan achieve its
Schwab Indexed Retirement Trust Fund 2040
 Fund Facts Trustee Fund Type Charles Schwab Bank Collective Trust Fund Category Target Date 2036-2040 Benchmark 2040 Custom Index 1 Unit Class Inception Date Fund Inception Date 1/5/2009 Net Asset Value
Asset Strategy Consultants. MARKET ENVIRONMENT Third Quarter 2016
 MARKET ENVIRONMENT Third Quarter 2016 Market Environment: Economy Investor angst over the unexpected vote on Brexit was short lived with a "risk on" theme returning to the markets in July and leading to
The Benefits of Recent Changes to Trustees Investment Powers. June 2006
 The Benefits of Recent Changes to Trustees Investment Powers June 2006 Financial Markets and Rollercoasters Spot the Difference? Performance from 1 Jan 1998 to 31 Mar 2006 80 % 60 % 40 % 20 % 0 % -20 %
Managed Futures managers look for intermediate involving the trading of futures contracts,
 Managed Futures A thoughtful approach to portfolio diversification Capability A properly diversified portfolio will include a variety of investments. This piece highlights one of those investment categories
REAL OPPORTUNITIES WHY REIT INVESTORS SHOULDN'T FEAR RISING RATES
 REAL OPPORTUNITIES WHY REIT INVESTORS SHOULDN'T FEAR RISING RATES In May 2013, real estate markets were sent into a free fall when Ben Bernanke announced that the US Federal Reserve may begin tapering
STATEMENT OF INVESTMENT POLICY. I. Introduction 2. II. Investment Philosophy 2. III. Investment Objectives 2. IV. Investment Policy 3
 STATEMENT OF INVESTMENT POLICY I. Introduction 2 II. Investment Philosophy 2 III. Investment Objectives 2 IV. Investment Policy 3 V. Investment Guidelines 4 VI. Spending Policy 7 VII. Review Procedures
An Introduction to Dynamic Overlay
 Tactical investment strategy striving to preserve and grow client wealth An Introduction to Dynamic Overlay www.mrminv.com 12444 Powerscourt Drive Suite 350, St. Louis, MO 63131 1-(800) 233-1944 Q4 2018
Investment Market Risk Metrics August 2011
 Investment Market Risk Metrics August 2011 Takeaways Data is as of Monday August 8, 2011 Interest rate risk increased to levels not seen since Dec 2008 Equity market volatility spiked after U.S. Treasury
Goldman Sachs Asset Allocation Portfolios Investment Outlook
 Goldman Sachs Asset Allocation Portfolios Investment Outlook Overview The Goldman Sachs Asset Allocation Portfolios are managed by the Global Portfolio Solutions (GPS) team. 1 GPS has been designing customized
UNIVERSITY OF CALIFORNIA RETIREMENT PLAN ASSET AND RISK ALLOCATION POLICY
 UNIVERSITY OF CALIFORNIA RETIREMENT PLAN ASSET AND RISK ALLOCATION POLICY Approved March 15, 2018 POLICY SUMMARY/BACKGROUND The purpose of this Asset and Risk Allocation Policy ( Policy ) is to define
Fidelity Freedom 2055 Fund
 QUARTERLY FUND REVIEW AS OF MARCH 31, 2018 Fidelity Freedom 2055 Fund Investment Approach Fidelity Freedom Funds (the Funds) are designed so that the target date referenced in the Fund name is the approximate
Statement of Investment Objectives Exhibit A: Michigan State University s Common Investment Fund
 Statement of Investment Objectives Exhibit A: Michigan State University s Common Investment Fund INTRODUCTION This statement defines the investment objectives of Michigan State University s Common Investment
Implementing Portable Alpha Strategies in Institutional Portfolios
 Expected Return Investment Strategies Implementing Portable Alpha Strategies in Institutional Portfolios Interest in portable alpha strategies among institutional investors has grown in recent years as
The Hartford Target Retirement Funds
 The Hartford Target Retirement Funds Sub-advised by Hartford Investment Management 2011 First Quarter Review Economic Review Asset Class Highlights Outlook Performance Review Economic Review Despite substantial
William A. Hummel Managing Principal. Investment Briefing November 12, 2015
 William A. Hummel Managing Principal Investment Briefing November 12, 2015 AGENDA I. MARKET UPDATE II. CURRENT ENVIRONMENT III. INVESTMENT OPPORTUNITIES IV. QUESTIONS 2 MARKET UPDATE CHINA S DEBT OVERHANG
Q&A Market Implications of Tax Reform
 IN-D EPTH A NALYSIS OF TIMELY INVESTMENT TOPICS Q&A Market Implications of Tax Reform December 27, 2017 Investment Strategy Team Key Takeaways» The Tax Cuts and Jobs Act was signed into law on December
The Myth of Diversification: Risk Factors vs. Asset Classes
 The Myth of Diversification: Risk Factors vs. Asset Classes Sébastien Page, CFA Executive Vice President April 2011 PIMCO Canada will retain PIMCO LLC as a subadvisor. PIMCO Canada Corp., 120 Adelaide
First Quarter 2017 Investment Review. Prepared by: Meketa Investment Group CHICAGO, IL (312)
") First Quarter 2017 Investment Review Prepared by: Meketa Investment Group CHICAGO, IL 60661 (312) 474-0900 MARKET SUMMARY - 1Q17 CAPITAL MARKETS Index MARKET SNAPSHOT MARCH 31, 2017 Qtr One Year Three
First Quarter 2017 Investment Review Prepared by: Meketa Investment Group CHICAGO, IL 60661 (312) 474-0900 MARKET SUMMARY - 1Q17 CAPITAL MARKETS Index MARKET SNAPSHOT MARCH 31, 2017 Qtr One Year Three
Brandes Quarterly Letter: What a Difference a Year Can Make
 Brandes Quarterly Letter: What a Difference a Year Can Make January 9, 2019 by Team of Brandes Investment Partners By the close of 2018, the investment climate had changed significantly from just a year
The Impact of Falling Energy Prices
 INSIGHTS The Impact of Falling Energy Prices December 2014 203.621.1700 2014, Rocaton Investment Advisors, LLC EXECUTIVE SUMMARY * Energy prices, particularly crude oil, have fallen significantly in the