Labor Market Information Outlook
|
|
|
- Evelyn Wade
- 5 years ago
- Views:
Transcription


1 Labor Market Information Outlook Bob Uhlenkott Idaho Department of Labor EMSI National Conference Coeur d Alene, Idaho October 1,


2 Bureau of Labor Statistics Federal/State Cooperative Agreement Programs QCEW Quarterly Census of Employment and Wages CES Current Employment Statistics LAUS Local Area Unemployment Statistics OES Occupational and Employment Statistics MLS Mass Layoff Statistics 2
3

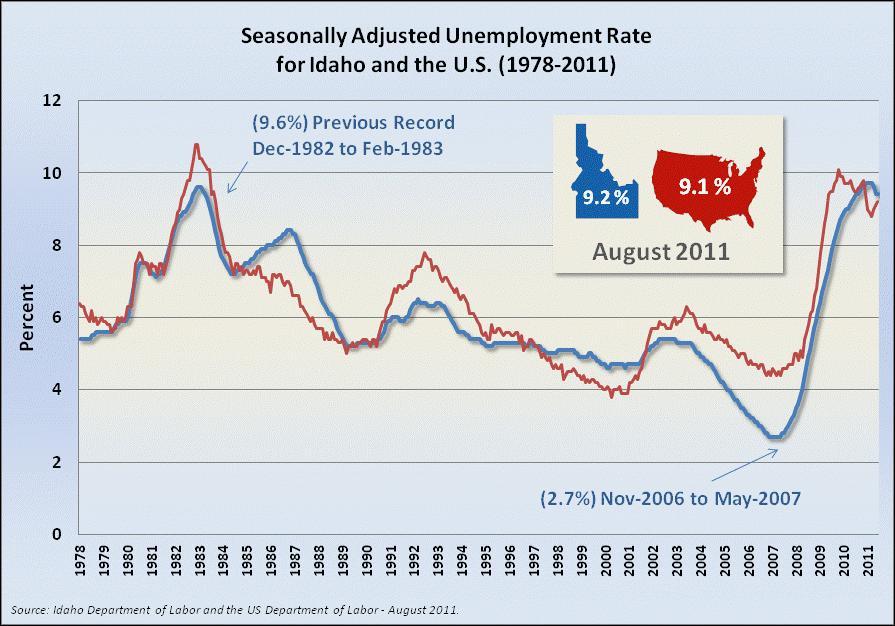
4 The REAL or TRUE Rate of Unemployment!
5 Alternative Measures for Labor Underutilization U-1, persons unemployed 15 weeks or longer, as a percent of the civilian labor force; U-2, job losers and persons who completed temporary jobs, as a percent of the civilian labor force; U-3, total unemployed, as a percent of the civilian labor force (this is the definition used for the official unemployment rate); U-4, total unemployed plus discouraged workers, as a percent of the civilian labor force plus discouraged workers; U-5, total unemployed, plus discouraged workers, plus all other marginally attached workers, as a percent of the civilian labor force plus all marginally attached workers; and U-6, total unemployed, plus all marginally attached workers, plus total employed part time for economic reasons, as a percent of the civilian labor force plus all marginally attached workers.

6 Unemployment Rates Annual Averages State Alternative Measures of Labor Underutilization U-1 U-2 U-3 U-4 U-5 U-6 United States California Idaho Montana Nevada Oregon Utah Washington Wyoming Bureau of Labor Statistics and the Idaho Department of Labor - March 2011
7 Tale of the Tape for Idaho s Economy September By Dennis Cauchon Which state has the fastest-growing economy? It's Idaho, thriving quietly! Idaho s total jobs peaked in June 2007 at 669,500. Total estimated jobs this June 2011 is around 610,000. Idaho s low occurred in January 2010 at 583,400. In the fall of 2009 we experienced record Year-Over-Year job of losses of almost 49,000. Total losses from the recession are just under 60,000.
 Idaho Department of Labor -")
8 Year-to-Year % Change 2.00% Idaho NonFarm Job Performance During Recessions 1.00% 0.00% -1.00% -2.00% -3.00% -4.00% -5.00% -6.00% -7.00% -8.00% Jan Apr Jul Oct Jan Apr Jul Oct Jan Apr Jul Oct Jan Apr Duration Forecast (Sep-09) Idaho Department of Labor - March 2011

9 Jan-07 Jun-07 Nov-07 Apr-08 Sep-08 Feb-09 Jul-09 Dec-09 May-10 Oct-10 Mar-11 Aug-11 Jan-12 Jun-12 Nov-12 Apr-13 Sep-13 Non-farm Jobs Simulated Economic Expansion 680, , , , , , , , ,000 Y-O-Y Gains Pre-recession Levels until 2014


10 Jan-07 Jun-07 Nov-07 Apr-08 Sep-08 Feb-09 Jul-09 Dec-09 May-10 Oct-10 Mar-11 Aug-11 Jan-12 Jun-12 Nov-12 Apr-13 Sep-13 Non-farm Jobs Simulated Economic Expansion - Construction Y-O-Y Gains Pre-recession levels at the earliest around

11


12 Idaho Department of Labor, Energy Business Scan


13 State Labor Market Information Improvement Grants (SGA/DFA PY08-17)


14 What s the big deal with green jobs?

15 Idaho Green Jobs Definition

16 Green Employment in Idaho 3% Data from 2010 Idaho Green Jobs Survey
17 What percent 2005, of 2007 employers and offer 2009 health insurance to their employees*? % Offered 63% Offered 56% Offered *Full Time Employees Only Single Coverage

18 Non -Economic Coding Changes NAICS 2007 to 2012 Changes SOC 2010 Changes Educational Attainment Projections and Career Information Systems
19 Summary of the NAICS Changes The most recent NAICS change (NAICS 2012 revision) was implemented in the 1 st quarter 2011 QCEW data. The next set of changes shouldn t occur until The biggest shift between cells at the 4-digit level was in restaurants. Formerly restaurants were in 7221 (full-service) and 7222 (limited-service), but now all restaurants are in Another change of note was in electric power generation. Other electric power generation (221119) was broken out to distinguish solar, wind, geothermal, and biomass power generation. This change occurred at the 6-digit level, so it won t be obvious to most of our data users. However, it bears mentioning given the recent interest in Green data.
20 Summary of the SOC Changes Registered Nurses: which include advance practice nurses such as nurse practitioners, nurse specialists, midwives, anesthetists Registered Nurse Nurse Anesthetists Nurse Midwives Nurse Practitioners Also in the Healthcare Support occupations, assistants and attendants were separated from orderlies and Phlebotomists essentially separating the care takers from the orderlies.
21 Educational Attainment Replaces single education/training category that was the most significant source of education or training. Now there will be three categories: Entry Level Education 11 typical categories Previous Work Experience - 5 years, 1 to 5 years, less than 1 year, or none. Typical On-the-Job Training internship/residency, apprenticeship, long-term, moderate-term, short-term OTJ training, or none.
22 What s Next in LMI? Partnerships and collaborations between Education and Labor. WICHE Western Interstate Commission for Higher Education SLDS Grants State Longitudinal Database Systems WDQI Workforce Data Quality Initiative Triangulation Partnerships

23 Frequency of the Jobs 37% 30% Percentage Growth In Jobs by Education % 24.8% Unskilled Skilled Professional 33% 15.8% 15.2% 8.4% 12.5% 20.1% 19.6% 18.1% 13.1% 20.8%

24

25

26 Inverse Relationship between Education and Unemployment

27

28


29 $20 Educations Return on Investment for Every Dollar Invested Idaho Department of Labor March 2011 $18 $16 $18 $14 $12 $10 $8 $10 $9 $10 $6 $4 $2 $0 Associate degree or Postsecondary vocational training Bachelor's degree Master's degree or Bachelor's or higher degree, plus work experience First professional degree or Doctoral degree
30 Percentage with a Bachelor's Degree or More (1990, 2000 and 2008) ~ 25 years and older ~ Census Bureau and the Idaho Department of Labor, March 2011 Idaho CA MT NV OR UT WA WY U.S.
31 Percentage with a Bachelor's Degree or More (1990, 2000 and 2008) It is estimated that 20.3% of the jobs in Idaho require a bachelor's degree or more. Direct gap comparisons require a perfect one-to-one match ~ 25 years and older ~ Census Bureau and the Idaho Department of Labor, March 2011 Idaho CA MT NV OR UT WA WY U.S. Poly. (Idaho) Poly. (CA) Poly. (NV) Poly. (UT)
 Over the Next Decade in")
32 Demographic Shifts (Percentage Growth) Over the Next Decade in Idaho
 5 to 9 years 114,519 132,456 17,937 16% 1.12 4% 10 to 14 years 109,467 128,495 19,028 17% 1.09 6% 15 to 19 years 115,347 117,646 2,299 2% 1.06 3% 20 to 24 years 113,813 109,317 (4,496) (4%) 1.")
33 State of Idaho Aging Work Force Age 2008 Population 2019 Population Change % Change Nat LQ 2008 Nat LQ % Change Under 5 years 123, ,732 9,981 8% 1.17 (1%) 5 to 9 years 114, ,456 17,937 16% % 10 to 14 years 109, ,495 19,028 17% % 15 to 19 years 115, ,646 2,299 2% % 20 to 24 years 113, ,317 (4,496) (4%) 1.06 (5%) 25 to 29 years 110, ,985 (3,921) (4%) 1.03 (10%) 30 to 34 years 95, ,207 17,879 19% 0.97 (2%) 35 to 39 years 97, ,397 15,377 16% % 40 to 44 years 94, ,494 8,104 9% % 45 to 49 years 103,974 92,026 (11,948) (11%) % 50 to 54 years 101,539 91,751 (9,788) (10%) 0.94 (7%) 55 to 59 years 91,158 96,834 5,676 6% 0.98 (11%) 60 to 64 years 74,521 96,017 21,496 29% 0.98 (5%) 65 to 69 years 55,785 86,890 31,105 56% % 70 to 74 years 41,763 68,923 27,160 65% % 75 to 79 years 33,593 47,096 13,503 40% % 80 to 84 years 26,100 29,954 3,854 15% % 85 years and o 24,531 27,913 3,382 14% 0.90 (2%) Source: EMSI Complete Employment - 1st Quarter 2011
 (10%) 1.")
 (19%) 0.79 (11%) 45 to 49 years 7,057 5,504 (1,553) (22%) 0.")
 65 to 69 years 4,688 6,824 2,136 46% 1.21 2% 70 to 74 years 3,612 5,682 2,070 57% 1.20 7% 75 to 79 years 3,106 4,182 1,076 35% 1.")
34 North Central Idaho - Region 2 Aging Work Force Age 2008 Population 2019 Population Change % Change Nat LQ 2008t LQ % Change Under 5 years 5,852 6, % % 5 to 9 years 5,433 6, % % 10 to 14 years 5,664 6, % % 15 to 19 years 8,616 7,773 (843) (10%) 1.17 (3%) 20 to 24 years 11,949 10,777 (1,172) (10%) 1.64 (4%) 25 to 29 years 6,609 6,357 (252) (4%) 0.90 (4%) 30 to 34 years 4,712 6,158 1,446 31% % 35 to 39 years 5,653 5, % % 40 to 44 years 5,747 4,673 (1,074) (19%) 0.79 (11%) 45 to 49 years 7,057 5,504 (1,553) (22%) 0.91 (7%) 50 to 54 years 7,383 5,890 (1,493) (20%) 1.01 (13%) 55 to 59 years 6,824 6, % 1.08 (10%) 60 to 64 years 5,854 7,435 1,581 27% 1.14 (1%) 65 to 69 years 4,688 6,824 2,136 46% % 70 to 74 years 3,612 5,682 2,070 57% % 75 to 79 years 3,106 4,182 1,076 35% % 80 to 84 years 2,529 2, % % 85 years and o 2,558 2, % % Source: EMSI Complete Employment - 1st Quarter 2011
35 Local Employment Dynamics Tool Quarterly Workforce Indicators (QWI) On the Map On The Map LED s online dynamic mapping and reporting tool Labor Segments Choose to analyze part of the workforce by age group, earnings or industry Jobs by distance, direction and destination Paired Area Analysis Constrain both sides of the home-work relationship Complex Geography Selection Allows you to add areas together or subtract them from each other to get complex study areas (Census Block based) Where do workers live or work? (including cross-state flows) Most recent version contains data through 2009 with new variables including race, ethnicity and educational attainment. These new variables are only available for 2009 and only appear as characteristics with the Area Profile and Area Comparison analyses. Uses Workforce and economic development, transportation planning and emergency management


36 2009 Wage Earnings by Meridian High School District Boundaries Workers who live in the Meridian High School boundaries earn significantly less income than other high school geographies in the Meridian School District. Only around 34 percent of the workers who reside in the Meridian High School Boundaries earn more than $40k per year as compared to 43 percent for resident who live within the Eagle High School boundaries. 100% 90% 80% 70% 60% 50% 40% 30% 20% 10% 0% 34% 37% 40% 40% 43% 43% 39% 37% 37% 35% 24% 24% 23% 22% 23% MHS CHS MVHS RMHS EHS Less than $15k Between $15k and $40K More than $40K Source: United States Census Bureau, Local Employment Dynamics Program "ON The Map" Query Data

37 Thanks for your time! Bob Uhlenkott ext-3217
Current Economic Review April 16, 2014
 Current Economic Review April 16, 2014 Brian Bonnenfant Project Manager Center for Regional Studies University of Nevada, Reno 784-1771 bonnen@unr.edu 230,000 225,000 **Peak = 228,100 Emp **Start of Great
Plunging Crude Prices: Impact on U.S. and State Economies
 Plunging Crude Prices: Impact on U.S. and State Economies Mine Yücel Senior Vice President and Director of Research August 7, 215 Oil and gas prices plunge Nominal price, $, weekly 16 14 12 Oil Price 1
Household Income Trends: February 2012
 Household Income Trends: February 2012 Issued March 2012 Gordon Green and John Coder Sentier Research, LLC Household Income Trends: February 2012 Copyright 2012 by Sentier Research, LLC Summary of Findings
Key Labor Market and Economic Metrics
 Key Labor Market and Economic Metrics May Update Incorporates Data Available on May 27 th, 2016 This reference is the result of a collaboration between the Bureau of Labor Market Information and Strategic
State of Ohio Workforce. 2 nd Quarter
 To Strengthen Ohio s Families through the Delivery of Integrated Solutions to Temporary Challenges State of Ohio Workforce 2 nd Quarter 2 0 1 2 Quarterly Report on the State of Ohio s Workforce Reference
James K. Polk United States President ( ) Mecklenburg County NC
 Mecklenburg County NC") february 2006 James K. Polk United States President (1845-1849) Mecklenburg County NC http://www.whitehouse.gov/history/presidents/jp11.html January Highlights The Unemployment Rate (Seasonally Adjusted)
february 2006 James K. Polk United States President (1845-1849) Mecklenburg County NC http://www.whitehouse.gov/history/presidents/jp11.html January Highlights The Unemployment Rate (Seasonally Adjusted)
Unemployment Rate - Ottumwa, IA
 - Ottumwa, IA Report Area Ottumwa, IA Social & Economic Factors Economic and social insecurity often are associated with poor health. Poverty, unemployment, and lack of educational achievement affect access
VECTRA BANK 23 RD ANNUAL ECONOMIC FORECAST BREAKFAST START SMART IN 2016! Member FDIC VectraBank.com
 VECTRA BANK 23 RD ANNUAL ECONOMIC FORECAST BREAKFAST START SMART IN 2016! Member FDIC VectraBank.com Economic Presentation April 26, 2016 Tatiana Bailey, Ph.D. Director, UCCS Economic Forum A Little Humor
Economic Indicators For Manufacturing Executives
 Economic Indicators For Manufacturing Executives Valuable Data for a Complex World Presented by: Cliff Waldman Chief Economist, MAPI Foundation cwaldman@mapi.net Today s Presentation The Value of Economic
Household Income Trends: August 2012 Issued September 2012
 Household Income Trends: August 2012 Issued September 2012 Gordon Green and John Coder Sentier Research, LLC For Immediate Release on Tuesday, September 25, 2012 Household Income Trends: August 2012 Copyright
National Economic Conditions. Cheyenne AIA Meeting February 25th, 2011 Rob Godby
 National Economic Conditions Cheyenne AIA Meeting February 25th, 2011 Rob Godby Percent Change Recovery is Technically Underway 8 Quarter-Quarter Growth in Real GDP 6 4 2 0-2 -4-6 -8 I II III IV I II III
2018 Texas Economic Outlook: Firing on All Cylinders
 218 Texas Economic Outlook: Firing on All Cylinders Keith Phillips Assistant Vice President and Senior Economist 4/5/218 The views expressed in this presentation are strictly those of the presenter and
3Volusia County. Economic Development Third Quarter 2018 Update: November 2, 2018
 3Volusia County Economic Development Third Quarter 2018 Update: November 2, 2018 Introduction by County Chair, Ed Kelley The Volusia County Council is pleased to present the most recent economic indicators
MACRO Report: Review of Wyoming s Economy
 MACRO Report: Review of Wyoming s Economy Economic Update as of December 31, 2017 The MACRO Report is a quarterly publication comprised of charts focusing on energy, employment, state revenues, and other
3/25/2008 EMPLOYMENT TRENDS IN ILLINOIS. Nonfarm Employment Change in Nonfarm Employment by Decade
 Voices for Illinois Children Symposium, March 28, 28 Paul Kleppner, Ph.D. Office for Social Policy Research Northern Illinois University EMPLOYMENT TRENDS IN ILLINOIS 7 Nonfarm Employment 195-27 6 ployees
Quarterly Economic Update Key Trends
 Quarterly Economic Update Key Trends Linda Haran Senior Director June 2011 Experian and the marks used herein are service marks or registered trademarks of Experian Information Solutions, Inc. Other product
C I T Y O F B O I S E
 C I T Y O F B O I S E D E P A R T M E N T O F F I N A N C E A N D A D M I N I S T R A T I O N Office of Budget Development & Monitoring Economic Brief Shannon Cade, Financial Analyst & Brent Davis, Budget
City of Modesto Economic Indicators December 2014 Edition
 City of Modesto Economic Indicators December 2014 Edition Steve Christensen City of Modesto Economic Outlook: City of Modesto The City of Modesto continues to slowly recover from the Great Recession. Some
Unemployment Rate Edges Lower to 5.0 Percent Employment Down in December
 Media Contact 609-984-2841 EMAIL: MediaCalls@dol.state.nj.us Unemployment Rate Edges Lower to 5.0 Percent Employment Down in December TRENTON, January 18, 2018 Preliminary monthly estimates released by
Will the Recovery Ever End? Certified Financial Planners
 Will the Recovery Ever End? Certified Financial Planners Place cover image here Richard Wobbekind Senior Economist and Associate Dean for Business and Government Relations January 25, 219 Attention: This
A Labor Market Information Publication FOURTH QUARTER 2002
 A Labor Market Information Publication FOURTH QUARTER THE IOWA LABOR MARKET IN : AN ELUSIVE RECOVERY IN GENERAL, ECONOMIC CONDITIONS SHOWED SOME IMPROVEMENT IN, but the recovery that was expected to take
THE EMPLOYMENT SITUATION: MAY 2002
 Technical information: Household data: (202) 691-6378 USDL 02-332 http://www.bls.gov/cps/ Establishment data: 691-6555 Transmission of material in this release is http://www.bls.gov/ces/ embargoed until
1. External Economic Drivers 2. Current Conditions 3. Economic Projections 4. Long term Trends
 Maine s Economic Outlook: 2010 and Beyond January 12, 2010 James Breece, Ph.D. University of Maine System Outline 1. External Economic Drivers 2. Current Conditions 3. Economic Projections 4. Long term
2010 Economic Forecast: U.S. and State Conditions
 2010 Economic Forecast: U.S. and State Conditions Russell R. Evans Director and Research Economist Center for Applied Economic Research Oklahoma State University Stillwater russell.evans@okstate.edu http://www.spears.okstate.edu/caer
Uinta Basin Energy Summit Economic Overview September 10, 2015
 Uinta Basin Energy Summit Economic Overview September 10, 2015 Overview National Economic Conditions Utah Economic Conditions Utah is One of the Fastest Growing CA States in the Country Percent Change
2018 Economic Forum CALHOUN COUNTY CHAMBER OF COMMERCE AND VISITORS CENTER. School of Business and Industry. Information provided by
 2018 Economic Forum CALHOUN COUNTY CHAMBER OF COMMERCE AND VISITORS CENTER Information provided by School of Business and Industry THANK YOU to our SPONSORS Calhoun County Economy Forum National Update
White Pine County. Economic and Demographic Profile, 1999
 TECHNICAL REPORT UCED 99/2000-18 White Pine County Economic and Demographic Profile, 1999 UNIVERSITY OF NEVADA, RENO White Pine County Economic and Demographic Profile, 1999 Study Conducted by: Shawn W.
Illinois Job Index. Growth Rate %
 Illinois Job Index Release Data Issue 03/14/2011 Jan 1990 / Jan 2011 2011.02 www.real.illinois.edu For January Illinois Job Index, the Nation, RMW and the state all had positive job growth. The monthly
XML Publisher Balance Sheet Vision Operations (USA) Feb-02
 Feb-02") Page:1 Apr-01 May-01 Jun-01 Jul-01 ASSETS Current Assets Cash and Short Term Investments 15,862,304 51,998,607 9,198,226 Accounts Receivable - Net of Allowance 2,560,786
Page:1 Apr-01 May-01 Jun-01 Jul-01 ASSETS Current Assets Cash and Short Term Investments 15,862,304 51,998,607 9,198,226 Accounts Receivable - Net of Allowance 2,560,786
Monthly Labour Force Survey Statistics December 2018
 800 Monthly Labour Force Survey Statistics CALGARY CMA Table 282-0135 Labour force survey estimates (LFS), by census metropolitan area based on 2011 census boundaries, 3-month moving average, seasonally
Monthly Labour Force Survey Statistics November 2018
 800 Monthly Labour Force Survey Statistics CALGARY CMA Table 282-0135 Labour force survey estimates (LFS), by census metropolitan area based on 2011 census boundaries, 3-month moving average, seasonally
FOR THE STUDY OF RACE AND ETHNICITY
 March 2010 Race-Recovery Index Is Stimulus Helping Communities in Crisis? KIRWAN INSTITUTE FOR THE STUDY OF RACE AND ETHNICITY THE OHIO STATE UNIVERSITY john a. powell Executive Director Andrew Grant-Thomas
FOR THE STUDY OF RACE AND ETHNICITY
 May 2010 Race-Recovery Index Is Stimulus Helping Communities in Crisis? KIRWAN INSTITUTE FOR THE STUDY OF RACE AND ETHNICITY THE OHIO STATE UNIVERSITY john a. powell Executive Director Andrew Grant-Thomas
Illinois Job Index Note: BLS revised its estimates for the number of jobs and seasonal adjustment method at the beginning of 2010.
 Illinois Job Index Release Data Issue 4/21/2010 Jan 1990 / Mar 2010 Note: BLS revised its estimates for the number of jobs and seasonal adjustment method at the beginning of 2010. For April Illinois Job
Revised October 17, 2016
 Revised October 17, 2016 60 ISM Manufacturing Purchasing Managers Index (September 2015 September 2016) 58 56 54 52 50 48 46 44 42 Sept-15 Oct Nov Dec Jan-16 Feb Mar Apr May Jun Jul Aug Sept Purchasing
November 2018 Labor Market Review Reported by: Kent Sellers
 November 2018 Labor Market Review Reported by: Kent Sellers Regional Workforce Analyst Tel: 260-469-4313 Email Kent wsellers@dwd.in.gov Economic Growth Region 6 Statistical Data Report for November 2018,
Metro Area Unemployment Rates All Decline; Las Vegas Accounts for the Bulk of the Job Growth Over the Month
 SEPTEMBER SUB-STATE PRESS RELEASE For Immediate Release October 23, 2018 Metro Area Unemployment Rates All Decline; Las Vegas Accounts for the Bulk of the Job Growth Over the Month CARSON CITY, NV According
DEPARTMENT OF LABOR AND INDUSTRIAL RELATIONS HAWAII'S UNEMPLOYMENT RATE AT NEW RECORD 2.0 PERCENT IN NOVEMBER
 DEPARTMENT OF LABOR AND INDUSTRIAL RELATIONS FOR IMMEDIATE RELEASE December 21, 20 D A V I D Y. I G E G O V E R N O R L E O N A R D H O S H I J O A C T I N G D I R E C T O R HAWAII'S UNEMPLOYMENT RATE
Key West Cruise Ship Data - Passenger Counts Number of Passenger Arrivals
 Key West Cruise Ship Data - Passenger Counts Number of Passenger Arrivals (Source: City of Key West Port Operations Office) Month 2000 2001 2002 2003 2004 2005 2006 2007 2008 2009 2010 2011 2012 2013 2014
KSGFOA 2017 Fall Conference
 An Economic Outlook: Changing Times and What It Means for Your Organization PRESENTATION TO KSGFOA 2017 Fall Conference October 13, 2017 PRESENTER: Sheryl D. Bailey, Ph.D. Senior Vice President Roadmap
Today's jobs data: what you need to know
 Trend Macrolytics, LLC Donald Luskin, Chief Investment Officer Thomas Demas, Managing Director Michael Warren, Energy Strategist Data Insights: Jobs Friday, August 3, 2018 Today's jobs data: what you need
DEPARTMENT OF LABOR AND INDUSTRIAL RELATIONS. HAWAII'S UNEMPLOYMENT RATE AT 2.2 PERCENT IN SEPTEMBER Jobs Increase 11,600 Over the Year
 DEPARTMENT OF LABOR AND INDUSTRIAL RELATIONS FOR IMMEDIATE RELEASE October, 20 DAVID Y. IGE GOVERNOR LEONARD HOSHIJO DIRECTOR HAWAII'S UNEMPLOYMENT RATE AT 2.2 PERCENT IN SEPTEMBER Jobs Increase 11,600
University of New Mexico Bureau of Business and Economic Research. New Mexico Women s Agenda Lobbying Workshop. State of the Economy: US, New Mexico
 University of New Mexico Bureau of Business and Economic Research New Mexico Women s Agenda Lobbying Workshop State of the Economy: US, New Mexico January 11, 2013 Dr. Lee A. Reynis, Director lreynis@unm.edu
Marion County. S.C. Department of Employment & Workforce. Business Intelligence Department
 S.C. Department of Employment & Workforce Business Intelligence Department 1550 Gadsden Street, PO Box 995 Columbia, SC 29202 803.737.2660 www.scworkforceinfo.com Updated: 07/20/2017 Table Of Contents
Today's jobs data: what you need to know
 Trend Macrolytics, LLC Donald Luskin, Chief Investment Officer Thomas Demas, Managing Director Michael Warren, Energy Strategist Data Insights: Jobs Friday, January 4, 2019 Today's jobs data: what you
Today's jobs data: what you need to know
 Trend Macrolytics, LLC Donald Luskin, Chief Investment Officer Thomas Demas, Managing Director Michael Warren, Energy Strategist Data Insights: Jobs Friday, September 7, 2018 Today's jobs data: what you
Today's jobs data: what you need to know
 Trend Macrolytics, LLC Donald Luskin, Chief Investment Officer Thomas Demas, Managing Director Michael Warren, Energy Strategist Data Insights: Jobs Friday, December 7, 2018 Today's jobs data: what you
South Central Alabama Comprehensive Economic Development Strategy
 South Central Alabama Comprehensive Economic Development Strategy August 2012 2013 Updated Excerpt CGI Group, Inc. in Troy Hyundai Motor Manufacturing Alabama in Montgomery Acknowledgements: Funding for
BLS Data: State Adds 8,900 Private Sector Jobs, 2,100 Manufacturing Jobs in March: Unemployment Rate Holds at Historically Low 2.
 Department of Workforce Development Secretary s Office 201 E. Washington Avenue P.O. Box 7946 Madison, WI 53707 Telephone: (608) 266-3131 Fax: (608) 266-1784 Email: sec@dwd.wisconsin.gov Scott Walker,
Western Treasure Valley Economic Breakfast Economic Overview March 17, 2016
 Western Treasure Valley Economic Breakfast Economic Overview March 17, 2016 Utah is One of the Fastest Growing CA 0.9% States in the Country Percent Change in Population for States: 2012 to 2013 WA 1.1%
Permian Basin Workforce Development Area* February 2016
 Workforce Development Area* February 2016 WDA CLF Employed Unemployed Rate CLF Employed Unemployed Rate Feb-16 232,454 221,480 10,974 4.7 Feb-16 13,221,720 12,654,923 566,797 4.3 Jan-16 230,842 220,266
The Health of Jefferson County: 2010 Demographic Update
 The Health of : 2010 Demographic Update BACKGROUND How people live the sociodemographic context of their lives influences their health. People who have lower incomes may not have the resources to meet
Plunging Oil Prices: Impact on the U.S. and State Economies
 Plunging Oil Prices: Impact on the U.S. and State Economies Mine Yücel Senior Vice President and Director of Research November 17, 216 Nominal price, weekly 16 14 Oil and gas prices volatile 12 1 Oil price
Office of the Chief Economist National Credit Union Administration. Economic Overview. California State Examiner School.
 Office of the Chief Economist National Credit Union Administration California State Examiner School May 30, 2017 Credit Union Performance Trends Recent Data About Credit Union Performance in California,
Nevada s Job Growth Remains Positive in July with the Unemployment Rate Down Over the Year
 For Immediate Release August 16, 2017 Nevada s Job Growth Remains Positive in July with the Unemployment Rate Down Over the Year CARSON CITY, NV Nevada s unemployment rate ticked up 0.1 of a percentage
Wisconsin Adds Nearly 10,000 Private-Sector Jobs in November, Unemployment Rate Remains at or Below 3 percent for 10 th Straight Month
 Department of Workforce Development Secretary s Office 201 E. Washington Avenue P.O. Box 7946 Madison, WI 53707 Telephone: (608) 266-3131 Fax: (608) 266-1784 Email: sec@dwd.wisconsin.gov Scott Walker,
Six-Year Income Tax Revenue Forecast FY
 Six-Year Income Tax Revenue Forecast FY 2017-2022 Prepared for the Prepared by the Economics Center February 2017 1 TABLE OF CONTENTS EXECUTIVE SUMMARY... i INTRODUCTION... 1 Tax Revenue Trends... 1 AGGREGATE
Nevada Adds 2,800 Jobs in September to 1,394,100 While Unemployment Remains Unchanged at 4.5%
 For Immediate Release October 17, 2018 SEPTEMBER STATEWIDE LABOR MARKET RELEASE Nevada Adds 2,800 Jobs in September to 1,394,100 While Unemployment Remains Unchanged at 4.5% CARSON CITY, NV - The state
CBER Indexes for Nevada and Southern Nevada
 CBER Indexes for Nevada and Southern Nevada Published March 24, 2016 Stephen M. Miller, PhD, Director Jinju Lee, Economic Analyst Summary of CBER s Nevada Indexes Coincident Index Leading Index Mo. to
Spheria Australian Smaller Companies Fund
 29-Jun-18 $ 2.7686 $ 2.7603 $ 2.7520 28-Jun-18 $ 2.7764 $ 2.7681 $ 2.7598 27-Jun-18 $ 2.7804 $ 2.7721 $ 2.7638 26-Jun-18 $ 2.7857 $ 2.7774 $ 2.7690 25-Jun-18 $ 2.7931 $ 2.7848 $ 2.7764 22-Jun-18 $ 2.7771
Economic Overview of the Wild, Wild West
 Economic Overview of the Wild, Wild West Christine Cooper, Ph.D. Regional Economist (West) Copyright 217 CoStar Realty Information, Inc. No reproduction or distribution without permission. But first, let
For Immediate Release April 15, 2015
 For Immediate Release April 15, 2015 Nevada s Unemployment Rate Holds Steady at 7.1 Percent in March Metro area labor market information will be released April 21st as part of a new reporting schedule
Status of the Unemployment Trust Fund and Related Issues. Commission on Unemployment Compensation. Ellen Marie Hess, Commissioner.
 Status of the Unemployment Trust Fund and Related Issues Commission on Unemployment Compensation August 8, 2018 Ellen Marie Hess, Commissioner 2 Trust Fund Data Standard Forecast (Millions of Dollars)
VECTRA BANK 23 RD ANNUAL ECONOMIC FORECAST BREAKFAST START SMART IN 2016! Member FDIC VectraBank.com
 VECTRA BANK 23 RD ANNUAL ECONOMIC FORECAST BREAKFAST START SMART IN 2016! Member FDIC VectraBank.com Colorado s Economy and State Budget Office of State Planning and Budgeting April 26, 2016 Jason Schrock,
5.7% 5,895,200 13,778
 PA MONTHLY WORKSTATS LABOR FORCE JOBS UNEMPLOYMENT COMPENSATION PA Monthly WorkStats presents the most up-to-date labor market highlights and happenings in the commonwealth. Information herein is produced
III. Economic Profile
 III. Overview The of Mecklenburg County will provide a selection of workforce data collected and developed by the Virginia Employment Commission (VEC), along with data stemming from a partnership with
CBER Indexes for Nevada and Southern Nevada
 CBER Indexes for Nevada and Southern Nevada Published June 23, 2017 Stephen M. Miller, PhD, Director Nicolas Prada, Graduate Research Assistant Summary of CBER s Nevada Indexes Coincident Index (March)
What Will The Montgomery County Economy Look Like in 2017
 Montgomery County Chamber of Commerce What Will The Montgomery County Economy Look Like in 217 Stephen S. Fuller, Ph.D. Dwight Schar Faculty Chair and University Professor Director, Center for Regional
Big Walnut Local School District
 Big Walnut Local School District Monthly Financial Report for the month ended September 30, 2013 Prepared By: Felicia Drummey Treasurer BIG WALNUT LOCAL SCHOOL DISTRICT SUMMARY OF YEAR TO DATE FINANCIAL
Zions Bank Economic Overview
 Zions Bank Economic Overview Utah League of Cities and Towns June 18, 2018 Utah Economic Conditions CA 0.6% OR 1.4% WA 1.7% NV 2.0% Utah Population 3 rd Fastest Growing in U.S. ID 2.2% UT 1.9% AZ 1.6%
The Federal Reserve Balance Sheet and Monetary Policy
 EMBARGOED UNTIL WEDNESDAY, APRIL 19 AT 12:30 P.M.; OR UPON DELIVERY The Federal Reserve Balance Sheet and Monetary Policy Eric S. Rosengren President & CEO Federal Reserve Bank of Boston April 19, 2017
NEAZ Members: Cherokee County
 1 NEAZ Members: Cherokee County 2 NEAZ Members: DeKalb County 3 NEAZ Members: Etowah County 4 NEAZ Members: Marshall County 5 NEAZ Members: Cherokee County April 27, 2011 6 NEAZ Members: DeKalb County
Arkansas Works Overview. Work And Community Engagement Requirement
 1 Arkansas Works Overview Work And Community Engagement Requirement Arkansas Works Populations & Work and Community Engagement Requirement 2 Arkansas Works enrollees will fall into three categories for
Nevada Labor Market Briefing: January Summary of Labor Market Economic Indicators
 Nevada Labor Market Briefing: January 2019 Summary of Labor Market Economic Indicators Department of Employment, Training, & Rehabilitation Dr. Tiffany Tyler-Garner, Director Dennis Perea, Deputy Director
BLS Data: Wisconsin's Labor Force, Total Employment Reach Record Highs in June; 41,500 More Employed Over Year
 Department of Workforce Development Secretary s Office 201 E. Washington Avenue P.O. Box 7946 Madison, WI 53707 Telephone: (608) 266-3131 Fax: (608) 266-1784 Email: sec@dwd.wisconsin.gov Scott Walker,
NEVADA SUB-STATE LABOR MARKET OVERVIEW. October 2018
 RESEARCH AND ANALYSIS BUREAU BRIAN SANDOVAL GOVERNOR DON SODERBERG DIRECTOR DAVID SCHMIDT CHIEF ECONOMIST NEVADA SUB-STATE LABOR MARKET OVERVIEW October 2018 Statewide, seasonally adjusted employment increased
BLS Data: Wisconsin Unemployment Rate Remains at or Below 3 percent for Record 9 th Straight Month
 Department of Workforce Development Secretary s Office 201 E. Washington Avenue P.O. Box 7946 Madison, WI 53707 Telephone: (608) 266-3131 Fax: (608) 266-1784 Email: sec@dwd.wisconsin.gov Scott Walker,
Oregon. December 2013 Economic & Revenue Outlook. Mark McMullen & Josh Lehner Office of Economic Analysis. November 21, 2013
 Oregon December 2013 Economic & Revenue Outlook November 21, 2013 Mark McMullen & Josh Lehner Office of Economic Analysis Oregon Economic Outlook All Signs Point To Expansion 1.75 Total Nonfarm Employment
REAL EARNINGS DECEMBER 2018
 Transmission of material in this release is embargoed until 8:30 a.m. (EST), Friday, January 11, 2019 USDL-19-0019 Technical Information: (202) 691-6555 cesinfo@bls.gov www.bls.gov/ces Media Contact: (202)
CURRENT ECONOMIC REVIEW April 21, Brian Bonnenfant
 CURRENT ECONOMIC REVIEW April 21, 2015 Brian Bonnenfant Current Employment Reno-Sparks MSA 230,000 225,000 Dec-06: 228,100 220,000 215,000 210,000 205,000-23,300 Dec-14 = 204,800 200,000 195,000 190,000
REAL EARNINGS AUGUST 2018
 Transmission of material in this release is embargoed until 8:30 a.m. (EDT), Thursday, September 13, 2018 USDL-18-1454 Technical Information: (202) 691-6555 cesinfo@bls.gov www.bls.gov/ces Media Contact:
Zions Bank Economic Overview
 Zions Bank Economic Overview Utah Institute of Real Estate Management Economic Summit September 12, 2017 National Economic Conditions August Job Indicators Indicator Expectation Actual Total Nonfarm Payrolls
nc today october 2006 Photo courtesy of NC Division of Tourism, Film and Sports development. Linn Cove Viaduct, Blue Ridge Parkway, NC
 nc today october 2006 Photo courtesy of NC Division of Tourism, Film and Sports development. Linn Cove Viaduct, Blue Ridge Parkway, NC September Highlights North Carolina Unemployment Rate (Seasonally
REAL EARNINGS JUNE 2018
 Transmission of material in this release is embargoed until 8:30 a.m. (EDT), Thursday, July 12, 2018 USDL-18-1144 Technical Information: (202) 691-6555 cesinfo@bls.gov www.bls.gov/ces Media Contact: (202)
North Carolina s June Employment Figures Released
 For Immediate Release: July 20, For More Information, Contact: Beth Gargan/919.814.4610 North Carolina s Employment Figures Released RALEIGH The state s seasonally adjusted unemployment rate was 4.2 percent,
Paying Out-of-Pocket
 September 2017 Paying Out-of-Pocket The Healthcare Spending of 2 Million US Families Healthcare costs are rising for families. In 2015 the US spent 18 percent of Gross Domestic Product (GDP) on healthcare,
CBER Economic Indexes for Nevada and Southern Nevada
 CBER Economic Indexes for Nevada and Southern Nevada Published November 14, 2018 Stephen M. Miller, PhD, Director Hasara Rathnasekara, Graduate Research Assistant Summary of CBER s Nevada Indexes Coincident
Mutual Fund Tax Information
 Mutual Fund Tax Information We have provided this information as a service to our shareholders. Thornburg Investment Management cannot and does not give tax or accounting advice. If you have further questions
Labor Market & Career Information (LMCI) Texas Workforce Commission.
 Texas Workforce Commission.") Integrating ti LED Dt Data into Regional Labor Market Storytelling Labor Market & Career Information (LMCI) Texas Workforce Commission richard.froeschle@twc.state.tx.us (512) 936-31053 The labor market
Integrating ti LED Dt Data into Regional Labor Market Storytelling Labor Market & Career Information (LMCI) Texas Workforce Commission richard.froeschle@twc.state.tx.us (512) 936-31053 The labor market
North Carolina s April Employment Figures Released
 For Immediate Release: May 18, For More Information, Contact: Beth Gargan/919.814.4610 North Carolina s April Employment Figures Released RALEIGH The state s seasonally adjusted April unemployment rate
Department of Public Welfare (DPW)
") Department of Public Welfare (DPW) Office of Income Maintenance Electronic Benefits Transfer Card Risk Management Report Out-of-State Residency Review FISCAL YEAR 2014-2015 September 2014 (June, July and
Department of Public Welfare (DPW) Office of Income Maintenance Electronic Benefits Transfer Card Risk Management Report Out-of-State Residency Review FISCAL YEAR 2014-2015 September 2014 (June, July and
Nevada s Unemployment Rate Drops to 9 Percent
 For Immediate Release December 20, 2013 Nevada s Unemployment Rate Drops to 9 Percent Carson City, NV Nevada s unemployment rate fell to 9 percent in November, down from 9.3 percent in October, making
Mutual Fund Tax Information
 2008 Mutual Fund Tax Information We have provided this information as a service to our shareholders. Thornburg Investment Management cannot and does not give tax or accounting advice. If you have further
Current Employment Statistics
 Current Employment Statistics October 2017 If you have any questions or seek additional information, please contact: Vermont Department of Labor Economic and Labor Market Information Division 802-828-4202
North Carolina s January Employment Figures Released
 For Immediate Release: March 13, For More Information, Contact: Beth Gargan/919.814.4610 North Carolina s January Employment Figures Released RALEIGH The state s seasonally adjusted January unemployment
Michigan s January Unemployment Rate Moves Up Seasonally
 Labor Market News Michigan s March 2016 Vol. 72, Issue No. 1 Percent Michigan s January Unemployment Rate Moves Up Seasonally Michigan s unemployment rate (not seasonally adjusted) increased by 0.6 of
The Oil Market: From Boom to Gloom
 The Oil Market: From Boom to Gloom Mine Yücel Senior Vice President and Director of Research February 12, 216 The views expressed are those of the speaker and should not be attributed to the or the Federal
U.S. and Montana Economic Outlook
 U.S. and Montana Economic Outlook Patrick M. Barkey, Director Bureau of Business and Economic Research University of Montana Is the Story of the U.S. Economy Changing? Old Story Better growth next year
Slow and Low: The Economic and Financial Outlook
 Southern Legislative Conference 7th Annual Meeting Slow and Low: The Economic and Financial Outlook July, William R. Emmons Federal Reserve Bank of St. Louis William.R.Emmons@stls.frb.org These comments
CBER Economic Indexes for Nevada and Southern Nevada
 CBER Economic Indexes for Nevada and Southern Nevada Published December 19, 2017 Stephen M. Miller, PhD, Director Nicolas Prada, M.A., Graduate Research Assistant Summary of CBER s Nevada Indexes Coincident