Date: 21 September Contents (ctrl+click to follow link): SP 500
|
|
|
- Clifford Newton
- 5 years ago
- Views:
Transcription

1 Date: 21 September 2015 Contents (ctrl+click to follow link): SP 500 ; Top 40 Chart ; Currency ; Charts of Interest ; Relative Rotation Graph ; Scatter Graph ; Sector Analysis ; Weekly Perfomances SP 500

2 The SP500 broke to the upside of the symmetrical triangle we drew in the last report, but the breakout was short lived. The SP500 has now formed a flat top triangle, with resistance being just shy of the 2000 level. We will have to wait and see for the direction of the breakout. Home TOP 40 CHART

3 The Top40 Index had a strong upside break thanks to SAB. The target of the triangle break was reached. We are now once again at that neckline around the level. We have resistance at and support at the lower side of the triangle at roughly Home CURRENCY The Rand

4 From the last report we mentioned that support could come at the level to the $. Now that we are there, it seems that the Rand has found resistance and wants to weaken again. Home CHARTS OF INTEREST This week we will choose a few stocks from the midcap index that look interesting. These include ILV, SUI, PSG and GND.


5 Illovo seems to have reversed its downward trend with a symmetrical triangle having been broken. The target of the triangle points to its 200 MA which is at R20.

6 From the above 5 year chart we can see that Sun International has been in a quite a sharp downtrend. However, it may be reaching a long term support line at around the R90 level. We need to see if SUI can reverse off this level. PSG is trading at resistance and could potentially move back down into its trading range.

7 Grinrod seems to have reversed its downward trend and is now trading in a new upward trading channel. It is, however, approaching its 200 DMA and can find some resistance here. Home RELATIVE ROTATION GRAPH Below we have a few sectors relative to the Allshare Index. The sectors are based on the Business Day division of sectors.

8 The sectors that are out performing the AllShare with good momentum are property, consumer goods and industrials. See the scatter graphs for the components of these sectors. Explanation on the RRG: Note that each symbol on the chart is plotted as a dot with a tail extending backwards. The tail shows you the history of the symbol's position in the past. Each dot on each symbol's tail represents one period, in this case a week. The large dot at the end of the tail represents the current relative momentum values for that ticker symbol and the colour represents the current quadrant it finds itself in. There are four quadrants on the chart: Leading (Green) - strong relative strength and strong momentum Weakening (Yellow) - strong relative strength but weakening momentum Lagging (Red) - weak relative strength and weak momentum Improving (Blue) - weak relative strength but improving momentum Typically, indices progress through the quadrants in a clockwise manner. Interpretation: The longer the tail, the bigger the move and higher the volatility. The further the index is from the benchmark (the cross hairs) the bigger the move in relative performance (up or down) RS-Ratio (relative strength) is more important than RS-Momentum
9 The rotational patterns are not always perfectly circular and will not always rotate through all four quadrants in a clockwise manner. These are, after all, financial markets driven by fear and greed. In general, a cross from the left half to the right half signals a new uptrend in relative performance. This means RS-Ratio has moved above 200. Conversely, a cross from the right half to the left half signals a new downtrend in relative performance. This means RS-Ratio has moved below 200. The underlying trend-following model that powers RRG includes a lag period, as do all trendfollowing models. This means there will already be upward movement in the price relative before the RRG line actually crosses into the leading quadrant. Similarly, the price relative will peak and move lower before the RRG line actually crosses into the lagging quadrant. Symbols in the leading quadrant should be on your buy list because they show relative strength. Symbols in the weakening quadrant should be on your watch-list for deterioration. Symbols in the lagging quadrant should be on your avoid list because they show relative weakness. Symbols in the improving quadrant should be on your shopping list as potential buys. RRGs separate the market leaders from the market laggards and therefore great for channeling your attention to those areas of the market that deserve it. Keep in mind that these are relative performance indicators, and there is still a risk that the rotation turns back or even reverses. Home SCATTTER GRAPH Our attention is to create a picture of where each stock can be seen technically relative to each other in each of the sectors mentioned in the above Relative Rotation Graph. The technical factors we are using is a 50 day moving average and 14 day RSI. The stock position will highlight their overbought and oversold levels. The colour represents the percentage move over the week. Consumer Goods:
10 Basic Materials:
11 Industrials: Health Care:
12 Consumer Services:
13 Telecoms: Financials:

14 Property: Home SECTOR ANALYSIS Percentage points of various Sectors above or below their various Moving Averages: Previous week: INDEX 200 SMA 100 SMA 50 SMA 20 SMA Banks Gen Retailers Resource Industrial Financial Property % price above moving average % price below moving average
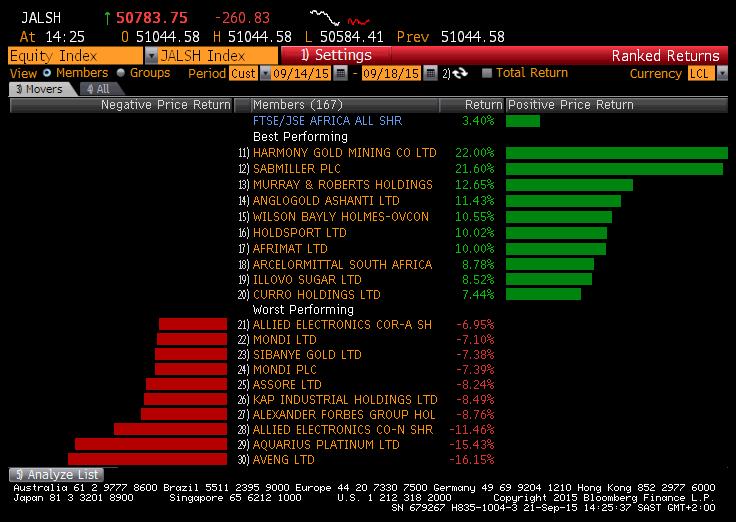
15 This week: INDEX 200 SMA 100 SMA 50 SMA 20 SMA Banks Gen Retailers Resource Industrial Financial Property % price above moving average % price below moving average Home WEEKLY PERFORMANCES The week s best and worst performers: JSE ALLSHARE:
16 MIDCAP:
17 Home Compiled by Kevin Barlow-Jones and Simon Hobday Disclosure This report provides general information only. This report is not intended to provide personal investment advice and it does not take into account the specific investment objectives, financial situation and the particular needs of any specific person. Investors should seek financial advice regarding the appropriateness of investing in financial instruments mentioned in this report and should understand that statements regarding future prospects may not be realized. No security, financial instrument or derivative is suitable for all investors. Past performance and technical patterns and analysis is not necessarily a guide to future performance. This report may contain a short-term trading idea or recommendation, which highlights a specific near-term catalyst, pattern or event impacting the company or the market that is anticipated to have a short-term price impact on the equity securities of the company. Shortterm trading ideas and recommendations are different from and may not affect a stock's fundamental equity rating. Facts and views presented in this material have not been reviewed by, and may not reflect information known to, professionals in other business areas of Constant Capital, trading as Sinayo Securities. Neither Constant Capital, trading as Sinayo Securities, nor any officer or employee of Constant Capital, trading as Sinayo Securities, accepts any liability whatsoever for any direct, indirect or consequential damages or losses arising from any use of this report or its contents.
Contents: Top 40 Chart ; Currency ; Charts of Interest ; Scatter Graph ; Relative Rotation Graph ; Stats. Top 40 Chart
 Contents: Top 40 Chart ; Currency ; Charts of Interest ; Scatter Graph ; Relative Rotation Graph ; Stats Top 40 Chart 1 Last week we saw the Top 40 approaching some moving average resistances, we have
Weekly Technical Report 18 July 2016
 Weekly Technical Report 18 July 2016 Contents (ctrl+click to follow link): SP 500 ; Top 40 Chart ; Currency ; Charts of Interest ; Relative Rotation Graph ; Sector Analysis ; Weekly Perfomances SP500 above
Weekly Technical Report 3 October 2016
 Weekly Technical Report 3 October 2016 Contents (ctrl+click to follow link): SP 500 ; Top 40 Chart ; Currency ; Commodities ; Charts of Interest ; Relative Rotation Graph ; Sector Analysis ; Weekly Perfomances
Weekly Technical Report 26 September 2016
 Weekly Technical Report 26 September 2016 Contents (ctrl+click to follow link): SP 500 ; Top 40 Chart ; Currency ; Commodities ; Charts of Interest ; Relative Rotation Graph ; Sector Analysis ; Weekly
Relative Rotation Graphs (RRG Charts)
") Relative Rotation Graphs (RRG Charts) Introduction Relative Rotation Graphs or RRGs, as they are commonly called, are a unique visualization tool for relative strength analysis. Chartists can use RRGs
Relative Rotation Graphs (RRG Charts) Introduction Relative Rotation Graphs or RRGs, as they are commonly called, are a unique visualization tool for relative strength analysis. Chartists can use RRGs
Portfolio Alpha from Relative Strength An Introduction to Relative Rotation Graphs By Mathew Verdouw, CMT
 Portfolio Alpha from Relative Strength An Introduction to Relative Rotation Graphs By Disclaimer NO FINANCIAL ADVICE - The Information in this presentation is provided for education and informational purposes
Weekly outlook for May 28/9 - June 1, 2018
 Weekly outlook for May 28/9 - June 1, 2018 Summary The S&P500 index is expected to be dull due to the short week, barring major news. A minor pullback maybe seen, but it should be a very short-lived. It
Market Maps. Bob Dickey, Technical Strategist, Portfolio Advisory Group. December RBC Capital Markets, LLC / Portfolio Advisory Group
 Market Maps Bob Dickey, Technical Strategist, Portfolio Advisory Group RBC Capital Markets, LLC / Portfolio Advisory Group All values in U.S. dollars and priced as of market close, December 1, 2017, unless
Technical Indicators
 Taken From: Technical Analysis of the Financial Markets A Comprehensive Guide to Trading Methods & Applications John Murphy, New York Institute of Finance, Published 1999 Technical Indicators Technical
Introduction. Leading and Lagging Indicators
 1/12/2013 Introduction to Technical Indicators By Stephen, Research Analyst NUS Students Investment Society NATIONAL UNIVERSITY OF SINGAPORE Introduction Technical analysis comprises two main categories:
Technical analysis & Charting The Foundation of technical analysis is the Chart.
 Technical analysis & Charting The Foundation of technical analysis is the Chart. Charts Mainly there are 2 types of charts 1. Line Chart 2. Candlestick Chart Line charts A chart shown below is the Line
Forex Sentiment Report Q2 FORECAST WEAK AS LONG AS BELOW April
 Forex Sentiment Report 08 April 2015 www.ads-securities.com Q2 FORECAST WEAK AS LONG AS BELOW 1.1200 Targets on a break of 1.1534/35: 1.1740/50 1.1870/75 1.2230/35 Targets on a break of 1.0580/70: 1.0160
Weekly outlook for May 21 - May 25, 2018
 Weekly outlook for May 21 - May 25, 2018 Summary The S&P500 index is expected to hold up for a higher level. The market broke to the upside from a symmetrical triangle pattern and is consolidating above
Weekly outlook for May 1 May
 Weekly outlook for May 1 May. 5 2017 TREND DIRECTION S&P 500 Oil Gold Short Term Intermediate-Term Long Term strong weak strong strong neutral Strong weak weak weak Summary The S&P500 index is expected
INTERMEDIATE EDUCATION GUIDE
 INTERMEDIATE EDUCATION GUIDE CONTENTS Key Chart Patterns That Every Trader Needs To Know Continution Patterns Reversal Patterns Statistical Indicators Support And Resistance Fibonacci Retracement Moving
Martin Pring s. Weekly InfoMovie Report. April 8, 2014
 Martin Pring s Weekly InfoMovie Report April 8, 2014 Issue 1093 Weekly InfoMovie Report 1 Key level remains $184 on the SPY. US Equity Market - Last time I pointed out that the $184 level on the S&P ETF
Weekly outlook for April 30 May
 Weekly outlook for April 30 May 4 2018 Summary The S&P500 index is having trouble deciding if it will rally or decline. This indecision makes trading less profitable. Wait for a break-out direction to
Subject: Daily report explanatory notes, page 2 Version: 0.9 Date: Dec 29, 2013 Author: Ken Long
 Subject: Daily report explanatory notes, page 2 Version: 0.9 Date: Dec 29, 2013 Author: Ken Long Description Example from Dec 23, 2013 1. Market Classification: o Shows market condition in one of 9 conditions,
Global Bear Market at our Doorstep?
 6 June 2012 Global Bear Market at our Doorstep? by William Cai, Vice President, Personal Financial Services This article was featured in the Jun 2012 issue of The Business Times. Below is the original
Weekly outlook for Nov. 27 Dec
 Weekly outlook for Nov. 27 Dec. 1 2017 Summary For the ES we expect a minor pullback in the early part of the week, followed by a rally into the weekly close. There are four option expirations this week
Quantitative & Strategy
 Cam Hui, CFA August 7, 2018 cam@pennock@ideahub.com A MAJOR MARKET TOP AHEAD Highlights We are now seeing the early technical signs of a developing cyclical top for the bull market that began in 2009.
OSCILLATORS. TradeSmart Education Center
 OSCILLATORS TradeSmart Education Center TABLE OF CONTENTS Oscillators Bollinger Bands... Commodity Channel Index.. Fast Stochastic... KST (Short term, Intermediate term, Long term) MACD... Momentum Relative
Schwab Investing Insights Trading Edition Text Close Window Size: November 15, 2007
 Schwab Investing Insights Trading Edition Text Close Window Size: from TheStreet.com November 15, 2007 ON TECHNIQUES Two Indicators Are Better Than One The Relative Strength Index works well but it s better
Trade Ideas A.I. Strategy Descriptions Revised : 10/04/2017
 Trade Ideas A.I. Strategy Descriptions Revised : 10/04/2017 The 5 Day Bounce The trigger for this alert has to cross above resistance while also making a 60 minute high on stocks that are trying to bounce
Technical Analysis Workshop Series. Session Three
 Technical Analysis Workshop Series Session Three DISCLOSURES & DISCLAIMERS This research material has been prepared by NUS Invest. NUS Invest specifically prohibits the redistribution of this material
Market Maps. Bob Dickey, Technical Strategist, Portfolio Advisory Group. April RBC Capital Markets, LLC / Portfolio Advisory Group
 Market Maps Bob Dickey, Technical Strategist, Portfolio Advisory Group RBC Capital Markets, LLC / Portfolio Advisory Group All values in U.S. dollars and priced as of March 29, 2018, unless otherwise noted
Additional Reading Material on Technical Analysis
 Additional Reading Material on Relevant for 1. Module 7 (Financial Statement Analysis and Asset Valuation) 2. Module 18 (Securities and Derivatives Trading [Products and Analysis]) Copyright 2017 Securities
CHARTS. Bar Line Candlestick Charts are the basis of technical analysis They are a graphic display of price action. Notes:
 TECHNICAL ANALYSIS CHARTS Bar Line Candlestick Charts are the basis of technical analysis They are a graphic display of price action Candlestick charts have become the industry standard for technical traders.
Introduction. Technicians (also known as quantitative analysts or chartists) usually look at price, volume and psychological indicators over time.
 usually look at price, volume and psychological indicators over time.") Technical Analysis Introduction Technical Analysis is the study of market action, primarily through the use of charts, for the purpose of forecasting future price trends. Technicians (also known as quantitative
Technical Analysis Introduction Technical Analysis is the study of market action, primarily through the use of charts, for the purpose of forecasting future price trends. Technicians (also known as quantitative
Weekly outlook for June 19 June
 Weekly outlook for June 19 June 23 2017 TREND DIRECTION Short Term Trend Intermediate-Term Trend Long Term Trend S&P 500 Oil Gold sideway Up Up down and oversold down down down and oversold soon Sideway
In the Charts Forex. Today s key points. CROSS ASSET TECHNICAL ANALYSIS 01 October 2013
 CROSS ASSET TECHNICAL ANALYSIS 01 October 2013 In the Charts Forex Today s key points EUR/USD has given a break above the weekly channel resistance of 1.3454/20 which also happens to be 76.4% retracement
The very first calculations for average gain and average loss are simple 14- period averages.
 Introduction Developed by J. Welles Wilder, the Relative Strength Index (RSI) is a momentum oscillator that measures the speed and change of price movements. RSI oscillates between zero and 100. Traditionally,
Weekly outlook for Mar
 Weekly outlook for Mar. 26 30 2018 Summary The S&P500 index is expected to test February's low first and bounce from it before the Good Friday holiday. The end of the month and the end of the quarter may
Martin Pring s. Weekly InfoMovie Report. December 27, Happy New Year to Our Wonderful Subcriber Family! May 2013 be Prosperous and Productive!
 Martin Pring s Weekly InfoMovie Report December 27, 2012 Issue 1028 Happy New Year to Our Wonderful Subcriber Family! May 2013 be Prosperous and Productive! The Pring Family ~ 2012 Weekly InfoMovie Report
Technical Analysis Workshop Series. Session Eight Commodity Channel Index
 Technical Analysis Workshop Series Session Eight DISCLOSURES & DISCLAIMERS This research material has been prepared by NUS Invest. NUS Invest specifically prohibits the redistribution of this material
RELATIVE ROTATION GRAPHS USER GUIDE
 RELATIVE ROTATION GRAPHS USER GUIDE RELATIVE ROTATION GRAPHS USER GUIDE A Relative Rotation Graph (RRG TM ) provides a visual presentation of how a group of securities are performing relative to a selected
1 P a g e. Executive Summary
 Executive Summary Price finally reached our expect SPX2112-2120 and the negative divergences that started to creep in on the daily TIs finally also took their toll over the past 2 days. The weekly charts
Introduction. Technical analysis is the attempt to forecast stock prices on the basis of market-derived data.
 Technical Analysis Introduction Technical analysis is the attempt to forecast stock prices on the basis of market-derived data. Technicians (also known as quantitative analysts or chartists) usually look
Gold, and Mining Stocks Trader Monday, March 04, :57 AM Published by The Wall Street Examiner
 Monday, March 04, 2019 8:57 AM Published by The Wall Street Examiner Cycle Phase/PTT Projection 9-12 Month Top-Down/11-24 Weeks 1330 Done 13/17 Week Down/20? 6-7 Week Down/
Chart Pattern Secrets
 Chart Pattern Secrets June 14, 2018 Next Alert: 06/19/18 The Trading System: Application of Trading Chart Patterns with Futures and Option Contracts Copyright 1997 All rights reserved. 1 2 3 4 5 5/15/18:
The six technical indicators for timing entry and exit in a short term trading program
 The six technical indicators for timing entry and exit in a short term trading program Definition Technical analysis includes the study of: Technical analysis the study of a stock s price and trends; volume;
Please read the following risk disclosure before you proceed.
 Please read the following risk disclosure before you proceed. The risk of loss in trading commodity futures contracts can be substantial. You should therefore carefully consider whether such trading is
Compiled by Timon Rossolimos
 Compiled by Timon Rossolimos - 2 - The Seven Best Forex Indicators -All yours! Dear new Forex trader, Everything we do in life, we do for a reason. Why have you taken time out of your day to read this
Ichimoku Kinko Hyo. Ichimoku 101 and history...2. Basic Ichimoku Lines...3. Kumo the cloud...5. Trading signals generated by Ichimoku...
 Ichimoku Kinko Hyo Japan has been undoubtedly the most innovative trading leader for many years now. They have started off by inventing candlestick charts and they are still being used worldwide, during
Weekly Market Summary
 Weekly Market Summary April 24, 2016 by Urban Carmel of The Fat Pitch Summary: SPY made a new all-time high this week. The short and long term trend is higher. Despite a gain of 16% over the past 10 weeks,
Market Maps. Bob Dickey, Technical Strategist, Portfolio Advisory Group. March RBC Capital Markets, LLC / Portfolio Advisory Group
 Market Maps Bob Dickey, Technical Strategist, Portfolio Advisory Group RBC Capital Markets, LLC / Portfolio Advisory Group All values in U.S. dollars and priced as of February 28, 2019, unless otherwise
Technical Analysis Workshop Series. Session 11 Semester 2 Week 5 Oscillators Part 2
 Technical Analysis Workshop Series Session 11 Semester 2 Week 5 Oscillators Part 2 DISCLOSURES & DISCLAIMERS This research material has been prepared by NUS Invest. NUS Invest specifically prohibits the
Weekly outlook for June 12 June
 Weekly outlook for June 12 June 16 2017 TREND DIRECTION S&P 500 Oil Gold Short Term Intermediate-Term Long Term weak buy buy Weak neutral Strong sell buy buy buy Summary The S&P500 index is expected to
Market Maps. Bob Dickey, Technical Strategist, Portfolio Advisory Group. January RBC Capital Markets, LLC / Portfolio Advisory Group
 Market Maps Bob Dickey, Technical Strategist, Portfolio Advisory Group RBC Capital Markets, LLC / Portfolio Advisory Group All values in U.S. dollars and priced as of December 31, 2018, unless otherwise
Global Technical Strategy Breakout Confirmed
 Strategy February 22, 2015 Katie Stockton, CMT (212) 527-3568 kstockton@btig.com Technical Strategy Global Technical Strategy Breakout Confirmed The S&P 500 Index (SPX, 2110.30) confirmed its breakout
Stock selection for traders Charles Schwab & Co., Inc. ( Schwab ). All rights reserved. Member SIPC. [ Y)
. All rights reserved. Member SIPC. [ Y)") Stock selection for traders 2018 Charles Schwab & Co., Inc. ( Schwab ). All rights reserved. Member SIPC. [0617-718Y) We believe in the power of investing to transform peoples lives. We look at the world
Stock selection for traders 2018 Charles Schwab & Co., Inc. ( Schwab ). All rights reserved. Member SIPC. [0617-718Y) We believe in the power of investing to transform peoples lives. We look at the world
BTIG Technical Strategy Year-End Chart Book December 2014
 BTIG Technical Strategy Year-End Chart Book December 2014 This year has been one for the technicians - trends and momentum have dominated conversations about the markets, and for good reason. The following
NIFTY. Momentum oscillator, RSI (14) is in bullish crossover which suggests index momentum to remain on the positive side.
 is in bullish crossover which suggests index momentum to remain on the positive side.") Date: 16 th July 2018 NIFTY The Nifty, which reversed its downwards trend in the previous week has continued rallying during the last week. Moreover, the Index has given a trend-line breakout on the weekly
Date: 16 th July 2018 NIFTY The Nifty, which reversed its downwards trend in the previous week has continued rallying during the last week. Moreover, the Index has given a trend-line breakout on the weekly
IMV Commodity: Agro Technical Update
 IMV Commodity: Agro Technical Update From Research Desk In July future: Soya bean Rmseed Castor seed Guar seed Jeera Dhaniya Turmeric (Follow-up update) Cotton Seed Oil Cotton IMV Commodity Research Desk
Weekly outlook for April 23, 2018
 Weekly outlook for April 23, 2018 Summary The S&P 500 index is expected to go down further if price stays below the 2700 level. A weekly doji candle formed on the intermediate-term chart, and the short-term
Profitable Patterns. Do you believe there are profits to be made in stocks? With the right tools, anyone can make consistent money in stocks.
 Profitable Patterns Do you believe there are profits to be made in stocks? With the right tools, anyone can make consistent money in stocks. Level of RESISTANCE Price per share has NOT been able to "Break
The sideways churn in the major U.S. Stock indexes since late March continues. We have a lot of new members that have
 May 17, 2016 Dear Members, The sideways churn in the major U.S. Stock indexes since late March continues. We have a lot of new members that have recently joined us in the past couple of months. For you
Martin Pring s. Weekly InfoMovie Report. December 19, 2012
 Martin Pring s Weekly InfoMovie Report December 19, 2012 Issue 1027 Merry Christmas to All! And may 2013 bring joyous Blessings and your Family know Joy and Peace! The Pring Family ~ 2012 Weekly InfoMovie
EU50 Future (VG1) Futures: Short Term View / Levels. Andy Dodd - MSTA adodd 25th April 2018.
 Futures: Short Term View / Levels. Andy Dodd - MSTA adodd 25th April 2018.") Andy Dodd - MSTA +44 20 7031 4651 Twitter @louiscaptech adodd 2018 EU50 Future (VG1) Daily Chart Position Supports Resistances Position Size Short 3391 3354 3336 3319 3282 3418 3441 3481 3502 100% 3286
Andy Dodd - MSTA +44 20 7031 4651 Twitter @louiscaptech adodd 2018 EU50 Future (VG1) Daily Chart Position Supports Resistances Position Size Short 3391 3354 3336 3319 3282 3418 3441 3481 3502 100% 3286
10-Year Treasury Notes ($UST Price)
") 1 Weekly Inter-market Technical Report 10-Year Treasury Notes ($UST Price) Monthly Continuing from last week's report, bonds (notes) appear to be on a strong buy signal on the monthly chart, as price is
1 Weekly Inter-market Technical Report 10-Year Treasury Notes ($UST Price) Monthly Continuing from last week's report, bonds (notes) appear to be on a strong buy signal on the monthly chart, as price is
Balance Of Market Power. Who s The Boss? Stocks & Commodities V. 19:8 (18-32): Balance Of Power by Igor Livshin INDICATORS
: Balance Of Power by Igor Livshin INDICATORS") INDICATORS Who s The Boss? MIKE YAPPS Balance Of Market Power Who s in charge, bulls or bears? It doesn t take higher-order math to get a good reading. T by Igor Livshin he balance of market power (BMP)
INDICATORS Who s The Boss? MIKE YAPPS Balance Of Market Power Who s in charge, bulls or bears? It doesn t take higher-order math to get a good reading. T by Igor Livshin he balance of market power (BMP)
On Our Technical Watch
 By Lawrence Yeo / lawrenceyeo@kenanga.com.my; Steven Chan / steven.chan@kenanga.com.my; Muhammad Afif Bin Zulkaplly / muhammad.afif@kenanga.com.my Figure 1: Daily Charting FBMKLCI Basic Data 52-week High
Weekly outlook for June 5 June
 Weekly outlook for June 5 June 9 2017 TREND DIRECTION S&P 500 Oil Gold Short Term Intermediate-Term Long Term Weak buy buy neutral neutral sell buy buy buy Summary The S&P500 index is expected to hold
Introductory Fundamental and Technical Analysis
 Introductory Fundamental and Technical Analysis Tan Junda junda@uobkayhian.com (65) 6590 6616 Jeffrey Tan jeffreytan@uobkayhian.com (65) 6590 6629 Our Focus Today What kind of investor are you? Technical
Relative Performances of Key Markets, Indexes and S&P 500 Sectors
 22 May 2014 Relative Performances of Key Markets, Indexes and S&P 500 Sectors Peter Lee Chief Technical Strategist CIO Wealth Management Research This report has been prepared by UBS Financial Services
Intermediate-a? SPX2533
 Summary Like last week, also this week s Friday-price action left a lot to be desired for the Bulls and ambiguity regarding which exact Elliot Wave price pattern remains: major-4 still underway? Major-4
Morning Trading Comments
 Monday, June 18, 2018 1 Morning Trading Comments SUMMARY OF TRADING VIEWS Technical breakdowns seen on a lot of commodities at the end of last week, combined with further weakness in emerging markets,
TECHNICAL INDICATORS
 TECHNICAL INDICATORS WHY USE INDICATORS? Technical analysis is concerned only with price Technical analysis is grounded in the use and analysis of graphs/charts Based on several key assumptions: Price
12 th Oct2018. Gold Silver Copper Zinc Lead Aluminium Nickel Crude Oil Natural Gas. Bullion. Base Metal. Energy. Chana. Agro.
 12 th Oct2018 Bullion Base Metal Energy Agro Gold Silver Copper Zinc Lead Aluminium Nickel Crude Oil Natural Gas Chana Soybean Gold prices climbed almost 1.6% up on Thursday, regaining the psychologically
THE RELATIVE STRENGTH CONCEPT APPLIED TO SECTOR INDICES
 THE RELATIVE STRENGTH CONCEPT APPLIED TO SECTOR INDICES An Illustration with the DJ Stoxx 600 Index Yann CORDIER, CFTe, MFTA AXA Investment Managers London, 10/03/2015 OUTLINE The concept and power of
DAILY DAY TRADING PLAN
 DAILY DAY TRADING PLAN Gatherplace will be used to place all of your trades. You will be using the 5 minute chart for the trade setup and the 1 minute chart for your entry, stop and trailing stop.you will
Expert Trend Locator. The Need for XTL. The Theory Behind XTL
 Chapter 20 C H A P T E R 20 The Need for XTL esignal does an excellent job in identifying Elliott Wave counts. When combined with studies such as the Profit Taking Index, Wave Four Channels, Trend Channels
GUIDE TO STOCK trading tools
 P age 1 GUIDE TO STOCK trading tools VI. TECHNICAL INDICATORS AND OSCILLATORS I. Introduction to Indicators and Oscillators Technical indicators, to start, are data points derived from a specific formula.
Lara s Weekly. S&P500 + GOLD + USOIL Elliott Wave & Technical Analysis. Lara Iriarte CMT 23 February, 2018
 Lara s Weekly S&P500 + GOLD + USOIL Elliott Wave & Technical Analysis Lara Iriarte CMT 23 February, 2018 S&P 500 Contents S&P 500 GOLD USOIL About Disclaimer 3 18 36 48 48 S&P 500 S&P 500 Upwards movement
TRADE SIGNALS POWERED BY AUTOCHARTIST
 TRADE SIGNALS POWERED BY AUTOCHARTIST Trade Signals is a powerful tool available in BiGlobal Trade for identifying trading opportunities based on chart patterns using Autochartist technology. As an introduction
Morning Trading Comments
 Wednesday, June 13, 2018 1 Morning Trading Comments SUMMARY OF TRADING VIEWS The S&P 500 index is now close to the 2800 area, a potential important resistance zone. It will be interesting to see how this
Copyright Alpha Markets Ltd.
 Page 1 Trading Strategies - Module 3 Welcome to this unit on Trading Strategies. In this module we will be explaining the core components of a trading strategy and how you can begin to incorporate analysis
Naked Trading - Double Top Chart Pattern Strategy
 Naked Trading - Double Top Chart Pattern Strategy If you really want to learn a profitable way to trade then look no further, the Double Top chart pattern strategy uses simple and sound trading principles
Table of Contents. Risk Disclosure. Things we will be going over. 2 Most Common Chart Layouts Anatomy of a candlestick.
 Table of Contents Risk Disclosure Things we will be going over 2 Most Common Chart Layouts Anatomy of a candlestick Candlestick chart Anatomy of a BAR PLOT Indicators Trend-Lines Volume MACD RSI The Stochastic
The Technical Edge Page 1. The Technical Edge. Part 1. Indicator types: price, volume, and moving averages and momentum
 The Technical Edge Page 1 The Technical Edge INDICATORS Technical analysis relies on the study of a range of indicators. These come in many specific types, based on calculations or price patterns. For
Williams Percent Range
 Williams Percent Range (Williams %R or %R) By Marcille Grapa www.surefiretradingchallenge.com RISK DISCLOSURE STATEMENT / DISCLAIMER AGREEMENT Trading any financial market involves risk. This report and
Increasing Risk of Medium-Term Correction Within Ongoing Bull Market
 Increasing Risk of Medium-Term Correction Within Ongoing Bull Market This is a Markets Now Seminar March 27 th 2017 By David Fuller fullertreacymoney.com The Caledonian Club 9 Halkin Street London SW1Y
Walter Murphy s Insights Short Term Review
 Walter Murphy s Insights Short Term Review Strategic Analysis for the Serious Investor Walter G. Murphy, Jr., CFA WMinsights.com February 17, 2014 Plain English US Equities: It is entirely possible that
Test Your Chapter 1 Knowledge
 Self-Test Answers Test Your Chapter 1 Knowledge 1. Which is the preferred chart type in LOCKIT? The preferred chart type in LOCKIT is the candle chart because candle patterns are part of the decision-making
S&P 500 Update: Week ending May 11th 2018
 S&P 500 Update: Week ending May 11th 2018 1. Market Recap: The S&P 500 closed higher by 2.2% for week and broke out of some key resistance areas and a short term downtrend. There are 4 topics now setting
Bulkowski s Trading Quiz
 Bulkowski s Trading Quiz What chart patterns can you find? A hint appears below and answers on the next page. Hint. Look for the following chart patterns: double and triple bottom, triangle, double top,
Our aim at S.T.I. is to make Technical Analysis as simple and uncomplicated as possible.
 By MPFX Our aim at S.T.I. is to make Technical Analysis as simple and uncomplicated as possible. We will try to explain the concepts of each indicator in Plain English and include examples where possible.
15 th March Gold Silver Copper Zinc Lead Aluminium Nickel Crude Oil Natural Gas Guar seed Castor seed. Bullion. Base Metal. Energy.
 15 th March 2018 Bullion Base Metal Energy Agro Gold Silver Copper Zinc Lead Aluminium Nickel Crude Oil Natural Gas Guar seed Castor seed On the daily chart MCX Gold price has given rising wedge breakdown
FinQuiz Notes
 Reading 13 Technical analysis is a security analysis technique that involves forecasting the future direction of prices by studying past market data, primarily price and volume. Technical Analysis 2. TECHNICAL
In the Charts Forex. Today s key points. CROSS ASSET TECHNICAL ANALYSIS 15 October 2013
 CROSS ASSET TECHNICAL ANALYSIS 15 October 2013 FOREX In the Charts Forex Coordinator Global Technicals Stephanie Aymes (44) 207 762 5898 stephanie.aymes@sgcib.com Kusal Kansara (91) 80 2802 4551 kusal.kansara@sgcib.com
1. Introduction 2. Chart Basics 3. Trend Lines 4. Indicators 5. Putting It All Together
 Technical Analysis: A Beginners Guide 1. Introduction 2. Chart Basics 3. Trend Lines 4. Indicators 5. Putting It All Together Disclaimer: Neither these presentations, nor anything on Twitter, Cryptoscores.org,
Larbi Moumni, CFA November 30, 2018
 Jan-13 Jul-13 Jan-14 Jul-14 Jan-15 Jul-15 Jan-16 Jul-16 Jan-17 Jul-17 Jan-18 Jul-18 Weekly Trends Larbi Moumni, CFA November 30, 2018 Chart Pack This week we look at a series of charts to help us take
Monthly Dairy Technical Commentary Thursday September 5, 2013
 Monthly Dairy Technical Commentary Thursday September 5, 2013 CME Class III Milk Futures The weekly price trend for Class III Milk points down from its August 2011 high, and the latest breakdown below
Technical Analysis. Weekly Comment. Global. SPX Overbought Relief Rally in Europe!! Equities Sales Trading Commentary
 h Technical Analysis Equities Sales Trading Commentary Weekly Comment Global Michael Riesner Marc Müller 03/07/2012 michael.riesner@ubs.com marc.mueller@ubs.com +41-44-239 1676 +41-44-239 1789 SPX Overbought
US Financial Market Update for March Prepared for the Market Technicians Association
 US Financial Market Update for March 2016 Prepared for the Market Technicians Association March 16 th, 2016 About Asbury Research Research, Methodology & Clientele Our Research: Asbury Research, established
Tuesday, June 30th, Gann Presentation for Bloomberg. Catapult Research by Jim Smith
 Tuesday, June 30th, 2009 Gann Presentation for Bloomberg Catapult Research by Jim Smith Dow Jones Industrials--Monthly Gann Cycles into High I showed this same chart on 8/13/07 at Bloomberg MTA seminar
Monthly Investment Compass Charting The Course Of The Markets
 Monthly Investment Compass Charting The Course Of The Markets April 22 nd, 2016 Monthly Investment Compass Executive Summary: April 22 nd 2016 U.S. Stock Market: The most important takeaway from the latest
Canadian Technical Comment
 October 15 2017 TSX: Shift to defense underway as near-term pullback looms Summary Recommendation: For long-term investment managers with cash on hand, we would wait for a short-term (2-4 week) corrective
Technical Analysis Workshop Series. Session Ten Semester 2 Week 4 Oscillators Part 1
 Technical Analysis Workshop Series Session Ten Semester 2 Week 4 Oscillators Part 1 DISCLOSURES & DISCLAIMERS This research material has been prepared by NUS Invest. NUS Invest specifically prohibits the
1 P a g e. Executive Summary
 Executive Summary After having reached SPX2484, 1p short of my ideal SPX24585-2505 target zone, on July 27 and selling off intra-day the S&P500 hasn t made a higher high and has remained flat the past