Chart Pattern Secrets
|
|
|
- Marilynn Haynes
- 5 years ago
- Views:
Transcription

1 Chart Pattern Secrets June 14, 2018 Next Alert: 06/19/18 The Trading System: Application of Trading Chart Patterns with Futures and Option Contracts Copyright 1997 All rights reserved. 1

2 2
3 3
4 4
5 5

6 5/15/18: The breakout is to the upside and prices could be headed for a retest of the January highs. No new trades for now. 5/10/18: The S&P mini and the DOW are showing a triangle chart pattern. The breakout from the triangle is imminent but the price direction can go either way. One way to take advantage of the price breakout is to purchase a CALL and PUT option with a strike price as close to the current futures price as possible but no more than three strike prices away from the current futures price. Then once the breakout occurs close the losing side once it loses 25 to 30% of the original purchase price and hold the other. Or, simply wait for the breakout to occur and buy in that direction. 6
7 7
8 8
9 9

10 06/14/18: December Natural Gas is forming a pennant formation. The breakout could be either way but the seasonal price trend points down into September. 10

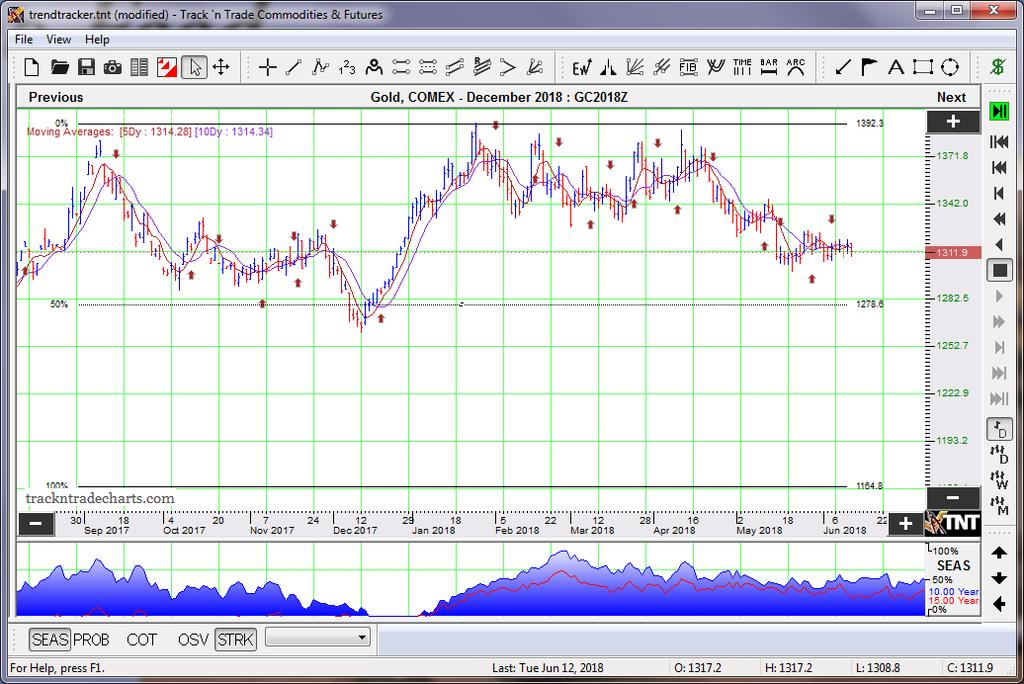
11 6/05/18: Crude prices may be topping out. Keep watching for top chart patterns. The normal seasonal price pattern for the energy markets is to top out in the May/June time frame so keep watching for top chart formations to develop. 11

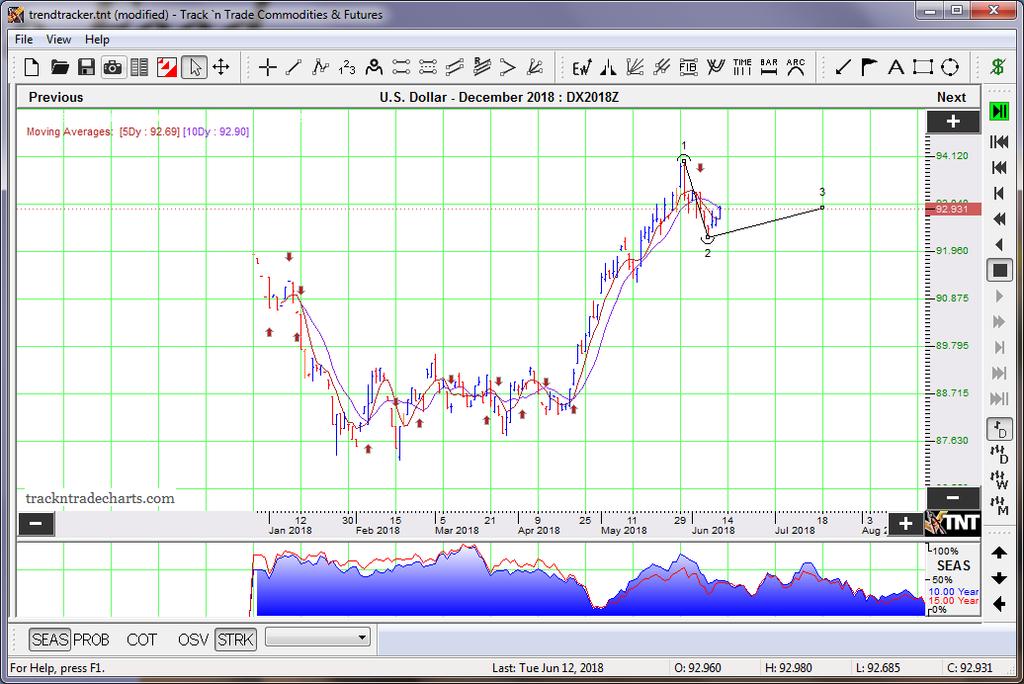
12 6/05/18: There is a small top in place and a trade below the number 2 point signals a sell or purchase PUT options with a strike price as close to the money as your account allows. Conservative traders can wait for a closing price below the uptrend line for a safer entry point. Implied volatility chart: 12

13 6/05/18: Gasoline may also be topping out. There is a small top in place and a trade below the number 2 point signals a sell or purchase PUT options with a strike price as close to the money as your account allows. Conservative traders can wait for a closing price below the uptrend line for a safer entry point. Implied volatility chart: 13

14 Seasonally, the grain markets top out during the May/June time frame and trade to seasonal lows in September, so keep watching for top chart patterns. 14

15 05/30/18: The head and shoulders chart pattern was cancelled with new highs beyond the head. Keep watching for new formations. 15

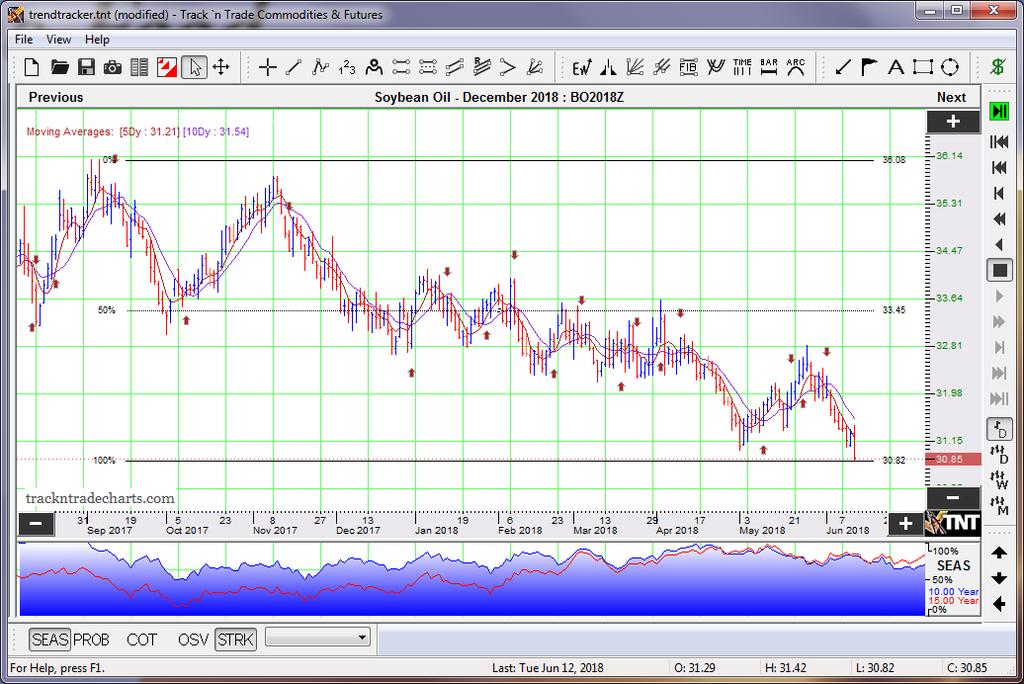
16 06/14/18: November soybean prices have fallen below the uptrend line and the 50% retracement level signaling a new downtrend. A retest of those two levels is likely and if the retest fails to rise above those levels I would purchase near-the-money PUT options expecting prices to fall to summer harvest lows near

17 6/05/18: Soybean meal has an H&S top in place. A trade below the neckline signals a sell or purchase PUT options with a strike price as close to the money as your account allows. The first downside profit objective is below the 50% level near Implied volatility chart: 17
18 18
19 19
20 20

21 6/05/18: October sugar continues moving up but there is resistance just above current prices near /30/18: The bottom formation has completed and you would be long. First resistance is around CALL option implied volatility is low for single option purchases. 5/01/18: Sugar prices continue the downtrend but from June through September the market builds a weather premium as frost fears enter the growing regions. We will keep watching for a bottom chart formations. 21

22 : New highs cancel the developing head and shoulders top. Keep watching for topping chart patterns. 22

23 5/24/18: The bottom is complete. All is needed to trigger a long position is for prices to continue higher beyond the #2 point. 23

24 24
25 Disclaimer and Disclosure of Risk Statement Trading commodity Futures and options on futures involves significant risk. You must consult licensed professionals or your own advisors before trading to determine if it is suitable for you. Nothing contained herein is a solicitation to trade or a recommendation of a specific trade. You must consult your broker or advisor before making any trade to insure current prices, margin requirements and other factors determinant to suitability. By reading this publication you agree to make no trade relying in whole or in part on the comments of the writers. You agree before doing any trade contained herein to consult your charts and advisors to verify all information and make your own decision. All traders should understand that trading in the futures and or options markets is not for everyone. All traders should understand that there is substantial risk of loss when trading futures and or options. All traders should carefully evaluate whether trading in the futures and or options markets is appropriate for them, as such trading is speculative in nature. When trading futures, traders may sustain losses which may exceed their margin deposits. Option purchases may result in the entire loss of premiums paid for such options. Past performance is no guarantee of future success. CFTC RULE HYPOTHETICAL OR SIMULATED PERFORMANCE RESULTS HAVE CERTAIN LIMITATIONS. UNLIKE AN ACTUAL PERFORMANCE RECORD, SIMULATED RESULTS DO NOT REPRESENT ACTUAL TRADING. ALSO, SINCE THE TRADES HAVE NOT BEEN EXECUTED, THE RESULTS MAY HAVE UNDER-OR-OVER COMPENSATED FOR THE IMPACT, IF ANY, OF CERTAIN MARKET FACTORS, SUCH AS LACK OF LIQUIDITY. SIMULATED TRADING PROGRAMS IN GENERAL ARE ALSO SUBJECT TO THE FACT THAT THEY ARE DESIGNED WITH THE BENEFIT OF HINDSIGHT. NO REPRESENTATION IS BEING MADE THAT ANY ACCOUNT WILL OR IS LIKELY TO ACHIEVE PROFIT OR LOSSES SIMILAR TO THOSE SHOWN. 25
Chart Pattern Secrets
 Chart Pattern Secrets October 04, 2018 Next Alert: 10/09/18 The Trading System: Application of Trading Chart Patterns with Futures and Option Contracts Copyright 1997 All rights reserved. 1 2 3 9/20/18:
Chart Pattern Secrets
 Chart Pattern Secrets April 02, 2019 Next Alert: 04/04/19 The Trading System: Application of Trading Chart Patterns with Futures and Option Contracts Copyright 1997 All rights reserved. 1 The dollar made
Chart Pattern Secrets
 Chart Pattern Secrets April 09, 2019 Next Alert: 04/11/19 The Trading System: Application of Trading Chart Patterns with Futures and Option Contracts Copyright 1997 All rights reserved. 1 The dollar made
Naked Trading and Price Action
 presented by Thomas Wood MicroQuant SM Divergence Trading Workshop Day One Naked Trading and Price Action Risk Disclaimer Trading or investing carries a high level of risk, and is not suitable for all
- My 4 Favorite Trades - Essential Trades of a Professional Trader
 presented by Thomas Wood MicroQuant SM Divergence Trading Workshop Day One - My 4 Favorite Trades - Essential Trades of a Professional Trader Risk Disclaimer Trading or investing carries a high level of
Technical Analysis Workshop Series. Session Three
 Technical Analysis Workshop Series Session Three DISCLOSURES & DISCLAIMERS This research material has been prepared by NUS Invest. NUS Invest specifically prohibits the redistribution of this material
Inter-market Technical Analysis for April 22, Summary Chart TheoTrade LLC. All rights reserved.
 1 Weekly Inter-market Technical Report Summary Chart 1 2018 TheoTrade LLC. All rights reserved. 2 Intraday Intermarket Volatility is returning to the markets, particularly with the collapse/sell-swing
Active Trend Trading Rules Review
 Active Trend Trading Rules Review Active Trend Trader: Dennis W. Wilborn A Trend Should Be Assumed to Continue in Effect Until Such Time as Its Reversal Has Been Definitely Signaled Edwards & Magee Disclaimer
presented by Thomas Wood MicroQuant SM Divergence Trading Workshop Day One Bond Trading Success
 presented by Thomas Wood MicroQuant SM Divergence Trading Workshop Day One Bond Trading Success Risk Disclaimer Trading or investing carries a high level of risk, and is not suitable for all persons. Before
The Synthetic Futures Position. Goal
 The Synthetic Futures Position Goal To try to profit from a trending market using an option strategy that allows entry at a reduced cost while offering the same potential for unlimited profit (and loss)
Stay on the Right Side & Finishing the Year Strong! From the Active Trend Trader
 Stay on the Right Side & Finishing the Year Strong! From the Active Trend Trader Disclaimer U.S. GOVERNMENT REQUIRED DISCLAIMER COMMODITY FUTURES TRADING COMMISSION FUTURES AND OPTIONS TRADING HAS LARGE
4 MANUAL TEKNIK PRO NASDAQ SNIPERX PRICE ACTION FUNDAMENTAL
 4 MANUAL TEKNIK PRO NASDAQ SNIPERX PRICE ACTION FUNDAMENTAL DISCLAIMERS This method described in this module are for educational purpose only. Past result are not indicate of futures result. Trading have
Strategy when the first trigger is Missed
 Second Chance Entries Active Trend Trading: Dennis W. Wilborn Strategy when the first trigger is Missed Observe things how they are; See things how they can be! Disclaimer U.S. Government Required Disclaimer
Trading Patterns For Stocks And Commodities
 Trading Patterns For Stocks And Commodities It doesn t matter if you are a long-term investor, short swing trader or day trader, you are always looking for an advantageous spot to enter your position.
The Launchpad Strategy
 presented by Thomas Wood MicroQuant SM Divergence Trading Workshop Day One The Launchpad Strategy Risk Disclaimer Trading or investing carries a high level of risk, and is not suitable for all persons.
C y c l e C a n d l e s T r a d i n g W o r k s h o p
 C y c l e C a n d l e s Trading Workshop Risk Disclaimer Trading or investing carries a high level of risk, and is not suitable for all persons. Before deciding to trade or invest you should carefully
Weekly outlook for April 30 May
 Weekly outlook for April 30 May 4 2018 Summary The S&P500 index is having trouble deciding if it will rally or decline. This indecision makes trading less profitable. Wait for a break-out direction to
Weekly outlook for June 19 June
 Weekly outlook for June 19 June 23 2017 TREND DIRECTION Short Term Trend Intermediate-Term Trend Long Term Trend S&P 500 Oil Gold sideway Up Up down and oversold down down down and oversold soon Sideway
Inter-market Technical Analysis for April 29, Summary Chart TheoTrade LLC. All rights reserved.
 1 Weekly Inter-market Technical Report Summary Chart 1 2018 TheoTrade LLC. All rights reserved. 2 Intraday Intermarket Volatility and even trend is back in our markets! The main movement recently came
Compilation Of Tips And Uses Of FGS
 Compilation Of Tips And Uses Of FGS Copyright 2012 ForexGeometry.com NOTE: ANY INFORMATION CONTAINED IN THIS DOCUMENT IS FOR EDUCATIONAL PURPOSES ONLY AND IS NOT FINANCIAL ADVICE. U.S. GOVERNMENT REQUIRED
INTERMEDIATE EDUCATION GUIDE
 INTERMEDIATE EDUCATION GUIDE CONTENTS Key Chart Patterns That Every Trader Needs To Know Continution Patterns Reversal Patterns Statistical Indicators Support And Resistance Fibonacci Retracement Moving
The Master Trader Counter-Trend Trade Set-Ups
 The Master Trader Counter-Trend Trade Set-Ups Trading Concepts, Inc. The Master Trader Counter-Trend Trade Set-Ups By Todd Mitchell Copyright 2014 by Trading Concepts, Inc. All Rights Reserved This training
Go No Go Indicators: Part 2
 Go No Go Indicators: Part 2 March 22, 2017 Dennis W. Wilborn Active Trend Trading Disclaimer U.S. Government Required Disclaimer Commodity Futures Trading Commission Futures and Options trading has large
Trading Essentials Framework Market Foundation & Building Blocks
 Trading Essentials Framework Market Foundation & Building Blocks Trading Concepts, Inc. Trading Essentials Framework Market Foundation & Building Blocks By Todd Mitchell Copyright 2014 by Trading Concepts,
Weekly outlook for April 23, 2018
 Weekly outlook for April 23, 2018 Summary The S&P 500 index is expected to go down further if price stays below the 2700 level. A weekly doji candle formed on the intermediate-term chart, and the short-term
Understanding Oscillators & Indicators March 4, Clarify, Simplify & Multiply
 Understanding Oscillators & Indicators March 4, 2015 Clarify, Simplify & Multiply Disclaimer U.S. Government Required Disclaimer Commodity Futures Trading Commission Futures and Options trading has large
ATTS Weekly Options Weekly Income June 2, 2018
 ATTS Weekly Options Weekly Income June 2, 2018 PRESENTED BY: DENNIS W. WILBORN Disclaimer U.S. GOVERNMENT REQUIRED DISCLAIMER COMMODITY FUTURES TRADING COMMISSION FUTURES AND OPTIONS TRADING HAS LARGE
USER MANUAL. Version 1.7
 USER MANUAL Version 1.7 1 LEGAL NOTICE NO INVESTMENT ADVICE. The information contained in this user manual has no regard to the specific investment objective, financial situation or particular needs of
2010. Trading Concepts, Inc. All Rights Reserved. For More Information Please Visit
 E-Mini Volume Breakout System By Todd Mitchell For additional information, please go to http://www.eminisuccessformula.com Copyright 2010 by Trading Concepts, Inc. All Rights Reserved. U.S. Government
Chart Patterns. (High Probability Chart Patterns) By Russ Horn
 By Russ Horn") (High Probability ) By Russ Horn 1 RISK DISCLOSURE STATEMENT / DISCLAIMER AGREEMENT Trading any financial market involves risk. This report and all and any of its contents are neither a solicitation nor
(High Probability ) By Russ Horn 1 RISK DISCLOSURE STATEMENT / DISCLAIMER AGREEMENT Trading any financial market involves risk. This report and all and any of its contents are neither a solicitation nor
Today s Tech Tip: Special Report
 Today s Tech Tip: Special Report Dennis W. Wilborn, Sr. ActiveTrendTrading.com dww@activetrendtrading.com Breakouts or Bounces both Good, but which is Best? Disclaimer U.S. Government Required Disclaimer
FOREX UNKNOWN SECRET. by Karl Dittmann DISCLAIMER
 FOREX UNKNOWN SECRET by Karl Dittmann DISCLAIMER Please be aware of the loss, risk, personal or otherwise consequences of the use and application of this book s content. The author and the publisher are
5 Pillars of Active Trend Trading Timing is More Important than Price. ~~ W.D. Gann
 5 Pillars of Active Trend Trading Timing is More Important than Price. ~~ W.D. Gann Dennis W. Wilborn Disclaimer U.S. Government Required Disclaimer Commodity Futures Trading Commission Futures and Options
RUSSIA CURBING IMPORTS FEARS. WET WEATHER NEXT COUPLE OF WEEKS HELP FUEL RALLY.
 Page 1 of 6 RICK ALEXANDER, MARKET STRATEGIST ZANER GROUP RUSSIA CURBING IMPORTS FEARS. WET WEATHER NEXT COUPLE OF WEEKS HELP FUEL RALLY. Higher closes for Minneapolis, Kansas City and Chicago wheat along
The Avalanche (Reverse for a Phoenix )
") The Avalanche (Reverse for a Phoenix ) The 6 Building Blocks of Price Development (Ideal Scenario): Momentum: Above average pace on the reversal from highs, followed by slower than average upside as support
The Avalanche (Reverse for a Phoenix ) The 6 Building Blocks of Price Development (Ideal Scenario): Momentum: Above average pace on the reversal from highs, followed by slower than average upside as support
Candlesticks Discoveries Probability of Success Aug 6, 2016
 Candlesticks Discoveries Probability of Success Aug 6, 2016 The Art & Science of Active Trend Trading Disclaimer U.S. Government Required Disclaimer Commodity Futures Trading Commission Futures and Options
CMS Prime DAILY MARKET REPORT
 CMS Prime DAILY MARKET REPORT May 14, 2018 EURUSD BULLISH BIAS long position at 1.1960 with SL : 1.1925 and with targets at 1.1990 and 1.2020 short position at 1.1925 with SL : 1.1970 and with targets
Copyright , DayTradetoWin.com
 Copyright 2007-2013, DayTradetoWin.com All rights reserved. No part of this work may be reported or transmitted, in any form or by any means, electronic, mechanical, photocopying, recording, or otherwise,
Real Life Fibonacci Trading & Dynamic Targeting with MQ Trend
 presented by Thomas Wood MicroQuant SM Divergence Trading Workshop Day One Real Life Fibonacci Trading & Dynamic Targeting with MQ Trend Risk Disclaimer Trading or investing carries a high level of risk,
Commodity Chart Book
 Commodity Chart Book Cents / Bushel 920-0 Corn CORN - CBOT MONTHLY SELECTED FUTURES Chart Chart High: 843.75 on 08/10/2012 Chart Low 142.00 on 02/17/1987 Chart Low: 142.00 on 02/17/1987 Cents / Bushel
91.88 The Longest Day
 THE ROSEN MARKET TIMING LETTER PRECIOUS METALS - FOREX - STOCK INDICES - COMMODITIES https://www.deltasociety.com/content/ron-rosen-precious-metals-timing-letter RONALD L. ROSEN July 28, 2017 REPORT --------------------------
McDowell s Special Market Report Using the TradersCoach.com Software Tools
 McDowell s Special Market Report Using the TradersCoach.com Software Tools JULY 2018: Welcome to this month s Market Report! This written report is going to forecast the Dow Jones Industrial Average (hereafter
CONNECING THE DOTS Candlesticks & Convergence of Clues. The Art & Science of Active Trend Trading
 CONNECING THE DOTS Candlesticks & Convergence of Clues The Art & Science of Active Trend Trading Disclaimer U.S. Government Required Disclaimer Commodity Futures Trading Commission Futures and Options
Copyright Alpha Markets Ltd.
 Page 1 Trading Strategies - Module 3 Welcome to this unit on Trading Strategies. In this module we will be explaining the core components of a trading strategy and how you can begin to incorporate analysis
THE FOREX TRADING GUIDE TECHNICAL ANALYSIS CHART PATTERNS
 1 Copyright 2016 TradingSpine All rights reserved by TradingSpine. No parts of this work may be reproduced in any form or by any means - graphic, electronic, or mechanical, including photocopying, recording,
1
 1 2 3 4 5 6 7 8 9 Who Should Consider Using Covered Calls? An investor who is neutral to moderately bullish on some of the equities in his portfolio. An investor who is willing to limit his upside potential
S-Enrooter 1.0. Automatic trading strategy USER GUIDE. Version 1.0
 S-Enrooter 1.0 Automatic trading strategy USER GUIDE Version 1.0 Revised 22.08.2016 Trading method Breakout signals Trading Style Swing trading system Description of automatic strategy S-Enrooter 1.0 -
The Profit Pulling Power of Trading Chart Patterns. Trade What You See, Not What You Think or Hear. Virtual Trading University
 CHART LESSON SECRETS The Profit Pulling Power of Trading Chart Patterns Trade What You See, Not What You Think or Hear Virtual Trading University Written By: Archie Johnson Virtual Trading University http://www.vtuniversity.com
Divergence and Momentum Trading
 presented by Thomas Wood MicroQuant SM Divergence Trading Workshop Day One Divergence and Momentum Trading Risk Disclaimer Trading or investing carries a high level of risk, and is not suitable for all
 This material is protected under the Digital Millennium Copyright Act of 1998 and various international treaties. This material may not be replicated and redistributed. You may make one or more copies
Your FREE Strategy...
 Your FREE Strategy... 1 Disclaimer This report is designed to provide helpful advice regarding the subject matter(s) covered. The author and distributors do not engage in the practice of providing legal
The Art & Science of Active Trend Trading
 Candlesticks Looking for U-Turns The Art & Science of Active Trend Trading Copywrite ATTS 2007-2015 1 Disclaimer U.S. Government Required Disclaimer Commodity Futures Trading Commission Futures and Options
Spread report. October 9th 2017
 Spread report October 9th 2017 All information in this document is intended for educational purposes only. We don t provide financial or investment advise. We re not a registered advisor, broker, dealer
Trading Lessons from the Intraday Frame (study)
") 1 Daily "Idealized Trades" Report Trading Lessons from the Intraday Frame (study) 1 2018 TheoTrade LLC. All rights reserved. 2 Trading Lessons from the Intraday Frame (1-mi) 2 2018 TheoTrade LLC. All rights
1 Daily "Idealized Trades" Report Trading Lessons from the Intraday Frame (study) 1 2018 TheoTrade LLC. All rights reserved. 2 Trading Lessons from the Intraday Frame (1-mi) 2 2018 TheoTrade LLC. All rights
Using Oscillators & Indicators Properly May 7, Clarify, Simplify & Multiply
 Using Oscillators & Indicators Properly May 7, 2016 Clarify, Simplify & Multiply Disclaimer U.S. Government Required Disclaimer Commodity Futures Trading Commission Futures and Options trading has large
Profitable Patterns. Do you believe there are profits to be made in stocks? With the right tools, anyone can make consistent money in stocks.
 Profitable Patterns Do you believe there are profits to be made in stocks? With the right tools, anyone can make consistent money in stocks. Level of RESISTANCE Price per share has NOT been able to "Break
IMPROVED WHEAT CONDITIONS IN USA. RAIN IN FORECAST. POSSIBLE DOWN 10% YIELD IN BRAZILIAN CORN CROP.
 Page 1 of 6 RICK ALEXANDER, MARKET STRATEGIST ZANER GROUP IMPROVED WHEAT CONDITIONS IN USA. RAIN IN FORECAST. POSSIBLE DOWN 10% YIELD IN BRAZILIAN CORN CROP. Higher closes for corn, Minneapolis and Chicago
"Sharing real experiences from decades of profitable trading. Focusing on the important factors that lead to trading success.
 "Sharing real experiences from decades of profitable trading. Focusing on the important factors that lead to trading success. Administrative notes: Factor will be relocating to our winter headquarters
DAILY TECHNICAL REPORT MA S-TERM. 16 December, 2011 L-TERM MULTI-WEEK OBJECTIVES/COMMENTS ENTRY LEVEL STRATEGY/ POSITION
 MA S-TERM MULTI-DAY Please note: None of the strategies below represent trading advice or trading recommendations of any kind. Please refer to our full disclaimer. L-TERM MULTI-WEEK STRATEGY/ POSITION
Weekly outlook for Jan. 28 Feb
 Weekly outlook for Jan. 28 Feb. 1 2019 Summary The S&P500 index is expected to continue its rally, but there is a lot of economic data due this week and a n abundance of external news events. All of this
Pin Point Entries or Intraday Charts for Non-Intraday Traders
 Pin Point Entries or Intraday Charts for Non-Intraday Traders Simplicity is the secret of seeing things Clearly. ~~ Oswald Chambers WWW.ACTIVETRENDTRADING.COM DENNIS W. WILBORN, SR. DWW@ACTIVETRENDTRADING.COM
The Art & Science of Active Trend Trading
 CONNECTING THE DOTS Candlesticks & Convergence of Clues The Art & Science of Active Trend Trading Copyright ATTS 2007-2015 1 Dennis W. Wilborn, P.E. Founder, President Active Trend Trading dww@activetrendtrading.com
Market Update April 20, 2015
 SeattleTA provides investment managers with technical analysis of the equity, fixed-income, commodity, and The forecast for a high on April 15 was spot-on (there s no kill switch on awesome!). The monthly
Learning Objectives CMT Level I
 Learning Objectives CMT Level I - 2018 An Introduction to Technical Analysis Section I: Chart Development and Analysis Chapter 1 The Basic Principle of Technical Analysis - The Trend Define what is meant
Intraday Charts Hidden Clues!
 Intraday Charts Hidden Clues! Where to Buy & Sell Mid-Week Market Sanity Check Disclaimer U.S. Government Required Disclaimer Commodity Futures Trading Commission Futures and Options trading has large
Trading Success Principles Floor Trader Pivots
 Trading Success Principles Floor Trader Pivots Trading Concepts, Inc. Trading Success Principles Floor Trader Pivots By Todd Mitchell Copyright 2014 by Trading Concepts, Inc. All Rights Reserved This training
How You Can Find Better Trade Entries With Two Award-Winning Trading Setups That Are Working Right Now Presented by:
 How You Can Find Better Trade Entries With Two Award-Winning Trading Setups That Are Working Right Now Presented by: Rob Hoffman BecomeABetterTrader.com Copyright 2017 Become A Better Trader, Inc. All
Monthly Dairy Technical Commentary Thursday September 5, 2013
 Monthly Dairy Technical Commentary Thursday September 5, 2013 CME Class III Milk Futures The weekly price trend for Class III Milk points down from its August 2011 high, and the latest breakdown below
PRETTY MUCH NO CHANGES. GRAIN STOCKS AND SMALL GRAIN REPORTS ON FRIDAY
 Page 1 of 6 RICK ALEXANDER, MARKET STRATEGIST ZANER GROUP PRETTY MUCH NO CHANGES. GRAIN STOCKS AND SMALL GRAIN REPORTS ON FRIDAY Higher closes for Minneapolis, Kansas City and Chicago wheat along with
Commodities, Financials and FOREX Special Situations for the week of January 19, Table of Contents
 Commodities, Financials and FOREX Special Situations for the week of January 19, 2015 Table of Contents COMMODITIES: GC Gold FINANCIALS: FXI IShares FTSE China Index Fund, AAPL (Apple Inc), EWA (Ishares
NEWSLETTER SWING TRADING. 28 Feb Intelligent Analysis to point your decisions in the right direction
 NEWSLETTER 28 Feb 2018 Intelligent Analysis to point your decisions in the right direction SWING TRADING Newsletter contains index, stocks and sector recommendations along with market outlook. It also
WEEKLY REVIEW WEEK 26
 WEEK 26 DATE 20/06/2011 INVESTMENT STRATEGIST AMIT CHHEDA MILAN BAVISHI MARKET OVERVIEW: Nifty last week traded between 5355 5520 and closed around 5366 after witnessing selling pressure during the last
Level I Learning Objectives by chapter (2017)
") Level I Learning Objectives by chapter (2017) 1. The Basic Principle of Technical Analysis: The Trend Define what is meant by a trend in Technical Analysis Explain why determining the trend is important
Level I Learning Objectives by chapter (2017) 1. The Basic Principle of Technical Analysis: The Trend Define what is meant by a trend in Technical Analysis Explain why determining the trend is important
NEWSLETTER SWING TRADING. 26 Feb Intelligent Analysis to point your decisions in the right direction
 NEWSLETTER 26 Feb 2018 Intelligent Analysis to point your decisions in the right direction SWING TRADING Newsletter contains index, stocks and sector recommendations along with market outlook. It also
Part 1. ForEx Easy Mode
 Part 1 DISCLAIMER Any income claims are typical of top performers not all users and your results will vary. Past performance of any system is not indicative of future results. Trading foreign exchange
Weekly outlook for May 28/9 - June 1, 2018
 Weekly outlook for May 28/9 - June 1, 2018 Summary The S&P500 index is expected to be dull due to the short week, barring major news. A minor pullback maybe seen, but it should be a very short-lived. It
WELCOME TO THE WONDERFUL WORLD OF NUMBEROLOGY. Thursday June 29, 2017
 WELCOME TO THE WONDERFUL WORLD OF NUMBEROLOGY Thursday June 29, 2017 BELOW YOU WILL FIND TABLES CONTAINING BOTH SHORT TERM AND LONGER TERM BUY/SELL VALUES BASED ON LAWG 647 MODEL BE MINDFUL I AM NOT RECOMMENDING
THE CHAPMAN REPORT FOR DECEMBER 22, 2008
 THE CHAPMAN REPORT FOR DECEMBER 22, 2008 Charts and technical commentary by David Chapman Union Securities Ltd, 33 Yonge Street, Suite 901, Toronto, Ontario, M5E 1G4 fax (416) 604-0533, (416) 604-0557,
Weekly outlook for Mar
 Weekly outlook for Mar. 26 30 2018 Summary The S&P500 index is expected to test February's low first and bounce from it before the Good Friday holiday. The end of the month and the end of the quarter may
In the Charts Forex. Today s key points. CROSS ASSET TECHNICAL ANALYSIS 01 October 2013
 CROSS ASSET TECHNICAL ANALYSIS 01 October 2013 In the Charts Forex Today s key points EUR/USD has given a break above the weekly channel resistance of 1.3454/20 which also happens to be 76.4% retracement
The Strategies Working Best in Today s E-Mini Market
 The Strategies Working Best in Today s E-Mini Market Todd Mitchell Craig Hill Legal Disclaimer No claim is made by Trading Concepts, Inc. that the trading strategies shown here will result in profits and
Chart Pattern Secrets
 Chart Pattern Secrets Volume #1 Reading Bar Charts, Drawing Trend Lines, Identifying Chart Support and Resistance, Fibonacci Chart Retracements, Volume & Open Interest and Chart Patterns Version 1.02 Copyright
RAIN AND A COOLER WEATHER FORCAST KEEPS PRESSURE ON THE GRAIN COMPLEX
 Page 1 of 6 RICK ALEXANDER, MARKET STRATEGIST ZANER GROUP RAIN AND A COOLER WEATHER FORCAST KEEPS PRESSURE ON THE GRAIN COMPLEX Higher close for rough rice while lower closes for Minneapolis, Kansas City
E-Mini Volume Breakout System
 E-Mini Volume Breakout System By Todd Mitchell & Craig Hill For additional bonus information and videos, please go to http://www.eminisuccessformula.com/blog Copyright 2010 by Trading Concepts, Inc. All
Trading Lessons from the Intraday Frame (study)
") 1 Daily "Idealized Trades" Report Trading Lessons from the Intraday Frame (study) 1 2018 TheoTrade LLC. All rights reserved. 2 Trading Lessons from the Intraday Frame (1-mi) 2 2018 TheoTrade LLC. All rights
1 Daily "Idealized Trades" Report Trading Lessons from the Intraday Frame (study) 1 2018 TheoTrade LLC. All rights reserved. 2 Trading Lessons from the Intraday Frame (1-mi) 2 2018 TheoTrade LLC. All rights
Big Picture report April 2 nd 2012
 Big Picture report April 2 nd 2012 Francesco Maggioni francesco.maggioni@gmail.com +39 393 70 40 234 Quantitative approach for asymmetric results Time to downshift exposure in equities? Who is lying? SP500
Adam Pukalo Commodity Futures Advisor TECHNICALS & TRENDS. January Year in Review
 TECHNICALS & TRENDS January 2016 2015 Year in Review What did grain and livestock prices do this year and where do we see them headed? CONTRACT UP OR DOWN? JANUARY 1, 2015 OPEN CURRENTLY front futures
Trend Channels: How to Identify Easy Profit-Making Opportunities Using Simple Chart Analysis
 Trend Channels: How to Identify Easy Profit-Making Opportunities Using Simple Chart Analysis Trend channels produce a very powerful trading technique. They are very visible, which makes them easy to utilize
Chapter 1.4 Trends 0
 Chapter 1.4 Trends 0 TECHNICAL ANALYSIS: TRENDS, SUPPORT AND RESISTANCE Charts, charts, charts. When most people think about trading Forex, they think about watching price movements flash by them on the
Forex Price Direction Analysis.
 Forex Price Direction Analysis. September 24 2010 1 Sign Up Now to Upshots forex trade signals disclaimer The information provided in this report is for educational purposes only. It is not a recommendation
Weekly outlook for May 21 - May 25, 2018
 Weekly outlook for May 21 - May 25, 2018 Summary The S&P500 index is expected to hold up for a higher level. The market broke to the upside from a symmetrical triangle pattern and is consolidating above
Quantitative/Technical Analysis January 8, 2015
 Quantitative/Technical Analysis January 8, 2015 2015 Macro/Technical Outlook SYMBOL NAME PAGE USD U.S. Dollar Index 2 XEU Euro Index 3 CDW Canadian Dollar Index 4 XAD Australian Dollar 6 XJY Japanese Yen
Naked Trading - Double Top Chart Pattern Strategy
 Naked Trading - Double Top Chart Pattern Strategy If you really want to learn a profitable way to trade then look no further, the Double Top chart pattern strategy uses simple and sound trading principles
Market Commentary. Weekly Technical Roundup. Oct 8, 2018
 Market Commentary Sector Wise Performance Indices Last Traded % Change NIFTY IT 15591.65-2.99 NIFTY BANK 24443.45-10.01 NIFTY REALTY 208.8-21.55 NIFTY INFRA 2845.4-12.30 INDIA VIX 19.7325 42.55 NIFTY ENERGY
presented by Thomas Wood MicroQuant SM Divergence Trading Workshop Day One Black Gold
 presented by Thomas Wood MicroQuant SM Divergence Trading Workshop Day One Black Gold Risk Disclaimer Trading or investing carries a high level of risk, and is not suitable for all persons. Before deciding
The Art & Science of Active Trend Trading
 CONNECTING THE DOTS Candlesticks & Convergence of Clues The Art & Science of Active Trend Trading Copywrite ATTS 2007-2015 1 Dennis W. Wilborn, P.E. Founder, President Active Trend Trading dww@activetrendtrading.com
TECHFX TRADERS WEEKLY FX TECHNICAL REPORT
 04 February 2018 TECHFX TRADERS WEEKLY FX TECHNICAL REPORT Contents FX: AUDUSD Medium Term Page 3 AUDUSD Short Term Page 4 AUDUSD VS Interest Rates Page 5 AUDNZD Medium Term Page 6 AUDNZD Short Term Page
ALWAYS BEWARE OF DRY WEATHER FORECASTS
 Page 1 of 6 RICK ALEXANDER, MARKET STRATEGIST ZANER GROUP ALWAYS BEWARE OF DRY WEATHER FORECASTS Higher to sharply higher closes for oats, rough rice,corn, soybeans, soymeal and soybean oil along with
Strategies for Growing an Account DENNIS W. WILBORN, SR.
 Strategies for Growing an Account WWW.ACTIVETRENDTRADING.COM DENNIS W. WILBORN, SR. DWW@ACTIVETRENDTRADING.COM Clarify, Simplify & Multiply This has been the Motto of Active Trend Trading from the beginning!