Profitable Patterns. Do you believe there are profits to be made in stocks? With the right tools, anyone can make consistent money in stocks.
|
|
|
- Nora Dawson
- 5 years ago
- Views:
Transcription

1 Profitable Patterns Do you believe there are profits to be made in stocks? With the right tools, anyone can make consistent money in stocks.
2 Level of RESISTANCE Price per share has NOT been able to "Break through" a certain point
3 Level of SUPPORT Price per share has NOT been able to "Go Below" a certain point

4
5 Watch For: You ll recognize the symmetrical triangle pattern when you see a stock s price vacillating up and down and converging towards a single point. Its back and forth oscillations will become smaller and smaller until the stock reaches a critical price, breaks out of the pattern, and moves drastically up or down. > Sideways movement, a period of rest, before the breakout. > Price of the asset traveling between two converging trendlines. > Breakout ¾ of the way to the apex. $16.25 $15.75 $12.75 $12.25 Set Your Target Price: As with all patterns, knowing when to get out is as important as knowing when to get in. Your target price is the safest time to sell, even if it looks like the trend may be continuing. For symmetrical triangles, sell your stock at a target price of: > Breakout price plus the pattern s height for an upward breakout. Buy your stock at a target price of: > Breakout price minus the pattern s height for a downward breakout. Show your work for the following questions... At what price should an investor sell shares if they notice an upward breakout? At what price should an investor buy shares if they notice a downward breakout?
6


7
8 When you notice a stock has a series of increasing troughs and the price is unable to break through a price barrier, chances are you are witnessing the birth of an ascending triangle pattern. Watch For: An ascending or descending pattern forming over three to four weeks. Set Your Target Price: For ascending and descending triangles, sell your stock at a target price of: > Breakout price plus the pattern s height for an upward breakout. > Breakout price minus the pattern s height for a downward breakout. Ascending Triangle $14.50 $8.50 Show your work for the following question... At what price should an investor sell shares if they notice an Ascending Triangle? $21.25 Descending Triangle $14.25 Show your work for the following question... At what price should an investor purchase shares if they notice a Descending Triangle?


9


10


11
12
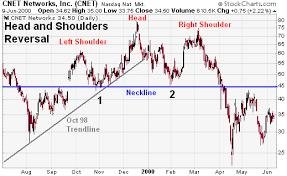
13 The head and shoulders pattern is a prevailing pattern among short sellers, investors who profit from downtrends. After three peaks, the stock plummets, offering a textbook, high-return opportunity to traders who catch the trend early. $26.25 $19.25 How to Profit from the Head and Shoulders Pattern > Short sell as soon as the price moves below the neckline after the descent from the right shoulder. Set Your Target Price: For the head and shoulders pattern, buy shares at a target price of: > Support price minus the pattern s height (distance from the top of the head to the neckline). Show your work for the following questions... At what price should an investor short sell if they notice a Head and Shoulders Pattern? At what price should an investor buy shares if they notice a Head and Shoulders Pattern?

14

15
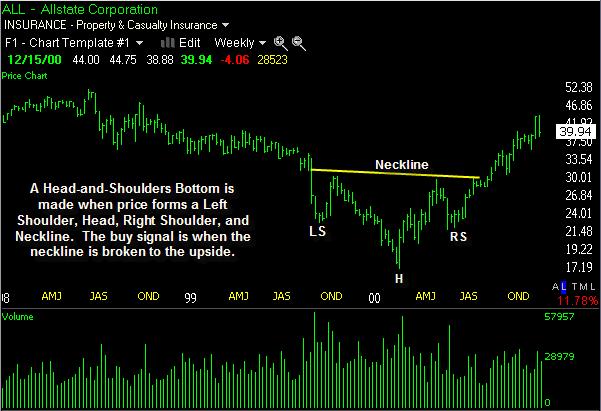
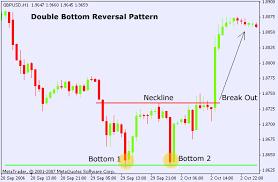
16 When you see a W or M pattern forming, you may have just discovered a money-making double bottom or double top pattern. These patterns are common reversal patterns used to suggest the current stock trend may be likely to shift. Double Bottom Purchase When: > The price exceeds the middle-peak price. Watch For: > A price increase of 10% to 20% from the first trough to the middle peak. > Two equal lows, not to differ by more than 3% or 4%. Set Your Target Price: For the double bottom pattern, sell your stock at a target price of: > Breakout price plus the pattern s height (distance from the peak to the bottom of the lowest trough). $12.50 $6.50 $6.75 Show your work for the following questions... At what price should an investor purchase shares if they notice a Double Bottom Pattern? At what price should an investor sell shares if they notice a Double Bottom Pattern?

17

18
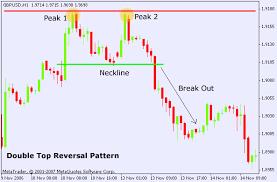
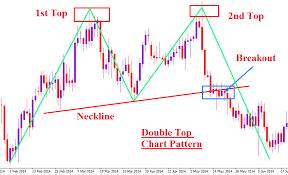
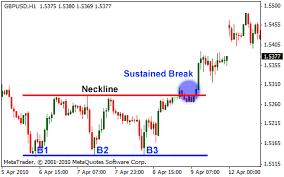
19 Double Top Short Sell When: > The price drops below the middle-trough price. Watch For: > A price decrease of 10% to 20% from the first peak to the middle trough. > Two equal highs, not to differ by more than 3% or 4%. Set Your Target Price: For the double top pattern, buy shares at a target price of: > Breakdown price minus the pattern s height (distance from the trough to the top of the highest peak). $21.75 $22.00 $18.00 Show your work for the following questions... At what price should an investor short sell if they notice a Double Top Pattern? At what price should an investor buy shares if they notice a Double Top Pattern?
20

21
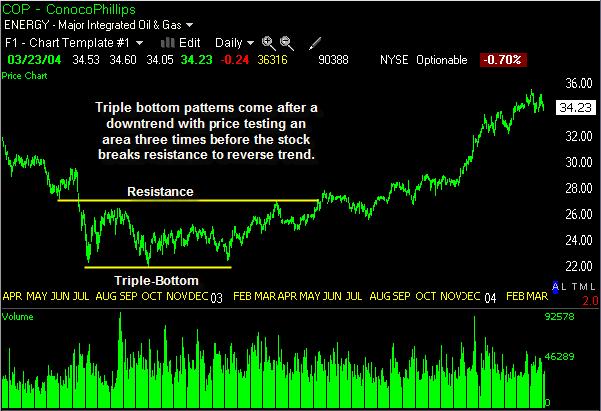
22 Triple Bottom Purchase When: The price exceeds the resistance established by the prior peaks. Watch For: A series of three identical troughs at the end of a prolonged downtrend. Set Your Target Price: For triple bottom patterns, sell your stock at a target price of: Breakout price plus the pattern s height (distance from the resistance to the bottom of the lowest trough). $53.25 $45.50 $45.25 $45.55 Show your work for the following questions... At what price should an investor purchase shares if they notice a Triple Bottom Pattern? At what price should an investor sell shares if they notice a Triple Bottom Pattern?
23

24
25
26 Triple Top Sell When: > The price falls below the support that formed from the prior troughs. Watch For: > A series of three peaks at relatively the same level. Set Your Target Price: For triple top patterns, buy shares at a target price of: > Support price minus the pattern s height (distance from the support to the top of the highest peak). $28.50 $28.75 $28.55 $24.75 Show your work for the following questions... At what price should an investor sell shares if they notice a Triple Top Pattern? At what price should an investor buy shares if they notice a Triple Top Pattern?

27

28
29 Nasdaq.com Interactive Chart
Technical Analysis Workshop Series. Session Three
 Technical Analysis Workshop Series Session Three DISCLOSURES & DISCLAIMERS This research material has been prepared by NUS Invest. NUS Invest specifically prohibits the redistribution of this material
Chapter 3.3. Price Patterns
 1 Chapter 3.3 Price Patterns 0 TECHNICAL ANALYSIS: PRICE PATTERNS Traders vote with their chequebooks. If they believe a stock or CFD is going to move higher then they will buy the stock or CFD. If they
INTERMEDIATE EDUCATION GUIDE
 INTERMEDIATE EDUCATION GUIDE CONTENTS Key Chart Patterns That Every Trader Needs To Know Continution Patterns Reversal Patterns Statistical Indicators Support And Resistance Fibonacci Retracement Moving
Introduction. Technicians (also known as quantitative analysts or chartists) usually look at price, volume and psychological indicators over time.
 usually look at price, volume and psychological indicators over time.") Technical Analysis Introduction Technical Analysis is the study of market action, primarily through the use of charts, for the purpose of forecasting future price trends. Technicians (also known as quantitative
Technical Analysis Introduction Technical Analysis is the study of market action, primarily through the use of charts, for the purpose of forecasting future price trends. Technicians (also known as quantitative
CHARTS. Bar Line Candlestick Charts are the basis of technical analysis They are a graphic display of price action. Notes:
 TECHNICAL ANALYSIS CHARTS Bar Line Candlestick Charts are the basis of technical analysis They are a graphic display of price action Candlestick charts have become the industry standard for technical traders.
The six technical indicators for timing entry and exit in a short term trading program
 The six technical indicators for timing entry and exit in a short term trading program Definition Technical analysis includes the study of: Technical analysis the study of a stock s price and trends; volume;
FinQuiz Notes
 Reading 13 Technical analysis is a security analysis technique that involves forecasting the future direction of prices by studying past market data, primarily price and volume. Technical Analysis 2. TECHNICAL
Introduction. Technical analysis is the attempt to forecast stock prices on the basis of market-derived data.
 Technical Analysis Introduction Technical analysis is the attempt to forecast stock prices on the basis of market-derived data. Technicians (also known as quantitative analysts or chartists) usually look
THE FOREX TRADING GUIDE TECHNICAL ANALYSIS CHART PATTERNS
 1 Copyright 2016 TradingSpine All rights reserved by TradingSpine. No parts of this work may be reproduced in any form or by any means - graphic, electronic, or mechanical, including photocopying, recording,
TECHNICAL ANALYSIS. SURI DUDDELLA Trading Broadening Top/Bottom Patterns
 SURI DUDDELLA Trading Broadening Top/Bottom Patterns 8 Broadening top and bottom patterns are considered reversal patterns and usually appear at the major tops/ bottoms. Suri Duddella discusses how to
Additional Reading Material on Technical Analysis
 Additional Reading Material on Relevant for 1. Module 7 (Financial Statement Analysis and Asset Valuation) 2. Module 18 (Securities and Derivatives Trading [Products and Analysis]) Copyright 2017 Securities
Lecture 9, Part 2. Graphical Patterns Analysis. Continuation Patterns
 Lecture 9, Part 2 Graphical Patterns Analysis Continuation Patterns The graphical configurations we would look into are called continuation patterns. Such models usually mean that the period of price stagnation
FOREX. analysing made easy. UNDERSTANDING TECHNICAL ANALYSIS An educational tool by Blackwell Global
 FOREX analysing made easy UNDERSTANDING TECHNICAL ANALYSIS An educational tool by Blackwell Global Risk Warning: Forex and CFDs are leveraged products and you may lose your initial deposit as well as substantial
Agenda. Who is Recognia. Event Driven Technical Analysis. Types of Technical Events. Finding and Validating Ideas using Recognia Q & A
 Disclaimer The information presented here is for educational and informational purposes only. The inclusion of any specific securities detailed is for illustrative purposes only. No information contained
Naked Trading - Double Top Chart Pattern Strategy
 Naked Trading - Double Top Chart Pattern Strategy If you really want to learn a profitable way to trade then look no further, the Double Top chart pattern strategy uses simple and sound trading principles
Pattern Trader - December Trade Analysis, Trade Set-ups and Profit (Loss)
") Pattern Trader - December - 2016 - Trade Analysis, Trade Set-ups and Profit (Loss) Pair: XAUUSD (spot Gold) Entry Order: BUY stop @ 1177.00 Stop loss: 1167.00 Take profit: 1192.00 Trade Risk Profile: 0.50%
Pattern Trader - December - 2016 - Trade Analysis, Trade Set-ups and Profit (Loss) Pair: XAUUSD (spot Gold) Entry Order: BUY stop @ 1177.00 Stop loss: 1167.00 Take profit: 1192.00 Trade Risk Profile: 0.50%
NIFTY. Momentum oscillator, RSI (14) is in bullish crossover which suggests index momentum to remain on the positive side.
 is in bullish crossover which suggests index momentum to remain on the positive side.") Date: 16 th July 2018 NIFTY The Nifty, which reversed its downwards trend in the previous week has continued rallying during the last week. Moreover, the Index has given a trend-line breakout on the weekly
Date: 16 th July 2018 NIFTY The Nifty, which reversed its downwards trend in the previous week has continued rallying during the last week. Moreover, the Index has given a trend-line breakout on the weekly
4.2. Various Classifications of Technical Indicators Major Technical Indicators Conclusion Bibliography...
 Contents Contents... 1 Introduction... 3 Chapter I... 4 What is Technical Analysis?... 4 1.1 Definition of Technical Analysis... 4 1.2. Philosophy of Technical Analysis... 4 1.3. Technical Analysis vs.
Chart Patterns. (High Probability Chart Patterns) By Russ Horn
 By Russ Horn") (High Probability ) By Russ Horn 1 RISK DISCLOSURE STATEMENT / DISCLAIMER AGREEMENT Trading any financial market involves risk. This report and all and any of its contents are neither a solicitation nor
(High Probability ) By Russ Horn 1 RISK DISCLOSURE STATEMENT / DISCLAIMER AGREEMENT Trading any financial market involves risk. This report and all and any of its contents are neither a solicitation nor
Flags and Pennants 1. Sharp Move: 2. Flagpole: 3. Flag: 4. Pennant: 5. Duration: 6. Break: 7. Volume: 8. Targets:
 Flags and Pennants Flags and Pennants are short-term continuation patterns that mark a small consolidation before the previous move resumes. These patterns are usually preceded by a sharp advance or decline
Technical Chart Book. ANS Research Desk. Daily Report For, th Dec Weekly Price Outlooks of Various Indices
 ANS Research Desk ARHAM Financial Centre Harihar Chowk, RAJKOT (Guj) Speak to: 0281 6699401 Drop a line to: research@anspl.net Daily Report For, 26-30 th Dec 2011 Technical Chart Book Weekly Price Outlooks
Monthly Dairy Technical Commentary Thursday September 5, 2013
 Monthly Dairy Technical Commentary Thursday September 5, 2013 CME Class III Milk Futures The weekly price trend for Class III Milk points down from its August 2011 high, and the latest breakdown below
Weekly outlook for June 19 June
 Weekly outlook for June 19 June 23 2017 TREND DIRECTION Short Term Trend Intermediate-Term Trend Long Term Trend S&P 500 Oil Gold sideway Up Up down and oversold down down down and oversold soon Sideway
Technical Stock Screener Page 1
 Technical Stock Screener www.dojispace.com Page 1 Disclaimer The information provided is not to be considered as a recommendation to buy certain stocks and is provided solely as an information resource
Trends. Define the term Trend Explain why Trend is important Identify Primary, Secondary, and Short-Term trends
 Trends Define the term Trend Explain why Trend is important Identify Primary, Secondary, and Short-Term trends 1 What is a Trend? Uptrend Prices rise and fall in Trends Trend is defined as: Up (Rising)
FOREX TRADING STRATEGIES.
 FOREX TRADING STRATEGIES www.ifcmarkets.com www.ifcmarkets.com 2 One of the most powerful means of winning a trade is the portfolio of Forex trading strategies applied by traders in different situations.
Chart Pattern Secrets
 Chart Pattern Secrets June 14, 2018 Next Alert: 06/19/18 The Trading System: Application of Trading Chart Patterns with Futures and Option Contracts Copyright 1997 All rights reserved. 1 2 3 4 5 5/15/18:
Trend Channels: How to Identify Easy Profit-Making Opportunities Using Simple Chart Analysis
 Trend Channels: How to Identify Easy Profit-Making Opportunities Using Simple Chart Analysis Trend channels produce a very powerful trading technique. They are very visible, which makes them easy to utilize
How to Use Charting to Analyze Commodity Markets
 How to Use Charting to Analyze Commodity Markets Introduction Agriculture commodity markets can be analyzed either technically or fundamentally. Fundamental analysis studies supply and demand relationships
Weekly technical analysis chart pack 9 nd June 2014 James Brodie Chartered Market Technician
 Weekly technical analysis chart pack 9 nd June 2014 James Brodie Chartered Market Technician EURUSD Within 24 hours of Mario Draghi announcing the ECB s new round of rate cuts and easing policies the EURUSD
ASX Schools Sharemarket Game
 The ASX charts When you spend time discovering a company s story and looking at company numbers you are using what is called fundamental analysis. Many people who invest in the sharemarket use fundamental
deep cup formed over many months, it makes sense that the measure rule
 34 Rounding Bottoms R E S U L T S SNAPSHOT Appearance A long, rounded upward turn in prices if waited for upside breakout Long-term (over 6 months) consolidation 38% Average rise Percentage meeting predicted
Test Your Chapter 1 Knowledge
 Self-Test Answers Test Your Chapter 1 Knowledge 1. Which is the preferred chart type in LOCKIT? The preferred chart type in LOCKIT is the candle chart because candle patterns are part of the decision-making
The Technical Edge Page 1. The Technical Edge. Part 1. Indicator types: price, volume, and moving averages and momentum
 The Technical Edge Page 1 The Technical Edge INDICATORS Technical analysis relies on the study of a range of indicators. These come in many specific types, based on calculations or price patterns. For
Compiled by Timon Rossolimos
 Compiled by Timon Rossolimos - 2 - The Seven Best Forex Indicators -All yours! Dear new Forex trader, Everything we do in life, we do for a reason. Why have you taken time out of your day to read this
REUTERS TECHNICAL ANALYSIS Q1 OUTLOOK WANG TAO
 An employee works in a ferronickel smelter owned by state miner Aneka Tambang Tbk at Pomala district in Indonesia's southeast Sulawesi province March 30, 2011. The country accounts for roughly 7 percent
SUPPLEMENTARY LESSON 1 DISCOVER HOW THE WORLD REALLY WORKS ASX Schools Sharemarket Game THE ASX CHARTS
 SUPPLEMENTARY LESSON 1 THE ASX CHARTS DISCOVER HOW THE WORLD REALLY WORKS 2015 ASX Schools Sharemarket Game The ASX charts When you spend time discovering a company s story and looking at company numbers
PART 3 - CHART PATTERNS & TECHNICAL INDICATORS
 Tyler Chianelli s EASYOPTIONTRADING by OPTION TRADING COACH PART 3 - CHART PATTERNS & TECHNICAL INDICATORS A SIMPLE SYSTEM FOR TRADING OPTIONS WORKS IN UP, DOWN, AND SIDEWAYS MARKETS PART 3.1 - PRIMARY
Submerging Markets. Market Update August 3, Seattle Technical Advisors
 SeattleTA provides investment managers with technical analysis of the equity, fixed-income, commodity, and currency markets. A cycle low is expected in emerging markets this week and is confirmed by a
Knowing When to Buy or Sell a Stock
 Knowing When to Buy or Sell a Stock Overview Review & Market direction Driving forces of market change Support & Resistance Basic Charting Review & Market Direction How many directions can a stock s price
Schwab Investing Insights Trading Edition Text Close Window Size: November 15, 2007
 Schwab Investing Insights Trading Edition Text Close Window Size: from TheStreet.com November 15, 2007 ON TECHNIQUES Two Indicators Are Better Than One The Relative Strength Index works well but it s better
Pattern Trader - Trade Analysis, Trade Set-ups and Profit (Loss)
") Pattern Trader - Trade Analysis, Trade Set-ups and Profit (Loss) Currency Pair: GBPJPY Entry Order: SELL stop @ 133.56 Stop loss: 134.18 Take profit: 131.87 Analysis: Last night's pending order was not
Pattern Trader - Trade Analysis, Trade Set-ups and Profit (Loss) Currency Pair: GBPJPY Entry Order: SELL stop @ 133.56 Stop loss: 134.18 Take profit: 131.87 Analysis: Last night's pending order was not
6 TRADE SETUPS YOU CAN START USING RIGHT NOW. includes: Ryan's top charting patterns
 6 TRADE SETUPS YOU CAN START USING RIGHT NOW includes: Ryan's top charting patterns SharePlanner's Top Setups for TRADING LONG & SHORT Far too often we clutter our trading strategy with hundreds of different
ULTIMATE REVERSAL TRADING STRATEGY
 The ULTIMATE REVERSAL TRADING STRATEGY www.thewizard.com ABOUT US The Wizard has been an industry leader in trading systems and education for 7 years. With subscribers from over 100 countries around the
Contents: Top 40 Chart ; Currency ; Charts of Interest ; Scatter Graph ; Relative Rotation Graph ; Stats. Top 40 Chart
 Contents: Top 40 Chart ; Currency ; Charts of Interest ; Scatter Graph ; Relative Rotation Graph ; Stats Top 40 Chart 1 Last week we saw the Top 40 approaching some moving average resistances, we have
Naked Trading and Price Action
 presented by Thomas Wood MicroQuant SM Divergence Trading Workshop Day One Naked Trading and Price Action Risk Disclaimer Trading or investing carries a high level of risk, and is not suitable for all
Tell-tale Trading Patterns. THE CMC Markets Trading Smart Series
 Tell-tale Trading Patterns THE CMC Markets Trading Smart Series Pattern recognition Pattern recognition is one of the most versatile skills you can learn when it comes to trading. This is the branch of
Introduction to Technical Analysis
 Introduction to Technical Analysis All About Chart Patterns, Candlesticks and Technical Studies rjofutures.rjobrien.com 800-441-1616 A division of R.J. O Brien Important Information About Trading Futures
OSCILLATORS. TradeSmart Education Center
 OSCILLATORS TradeSmart Education Center TABLE OF CONTENTS Oscillators Bollinger Bands... Commodity Channel Index.. Fast Stochastic... KST (Short term, Intermediate term, Long term) MACD... Momentum Relative
15 th March Gold Silver Copper Zinc Lead Aluminium Nickel Crude Oil Natural Gas Guar seed Castor seed. Bullion. Base Metal. Energy.
 15 th March 2018 Bullion Base Metal Energy Agro Gold Silver Copper Zinc Lead Aluminium Nickel Crude Oil Natural Gas Guar seed Castor seed On the daily chart MCX Gold price has given rising wedge breakdown
Chapter 5 Price Patterns In trading you have to use a little Kentucky windage - Leon Kogut
 Chapter 5 Price Patterns In trading you have to use a little Kentucky windage - Leon Kogut As long as there have been markets there has been someone looking at price history and trying to detect patterns.
Pattern Trader - November Trade Analysis, Trade Set-ups and Profit (Loss)
") Pattern Trader - November - 2015 - Trade Analysis, Trade Set-ups and Profit (Loss) Instrument: S&P 500 (US500) Entry Order: SELL stop @ 2078.00 Stop loss: 2130.00 Take profit: 1975.00 Analysis: This market
Pattern Trader - November - 2015 - Trade Analysis, Trade Set-ups and Profit (Loss) Instrument: S&P 500 (US500) Entry Order: SELL stop @ 2078.00 Stop loss: 2130.00 Take profit: 1975.00 Analysis: This market
Copyright Alpha Markets Ltd.
 Page 1 Trading Strategies - Module 3 Welcome to this unit on Trading Strategies. In this module we will be explaining the core components of a trading strategy and how you can begin to incorporate analysis
Pattern Trader - December Trade Analysis, Trade Set-ups and Profit (Loss)
") Pattern Trader - December - 2015 - Trade Analysis, Trade Set-ups and Profit (Loss) Currency Pair: GBPJPY Entry Order: SELL stop @ 184.92 Stop loss: 185.37 Take profit: 181.18 Analysis: Since forming a
Pattern Trader - December - 2015 - Trade Analysis, Trade Set-ups and Profit (Loss) Currency Pair: GBPJPY Entry Order: SELL stop @ 184.92 Stop loss: 185.37 Take profit: 181.18 Analysis: Since forming a
CMT LEVEL I CURRICULUM Self-Evaluation
 CMT LEVEL I CURRICULUM Self-Evaluation DEAR CFA CHARTERHOLDER, As a CFA charterholder, the requirement that you sit for the CMT Level I exam is waived. However, the content in the CMT Level I Curriculum
Technical Analysis and Charting Part II Having an education is one thing, being educated is another.
 Chapter 7 Technical Analysis and Charting Part II Having an education is one thing, being educated is another. Technical analysis is a very broad topic in trading. There are many methods, indicators, and
Daily Support & Resistance
 Daily Support & Resistance 30 th July 2010 USDJPY Price continued to decline as expected and stalled at the 85.96 support. The pullback has been firm but has not managed to penetrate both 4-hour & hourly
Trendlines INTRODUCEDBY CENTURYFINANCIALBROKERS DUBAI
 Trendlines INTRODUCEDBY CENTURYFINANCIALBROKERS DUBAI Trendline strategies Trendlines are used in technical analysis to define an uptrend or downtrend. Traditionally, uptrend lines are made by drawing
Chapter 24 DIVERGENCE DECISIONS
 Chapter 24 DIVERGENCE DECISIONS The subject of divergence is one that we will approach with the utmost caution. We hope we have made ourselves clear in the other volumes of this course that we have little
Technical analysis & Charting The Foundation of technical analysis is the Chart.
 Technical analysis & Charting The Foundation of technical analysis is the Chart. Charts Mainly there are 2 types of charts 1. Line Chart 2. Candlestick Chart Line charts A chart shown below is the Line
Pattern Trader - May Trade Analysis, Trade Set-ups and Profit (Loss)
") Pattern Trader - May 2017 - Trade Analysis, Trade Set-ups and Profit (Loss) Currency Pair: AUDJPY Entry Order: BUY stop @ 83.55 Stop loss: 82.89 Take profit: 85.97 Trade Risk Profile: 0.75% Analysis: AUDJPY
Pattern Trader - May 2017 - Trade Analysis, Trade Set-ups and Profit (Loss) Currency Pair: AUDJPY Entry Order: BUY stop @ 83.55 Stop loss: 82.89 Take profit: 85.97 Trade Risk Profile: 0.75% Analysis: AUDJPY
Chart Pattern Secrets
 Chart Pattern Secrets October 04, 2018 Next Alert: 10/09/18 The Trading System: Application of Trading Chart Patterns with Futures and Option Contracts Copyright 1997 All rights reserved. 1 2 3 9/20/18:
Weekly outlook for May 28/9 - June 1, 2018
 Weekly outlook for May 28/9 - June 1, 2018 Summary The S&P500 index is expected to be dull due to the short week, barring major news. A minor pullback maybe seen, but it should be a very short-lived. It
Does The Head & Shoulders. Formation Work? Detecting Trend Changes? Program logic CHARTING
 CHARTING fsee Traders Glossary for definition $See Editorial Resource Index mcharting Detecting Trend Changes? Does The Head & Shoulders Formation Work? Rarely will you come across a technique that detects
Market Update March 9, 2015
 SeattleTA provides investment managers with technical analysis of the equity, fixed-income, Stocks dropped and interest rates popped on Fridays payroll report as traders priced in a likely Fed rate hike
Technical Analysis for Options Trading. Fidelity Brokerage Services LLC, Member NYSE, SIPC, 900 Salem Street, Smithfield, RI
 Technical Analysis for Options Trading Fidelity Brokerage Services LLC, Member NYSE, SIPC, 900 Salem Street, Smithfield, RI 02917 747561.2.0 Disclosures Options trading entails significant risk and is
Glossary of Technical Analysis Terms
 George Davis, CMT Chief Technical Analyst RBC Dominion Securities Inc. +1 416 842 6633 george.davis@rbccm.com Global FX Strategy 13 January 2010 Glossary of Technical Analysis Terms Introduction Although
Technical Analysis Workshop Series. Session Six 1, 2, 3 Price-Bars Patterns
 Technical Analysis Workshop Series Session Six 1, 2, 3 Price-Bars Patterns DISCLOSURES & DISCLAIMERS This research material has been prepared by NUS Invest. NUS Invest specifically prohibits the redistribution
Chart Patterns By Bruce Kamich READ ONLINE
 Chart Patterns By Bruce Kamich READ ONLINE Symmetrical triangles can be characterized as areas of indecision. A market pauses and future direction is questioned. Typically, the forces of supply and demand
Martin Pring s. Weekly InfoMovie Report. December 27, Happy New Year to Our Wonderful Subcriber Family! May 2013 be Prosperous and Productive!
 Martin Pring s Weekly InfoMovie Report December 27, 2012 Issue 1028 Happy New Year to Our Wonderful Subcriber Family! May 2013 be Prosperous and Productive! The Pring Family ~ 2012 Weekly InfoMovie Report
Last Gasp in the Dollar. Market Update May 18, Seattle Technical Advisors
 SeattleTA provides investment managers with technical analysis of the equity, fixed-income, commodity, and currency markets. While equities are expected to take a hit this week, the big news is expected
Fintech $tocks. Chart Patterns & Algo. Trader. Trading Symmetric Triangle Patterns
 surinotes.com s Feb. 19, 2018 Chart Patterns & Algo. Trader Trading Symmetric Triangle Patterns A Weekly Publication Stocks/Futures/FX/Commodities Daily/Weekly/Monthly Analysis Auto Generated Chart Patterns/Analysis
Forex Range Trading With Price Action Forex Trading System By Laurentiu Damir
 Forex Range Trading With Price Action Forex Trading System By Laurentiu Damir Copyright 2012 by Laurentiu Damir All rights reserved. No part of this book may be reproduced or transmitted in any form or
PRICE ACTION TRADING COURSE
 PRICE ACTION TRADING COURSE forextradingstrategies4u.com P a g e 1 If you want to learn about Price Action Trading, then this forex price action trading course will really help you. There's a lot of practical
Wedge Pattern Breakouts: Explosive Winning Trades
 Wedge Pattern Breakouts: Explosive Winning Trades Prices move in patterns! This is due to one basic investment truism. Human nature exhibits the same habits when it comes to managing investment funds which
By Tri, Senior Analyst
 1/1/2014 Trend Following By Tri, Senior Analyst NUS Students Investment Society NATIONAL UNIVERSITY OF SINGAPORE Introduction Trend following was introduced by Richard Dennis when he taught trading strategies
THE ASX CHARTS. Supplementary lesson 1. Includes: Student lessons. Teacher notes & answers
 THE ASX CHARTS Supplementary lesson 1 Includes: Student lessons. Teacher notes & answers Supplementary Teacher Notes: THE ASX CHARTS The ASX charts Introduction: This lesson introduces students to the
Straddle Trade with Implied Volatility vs Historic Volatility
 Straddle Trade with Implied Volatility vs Historic Volatility Straddle Trade with Implied Volatility vs Historic Volatility CHART SET UP STRADDLE SET UP USING HISTORIC AND IMPLIED VOLATILITY CHART SET
For Valued Subscribers Only..
 HIGH PROBABILITY FOREX PRICE PATTERNS For Valued Subscribers Only.. ( Profitable Forex Price Patterns Which Are Simple To Use & Proven To Deliver High Probability Results Even For Complete Newbies Starting
Quantitative/Technical Analysis January 8, 2015
 Quantitative/Technical Analysis January 8, 2015 2015 Macro/Technical Outlook SYMBOL NAME PAGE USD U.S. Dollar Index 2 XEU Euro Index 3 CDW Canadian Dollar Index 4 XAD Australian Dollar 6 XJY Japanese Yen
Williams Percent Range
 Williams Percent Range (Williams %R or %R) By Marcille Grapa www.surefiretradingchallenge.com RISK DISCLOSURE STATEMENT / DISCLAIMER AGREEMENT Trading any financial market involves risk. This report and
Date: 21 September Contents (ctrl+click to follow link): SP 500
: SP 500") Date: 21 September 2015 Contents (ctrl+click to follow link): SP 500 ; Top 40 Chart ; Currency ; Charts of Interest ; Relative Rotation Graph ; Scatter Graph ; Sector Analysis ; Weekly Perfomances SP 500
Date: 21 September 2015 Contents (ctrl+click to follow link): SP 500 ; Top 40 Chart ; Currency ; Charts of Interest ; Relative Rotation Graph ; Scatter Graph ; Sector Analysis ; Weekly Perfomances SP 500
Picking the Direction of Shares
 Essential Guide to Picking the Direction of Shares Book 2 A guide to technical analysis. The Sharemarket College Pty Ltd. ABN 27 009 247 214. 46 Wharf Street, Kangaroo Point QLD 4169 Tel: (07) 3222 5300
Chapter 2.3. Technical Indicators
 1 Chapter 2.3 Technical Indicators 0 TECHNICAL ANALYSIS: TECHNICAL INDICATORS Charts always have a story to tell. However, sometimes those charts may be speaking a language you do not understand and you
END OF DAY DATA CORPORATION. Scanning the Market. using Stock Filter. Randal Harisch 2/27/2011
 END OF DAY DATA CORPORATION Scanning the Market using Stock Filter Randal Harisch 2/27/2011 EOD's Stock Filter tool quickly searches your database, identifying stocks meeting your criteria. The results
Our aim at S.T.I. is to make Technical Analysis as simple and uncomplicated as possible.
 By MPFX Our aim at S.T.I. is to make Technical Analysis as simple and uncomplicated as possible. We will try to explain the concepts of each indicator in Plain English and include examples where possible.
Part 2: ASX charts - more charting tools. OHLC / Bar chart
 Part 2: ASX charts - more charting tools OHLC / Bar chart A bar chart simply takes the information from the day's trading and plots that information on a single vertical 'bar'. A tab on the left side of
A handbook of the basics
 Primer Market Analysis United States 14 May 2013 A handbook of the basics Market Analysis Technical Handbook We cover the basics of Trend, Momentum and other technical indicators and methods. Stephen Suttmeier,
Balance Of Market Power. Who s The Boss? Stocks & Commodities V. 19:8 (18-32): Balance Of Power by Igor Livshin INDICATORS
: Balance Of Power by Igor Livshin INDICATORS") INDICATORS Who s The Boss? MIKE YAPPS Balance Of Market Power Who s in charge, bulls or bears? It doesn t take higher-order math to get a good reading. T by Igor Livshin he balance of market power (BMP)
INDICATORS Who s The Boss? MIKE YAPPS Balance Of Market Power Who s in charge, bulls or bears? It doesn t take higher-order math to get a good reading. T by Igor Livshin he balance of market power (BMP)
The Dow Theory in Technical Analysis
 The Dow Theory in Technical Analysis INTRODUCTION Today Foreign Exchange Market is one of the popular segments of the global financial market. FOREX is the largest and the most liquid financial market
Birth of New Trend (BNT) Tipple Entry Harmonic Pattern Trading Strategy
 Tipple Entry Harmonic Pattern Trading Strategy") Birth of New Trend (BNT) Tipple Entry Harmonic Pattern Trading Strategy May 2014 This trading strategy was developed by Y H Seo. This trading strategy is the blend of the work in Price Action and Pattern
Birth of New Trend (BNT) Tipple Entry Harmonic Pattern Trading Strategy May 2014 This trading strategy was developed by Y H Seo. This trading strategy is the blend of the work in Price Action and Pattern
CHART PATTERN TRADING
 Table of Contents Risk Warning... 2 CHART PATTERNS EXPLAINED:... 3 Introduction... 3 Why do chart Patterns Occur?... 3 Long- Term Patterns (LT)... 4 Short- Term Patterns (ST)... 5 Short- Term vs Long-
February 2015 Newsletter ( )
") February 2015 Newsletter (01-02-2015) In this newsletter we will go through a few of our twitter ideas this week. As well as look at the top 15 most watched (on your watchlist) shares on how-to-trade.co.za.
February 2015 Newsletter (01-02-2015) In this newsletter we will go through a few of our twitter ideas this week. As well as look at the top 15 most watched (on your watchlist) shares on how-to-trade.co.za.
Geometry in M and W Patterns: Bryce Gilmore s XABCD Tables
 Geometry in M and W Patterns: Bryce Gilmore s XABCD Tables XABCD Tables: Source: Bryce Gilmore, Price Action Manual [c] 2007, Chapter 19 These tables are designed to immediately highlight the internal
26 th Oct Gold Silver Copper Zinc Lead Aluminium Nickel Crude Oil Natural Gas. Bullion. Base Metal. Energy. Chana. Agro.
 26 th Oct 2018 Bullion Base Metal Energy Agro Gold Silver Copper Zinc Lead Aluminium Nickel Crude Oil Natural Gas Chana Soya Bean Gold futures closed flat Thursday, as strength in the U.S. dollar pushed
Please read the following risk disclosure before you proceed.
 Please read the following risk disclosure before you proceed. The risk of loss in trading commodity futures contracts can be substantial. You should therefore carefully consider whether such trading is
Figure 3.6 Swing High
 Swing Highs and Lows A swing high is simply any turning point where rising price changes to falling price. I define a swing high (SH) as a price bar high, preceded by two lower highs (LH) and followed
Tradeciety s Price Action Guide
 Tradeciety s Price Action Guide Welcome... 3 Who am I?... 3 Some impressions from my trading & traveling lifestyle... 4 What Is Price Action?... 6 Candlesticks vs. Chart patterns... 7 Top 3 Candlestick
Diwali Stock Picks Technical Research Recommendation
 Diwali Stock Picks 2018 Technical Research Recommendation A wholly owned subsidiary of Bank of Baroda November 1, 2018 STRTECH ICICIBANK AUROPHARMA HAVELLS BATAINDIA RELIANCE TCS Diwali Picks 2018 Technical