Pattern Trader - Trade Analysis, Trade Set-ups and Profit (Loss)
|
|
|
- Victoria Scott
- 5 years ago
- Views:
Transcription

1 Pattern Trader - Trade Analysis, Trade Set-ups and Profit (Loss) Currency Pair: GBPJPY Entry Order: SELL Stop loss: Take profit: Analysis: Last night's pending order was not triggered. However, I am maintaining my (very bearish posture on this pair. Following the large sell-off from a major double top price pattern last month, GBPJPY has been consolidating between and Prices are now hovering at the low end of the trading range. Yesterday's key reversal, together with today's inside-day bar, suggest this pair is coiling for an explosive move. I'm betting it will be to the downside.

2 Currency Pair: EURAUD Entry Order: BUY Stop loss: Take profit: Analysis: Following a large surge in prices in late August, EURAUD has been "locked" in a trading range between at the low end, and at the higher end. This pair is in a broad up-trend. Today's key reversal (in the direction of the trend), suggests that prices are set to test (and go through) the resistance level.

3 Pair: XAUUSD (spot Gold) Entry Order: SELL Stop loss: Take profit: Analysis: This past Sunday we alerted our subscribers to short XAUUSD at 1140, which resulted in a healthy 2,200 pip profit in just a few days. Based on the price action today, I still remain firmly in the bear camp on this pair. Following the doubletop (that I identified last Sunday) this pair has followed through to the downside. I feel, if we penetrate below the low on today's NR4 bar (the narrowest range in the past four trading sessions), there will be (much) lower prices to follow.
 triangle. In today's session, this pair closed at or below the neckline.")

4 Currency Pair: GBPAUD Entry Order: SELL Stop loss: Take profit: Analysis: GBPAUD has formed a descending wedge (bear) triangle. In today's session, this pair closed at or below the neckline. If we see price action below today's session low levels, you could see some good follow-through to the downside. There is still some remaining "white space" yet to be filled within the descending wedge triangle, so there could be some back-and-forth price action before this market is ready to go. Keep your risk low.

5 Currency Pair: EURGBP Entry Order: BUY Stop loss: Take profit: Analysis: This pair formed a double-bottom (buy) pattern back in the July-August time-frame. Following a sharp upward thrust from the to the price level, for the past several weeks this pair has been consolidating (between approximately on the low end, and about on the high end). In the past two trading sessions EURGBP has been "coiling" in the form of two inside-day bars. I believe if we take out today's session high price level, this pair will explode higher. (This is a good risk:reward trade). Currency Pair: GBPJPY Entry Order: BUY Stop loss: Take profit: Analysis: Last week this pair apparently found major support around the price level. Following a major key reversal at the support level, this pair has been consolidating in a tight "coil" at the current price level. It feels like if we take out today's session high we could be off to the races on this one (to the upside). Keep your risk low.


6 Currency Pair: EURCAD Entry Order: BUY Stop loss: Take profit: Analysis: Today's key reversal at or near the primary up-trend line suggests there may be some support at current levels. This could work out well or turn out to be a dud. Keep risk low. Instrument: US 500 (S&P500) Entry Order: BUY 2,000.00
 in today's session, suggests there could be more room on the upside. (Watch the 2,020.")
7 Stop loss: 1, Take profit: 2, Analysis: Following what appears to be a nice double-bottom at around the 1, level, the S&P 500 outside key reversal (it took out the low & high of the previous session) in today's session, suggests there could be more room on the upside. (Watch the 2,020. level for some resistance). Currency Pair: EURNZD Entry Order: SELL Stop loss: Take profit: Analysis: EURNZD has decisively broken down from a descending wedge triangle (bear) pattern. Penetration below the low of today's inside bar low, should propel prices much lower. I love this trade and if you want to bet more on this, I wouldn't caution against it...
 bottom.")
 higher prices to follow.")
8 Currency Pair: AUDJPY Entry Order: BUY Stop loss: Take profit: Analysis: AUDJPY appears to have formed a substantial (double or triple) bottom. Today's outside key reversal puts prices at or near the neckline. Penetration above current levels would suggest (much) higher prices to follow. Currency Pair: EURAUD Entry Order: SELL Stop loss: Take profit:

9 Analysis: EURAUD has formed a Rectangle Top (see definition below). In Friday's session we got final confirmation of this top price pattern formation following a breach under the low of the support line. Friday's session is also a NR4 bar (the narrowest range in the past four trading sessions). I feel HIGHLY confident that if we take out the low of Friday's NR4 bar, we could be well on our way to a 200+ pip move. The projected move is calculated by taking the height of the two trend lines (A and B in the chart above) multiplied by my proprietary percentage meeting price target mathematical formula. Rectangle Top Definition: Prices have flat tops and flat bottoms, crossing the pattern from side to side following two parallel trend-lines. Instrument: XAUUSD (Spot Gold) Entry Order: BUY Stop loss: Take profit: Analysis: Back in late July XAUUSD formed an "H" bottom. For the past several months this pair has been trapped in a range-bound affair between and Friday's close above recent resistance levels suggests (much) higher prices to follow. (In the absence of an "insurance day bar" or "coil" that I usually look for, this is an admittedly an early call. However, I think this could be a good point to start accumulating a "long" position. (I'm starting with a small position, and giving this market more latitude in setting a wider SL).

10 "H" or "Horn" Bottom Definition: Two parallel price spikes. Currency Pair: GBPJPY Entry Order: SELL Stop loss: Take profit: Analysis: Following what appears to be a lackluster rally last week, GBPJPY appears stalled at current levels. In Friday's session prices reversed at recent high's to close on the low. I feel if we penetrate below the low of today's inside-day bar, we could see lower prices (in a hurry).
 pattern.")
11 Currency Pair: EURNZD Entry Order: SELL Stop loss: Take profit: Analysis: EURNZD has decisively broken down from a Rectangle Top (bear) pattern. Penetration below the low of today's reversal bar, should propel prices much lower.

12 Instrument: XAUUSD (Spot Gold) Entry Order: BUY Stop loss: Take profit: Analysis: XAUUSD has been stuck in a trading range between and Should we penetrate above today's massive key reversal at the resistance level, there is a good chance of a nice follow-through to the upside.

13 Currency Pair: AUDNZD Entry Order: SELL Stop loss: Take profit: Analysis: AUDNZD appears to have formed a massive Top price pattern. Today's large key reversal suggests that prices may be ready to break out of the current range to the downside. (Final confirmation of a top price pattern won't be until the breach of the neckline at-or-near current price levels).


14 Currency Pair: EURAUD Entry Order: SELL Stop loss: Take profit: Analysis: Following yesterday's run-up in prices, we are seeing a reversal in prices today, at or near the break-out area, from a Rectangle Top formation. If we penetrate the low of today's session, I feel there is a good chance this pair goes to my TP target in the next several days.

15 Currency Pair: CADJPY Entry Order: SELL Stop loss: Take profit: Analysis: Following a sizable downtrend, CADJPY has been drifting sideways for several months. Recent price action suggests that this pair is incurring resistance at current levels, and could be ready to turn down again, to at least the support area. Currency Pair: GBPJPY Entry Order: BUY Stop loss: Take profit: Analysis: My current analysis on GBPJPY is probably as sophisticated as, "what doesn't go down, must go up". While my analysis led me to believe that the next major direction is lower, recent price action is telling me otherwise, and as you guy's know my mantra: "The Market is ALWAYS Right". A few days ago I recommended a short trade in GBPJP at current levels (183.93). Following a sharp thrust lower, this pair promptly turned tail in the other direction - but not before we extracted a healthy 96 pip profit on the trade...lol. Following GBPJPY failure to follow-through on its recent decline, for the past two trading sessions it has been consolidating (forming two large inside-day bars) at the price level.
 price pattern.")
16 I feel if we penetrate above today's session high price, we could see an explosion to the upside. Currency Pair: EURCAD Entry Order: SELL Stop loss: Take profit: Analysis: EURCAD has traced out a well defined Descending wedge triangle (bear) price pattern. Penetration below the low of Friday's inside bar, which is also at or near the "neckline", should propel prices lower.

17 Currency Pair: GBPUSD Entry Order: SELL Stop loss: Take profit: Analysis: In the Jun-Sep time-frame GBPUSD formed a double-top price pattern. Since that time, subsequent rallies have met with resistance. Last week, GBPUSD rallied back to a heavy resistance level. I think this recent rally will be met with the same result. Should we take out Friday's low, we could see this pair come under (heavy) pressure (again).

18 Currency Pair: NZDJPY Entry Order: SELL Stop loss: Take profit: Analysis: Following a sharp run-up off fresh multi-week lows, today NZDJPY suffered a sharp key reversal at an important near-term resistance level. A sell-off in this pair feels imminent.

19 Currency Pair: GBPUSD Entry Order: SELL Stop loss: Take profit: Analysis: In the Jun-Sep time-frame GBPUSD formed a double-top price pattern. Since that time, subsequent rallies have met with resistance. Recently GBPUSD rallied back to a heavy resistance level, but seems contained at current price levels - the last three successive trading sessions are stuck within last Wednesday's trading range. Should we take out today's session low, we could see this pair come under (heavy) down-side pressure.

20 Currency Pair: EURGBP Entry Order: BUY Stop loss: Take profit: Analysis: Following a sharp run-up off a double-bottom low in August, this pair has been contained within a trading range. I think if we penetrate above today's inside-day bar, prices could explode to the resistance area, and possibly (much) higher.

21 Currency Pair: AUDCAD Entry Order: BUY Stop loss: Take profit: Analysis: AUDCAD appears to have found a double-bottom support in the area. Following last week's sell-off, this pair had a large key reversal in the today's session. Despite overall lackluster market conditions, I think we could start seeing higher prices in this pair. I took a shot at this pair a couple of days ago. It still looks good to me. Actually, in my last recommendation of a long trade in this pair, I said it, "feels like AUDCAD wants to go higher (but may need some further consolidation at current levels)". Turns out what appears to be a pretty prescient observation.

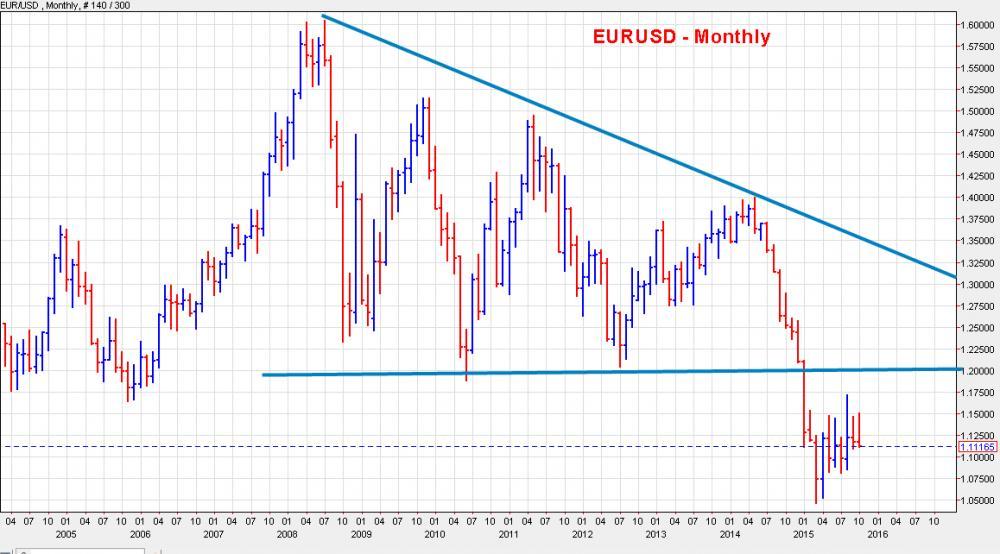
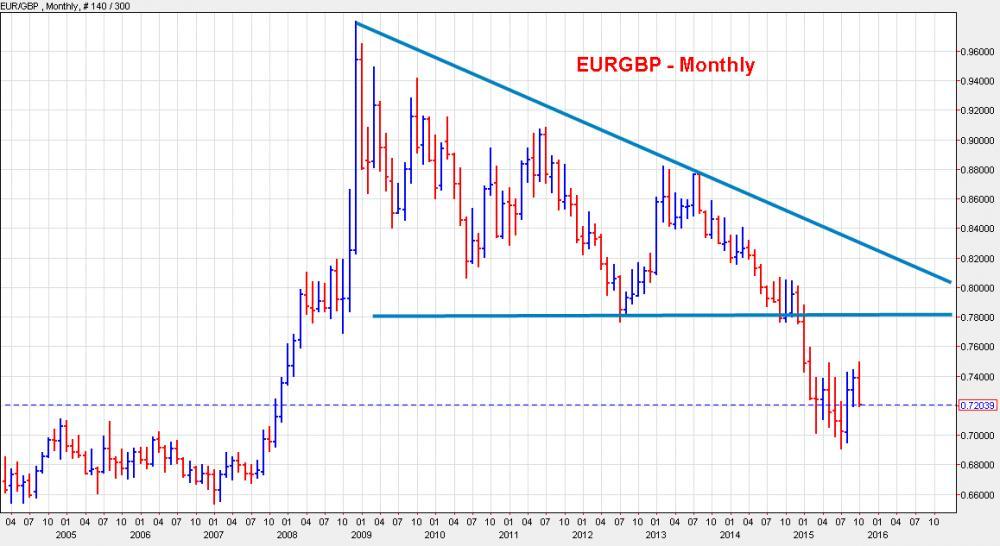
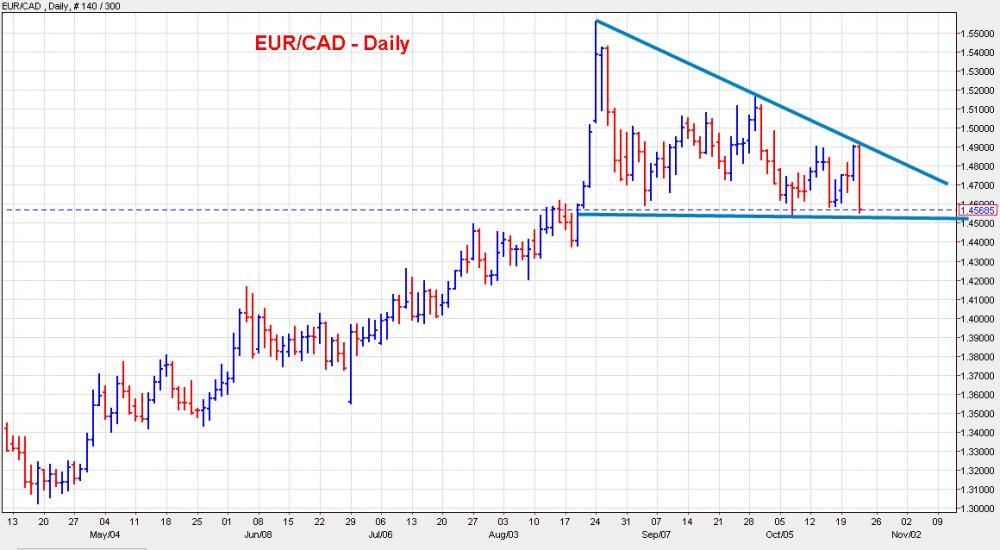
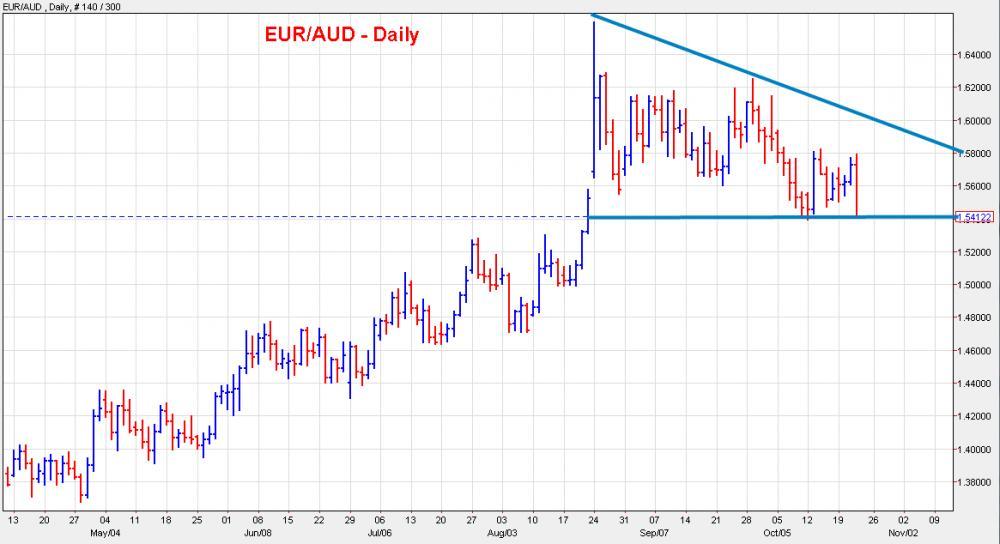
22 \ Instrument: DJIA (Stock Index) Entry Order: SELL 17, Stop loss: 17, Take profit: 16, Analysis: This market has formed a broadening top formation on the Weekly charts. Following a healthy rally off the Aug low's it appears this Stock Index has run into a major resistance area. Today's key reversal could indicate the beginning, of what I believe, will be another a nasty leg down in the stock market. Today's trade analysis and set-ups: While I am very bearish the EUR, in light of today's volatility, I'm inclined to wait until the dust settles. Instead I am giving you an insight into a very powerful price pattern - Descending Wedge Triangle - that has been building in the EUR against most major currency pairs, and will likely drive the future action in the EUR for quite some time to come..
23
24

25 Tutorial - Descending Wedge Triangle In the chart examples above, I wanted to show you how the Euro currency has formed a MAJOR bear price pattern against all other currency pairs. Descending Wedge Triangle definition: A price pattern bounded by two trendlines, the bottom one horizontal and the top sloping downward. Descending triangles are bearish patterns that indicate distribution. I believe there will be a lot of money to be made as this price pattern plays out against the EUR. Currency Pair: NZDUSD Entry Order: SELL Stop loss: Take profit:
26 Analysis: Following a decent rally off multi-year lows, NZDUSD appears to have stalled at the current price levels. Despite the recent rally, the primary trend for this pair is still a bearish one. The recent formation of a double-top price pattern at the upper levels suggests that prices could be ready to turn south (in a hurry). Pair: XAUUSD (spot Gold) Entry Order: SELL Stop loss: Take profit: Analysis: In recent months Gold has been in a trading range between and While it did "peek" above the resistance level last week, there was no follow-through. The long-term trend for this pair still has to be considered bearish, so I feel if we take out Friday's session key reversal low price, we could be headed back to the support area.
 price pattern at about the 0.")

27 Currency Pair: AUDUSD Entry Order: BUY Stop loss: Take profit: Analysis: This pair appears to have formed a double-bottom (bullish) price pattern at about the price level. Following a healthy run-up off the double-bottom low's AUDUSD has been consolidating at current prices. Should we penetrate above today's inside bar, I think we could see a good move higher. Pair: XAUUSD (spot Gold) Entry Order: SELL
28 Stop loss: Take profit: Analysis: In recent months Gold has been in a trading range between and While it did "peek" above the resistance level last week, there was no follow-through. The long-term trend for this pair still has to be considered bearish, so I feel if we take out Friday's session reversal bar, AND today's inside-day bar, we could be headed back to the support area. Currency Pair: NZDUSD Entry Order: SELL Stop loss: Take profit: Analysis: Following a decent rally off multi-year lows, NZDUSD appears to have stalled at the current price levels. Despite the recent rally, the primary trend for this pair is still a bearish one. The recent formation of a double-top price pattern at the upper levels, combined with the last two day inside-day bars, suggests that prices could be ready to turn south (in a hurry).

29 Currency Pair: GBPJPY Entry Order: SELL Stop loss: Take profit: Analysis: For the past two weeks GBPJPY has been rising incrementally and "grudgingly" in a "rising wedge" price pattern. Today, prices broke dramatically from the rising wedge, in what appears to be a renewal of its primary downtrend. I think if we break below today's session low, there could be much lower prices to come in this pair.

30 XAUUSD (spot Gold) Entry Order: SELL Stop loss: Take profit: Analysis: In recent months Gold has been in a trading range between and While it did "peek" above the resistance level last week, there was no follow-through. Following today's FED interest rate announcement Gold gave up all its gains for the day and then some. For me, today's massive key reversal feels like a "dagger in the sand", and that the next BIG move will be to the downside. Currency Pair: EURCAD Entry Order: SELL Stop loss: Take profit: Analysis: In the past few week's EURCAD has been tracing out a Descending Wedge Triangle (bear) price pattern. Today prices decisively reversed and closed under the horizontal line of the descending triangle, setting up for what looks like a sustained move to the downside.

31 Currency Pair: EURAUD Entry Order: BUY Stop loss: Take profit: Analysis: Recently EURAUD broke out to the downside of a Rectangle Top price pattern. Instead of continuing lower, as would customarily be expected in a break-out from this pattern, this pair appears to have grabbed support at the primary up-trend line. I get the feeling that if we break above today's inside-bar high price, you could see an explosion to the upside.

32 Currency Pair: AUDJPY Entry Order: SELL Stop loss: Take profit: Analysis: Following a sharp break to the downside in mid-august AUDJPY has been in a trading range from to The recent formation of a double-top price pattern at the level suggests prices could be ready to break to the bottom of the trading range (or lower).
Pattern Trader - November Trade Analysis, Trade Set-ups and Profit (Loss)
") Pattern Trader - November - 2015 - Trade Analysis, Trade Set-ups and Profit (Loss) Instrument: S&P 500 (US500) Entry Order: SELL stop @ 2078.00 Stop loss: 2130.00 Take profit: 1975.00 Analysis: This market
Pattern Trader - November - 2015 - Trade Analysis, Trade Set-ups and Profit (Loss) Instrument: S&P 500 (US500) Entry Order: SELL stop @ 2078.00 Stop loss: 2130.00 Take profit: 1975.00 Analysis: This market
Pattern Trader - December Trade Analysis, Trade Set-ups and Profit (Loss)
") Pattern Trader - December - 2015 - Trade Analysis, Trade Set-ups and Profit (Loss) Currency Pair: GBPJPY Entry Order: SELL stop @ 184.92 Stop loss: 185.37 Take profit: 181.18 Analysis: Since forming a
Pattern Trader - December - 2015 - Trade Analysis, Trade Set-ups and Profit (Loss) Currency Pair: GBPJPY Entry Order: SELL stop @ 184.92 Stop loss: 185.37 Take profit: 181.18 Analysis: Since forming a
Pattern Trader - April Trade Analysis, Trade Set-ups and Profit (Loss)
") Pattern Trader - April - 2016 - Trade Analysis, Trade Set-ups and Profit (Loss) Currency Pair: EURJPY Entry Order: SELL stop @ 126.94 Stop loss: 127.57 Take profit: 125.18 Analysis: EURJPY has been going
Pattern Trader - April - 2016 - Trade Analysis, Trade Set-ups and Profit (Loss) Currency Pair: EURJPY Entry Order: SELL stop @ 126.94 Stop loss: 127.57 Take profit: 125.18 Analysis: EURJPY has been going
Pattern Trader - May Trade Analysis, Trade Set-ups and Profit (Loss)
") Pattern Trader - May - 2016 - Trade Analysis, Trade Set-ups and Profit (Loss) Currency Pair: GBPCAD Entry Order: BUY stop @ 1.8377 Stop loss: 1.8327 Take profit: 1.8557 Trade Risk Profile: 1.0% Analysis:
Pattern Trader - May - 2016 - Trade Analysis, Trade Set-ups and Profit (Loss) Currency Pair: GBPCAD Entry Order: BUY stop @ 1.8377 Stop loss: 1.8327 Take profit: 1.8557 Trade Risk Profile: 1.0% Analysis:
Pattern Trader - February Trade Analysis, Trade Set-ups and Profit (Loss)
") Pattern Trader - February - 2016 - Trade Analysis, Trade Set-ups and Profit (Loss) Currency Pair: NZDUSD Entry Order: BUY stop @ 0.6561 Stop loss: 0.6518 Take profit: 0.6787 Analysis: In the video (attached
Pattern Trader - February - 2016 - Trade Analysis, Trade Set-ups and Profit (Loss) Currency Pair: NZDUSD Entry Order: BUY stop @ 0.6561 Stop loss: 0.6518 Take profit: 0.6787 Analysis: In the video (attached
Pattern Trader - November Trade Analysis, Trade Set-ups and Profit (Loss)
") Pattern Trader - November - 2016 - Trade Analysis, Trade Set-ups and Profit (Loss) Currency Pair: EURAUD Entry Order: BUY stop @ 1.4470 Stop loss: 1.4403 Take profit: 1.4718 Trade Risk Profile: 0.50% Analysis:
Pattern Trader - November - 2016 - Trade Analysis, Trade Set-ups and Profit (Loss) Currency Pair: EURAUD Entry Order: BUY stop @ 1.4470 Stop loss: 1.4403 Take profit: 1.4718 Trade Risk Profile: 0.50% Analysis:
Pattern Trader - May Trade Analysis, Trade Set-ups and Profit (Loss)
") Pattern Trader - May 2017 - Trade Analysis, Trade Set-ups and Profit (Loss) Currency Pair: AUDJPY Entry Order: BUY stop @ 83.55 Stop loss: 82.89 Take profit: 85.97 Trade Risk Profile: 0.75% Analysis: AUDJPY
Pattern Trader - May 2017 - Trade Analysis, Trade Set-ups and Profit (Loss) Currency Pair: AUDJPY Entry Order: BUY stop @ 83.55 Stop loss: 82.89 Take profit: 85.97 Trade Risk Profile: 0.75% Analysis: AUDJPY
Pattern Trader - December Trade Analysis, Trade Set-ups and Profit (Loss)
") Pattern Trader - December - 2016 - Trade Analysis, Trade Set-ups and Profit (Loss) Pair: XAUUSD (spot Gold) Entry Order: BUY stop @ 1177.00 Stop loss: 1167.00 Take profit: 1192.00 Trade Risk Profile: 0.50%
Pattern Trader - December - 2016 - Trade Analysis, Trade Set-ups and Profit (Loss) Pair: XAUUSD (spot Gold) Entry Order: BUY stop @ 1177.00 Stop loss: 1167.00 Take profit: 1192.00 Trade Risk Profile: 0.50%
The Pattern Trader - Special Gold (XAUUSD) Program
 Program") The Pattern Trader - Special Gold (XAUUSD) Program Overview Since launching The Pattern Trader in September, 2015, the performance results of my trade set-ups and analysis have been very profitable. In
The Pattern Trader - Special Gold (XAUUSD) Program Overview Since launching The Pattern Trader in September, 2015, the performance results of my trade set-ups and analysis have been very profitable. In
THE FOREX TRADING GUIDE TECHNICAL ANALYSIS CHART PATTERNS
 1 Copyright 2016 TradingSpine All rights reserved by TradingSpine. No parts of this work may be reproduced in any form or by any means - graphic, electronic, or mechanical, including photocopying, recording,
TRADE ANALYSIS. August 2017 Performance
 EUR/AUD SHORT Entry Date 01/08/2017 Entry point 1.4930 Stop-Loss 1.4980 Risk-Reward Ratio 14 Target 1.4230 As indicated on the chart we can see that the pair previously reversed to the downside between
Market Overview. Indices Week Open Week Close CHANGE NASDAQ DOW JONES NIKKEI
 Forex Weekly Report Powered by Future Investment www.futureinvestments.sg Monday 24 Dec 2018 Market Overview The US Dollar will be overwhelmingly pre-occupied with a single event in the week ahead: the
Daily Support & Resistance
 Daily Support & Resistance 30 th July 2010 USDJPY Price continued to decline as expected and stalled at the 85.96 support. The pullback has been firm but has not managed to penetrate both 4-hour & hourly
In the Charts Forex. Today s key points. CROSS ASSET TECHNICAL ANALYSIS 01 October 2013
 CROSS ASSET TECHNICAL ANALYSIS 01 October 2013 In the Charts Forex Today s key points EUR/USD has given a break above the weekly channel resistance of 1.3454/20 which also happens to be 76.4% retracement
Market Overview. Indices Week Open Week Close Change NASDAQ DOW JONES
 FOREX Weekly Report Powered by Future Investment www.futureinvestments.sg Monday 18 th Feb 2019 Market Overview The US dollar rebounded from three year lows against a currency basket on Friday but still
Trading Conditions. Maxrich Group Futures Galleria
 Trading Conditions Maxrich Group Futures Galleria Types of Trading Accounts No matter what your goals are, Maxrich Group Futures Galleria has an account that will suit your investment style and needs.
Forex Currency Pairs Forex Terminology Spread Lot Size. Margin and Leverage Pip Value Volume. BearBullTraders.com. All Right Reserved.
 Forex Currency Pairs Forex Terminology Spread Lot Size Margin and Leverage Pip Value Volume Forex = Foreign Exchange Forex Trading = Buy or Sell contracts for a currency pair based on fundamental and technical
This document will outline the simple Four Step process to executing the Stackable Carry Trade.
 The Carry Trade is a relatively popular strategy among Forex traders. The concept is to pair high yielding interest currencies against low interest currencies in order to earn the difference by holding
Chart Patterns. (High Probability Chart Patterns) By Russ Horn
 By Russ Horn") (High Probability ) By Russ Horn 1 RISK DISCLOSURE STATEMENT / DISCLAIMER AGREEMENT Trading any financial market involves risk. This report and all and any of its contents are neither a solicitation nor
(High Probability ) By Russ Horn 1 RISK DISCLOSURE STATEMENT / DISCLAIMER AGREEMENT Trading any financial market involves risk. This report and all and any of its contents are neither a solicitation nor
Inter-market Technical Analysis for April 22, Summary Chart TheoTrade LLC. All rights reserved.
 1 Weekly Inter-market Technical Report Summary Chart 1 2018 TheoTrade LLC. All rights reserved. 2 Intraday Intermarket Volatility is returning to the markets, particularly with the collapse/sell-swing
Pay and Start Accounts Getting started
 Pay and Start Accounts Getting started In order to get your funded account open with our broker, Pricemarkets, please complete the below: 1 Full name? 2 Home address? 3 Email address? 4 Phone Number? 5
The Engulfing Trader Copyright 2014
 Www.ForexWinners.Ru Prologue and Introduction This book is for all those that are just fed up with all the hype out there in the market. So called guru s selling expensive strategies and systems guaranteeing
Account Types Mini Standard VIP Premium Temporary Benefit No Spread No Commission
 WWW.FINMARKET.COM Account Types Mini Standard VIP Premium Temporary Commission Minimum Deposit $250 $1,000 $5,000 $100,000 - - - Commissions $15.0 $12.5 $2.0 $1.0 $1.0 From $32.5 $0.0 Daily Market Reviews
Chapter 3.3. Price Patterns
 1 Chapter 3.3 Price Patterns 0 TECHNICAL ANALYSIS: PRICE PATTERNS Traders vote with their chequebooks. If they believe a stock or CFD is going to move higher then they will buy the stock or CFD. If they
 WWW.KDNA-INVESTMENT.COM Account Types Mini Standard VIP Premium Temporary Commission Minimum Deposit $1,000 $5,000 $10,000 $100,000 - - - Commissions $15.0 $12.5 $11.0 $10.0 $8.0 $35.0 $0.0 Daily Market
Technical Analysis Workshop Series. Session Three
 Technical Analysis Workshop Series Session Three DISCLOSURES & DISCLAIMERS This research material has been prepared by NUS Invest. NUS Invest specifically prohibits the redistribution of this material
Market Overview. Indices Week Open Week Close Change NASDAQ DOW JONES
 Forex Weekly Report Powered by Future Investment www.futureinvestments.sg Monday 24 Dec 2018 Market Overview Political issues are cropping up everywhere, and it is possible that Europe may see significant
Wedge Pattern Breakouts: Explosive Winning Trades
 Wedge Pattern Breakouts: Explosive Winning Trades Prices move in patterns! This is due to one basic investment truism. Human nature exhibits the same habits when it comes to managing investment funds which
The Stackable Carry Trade
 The Stackable Carry Trade Introduction: The Carry Trade is a relatively popular strategy among Forex traders. The concept is to pair high yielding interest currencies against low interest currencies in
Commodities, Financials and FOREX Special Situations for the week of January 19, Table of Contents
 Commodities, Financials and FOREX Special Situations for the week of January 19, 2015 Table of Contents COMMODITIES: GC Gold FINANCIALS: FXI IShares FTSE China Index Fund, AAPL (Apple Inc), EWA (Ishares
Weekly technical analysis chart pack 9 nd June 2014 James Brodie Chartered Market Technician
 Weekly technical analysis chart pack 9 nd June 2014 James Brodie Chartered Market Technician EURUSD Within 24 hours of Mario Draghi announcing the ECB s new round of rate cuts and easing policies the EURUSD
Market Overview. Indices Week Close LTP Change NASDAQ DOW JONES NIKKEI
 Forex Weekly Report Powered by Future Investment www.futureinvestments.sg Monday 28 Jan 2019 Market Overview This week investors will be focusing on the Federal Reserve s first meeting of the year, as
the TFXT Members Guide to Risk and Money Management Guide to order types and Forex Terms
 15 December Morning Comment - No record highs for the first time this week and after registering two Doji type daily candles in recent days, the S&P has seen some follow through to the downside overnight.
Gold, Mining Stocks on the Verge of a Major Bull Market
 Gold, Mining Stocks on the Verge of a Major Bull Market By Robert McHugh, Ph.D. In looking at the charts for Gold, Silver and Mining Stocks, it is clear that patterns and wave mappings suggest a bottom
Daily Market Reflection
 Daily Market Reflection Commodity Market Outlook Gold prices ended Friday s session down $0.93 an ounce, as the dollar drifted higher following a jobs report that was stronger than market expectations.
INTERMEDIATE EDUCATION GUIDE
 INTERMEDIATE EDUCATION GUIDE CONTENTS Key Chart Patterns That Every Trader Needs To Know Continution Patterns Reversal Patterns Statistical Indicators Support And Resistance Fibonacci Retracement Moving
EWF YEARLY FORECAST 2/7/2017
 WWW.ELLIOTTWAVE-FORECAST.COM EWF YEARLY FORECAST 2/7/2017 SPX should remain bullish against February 2016 low Cycle from 2.2016 low in SPX is mature but the Index still has scope to extend higher towards
TRADING ACADEMY MODULE-3 TECHNICAL ANALYSIS SECTION-6 PRICE ACTION. LEVEL-1: THE COMPLETE GUIDE TO TRADING FOREX & CFDs
 TRADING ACADEMY LEVEL-1: THE COMPLETE GUIDE TO TRADING FOREX & CFDs MODULE-3 TECHNICAL ANALYSIS SECTION-6 PRICE ACTION TRADING ACADEMY LIMITED MODULE-3: TECHNICAL ANALYSIS SECTION-6: PRICE ACTION TRADING
How to perform accurate market analysis
 How to perform accurate market Roman Sadowski Good market combines the fundamental and the technical. This combination is essential to form a longer-term bias in the market. Good market needs to consider
Forex Sentiment Report Q2 FORECAST WEAK AS LONG AS BELOW April
 Forex Sentiment Report 08 April 2015 www.ads-securities.com Q2 FORECAST WEAK AS LONG AS BELOW 1.1200 Targets on a break of 1.1534/35: 1.1740/50 1.1870/75 1.2230/35 Targets on a break of 1.0580/70: 1.0160
Market Turning Points By Andre Gratian
 Market Turning Points By Andre Gratian June 21, 2015 Precision timing for all time frames through a multi-dimensional approach to forecasting using technical analysis: Cycles - Breadth - P&F and Fibonacci
User Guide. PivotBreaker. Brought to you by Equitimax. A trading method for forex. Equitimax
 User Guide PivotBreaker Brought to you by Equitimax A trading method for forex Equitimax Disclaimer The PivotBreaker is provided to you by Equitimax, free of charge. We provide no warranty or promise of
Multi-asset technical strategies Week of 20 th November Mark Sturdy. Authorised and regulated by the FSA. Summary. Currencies. Stocks.
 + Standard S&P 500 & Poors 500 + European EuroStoxx DJ 50 Stoxx 50 + Ten year Year US Treasury treasury TNote note Note + Ten year Year Euro German Bund Bund + Ten UK Gilt year Japanese Bond + Dollar Oil
January 4th, 2018 CURRENCIES USD/CAD AUD/USD USD/CHF. Market Watch
 CURRENCIES USD/CAD I believe that this pair is going to continue to be rather choppy over the next couple of sessions, with the 1.25 level offering a bit of a floor. This is because we get jobs numbers
Process Driven, Limited Risk FX Trading. 08 April 2008
 Process Driven, Limited Risk FX Trading 08 April 2008 The Theory FX Markets trend approximately 15% of the time. The key is to avoid non-trending markets and focus on the currency pairs that are trending.
Profitable Patterns. Do you believe there are profits to be made in stocks? With the right tools, anyone can make consistent money in stocks.
 Profitable Patterns Do you believe there are profits to be made in stocks? With the right tools, anyone can make consistent money in stocks. Level of RESISTANCE Price per share has NOT been able to "Break
CMS Prime DAILY MARKET REPORT
 CMS Prime DAILY MARKET REPORT May 09, 2018 EURUSD BEARISH BIAS short position at 1.1855 with SL : 1.1900 and with targets at 1.1835 and 1.1800 long position at 1.1900 with SL : 1.1835 and with targets
FX Daily. Global Strategy Technical Analysis. Today s highlights: Today s trades/positions: Hierarchy Grid
 .8 08 November 2013 Fixed Income Research FX Global Strategy Technical Analysis Today s highlights: EURUSD breaks key price, trendline and 38.2% retracement support at 1.3464/21 to mark a better top, for
Daily Market Reflection
 Daily Market Reflection Commodity Market Outlook Gold edged higher on Wednesday as the dollar weakened after the previous session's rally, though gains were seen as limited by a recovery in equity markets
14 th November General Outlook. Ian Copsey
 2006 General Outlook The Dollar is higher across the board and looks generally positive for one more rally to marginal new highs at least. The 1.2745 EURUSD, 1.2523 USDCHF and 1.8925-45 GBPUSD areas all
Apiary Fund Trading Plan
 Apiary Fund Trading Plan Position Size Always set stop < 2% of account balance. 75% of trades should be between.5% and 1% of account balance. Chart Setup OSMA and SMA Strategy Chart Setup Monitor and focus
Our aim at S.T.I. is to make Technical Analysis as simple and uncomplicated as possible.
 By MPFX Our aim at S.T.I. is to make Technical Analysis as simple and uncomplicated as possible. We will try to explain the concepts of each indicator in Plain English and include examples where possible.
DAILY TECHNICAL REPORT MA S-TERM. 16 December, 2011 L-TERM MULTI-WEEK OBJECTIVES/COMMENTS ENTRY LEVEL STRATEGY/ POSITION
 MA S-TERM MULTI-DAY Please note: None of the strategies below represent trading advice or trading recommendations of any kind. Please refer to our full disclaimer. L-TERM MULTI-WEEK STRATEGY/ POSITION
S&P Cash Long Term: Uptrend Intact. Monthly Log Chart
 Andy Dodd MSTA - +44 020 7031 4651 adodd@louiscapital.com Twitter : @louiscaptech S&P Cash Long Term: Uptrend Intact Despite an initial slowdown in momentum following the break above 2120 in July, which
EURUSD Monday Low is Pivot for Next Move Daily Bars
 09/24/2012 BIAS BIAS MAY CHANGE OBJECTIVES EURUSD Long 12890 13172 + GBPUSD Flat AUDUSD Long 10365 10624 + NZDUSD Long 8180 8570 USDJP Y Long 7750 8060 USDCAD Flat USDCHF Flat GOLD Flat CRUDE Pending USDOLLAR
Ira Epstein s Gold Report
 Ira Epstein s Gold Report 3-12-2015 Will the Federal Reserve leave in or take out the word patient at this Wednesday s FOMC Meeting? 10-Year Notes are a proxy for Gold Prices Currency War in full swing
TRADING VIEW: A Break and close below support.7600c would be the catalyst to looking for short trade opportunities in the sessions ahead.
 06 April 2018 S&P 500 A 5 wave decline can be counted on the daily chart from the 2807.25 high of March to the low of 2552. This is the first indication that a trading low may be in place. Confidence that
Weekly outlook for April 30 May
 Weekly outlook for April 30 May 4 2018 Summary The S&P500 index is having trouble deciding if it will rally or decline. This indecision makes trading less profitable. Wait for a break-out direction to
DAILY TECHNICAL REPORT MA S-TERM. 27 June, 2012 L-TERM STRATEGY/ POSITION ENTRY LEVEL OBJECTIVES/COMMENTS MULTI-WEEK
 MA S-TERM MULTI-DAY Please note: None of the strategies below represent trading advice or trading recommendations of any kind. Please refer to our full disclaimer. L-TERM OBJECTIVES/COMMENTS STOP MULTI-WEEK
MULTI-TIMEFRAME TREND TRADING
 1. SYNOPSIS The system described is a trend-following system on a slow timeframe that uses optimized (that is, contrarian) entries and exits on a fast timeframe at the tops and bottoms of retraces against
Tips for Traders 6/1/ :13:00 AM How to Catch a Trade in a Vertically-Trending Market
 Tips for Traders 6/1/2009 10:13:00 AM How to Catch a Trade in a Vertically-Trending Market One of the most exhilarating rides we can take as traders is when a profitable position we have on goes vertical.
Weekly outlook for Mar
 Weekly outlook for Mar. 26 30 2018 Summary The S&P500 index is expected to test February's low first and bounce from it before the Good Friday holiday. The end of the month and the end of the quarter may
CMS Prime DAILY MARKET REPORT
 CMS Prime DAILY MARKET REPORT May 14, 2018 EURUSD BULLISH BIAS long position at 1.1960 with SL : 1.1925 and with targets at 1.1990 and 1.2020 short position at 1.1925 with SL : 1.1970 and with targets
Market Observations - as of Jul 27, 2018
 Market Observations - as of Jul 27, 2018 By Carl Jorgensen - For Objective Traders - For educational purposes only. Not Financial Advice. This week began with most markets continuing their bullish trends
EZ Trade FOREX Day Trading System. by Beau Diamond
 EZ Trade FOREX Day Trading System by Beau Diamond The EZ Trade FOREX Day Trading System is mainly used with four different currency pairs; the EUR/USD, USD/CHF, GBP/USD and AUD/USD, but some trades are
Compiled by Timon Rossolimos
 Compiled by Timon Rossolimos - 2 - The Seven Best Forex Indicators -All yours! Dear new Forex trader, Everything we do in life, we do for a reason. Why have you taken time out of your day to read this
Part 1 Forex Trading. What is Forex?
 Part 1 Forex Trading What is Forex? Forex or Foreign Exchange market, is the world's largest financial market. Forex market has a daily turnover of over four trillion dollars a day, traded globally by
Forex Product Specification Sheet
 Foreign Exchange Products The foreign exchange market is notably the largest market in the world. Due to this large size and liquidity many believe that this is the most efficient financial market. It
Market Observations - as of Aug 17, 2018
 Market Observations - as of Aug 17, 2018 By Carl Jorgensen - For Objective Traders - For educational purposes only. Not Financial Advice. This week we saw a reversal of roles from the prior week. This
10-Year Treasury Notes ($UST Price)
") 1 Weekly Inter-market Technical Report 10-Year Treasury Notes ($UST Price) Monthly Continuing from last week's report, bonds (notes) appear to be on a strong buy signal on the monthly chart, as price is
1 Weekly Inter-market Technical Report 10-Year Treasury Notes ($UST Price) Monthly Continuing from last week's report, bonds (notes) appear to be on a strong buy signal on the monthly chart, as price is
3 Price Action Signals to Compliment ANY Approach to ANY Market
 3 Price Action Signals to Compliment ANY Approach to ANY Market Introduction: It is important to start this report by being clear that these signals and tactics for using Price Action are meant to compliment
SXXP and SX5E nearing their downtrends. Gold remains a short in line with the trend. Dollar index at key support. EURUSD bearish candle
 Andy Dodd MSTA - +44 020 7031 4651 adodd@louiscapital.com Twitter : @louiscaptech SXXP and SX5E nearing their downtrends. Gold remains a short in line with the trend Dollar index at key support EURUSD
the TFXT Members Guide to Risk and Money Management Guide to order types and Forex Terms
 17 November Morning Comment - The bounce from the key 2560 level has opened the way for the S&P500 to make new highs into year end. A little frustrating as we were hoping to see the recent pullback extend
Market Observations as of Mar 2, 2018
 Market Observations as of Mar 2, 2018 By Carl Jorgensen - For Objective Traders - For educational purposes only. Not Financial Advice. The markets were mixed this week as volatility raised its head back
Summary & Cuttings by Forexcube
 Summary & Cuttings by Forexcube HA-T3-1 System by tonyb123 H4; M30 Trading direction signals are generated on the 4 Hour Chart. All Trades are executed on the 30 Minute Chart. Of course you can use the
Equities: Weekly Technical Overview 2nd October 2016
 Andy Dodd MSTA - +44 020 7031 4651 adodd@louiscapital.com Twitter : @louiscaptech Equities: Weekly Technical Overview 2nd October 2016 Equity Index Technical Dashboard The table below is intended as an
US Dollar Struggles as Euro Gains Top Spot - A review of the Major Global Currencies
 US Dollar Struggles as Euro Gains Top Spot - A review of the Major Global Currencies 26 th November 2017 My colleagues have been urging me to write a weekly commentary on Bitcoin/Cryptocurrencies. However,
Quality of Execution Study
 Quality of Execution Study FXCM * Order Execution compared to FX Futures and the Interbank Spot FX Market *FXCM references refer to Forex Capital Markets, LLC. Please see last slide for full disclaimer
Potential trade: No change to this idea, although patience required.
 21 June 2017 AUDNZD Potential trade: No change to this idea, although patience required. The Wave IV corrective pattern remains in place heading into tomorrow mornings RBNZ meeting at 7.00am. RBNZ meeting
STANDARD VARIABLE ACCOUNT
 STANDARD VARIABLE ACCOUNT MAJOR FX LEVERAGE 30 : 1 MARGIN 3,33% MIN VOLUME 0.01 Lot / position CONTRACT SIZE 1 Lot = 100,000 units of base currency HOURS (UK TIME) 24 HRS 2,4 (Pips) CADJPY Canadian Dollar
Raising Investment Standards TRADING SEMINAR
 Raising Investment Standards TRADING SEMINAR Raising Investment Standards DISCLAIMER Leveraged foreign exchange and options trading carries a significant level of risk, and may not be suitable for all
Market Observations - as of Jun 8, 2018
 Market Observations - as of Jun 8, 2018 By Carl Jorgensen - For Objective Traders - For educational purposes only. Not Financial Advice. Over the past four months we have seen several examples of Consolidation
Bill Adlard s market review
 Bill Adlard s market review DJIA S&P 500 FTSE 100 Gold Cable Euro Brent Crude Sunday 30 th September 2012 To view full screen use Ctrl-L or View/Full Screen Mode from the Menu. Images are clearest at 108%
TRADING RULES FX AND PRECIOUS METAL Effective May 01, 2017
 TRADING RULES FX AND PRECIOUS METAL Effective May 01, 2017 PRODUCTS Contract Size EUR/USD EUR 100,000 USD/JPY USD 100,000 GBP/USD GBP 100,000 USD/CHF USD 100,000 AUD/USD AUD 100,000 NZD/USD NZD 100,000
Three Techniques for Spotting Market Twists and Turns. Riding the Roller
 Three Techniques for Spotting Market Twists and Turns Riding the Roller Coaster Learn to Spot the Twists and Turns Whether you re new to forex or you ve been trading a while, you know how the unexpected
Daily Commentary. Seattle Technical Advisors.com. Developed Markets
 Daily Commentary Seattle Technical Advisors.com Ed Carlson, CMT SeattleTA.618@gmail.com Developed Markets US Equities rallied again on Wednesday; SPX +8.94, DJIA +83.55, but NASDAQ +22.67. With one more
S&P Cash Long Term: Uptrend Intact. Monthly Log Chart
 Andy Dodd MSTA - +44 020 7031 4651 adodd@louiscapital.com Twitter : @louiscaptech S&P Cash Long Term: Uptrend Intact Despite an initial slowdown in momentum following the break above 2120 in July, which
Market Observations as of Nov 17, 2017
 Market Observations as of Nov 17, 2017 By Carl Jorgensen - For Objective Traders - For educational purposes only. Not Financial Advice. This week we saw a variety of market moves. The daily charts for
- London: Paris: New York:
 EUR/USD MT LONG 1.4070 1.3930 1.4320 1.4500 Pivot: 1.3930 Our preference: LONG position @ 1.407 with 1.432 & 1.45 in sight. Alternative scenario: A penetration of 1.393 would call for a drop to 1.371 &
Cruscotto v1. by Andrea Salvatore. Traders-Secret-Library.com
 Cruscotto v1 by Andrea Salvatore Traders-Secret-Library.com RISK DISCLOSURE STATEMENT / DISCLAIMER AGREEMENT Trading any financial market involves risk. This report and its contents is neither a solicitation
Tradeciety s Price Action Guide
 Tradeciety s Price Action Guide Welcome... 3 Who am I?... 3 Some impressions from my trading & traveling lifestyle... 4 What Is Price Action?... 6 Candlesticks vs. Chart patterns... 7 Top 3 Candlestick
Daily Market Reflection
 Daily Market Reflection Commodity Market Outlook Gold prices rebounded on Tuesday as risk appetite faded after getting a boost from an agreement between the United States and Canada to salvage a North
DAILY TECHNICAL REPORT
 Please note: None of the strategies below represent trading advice or trading recommendations of any kind. Please refer to our full disclaimer. MA S-TERM MULTI-DAY L-TERM MULTI-WEEK STRATEGY/ POSITION
Buy rules: Sell rules: Strategy #2. Martingale hedging with exponential lot increase... 6
 Contents Introduction... 2 Data... 2 Short instructions on how to use Forex Tester.... 2 Sum up... 3 STRATEGIES... 3 Martingale strategies... 3 Strategy #1. Martingale Grid & Hedging... 4 Buy rules:...
Weekly Currency Review
 Weekly Currency Review Black Swan Forex 21 August 2016 Summary Daily Chart View US $ INDEX [last 95.51/% Chg -1.3%] pg. 2 Two plausible scenarios are in play: 1) Major Wave IV bottom is in place at 91.91
Market Observations - as of Sep 28, 2018
 Market Observations - as of Sep 28, 2018 By Carl Jorgensen - For Objective Traders - For educational purposes only. Not Financial Advice. The month week, month and quarter ended with not much change in
6 TRADE SETUPS YOU CAN START USING RIGHT NOW. includes: Ryan's top charting patterns
 6 TRADE SETUPS YOU CAN START USING RIGHT NOW includes: Ryan's top charting patterns SharePlanner's Top Setups for TRADING LONG & SHORT Far too often we clutter our trading strategy with hundreds of different