Forex Sentiment Report Q2 FORECAST WEAK AS LONG AS BELOW April
|
|
|
- Justina Turner
- 5 years ago
- Views:
Transcription
1 Forex Sentiment Report 08 April Q2 FORECAST WEAK AS LONG AS BELOW Targets on a break of /35: / / /35 Targets on a break of /70: /50 The EURUSD pair sold off sharply in the previous quarter, recording a loss of almost 12.74%. January s opening price was and closing price for March was Over the past three months, the overall sentiment has deteriorated significantly. On the monthly and quarterly charts, the pair has breached below its long term SMA s, posting a close below its lower Bollinger band. A break below the descending triangle pattern formed on the monthly time frame since July
2 2008 shows a likely continuation of the bearish drift in the euro. Bulls seem to have lost control with the monthly and quarterly momentum indicators, reflecting a bearish technical picture. Quarterly RSI is heading south below the 40 line, while MACD has witnessed a negative crossover, further endorsing weakness in the coming months. Monthly and Quarterly stochastic suggests there is still room left to the downside despite placed in the oversold territory. Overextended trading of the weekly stochastic in the oversold region indicates at a possibility of mild recovery over short term basis. Moreover, emerging signs of a mild positive divergence condition on the weekly RSI further hints that a bounce in the pair is likely in the coming weeks. However, overall sentiment would remain bearish as long as the pair is trading below the /00 level. On the bright side, taking of February s high at level should lessen the bearish pressure. Above that, the next technical obstacle resides at around /75, followed by the crucial one at /35.The ability to break above the latter would prove to be bullish hinting that sentiment is improving and further gains would target / zone. On the downside, key support is seen at around /70, selling through which would lead to further acceleration to the downside with the next potential downside target situated in the zone, followed by the crucial one at /50.

3 Q2 FORECAST WEAK AS LONG AS BELOW
4 Targets on a break of : / / /40 Targets on a break of /14: / / /55 The GBPUSD pair ended in red for the third consecutive quarter, forming a long bearish candlestick pattern on the quarterly chart, recording a loss of almost 5.00%. The uptrend support line formed on the monthly chart since January 2009 offered enough support to the pair till December However, GBPUSD witnessed a break below the same in January after which bearishness continued in the following months. Although the pair attempted to regain its lost grounds in February, the psychological acted as a key technical hurdle, restricting further recovery. In March, the pair sold off sharply, breaching below the /14 level (2013 low) to make a fresh low for the year at , before ending higher at On the quarterly chart, RSI is heading south below the 40 line, while MACD and stochastic are also trading with a bearish tone below their midlines reflecting the presence of bearish momentum. Also on the monthly chart, the MACD indicator is attempting to crossover negatively and RSI is pointing lower below the 40 line further endorsing a weak technical picture. As of now, the near term resistance is situated at level and long as the pair is trading below the same overall bias would remain bearish. Meanwhile, continued trading below the /14 level would trigger further acceleration to the downside with the /35 as the next potential target, followed by the next at /70 and /55 levels. If the latter fails to hold, it would push the pair towards the /50 and levels. On the upside, a surge through the psychological level, should be a bullish signal that sentiment is improving and further gains would target level, stability above which might clear the way for and levels, followed by the crucial one at /
5
6 Q2 FORECAST KEY TECHNICAL OBSTACLE AT Targets on a break of : / / /05 Targets on a break of /60: / / The USDJPY pair oscillated between gains and losses in the previous quarter, forming a doji candlestick pattern on the quarterly chart. As mentioned in the earlier view, the psychological level acted as a key technical obstacle. After making several failed attempts in the month of January and February, the pair finally managed to post a monthly close above at in March. On the quarterly chart, the MACD indicator has crossed above its centreline to trade into the positive territory, while RSI and stochastic indicators are also placed at a higher level above their midlines, reflecting the presence of bullish momentum. The tone of the market in the coming weeks will however be determined by traders reaction to level. Sellers will either take this level out with conviction, or buyers will come in to defend it. On the monthly chart, the price action is reflecting consolidation, suggesting that the current uptrend is slightly losing steam with expectations of a possible correction ahead in the short term. Emerging signs of negative divergence condition on the weekly MACD and RSI further endorses the above view. Since November 2012, the pair has remained inside a broadly bullish pattern signalling that long term sentiment is improving and investors are buying dips. Overall, as long as the pair is trading above the psychological level, the sentiment would remain positive with an immediate upside target situated at around /124.14, followed by the next at / (which is likely to be resistive). The sustained break above the same would trigger further acceleration to the upside. On the downside, a move back below would negate any bullishness, reflecting negative momentum in the coming weeks with the /30 and /80 as the immediate supports. A breach below the latter might further accelerate the downside movement with the next potential downside target at

7 around (November 2014 low).
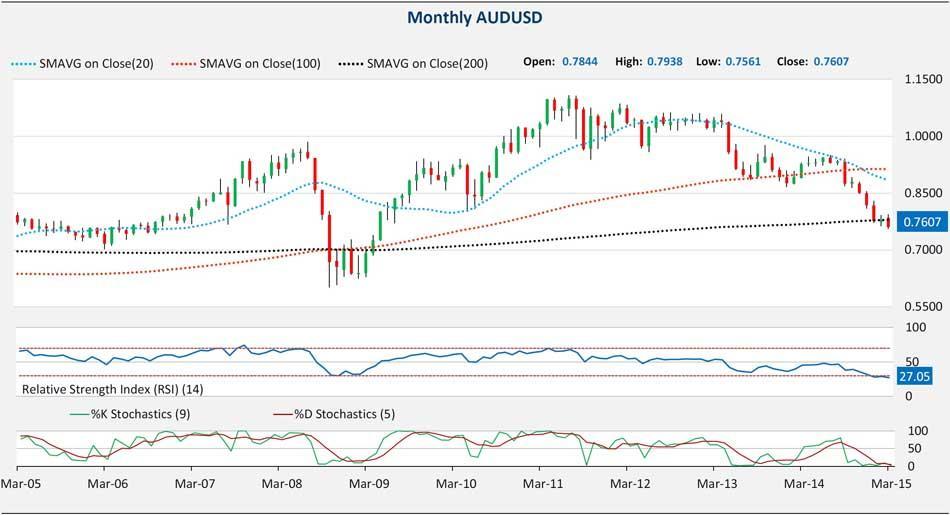
8 Q2 FORECAST WEAK AS LONG AS BELOW /00 Targets on a break of : / / /60 Targets on a break of : / / /00 The AUDUSD pair recorded losses for the third consecutive quarter, forming a long bearish candle on the quarterly chart. The pair broke sharply at the end of January, breaching below its 200 month SMA after which bearishness continued in the following months. Although the pair recorded slight gains in February, recovery remained capped by the key resistance in the zone. On the quarterly chart, the pair has posted a close below its 100 SMA and lower Bollinger band at after recording a fresh low for the year at Monthly momentum oscillators continue to favour a dominant bearish trend despite placed in the oversold territory. On the quarterly chart, MACD is attempting to crossover negatively, while RSI indicator is placed below the 40 level, suggesting that downside momentum is likely to continue in April. Overextended trading of the weekly stochastic and RSI into the oversold territory along with the emerging signs of mild positive divergence condition hints at a possibility of periodic short-covering rallies and retracements in the coming weeks before the pair resumes the downtrend. Immediate support to be watched is seen at the recent low of , a breach below which might lead to the continuation of the bearish trend with the next potential downside target at around /0.7190, which if fails to hold might push the pair lower towards the psychological level. On the upside, the key resistance to be watched resides at around The ability to capture this level could trigger further acceleration to the upside with /70 as the next potential target, followed by / and /60 levels.
9
10 Q2 FORECAST WEAK BELOW /70 Targets on a break of : /50 Targets on a break of /50: / / /12 The USDCAD pair started the year trading sharply higher, forming a long bullish candlestick pattern on the monthly chart in January. The psychological level acted as a crucial resistance that restricted further upside movement. After a gain of almost 10.00% in January, the pair consolidated in the following months. Despite its several attempts to gain stability above the level, the pair failed as the key level continued to stand tall. Although the pair hit the level in March, it retreated towards the end of the month to close lower at As of now, on the weekly chart, positive momentum levels have fallen, warning that buying interest is weakening. Weekly price action is reflecting consolidation along with overbought trading conditions suggesting a possibility of a correction in the short term. Emerging signs of negative divergence condition on the weekly RSI further endorses the above view. Since January 2015 end, the pair has been trapped inside a sideways trading range of / on the weekly chart. A clear break and stability on either side of this range can help to determine a proper direction of the pair in the near term. A break on the downside is likely to target the 200 month SMA (currently placed at around /90), which if fails to hold might provoke another leg downwards towards /30 level, followed by the next important support in the zone. Meanwhile, if the pair manages a convincing break above the level, potential is for further gains with a possibility of testing and levels (last tested in March 2009). A break above the latter would trigger further acceleration to the upside.
11
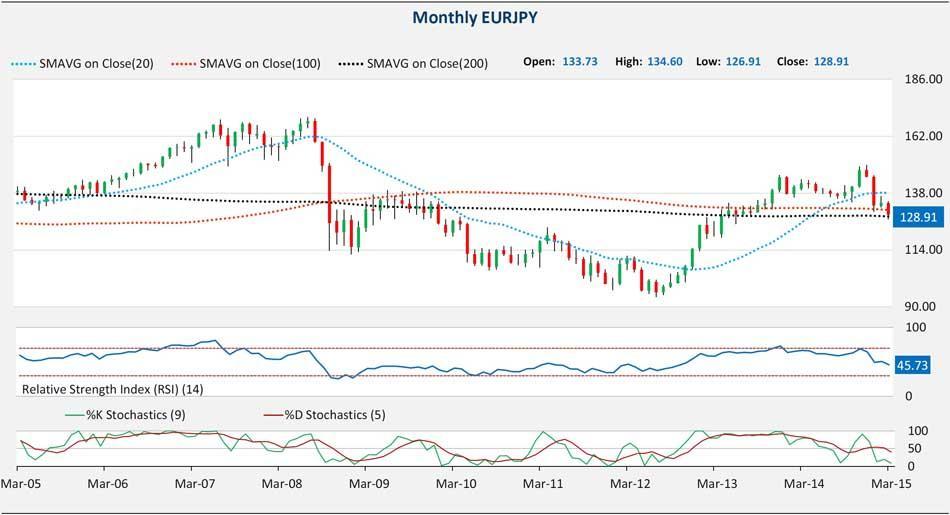
12 Q2 FORECAST KEY SUPPORT AT Targets on a break of /20: / /05 Targets on a break of : / /50 The EURJPY pair sold off sharply in the previous quarter, recording a loss of almost 12.40%. The pair has recorded a bearish engulfing candlestick pattern on the quarterly chart after a breach below its 50 and 100 quarterly SMA s. Although the candlestick formed suggests at continued bearishness in the coming months, the quarterly MACD and RSI are tranquil in line with their centrelines, suggesting a neutral technical outlook. After the formation of a shooting star candlestick pattern on the monthly chart in December 2014, the pair reversed its trend leading to continued weakness in the following months. In March, the pair breached below its 100 and 200 month SMA s to make a fresh low for the year at The pair however recovered slightly to close just above its 200 month SMA at Loss of upward potential of the monthly momentum indicators hints at possible weakness. However, as long as the pair is trading above the 200 month SMA (currently placed at around ), potential is for a possible recovery. A breach below on a weekly closing basis would be a bearish signal that sentiment is deteriorating. The potential downside target is situated at around /50, which if fails to hold might lead to increased selling. Immediate resistance is seen at around /20, a move back and stability above the same might negate near term bearishness with the next technical hurdles at around / and levels. A break above the latter on a monthly closing basis might lead to further gains with the /05 and /25 as the next potential upside targets, followed by /
13
14 Q2 FORECAST SIDEWAYS Targets on a break of 1260: 1307/ / /1400 Targets on a break of 1200: 1140/ / /00 The yellow metal started the quarter with a bullish tone, hitting the $ level in January, however was unable to sustain at higher levels, retreating in the following months to end the quarter below the crucial $1200 level at $ After the formation of a doji candlestick on the quarterly chart in Q4 2014, the commodity has formed a shooting star candlestick pattern in the previous quarter hinting at extended indecision. Since the end of 2013, the price action on the quarterly chart has been sideways along with the RSI indicator trading flat in line with its centreline reflecting a neutral technical view. The monthly RSI and MACD indicators are also tranquil just below their midlines, further endorsing the above view. Key support to be watched resides at around $1125 and resistance is situated at the $1307/10 level. A clear break and stability on either side would help to determine a proper near term direction of the metal. On the weekly chart, the metal is currently attempting to regain upward momentum; however stability above the psychological $1200 level is required to confirm bullishness. The next technical obstacle resides in the $1273-$1282 zone, followed by the $1307/10 level. The ability to capture the latter on a monthly closing basis would bring in further strength with a possibility of targeting $1357/60 and $1390/$1400 levels. On the flipside, trading below $1200 level would keep the overall bias to the downside with a possibility of retesting the $1125-$1110 zone, followed by $1045/36 and $1005/00 levels.
15
16 This communication is intended solely for the person or entity to whom it is addressed. Such person or entity is prohibited from disseminating, distributing, transmitting or forwarding this communication to any other person or entity. This communication may not be used in whole or in part by any person or entity which it was not originally directed to by ADS Securities LLC ( ADSS, us or we ). Trading foreign exchange, foreign exchange options, foreign exchange forwards, contracts for difference, bullion and other over-the-counter products carries a high level of risk and may not be suitable for all investors. All opinions, news, analysis, prices or other information contained in this communication are provided as general market commentary and does not constitute investment advice, nor a solicitation or recommendation for you to buy or sell any over-the-counter product or other financial instrument. Further, this information has been prepared without regard to any specific investment objectives or financial position (including deposit size, leverage, risk appetite and risk exposure) of any specific person. Any reference to historical price movements is informational and based on our analysis. We do not represent or warranty that any such movements are likely to occur in the future, as past performance is not necessarily indicative of future results. While we believe the information contained herein to be reliable, we do not guarantee its accuracy or completeness. You understand that we do not produce the information with the intent of impacting your investment decisions, therefore, you release us from any liability for any losses, including without limitation, any loss of profit you may incur as a result of reliance on such information or entering into any transaction. By receiving this material, you confirm and agree that you have read, received and understood ADSS s Risk Disclosure.
INTERMEDIATE EDUCATION GUIDE
 INTERMEDIATE EDUCATION GUIDE CONTENTS Key Chart Patterns That Every Trader Needs To Know Continution Patterns Reversal Patterns Statistical Indicators Support And Resistance Fibonacci Retracement Moving
14 th November General Outlook. Ian Copsey
 2006 General Outlook The Dollar is higher across the board and looks generally positive for one more rally to marginal new highs at least. The 1.2745 EURUSD, 1.2523 USDCHF and 1.8925-45 GBPUSD areas all
Technical Analysis Workshop Series. Session Six 1, 2, 3 Price-Bars Patterns
 Technical Analysis Workshop Series Session Six 1, 2, 3 Price-Bars Patterns DISCLOSURES & DISCLAIMERS This research material has been prepared by NUS Invest. NUS Invest specifically prohibits the redistribution
IMV Commodity: Agro Technical Update
 IMV Commodity: Agro Technical Update From Research Desk In July future: Soya bean Rmseed Castor seed Guar seed Jeera Dhaniya Turmeric (Follow-up update) Cotton Seed Oil Cotton IMV Commodity Research Desk
In the Charts Forex. Today s key points. CROSS ASSET TECHNICAL ANALYSIS 01 October 2013
 CROSS ASSET TECHNICAL ANALYSIS 01 October 2013 In the Charts Forex Today s key points EUR/USD has given a break above the weekly channel resistance of 1.3454/20 which also happens to be 76.4% retracement
CMS Prime DAILY MARKET REPORT
 CMS Prime DAILY MARKET REPORT May 14, 2018 EURUSD BULLISH BIAS long position at 1.1960 with SL : 1.1925 and with targets at 1.1990 and 1.2020 short position at 1.1925 with SL : 1.1970 and with targets
Chapter 2.3. Technical Analysis: Technical Indicators
 Chapter 2.3 Technical Analysis: Technical Indicators 0 TECHNICAL ANALYSIS: TECHNICAL INDICATORS Charts always have a story to tell. However, from time to time those charts may be speaking a language you
2,864. P/E Multiple (x) 2,830 2,795 2,761 2,727
 2,830 2,795 2,761 2,727") 3-Aug 3-Sep 5-Sep 9-Sep 11-Sep 16-Sep 18-Sep 2-Sep 24-Sep 26-Sep 3-Sep 2-Oct 3 October 218 Daman Morning Call GCC MarketWatch UAE Indices Last Close 1D 1D % YTD% 1M % 1Y % P/E Multiple (x) 2,864 5,19 Abu
3-Aug 3-Sep 5-Sep 9-Sep 11-Sep 16-Sep 18-Sep 2-Sep 24-Sep 26-Sep 3-Sep 2-Oct 3 October 218 Daman Morning Call GCC MarketWatch UAE Indices Last Close 1D 1D % YTD% 1M % 1Y % P/E Multiple (x) 2,864 5,19 Abu
Introduction. Technicians (also known as quantitative analysts or chartists) usually look at price, volume and psychological indicators over time.
 usually look at price, volume and psychological indicators over time.") Technical Analysis Introduction Technical Analysis is the study of market action, primarily through the use of charts, for the purpose of forecasting future price trends. Technicians (also known as quantitative
Technical Analysis Introduction Technical Analysis is the study of market action, primarily through the use of charts, for the purpose of forecasting future price trends. Technicians (also known as quantitative
2,966. P/E Multiple (x) 2,922 2,878 2,833 2,789
 2,922 2,878 2,833 2,789") 1-Aug 5-Aug 7-Aug 9-Aug 13-Aug 15-Aug 19-Aug 27-Aug 29-Aug 2-Sep 4-Sep 6-Sep 9 September 218 Daman Morning Call GCC MarketWatch UAE Indices Last Close 1D 1D % YTD% 1M % 1Y % P/E Multiple (x) 2,966 5,12
1-Aug 5-Aug 7-Aug 9-Aug 13-Aug 15-Aug 19-Aug 27-Aug 29-Aug 2-Sep 4-Sep 6-Sep 9 September 218 Daman Morning Call GCC MarketWatch UAE Indices Last Close 1D 1D % YTD% 1M % 1Y % P/E Multiple (x) 2,966 5,12
2,993. P/E Multiple (x) 2,946 2,899 2,851 2,804
 2,946 2,899 2,851 2,804") 16-Jul 18-Jul 22-Jul 24-Jul 26-Jul 3-Jul 1-Aug 5-Aug 7-Aug 9-Aug 13-Aug 15-Aug 16 August 218 Daman Morning Call GCC MarketWatch UAE Indices Last Close 1D 1D % YTD% 1M % 1Y % P/E Multiple (x) 2,993 4,95
16-Jul 18-Jul 22-Jul 24-Jul 26-Jul 3-Jul 1-Aug 5-Aug 7-Aug 9-Aug 13-Aug 15-Aug 16 August 218 Daman Morning Call GCC MarketWatch UAE Indices Last Close 1D 1D % YTD% 1M % 1Y % P/E Multiple (x) 2,993 4,95
Introduction. Technical analysis is the attempt to forecast stock prices on the basis of market-derived data.
 Technical Analysis Introduction Technical analysis is the attempt to forecast stock prices on the basis of market-derived data. Technicians (also known as quantitative analysts or chartists) usually look
2,584. P/E Multiple (x) 2,556 2,528 2,500 2,472
 2,556 2,528 2,500 2,472") 17-Jan 21-Jan 23-Jan 27-Jan 29-Jan 31-Jan 4-Feb 6-Feb 1-Feb 12-Feb 14-Feb 18-Feb 19 February 219 Daman Morning Call GCC MarketWatch UAE Indices Last Close 1D 1D % YTD% 1M % 1Y % P/E Multiple (x) 2,584
17-Jan 21-Jan 23-Jan 27-Jan 29-Jan 31-Jan 4-Feb 6-Feb 1-Feb 12-Feb 14-Feb 18-Feb 19 February 219 Daman Morning Call GCC MarketWatch UAE Indices Last Close 1D 1D % YTD% 1M % 1Y % P/E Multiple (x) 2,584
SXXP and SX5E nearing their downtrends. Gold remains a short in line with the trend. Dollar index at key support. EURUSD bearish candle
 Andy Dodd MSTA - +44 020 7031 4651 adodd@louiscapital.com Twitter : @louiscaptech SXXP and SX5E nearing their downtrends. Gold remains a short in line with the trend Dollar index at key support EURUSD
2,864. P/E Multiple (x) 2,823 2,782 2,741 2,699
 2,823 2,782 2,741 2,699") 25-Sep 27-Sep 1-Oct 3-Oct 7-Oct 9-Oct 11-Oct 15-Oct 17-Oct 21-Oct 23-Oct 25-Oct 28 October 218 Daman Morning Call GCC MarketWatch UAE Indices Last Close 1D 1D % YTD% 1M % 1Y % P/E Multiple (x) 2,864 5,46
25-Sep 27-Sep 1-Oct 3-Oct 7-Oct 9-Oct 11-Oct 15-Oct 17-Oct 21-Oct 23-Oct 25-Oct 28 October 218 Daman Morning Call GCC MarketWatch UAE Indices Last Close 1D 1D % YTD% 1M % 1Y % P/E Multiple (x) 2,864 5,46
3,558. P/E Multiple (x) 3,511 3,463 3,415 3,367
 3,511 3,463 3,415 3,367") 11-Apr 13-Apr 17-Apr 19-Apr 23-Apr 25-Apr 27-Apr 1-May 3-May 7-May 9-May 11-May 14 May 217 Daman Morning Call GCC MarketWatch UAE Indices Last Close 1D 1D % YTD% 1M % 1Y % P/E Multiple (x) 3,558 4,64 Abu
11-Apr 13-Apr 17-Apr 19-Apr 23-Apr 25-Apr 27-Apr 1-May 3-May 7-May 9-May 11-May 14 May 217 Daman Morning Call GCC MarketWatch UAE Indices Last Close 1D 1D % YTD% 1M % 1Y % P/E Multiple (x) 3,558 4,64 Abu
Weekly outlook for April 30 May
 Weekly outlook for April 30 May 4 2018 Summary The S&P500 index is having trouble deciding if it will rally or decline. This indecision makes trading less profitable. Wait for a break-out direction to
2,612. P/E Multiple (x) 2,571 2,530 2,489 2,448
 2,571 2,530 2,489 2,448") 12-Dec 16-Dec 18-Dec 2-Dec 24-Dec 26-Dec 3-Dec 2-Jan 6-Jan 8-Jan 1-Jan 14-Jan 15 January 219 Daman Morning Call GCC MarketWatch UAE Indices Last Close 1D 1D % YTD% 1M % 1Y % P/E Multiple (x) 2,612 5,24
12-Dec 16-Dec 18-Dec 2-Dec 24-Dec 26-Dec 3-Dec 2-Jan 6-Jan 8-Jan 1-Jan 14-Jan 15 January 219 Daman Morning Call GCC MarketWatch UAE Indices Last Close 1D 1D % YTD% 1M % 1Y % P/E Multiple (x) 2,612 5,24
2,993. P/E Multiple (x) 2,963 2,932 2,901 2,870
 2,963 2,932 2,901 2,870") 11-Jul 15-Jul 17-Jul 19-Jul 23-Jul 25-Jul 29-Jul 31-Jul 2-Aug 6-Aug 8-Aug 12-Aug 13 August 218 Daman Morning Call GCC MarketWatch UAE Indices Last Close 1D 1D % YTD% 1M % 1Y % P/E Multiple (x) 2,993 4,95
11-Jul 15-Jul 17-Jul 19-Jul 23-Jul 25-Jul 29-Jul 31-Jul 2-Aug 6-Aug 8-Aug 12-Aug 13 August 218 Daman Morning Call GCC MarketWatch UAE Indices Last Close 1D 1D % YTD% 1M % 1Y % P/E Multiple (x) 2,993 4,95
3,679. P/E Multiple (x) 3,641 3,603 3,565 3,528
 3,641 3,603 3,565 3,528") 1-Sep 12-Sep 14-Sep 18-Sep 2-Sep 24-Sep 26-Sep 28-Sep 2-Oct 4-Oct 8-Oct 1-Oct 11 October 217 Daman Morning Call GCC MarketWatch UAE Indices Last Close 1D 1D % YTD% 1M % 1Y % P/E Multiple (x) 3,679 4,54
1-Sep 12-Sep 14-Sep 18-Sep 2-Sep 24-Sep 26-Sep 28-Sep 2-Oct 4-Oct 8-Oct 1-Oct 11 October 217 Daman Morning Call GCC MarketWatch UAE Indices Last Close 1D 1D % YTD% 1M % 1Y % P/E Multiple (x) 3,679 4,54
3,744. P/E Multiple (x) 3,686 3,628 3,571 3,513
 3,686 3,628 3,571 3,513") 29-Dec 2-Jan 4-Jan 8-Jan 1-Jan 12-Jan 16-Jan 18-Jan 22-Jan 24-Jan 26-Jan 3-Jan 31 January 217 Daman Morning Call GCC MarketWatch UAE Indices Abu Dhabi Securities Market General Last Close 1D 1D % YTD%
29-Dec 2-Jan 4-Jan 8-Jan 1-Jan 12-Jan 16-Jan 18-Jan 22-Jan 24-Jan 26-Jan 3-Jan 31 January 217 Daman Morning Call GCC MarketWatch UAE Indices Abu Dhabi Securities Market General Last Close 1D 1D % YTD%
FX Daily. Global Strategy Technical Analysis. Today s highlights: Today s trades/positions: Hierarchy Grid
 .8 08 November 2013 Fixed Income Research FX Global Strategy Technical Analysis Today s highlights: EURUSD breaks key price, trendline and 38.2% retracement support at 1.3464/21 to mark a better top, for
2,744. P/E Multiple (x) 2,698 2,652 2,607 2,561
 2,698 2,652 2,607 2,561") 3-Mar 5-Mar 7-Mar 11-Mar 13-Mar 17-Mar 19-Mar 21-Mar 25-Mar 27-Mar 31-Mar 2-Apr 3 April 219 Daman Morning Call GCC MarketWatch UAE Indices Last Close 1D 1D % YTD% 1M % 1Y % P/E Multiple (x) 2,744 5,153
3-Mar 5-Mar 7-Mar 11-Mar 13-Mar 17-Mar 19-Mar 21-Mar 25-Mar 27-Mar 31-Mar 2-Apr 3 April 219 Daman Morning Call GCC MarketWatch UAE Indices Last Close 1D 1D % YTD% 1M % 1Y % P/E Multiple (x) 2,744 5,153
CMS PRIME DAILY MARKET REPORT
 CMS PRIME DAILY MARKET REPORT August 17, 2018 EURUSD long position at 1.1380 with SL : 1.1350 and with targets at 1.1400 and 1.1430 short position at 1.1350 with SL : 1.1400 and with targets at 1.1330
3,591. P/E Multiple (x) 3,551 3,510 3,470 3,430
 3,551 3,510 3,470 3,430") 16-Mar 2-Mar 22-Mar 26-Mar 28-Mar 3-Mar 3-Apr 5-Apr 9-Apr 11-Apr 13-Apr 17-Apr 18 April 217 Daman Morning Call GCC MarketWatch UAE Indices Last Close 1D 1D % YTD% 1M % 1Y % P/E Multiple (x) 3,591 4,664
16-Mar 2-Mar 22-Mar 26-Mar 28-Mar 3-Mar 3-Apr 5-Apr 9-Apr 11-Apr 13-Apr 17-Apr 18 April 217 Daman Morning Call GCC MarketWatch UAE Indices Last Close 1D 1D % YTD% 1M % 1Y % P/E Multiple (x) 3,591 4,664
Weekly outlook for April 23, 2018
 Weekly outlook for April 23, 2018 Summary The S&P 500 index is expected to go down further if price stays below the 2700 level. A weekly doji candle formed on the intermediate-term chart, and the short-term
3,223. P/E Multiple (x) 3,181 3,139 3,097 3,056
 3,181 3,139 3,097 3,056") 12-Mar 14-Mar 18-Mar 2-Mar 22-Mar 26-Mar 28-Mar 1-Apr 3-Apr 5-Apr 9-Apr 11-Apr 12 April 218 Daman Morning Call GCC MarketWatch UAE Indices Abu Dhabi Securities Market General Last Close 1D 1D % YTD% 1M
12-Mar 14-Mar 18-Mar 2-Mar 22-Mar 26-Mar 28-Mar 1-Apr 3-Apr 5-Apr 9-Apr 11-Apr 12 April 218 Daman Morning Call GCC MarketWatch UAE Indices Abu Dhabi Securities Market General Last Close 1D 1D % YTD% 1M
2,830. P/E Multiple (x) 2,797 2,765 2,732 2,699
 2,797 2,765 2,732 2,699") 7-Oct 9-Oct 11-Oct 15-Oct 17-Oct 21-Oct 23-Oct 25-Oct 29-Oct 31-Oct 4-Nov 6-Nov 7 November 218 Daman Morning Call GCC MarketWatch UAE Indices Last Close 1D 1D % YTD% 1M % 1Y % P/E Multiple (x) 2,83 5,46
7-Oct 9-Oct 11-Oct 15-Oct 17-Oct 21-Oct 23-Oct 25-Oct 29-Oct 31-Oct 4-Nov 6-Nov 7 November 218 Daman Morning Call GCC MarketWatch UAE Indices Last Close 1D 1D % YTD% 1M % 1Y % P/E Multiple (x) 2,83 5,46
3,684. P/E Multiple (x) 3,611 3,539 3,466 3,394
 3,611 3,539 3,466 3,394") 24-Oct 26-Oct 3-Oct 1-Nov 5-Nov 7-Nov 9-Nov 13-Nov 15-Nov 19-Nov 21-Nov 23-Nov 26 November 217 Daman Morning Call GCC MarketWatch UAE Indices Abu Dhabi Securities Market General Last Close 1D 1D % YTD%
24-Oct 26-Oct 3-Oct 1-Nov 5-Nov 7-Nov 9-Nov 13-Nov 15-Nov 19-Nov 21-Nov 23-Nov 26 November 217 Daman Morning Call GCC MarketWatch UAE Indices Abu Dhabi Securities Market General Last Close 1D 1D % YTD%
3,745. P/E Multiple (x) 3,710 3,675 3,640 3,606. UAE equity markets closed higher yesterday, lifted by gains in insurance and property sector stocks.
 3,710 3,675 3,640 3,606. UAE equity markets closed higher yesterday, lifted by gains in insurance and property sector stocks.") 9-Jan 11-Jan 15-Jan 17-Jan 19-Jan 23-Jan 25-Jan 29-Jan 31-Jan 2-Feb 6-Feb 8-Feb 9 February 217 Daman Morning Call GCC MarketWatch UAE Indices Abu Dhabi Securities Market General Last Close 1D 1D % YTD%
9-Jan 11-Jan 15-Jan 17-Jan 19-Jan 23-Jan 25-Jan 29-Jan 31-Jan 2-Feb 6-Feb 8-Feb 9 February 217 Daman Morning Call GCC MarketWatch UAE Indices Abu Dhabi Securities Market General Last Close 1D 1D % YTD%
2,993. P/E Multiple (x) 2,942 2,891 2,840 2,789
 2,942 2,891 2,840 2,789") 17-Jul 19-Jul 23-Jul 25-Jul 29-Jul 31-Jul 2-Aug 6-Aug 8-Aug 12-Aug 14-Aug 16-Aug 19 August 218 Daman Morning Call GCC MarketWatch UAE Indices Last Close 1D 1D % YTD% 1M % 1Y % P/E Multiple (x) 2,993 4,95
17-Jul 19-Jul 23-Jul 25-Jul 29-Jul 31-Jul 2-Aug 6-Aug 8-Aug 12-Aug 14-Aug 16-Aug 19 August 218 Daman Morning Call GCC MarketWatch UAE Indices Last Close 1D 1D % YTD% 1M % 1Y % P/E Multiple (x) 2,993 4,95
2,584. P/E Multiple (x) 2,556 2,528 2,500 2,472
 2,556 2,528 2,500 2,472") 14-Jan 16-Jan 2-Jan 22-Jan 24-Jan 28-Jan 3-Jan 3-Feb 5-Feb 7-Feb 11-Feb 13-Feb 14 February 219 Daman Morning Call GCC MarketWatch UAE Indices Last Close 1D 1D % YTD% 1M % 1Y % P/E Multiple (x) 2,584 5,169
14-Jan 16-Jan 2-Jan 22-Jan 24-Jan 28-Jan 3-Jan 3-Feb 5-Feb 7-Feb 11-Feb 13-Feb 14 February 219 Daman Morning Call GCC MarketWatch UAE Indices Last Close 1D 1D % YTD% 1M % 1Y % P/E Multiple (x) 2,584 5,169
Market Update April 20, 2015
 SeattleTA provides investment managers with technical analysis of the equity, fixed-income, commodity, and The forecast for a high on April 15 was spot-on (there s no kill switch on awesome!). The monthly
2,558. P/E Multiple (x) 2,533 2,507 2,481 2,455
 2,533 2,507 2,481 2,455") 24-Dec 26-Dec 3-Dec 2-Jan 6-Jan 8-Jan 1-Jan 14-Jan 16-Jan 2-Jan 22-Jan 24-Jan 27 January 219 Daman Morning Call GCC MarketWatch UAE Indices Last Close 1D 1D % YTD% 1M % 1Y % P/E Multiple (x) 2,558 5,44
24-Dec 26-Dec 3-Dec 2-Jan 6-Jan 8-Jan 1-Jan 14-Jan 16-Jan 2-Jan 22-Jan 24-Jan 27 January 219 Daman Morning Call GCC MarketWatch UAE Indices Last Close 1D 1D % YTD% 1M % 1Y % P/E Multiple (x) 2,558 5,44
DAILY TECHNICAL REPORT MA S-TERM. 27 June, 2012 L-TERM STRATEGY/ POSITION ENTRY LEVEL OBJECTIVES/COMMENTS MULTI-WEEK
 MA S-TERM MULTI-DAY Please note: None of the strategies below represent trading advice or trading recommendations of any kind. Please refer to our full disclaimer. L-TERM OBJECTIVES/COMMENTS STOP MULTI-WEEK
2,864. P/E Multiple (x) 2,829 2,795 2,761 2,727. UAE equity markets ended higher yesterday, lifted by gains in industrial and banking sector stocks.
 2,829 2,795 2,761 2,727. UAE equity markets ended higher yesterday, lifted by gains in industrial and banking sector stocks.") 19-Aug 27-Aug 29-Aug 2-Sep 4-Sep 6-Sep 1-Sep 12-Sep 17-Sep 19-Sep 23-Sep 25-Sep 26 September 218 Daman Morning Call GCC MarketWatch UAE Indices Last Close 1D 1D % YTD% 1M % 1Y % P/E Multiple (x) 2,864
19-Aug 27-Aug 29-Aug 2-Sep 4-Sep 6-Sep 1-Sep 12-Sep 17-Sep 19-Sep 23-Sep 25-Sep 26 September 218 Daman Morning Call GCC MarketWatch UAE Indices Last Close 1D 1D % YTD% 1M % 1Y % P/E Multiple (x) 2,864
PART 3 - CHART PATTERNS & TECHNICAL INDICATORS
 Tyler Chianelli s EASYOPTIONTRADING by OPTION TRADING COACH PART 3 - CHART PATTERNS & TECHNICAL INDICATORS A SIMPLE SYSTEM FOR TRADING OPTIONS WORKS IN UP, DOWN, AND SIDEWAYS MARKETS PART 3.1 - PRIMARY
3,523. P/E Multiple (x) 3,482 3,442 3,401 3,360
 3,482 3,442 3,401 3,360") 17-Apr 19-Apr 23-Apr 25-Apr 27-Apr 1-May 3-May 7-May 9-May 11-May 15-May 17-May 18 May 217 Daman Morning Call GCC MarketWatch UAE Indices Last Close 1D 1D % YTD% 1M % 1Y % P/E Multiple (x) 3,523 4,64 Abu
17-Apr 19-Apr 23-Apr 25-Apr 27-Apr 1-May 3-May 7-May 9-May 11-May 15-May 17-May 18 May 217 Daman Morning Call GCC MarketWatch UAE Indices Last Close 1D 1D % YTD% 1M % 1Y % P/E Multiple (x) 3,523 4,64 Abu
Research Desk StockBroking
 Research Desk StockBroking India ValueMax June 01, 2017 ValueMax Monthly Investment Ideas ValueMax helps clients to take a long stance on stocks from thes&pbse-100 universe. Comprising monthly technical
3,523. P/E Multiple (x) 3,482 3,442 3,401 3,360
 3,482 3,442 3,401 3,360") 18-Apr 2-Apr 24-Apr 26-Apr 3-Apr 2-May 4-May 8-May 1-May 14-May 16-May 18-May 21 May 217 Daman Morning Call GCC MarketWatch UAE Indices Last Close 1D 1D % YTD% 1M % 1Y % P/E Multiple (x) 3,523 4,64 Abu
18-Apr 2-Apr 24-Apr 26-Apr 3-Apr 2-May 4-May 8-May 1-May 14-May 16-May 18-May 21 May 217 Daman Morning Call GCC MarketWatch UAE Indices Last Close 1D 1D % YTD% 1M % 1Y % P/E Multiple (x) 3,523 4,64 Abu
12 th Oct2018. Gold Silver Copper Zinc Lead Aluminium Nickel Crude Oil Natural Gas. Bullion. Base Metal. Energy. Chana. Agro.
 12 th Oct2018 Bullion Base Metal Energy Agro Gold Silver Copper Zinc Lead Aluminium Nickel Crude Oil Natural Gas Chana Soybean Gold prices climbed almost 1.6% up on Thursday, regaining the psychologically
CMS Prime DAILY MARKET REPORT
 CMS Prime DAILY MARKET REPORT May 09, 2018 EURUSD BEARISH BIAS short position at 1.1855 with SL : 1.1900 and with targets at 1.1835 and 1.1800 long position at 1.1900 with SL : 1.1835 and with targets
3,486. P/E Multiple (x) 3,428 3,370 3,312 3,254
 3,428 3,370 3,312 3,254") 25-Jan 29-Jan 31-Jan 4-Feb 6-Feb 8-Feb 12-Feb 14-Feb 18-Feb 2-Feb 22-Feb 26-Feb 27 February 218 Daman Morning Call GCC MarketWatch UAE Indices Abu Dhabi Securities Market General Last Close 1D 1D % YTD%
25-Jan 29-Jan 31-Jan 4-Feb 6-Feb 8-Feb 12-Feb 14-Feb 18-Feb 2-Feb 22-Feb 26-Feb 27 February 218 Daman Morning Call GCC MarketWatch UAE Indices Abu Dhabi Securities Market General Last Close 1D 1D % YTD%
GOLD WTI CRUDE. Friday 10th February 2017
 GOLD Friday 10th February 2017 Gold closed the day with losses after spending the day near the threemonth high posed on Wednesday, weighed by renewed dollar's demand in the US afternoon. Spot closed the
3,576. P/E Multiple (x) 3,478 3,379 3,280 3,181
 3,478 3,379 3,280 3,181") 8-Nov 1-Nov 14-Nov 16-Nov 2-Nov 22-Nov 24-Nov 28-Nov 3-Nov 4-Dec 6-Dec 8-Dec 12 December 216 Daman Morning Call GCC MarketWatch UAE Indices Abu Dhabi Securities Market General* Last Close 1D 1D % YTD%
8-Nov 1-Nov 14-Nov 16-Nov 2-Nov 22-Nov 24-Nov 28-Nov 3-Nov 4-Dec 6-Dec 8-Dec 12 December 216 Daman Morning Call GCC MarketWatch UAE Indices Abu Dhabi Securities Market General* Last Close 1D 1D % YTD%
TECHNICAL REPORT DAILY RESEARCH TEAM. 04 October 2016 DISCLAIMER & DISCLOSURES
 DAILY TECHNICAL REPORT RESEARCH TEAM DISCLAIMER & DISCLOSURES Please read the disclaimer and the disclosures which can be found at the end of this report EUR / USD Monitor the support at 1.1160. EUR/USD
2,853. P/E Multiple (x) 2,815 2,776 2,738 2,699
 2,815 2,776 2,738 2,699") 2-Oct 4-Oct 8-Oct 1-Oct 14-Oct 16-Oct 18-Oct 22-Oct 24-Oct 28-Oct 3-Oct 1-Nov 4 November 218 Daman Morning Call GCC MarketWatch UAE Indices Last Close 1D 1D % YTD% 1M % 1Y % P/E Multiple (x) 2,853 5,46
2-Oct 4-Oct 8-Oct 1-Oct 14-Oct 16-Oct 18-Oct 22-Oct 24-Oct 28-Oct 3-Oct 1-Nov 4 November 218 Daman Morning Call GCC MarketWatch UAE Indices Last Close 1D 1D % YTD% 1M % 1Y % P/E Multiple (x) 2,853 5,46
3,591. P/E Multiple (x) 3,551 3,510 3,470 3,430
 3,551 3,510 3,470 3,430") 21-Mar 23-Mar 27-Mar 29-Mar 2-Apr 4-Apr 6-Apr 1-Apr 12-Apr 16-Apr 18-Apr 2-Apr 23 April 217 Daman Morning Call GCC MarketWatch UAE Indices Last Close 1D 1D % YTD% 1M % 1Y % P/E Multiple (x) 3,591 4,664
21-Mar 23-Mar 27-Mar 29-Mar 2-Apr 4-Apr 6-Apr 1-Apr 12-Apr 16-Apr 18-Apr 2-Apr 23 April 217 Daman Morning Call GCC MarketWatch UAE Indices Last Close 1D 1D % YTD% 1M % 1Y % P/E Multiple (x) 3,591 4,664
2,864. P/E Multiple (x) 2,823 2,782 2,741 2,699
 2,823 2,782 2,741 2,699") 26-Sep 3-Sep 2-Oct 4-Oct 8-Oct 1-Oct 14-Oct 16-Oct 18-Oct 22-Oct 24-Oct 28-Oct 29 October 218 Daman Morning Call GCC MarketWatch UAE Indices Last Close 1D 1D % YTD% 1M % 1Y % P/E Multiple (x) 2,864 5,46
26-Sep 3-Sep 2-Oct 4-Oct 8-Oct 1-Oct 14-Oct 16-Oct 18-Oct 22-Oct 24-Oct 28-Oct 29 October 218 Daman Morning Call GCC MarketWatch UAE Indices Last Close 1D 1D % YTD% 1M % 1Y % P/E Multiple (x) 2,864 5,46
2,697. P/E Multiple (x) 2,663 2,629 2,595 2,561
 2,663 2,629 2,595 2,561") 21-Feb 25-Feb 27-Feb 3-Mar 5-Mar 7-Mar 11-Mar 13-Mar 17-Mar 19-Mar 21-Mar 25-Mar 26 March 219 Daman Morning Call GCC MarketWatch UAE Indices Last Close 1D 1D % YTD% 1M % 1Y % P/E Multiple (x) 2,697 5,178
21-Feb 25-Feb 27-Feb 3-Mar 5-Mar 7-Mar 11-Mar 13-Mar 17-Mar 19-Mar 21-Mar 25-Mar 26 March 219 Daman Morning Call GCC MarketWatch UAE Indices Last Close 1D 1D % YTD% 1M % 1Y % P/E Multiple (x) 2,697 5,178
CMS Prime DAILY MARKET REPORT
 CMS Prime DAILY MARKET REPORT May 1,5 2018 EURUSD BEARISH BIAS short position at 1.1935 with SL : 1.1960 and with targets at 1.1910 and 1.1890 long position at 1.1960 with SL : 1.1910 and with targets
3,639. P/E Multiple (x) 3,587 3,534 3,482 3,430. UAE equity markets closed higher yesterday, lifted by gains in insurance and financial sector stocks.
 3,587 3,534 3,482 3,430. UAE equity markets closed higher yesterday, lifted by gains in insurance and financial sector stocks.") 1-Mar 5-Mar 7-Mar 9-Mar 13-Mar 15-Mar 19-Mar 21-Mar 23-Mar 27-Mar 29-Mar 2-Apr 3 April 217 Daman Morning Call GCC MarketWatch UAE Indices Last Close 1D 1D % YTD% 1M % 1Y % P/E Multiple (x) 3,639 4,627
1-Mar 5-Mar 7-Mar 9-Mar 13-Mar 15-Mar 19-Mar 21-Mar 23-Mar 27-Mar 29-Mar 2-Apr 3 April 217 Daman Morning Call GCC MarketWatch UAE Indices Last Close 1D 1D % YTD% 1M % 1Y % P/E Multiple (x) 3,639 4,627
10-Year Treasury Notes ($UST Price)
") 1 Weekly Inter-market Technical Report 10-Year Treasury Notes ($UST Price) Monthly Continuing from last week's report, bonds (notes) appear to be on a strong buy signal on the monthly chart, as price is
1 Weekly Inter-market Technical Report 10-Year Treasury Notes ($UST Price) Monthly Continuing from last week's report, bonds (notes) appear to be on a strong buy signal on the monthly chart, as price is
Weekly outlook for May 1 May
 Weekly outlook for May 1 May. 5 2017 TREND DIRECTION S&P 500 Oil Gold Short Term Intermediate-Term Long Term strong weak strong strong neutral Strong weak weak weak Summary The S&P500 index is expected
S&P Cash Long Term: Uptrend Intact. Monthly Log Chart
 Andy Dodd MSTA - +44 020 7031 4651 adodd@louiscapital.com Twitter : @louiscaptech S&P Cash Long Term: Uptrend Intact Despite an initial slowdown in momentum following the break above 2120 in July, which
15 th March Gold Silver Copper Zinc Lead Aluminium Nickel Crude Oil Natural Gas Guar seed Castor seed. Bullion. Base Metal. Energy.
 15 th March 2018 Bullion Base Metal Energy Agro Gold Silver Copper Zinc Lead Aluminium Nickel Crude Oil Natural Gas Guar seed Castor seed On the daily chart MCX Gold price has given rising wedge breakdown
17 th Dec Gold Silver Copper Zinc Lead Aluminium Nickel Crude Oil Natural Gas. Bullion. Base Metal. Energy. Jeera. Agro.
 17 th Dec 2018 Bullion Base Metal Energy Agro Gold Silver Copper Zinc Lead Aluminium Nickel Crude Oil Natural Gas Jeera Chana MCX Gold price has moved lower on Friday session. On a weekly chart, price
2,864. P/E Multiple (x) 2,829 2,795 2,761 2,727
 2,829 2,795 2,761 2,727") 16-Aug 26-Aug 28-Aug 3-Aug 3-Sep 5-Sep 9-Sep 11-Sep 16-Sep 18-Sep 2-Sep 24-Sep 25 September 218 Daman Morning Call GCC MarketWatch UAE Indices Abu Dhabi Securities Market General Last Close 1D 1D % YTD%
16-Aug 26-Aug 28-Aug 3-Aug 3-Sep 5-Sep 9-Sep 11-Sep 16-Sep 18-Sep 2-Sep 24-Sep 25 September 218 Daman Morning Call GCC MarketWatch UAE Indices Abu Dhabi Securities Market General Last Close 1D 1D % YTD%
MAGIC FOREX DIVERGENCE Trading Guide
 Tim Trush & Julie Lavrin Introducing MAGIC FOREX DIVERGENCE Trading Guide Your guide to financial freedom. Tim Trush, Julie Lavrin, T&J Profit Club, 2017, All rights reserved www.forexmystery.com Table
3,066. P/E Multiple (x) 3,000 2,934 2,867 2,801
 3,000 2,934 2,867 2,801") 12-Jun 14-Jun 19-Jun 21-Jun 25-Jun 27-Jun 1-Jul 3-Jul 5-Jul 9-Jul 11-Jul 15-Jul 16 July 218 Daman Morning Call GCC MarketWatch UAE Indices Last Close 1D 1D % YTD% 1M % 1Y % P/E Multiple (x) 3,66 4,738
12-Jun 14-Jun 19-Jun 21-Jun 25-Jun 27-Jun 1-Jul 3-Jul 5-Jul 9-Jul 11-Jul 15-Jul 16 July 218 Daman Morning Call GCC MarketWatch UAE Indices Last Close 1D 1D % YTD% 1M % 1Y % P/E Multiple (x) 3,66 4,738
2,790. P/E Multiple (x) 2,733 2,676 2,619 2,561
 2,733 2,676 2,619 2,561") 5-Mar 7-Mar 11-Mar 13-Mar 17-Mar 19-Mar 21-Mar 25-Mar 27-Mar 31-Mar 2-Apr 4-Apr 7 April 219 Daman Morning Call GCC MarketWatch UAE Indices Last Close 1D 1D % YTD% 1M % 1Y % P/E Multiple (x) 2,79 5,153
5-Mar 7-Mar 11-Mar 13-Mar 17-Mar 19-Mar 21-Mar 25-Mar 27-Mar 31-Mar 2-Apr 4-Apr 7 April 219 Daman Morning Call GCC MarketWatch UAE Indices Last Close 1D 1D % YTD% 1M % 1Y % P/E Multiple (x) 2,79 5,153
3,477. P/E Multiple (x) 3,434 3,391 3,348 3,306
 3,434 3,391 3,348 3,306") 6-Jun 8-Jun 12-Jun 14-Jun 18-Jun 2-Jun 22-Jun 29-Jun 3-Jul 5-Jul 9 July 217 Daman Morning Call GCC MarketWatch UAE Indices Last Close 1D 1D % YTD% 1M % 1Y % P/E Multiple (x) 3,477 4,56 Abu Dhabi Securities
6-Jun 8-Jun 12-Jun 14-Jun 18-Jun 2-Jun 22-Jun 29-Jun 3-Jul 5-Jul 9 July 217 Daman Morning Call GCC MarketWatch UAE Indices Last Close 1D 1D % YTD% 1M % 1Y % P/E Multiple (x) 3,477 4,56 Abu Dhabi Securities
3,591. P/E Multiple (x) 3,547 3,502 3,458 3,414
 3,547 3,502 3,458 3,414") 23-Mar 27-Mar 29-Mar 2-Apr 4-Apr 6-Apr 1-Apr 12-Apr 16-Apr 18-Apr 2-Apr 24-Apr 25 April 217 Daman Morning Call GCC MarketWatch UAE Indices Last Close 1D 1D % YTD% 1M % 1Y % P/E Multiple (x) 3,591 4,664
23-Mar 27-Mar 29-Mar 2-Apr 4-Apr 6-Apr 1-Apr 12-Apr 16-Apr 18-Apr 2-Apr 24-Apr 25 April 217 Daman Morning Call GCC MarketWatch UAE Indices Last Close 1D 1D % YTD% 1M % 1Y % P/E Multiple (x) 3,591 4,664
DAILY TECHNICAL REPORT
 RESEARCH TEAM DAILY TECHNICAL REPORT DISCLAIMER & DISCLOSURES Please read the disclaimer and the disclosures which can be found at the end of this report EUR / USD Grinding higher. EUR/USD continues its
In the Charts Forex. Today s key points. CROSS ASSET TECHNICAL ANALYSIS 15 October 2013
 CROSS ASSET TECHNICAL ANALYSIS 15 October 2013 FOREX In the Charts Forex Coordinator Global Technicals Stephanie Aymes (44) 207 762 5898 stephanie.aymes@sgcib.com Kusal Kansara (91) 80 2802 4551 kusal.kansara@sgcib.com
Monthly Dairy Technical Commentary August 19, 2015
 Monthly Dairy Technical Commentary August 19, 2015 CME Class III Milk Futures Range contraction continues for Class III Milk as it continues to correct the September 2014 through January 2015 downdraft.
2,697. P/E Multiple (x) 2,663 2,629 2,595 2,561
 2,663 2,629 2,595 2,561") 2-Feb 24-Feb 26-Feb 28-Feb 4-Mar 6-Mar 1-Mar 12-Mar 14-Mar 18-Mar 2-Mar 24-Mar 25 March 219 Daman Morning Call GCC MarketWatch UAE Indices Last Close 1D 1D % YTD% 1M % 1Y % P/E Multiple (x) 2,697 5,178
2-Feb 24-Feb 26-Feb 28-Feb 4-Mar 6-Mar 1-Mar 12-Mar 14-Mar 18-Mar 2-Mar 24-Mar 25 March 219 Daman Morning Call GCC MarketWatch UAE Indices Last Close 1D 1D % YTD% 1M % 1Y % P/E Multiple (x) 2,697 5,178
S&P Cash Long Term: Uptrend Intact. Monthly Log Chart
 Andy Dodd MSTA - +44 020 7031 4651 adodd@louiscapital.com Twitter : @louiscaptech S&P Cash Long Term: Uptrend Intact Despite an initial slowdown in momentum following the break above 2120 in July, which
3,591. P/E Multiple (x) 3,543 3,494 3,446 3,398
 3,543 3,494 3,446 3,398") 3-Mar 3-Apr 5-Apr 9-Apr 11-Apr 13-Apr 17-Apr 19-Apr 23-Apr 25-Apr 27-Apr 1-May 2 May 217 Daman Morning Call GCC MarketWatch UAE Indices Last Close 1D 1D % YTD% 1M % 1Y % P/E Multiple (x) 3,591 4,664 Abu
3-Mar 3-Apr 5-Apr 9-Apr 11-Apr 13-Apr 17-Apr 19-Apr 23-Apr 25-Apr 27-Apr 1-May 2 May 217 Daman Morning Call GCC MarketWatch UAE Indices Last Close 1D 1D % YTD% 1M % 1Y % P/E Multiple (x) 3,591 4,664 Abu
3,675. P/E Multiple (x) 3,604 3,533 3,462 3,391
 3,604 3,533 3,462 3,391") 5-Dec 7-Dec 11-Dec 13-Dec 15-Dec 19-Dec 21-Dec 25-Dec 27-Dec 29-Dec 2-Jan 4-Jan 5 January 217 Daman Morning Call GCC MarketWatch UAE Indices Abu Dhabi Securities Market General Last Close 1D 1D % YTD%
5-Dec 7-Dec 11-Dec 13-Dec 15-Dec 19-Dec 21-Dec 25-Dec 27-Dec 29-Dec 2-Jan 4-Jan 5 January 217 Daman Morning Call GCC MarketWatch UAE Indices Abu Dhabi Securities Market General Last Close 1D 1D % YTD%
CMT LEVEL I CURRICULUM Self-Evaluation
 CMT LEVEL I CURRICULUM Self-Evaluation DEAR CFA CHARTERHOLDER, As a CFA charterholder, the requirement that you sit for the CMT Level I exam is waived. However, the content in the CMT Level I Curriculum
TRADE ANALYSIS. August 2017 Performance
 EUR/AUD SHORT Entry Date 01/08/2017 Entry point 1.4930 Stop-Loss 1.4980 Risk-Reward Ratio 14 Target 1.4230 As indicated on the chart we can see that the pair previously reversed to the downside between
On Our Technical Watch
 By the Kenanga Research Team l research@kenanga.com.my Figure 1: Daily Charting FBMKLCI Basic Data Technical Ratings 52-week High 1,729.13 (in Million) 52-week Low 1,600.92 KLCI Vol 99.25 Current Level
2,697. P/E Multiple (x) 2,641 2,585 2,529 2,472
 2,641 2,585 2,529 2,472") 7-Feb 11-Feb 13-Feb 17-Feb 19-Feb 21-Feb 25-Feb 27-Feb 3-Mar 5-Mar 7-Mar 11-Mar 12 March 219 Daman Morning Call GCC MarketWatch UAE Indices Last Close 1D 1D % YTD% 1M % 1Y % P/E Multiple (x) 2,697 5,178
7-Feb 11-Feb 13-Feb 17-Feb 19-Feb 21-Feb 25-Feb 27-Feb 3-Mar 5-Mar 7-Mar 11-Mar 12 March 219 Daman Morning Call GCC MarketWatch UAE Indices Last Close 1D 1D % YTD% 1M % 1Y % P/E Multiple (x) 2,697 5,178
INDEX. Recap and outlook. US Dollar. Japanese Yen. Euro. British Pound. Summary
 FOREX MONTHLY NOVEMBER 2017 1 INDEX Recap and outlook US Dollar Japanese Yen Euro British Pound Summary 1 2 4 6 8 10 2 Recap and outlook The US Dollar performed well in October 2017 as it outpaced other
ADS Securities Market Strategy. 2013: The Year To Be Just a Moving Average Trader
 ADS Securities Market Strategy Prepared by Max Knudsen, Chief Market Strategist 18 th December 2013 2013: The Year To Be Just a Moving Average Trader With close to 3000 economic data release, 60 central
3,744 3,709 3,675 3,640 3,606. UAE equity markets closed higher yesterday, lifted by gains in real estate and financial sector stocks.
 7 February 217 Daman Morning Call 1.19% 11.84 UAE DFM Index 3691.34 43.43 1.19% 4.54%.2% 21.53% 12.34 65.4.27.41%.28%.52% 15.4% 15.18 13.89 1.35.1% 6.59% 7.53% 1.54% 9.34 671.73 14.81.22% 16.59% 13.66%
Technical Analysis. Dealing Room Peter Leonidou. Peter Leonidou
 Technical Analysis Dealing Room Questions Traders Should Ask What is the trend? What is the pivot point? What is the support levels? What is the resistance levels? Strong or weaker USD? What 1. Trade
Chapter 2.3. Technical Indicators
 1 Chapter 2.3 Technical Indicators 0 TECHNICAL ANALYSIS: TECHNICAL INDICATORS Charts always have a story to tell. However, sometimes those charts may be speaking a language you do not understand and you
Weekly outlook for Nov. 27 Dec
 Weekly outlook for Nov. 27 Dec. 1 2017 Summary For the ES we expect a minor pullback in the early part of the week, followed by a rally into the weekly close. There are four option expirations this week
DAILY TECHNICAL REPORT
 RESEARCH TEAM DAILY TECHNICAL REPORT DISCLAIMER & DISCLOSURES Please read the disclaimer and the disclosures which can be found at the end of this report EUR / USD Declining sharply. EUR/USD has broken
CHARTS. Bar Line Candlestick Charts are the basis of technical analysis They are a graphic display of price action. Notes:
 TECHNICAL ANALYSIS CHARTS Bar Line Candlestick Charts are the basis of technical analysis They are a graphic display of price action Candlestick charts have become the industry standard for technical traders.
3,477. P/E Multiple (x) 3,433 3,389 3,345 3,301
 3,433 3,389 3,345 3,301") 5-Jun 7-Jun 11-Jun 13-Jun 15-Jun 19-Jun 21-Jun 28-Jun 2-Jul 4-Jul 6 July 217 Daman Morning Call GCC MarketWatch UAE Indices Last Close 1D 1D % YTD% 1M % 1Y % P/E Multiple (x) 3,477 4,56 Abu Dhabi Securities
5-Jun 7-Jun 11-Jun 13-Jun 15-Jun 19-Jun 21-Jun 28-Jun 2-Jul 4-Jul 6 July 217 Daman Morning Call GCC MarketWatch UAE Indices Last Close 1D 1D % YTD% 1M % 1Y % P/E Multiple (x) 3,477 4,56 Abu Dhabi Securities
Lighting the Way: Using Candlestick Patterns. The Art & Science of Active Trend Trading
 Lighting the Way: Using Candlestick Patterns The Art & Science of Active Trend Trading Disclaimer U.S. Government Required Disclaimer Commodity Futures Trading Commission Futures and Options trading has
TOP ECONOMIC EVENTS OF THE DAY
 OCTOBER 4, 2018 TOP ECONOMIC EVENTS OF THE DAY TIME CURRENCY EVENT EXPECTED PREVIOUS CONSENSUS IMPACT 7:00AM UCT+5:30 AUD Balance of Trade AUG A$1.3B A$1.551B A$1.4B NEGATIVE FOR AUD NEGATIVE FOR GOLD
SXXP *351.51* Key Resistance
 Andy Dodd MSTA - +44 020 7031 4651 adodd@louiscapital.com Twitter : @louiscaptech Equity Index Technical Dashboard The table below is intended as an easy to read reference of key levels and trends. For
2,993. P/E Multiple (x) 2,953 2,913 2,873 2,833
 2,953 2,913 2,873 2,833") 12-Jul 16-Jul 18-Jul 22-Jul 24-Jul 26-Jul 3-Jul 1-Aug 5-Aug 7-Aug 9-Aug 13-Aug 14 August 218 Daman Morning Call GCC MarketWatch UAE Indices Last Close 1D 1D % YTD% 1M % 1Y % P/E Multiple (x) 2,993 4,95
12-Jul 16-Jul 18-Jul 22-Jul 24-Jul 26-Jul 3-Jul 1-Aug 5-Aug 7-Aug 9-Aug 13-Aug 14 August 218 Daman Morning Call GCC MarketWatch UAE Indices Last Close 1D 1D % YTD% 1M % 1Y % P/E Multiple (x) 2,993 4,95
Last Gasp in the Dollar. Market Update May 18, Seattle Technical Advisors
 SeattleTA provides investment managers with technical analysis of the equity, fixed-income, commodity, and currency markets. While equities are expected to take a hit this week, the big news is expected
Monthly Dairy Technical Commentary Thursday September 5, 2013
 Monthly Dairy Technical Commentary Thursday September 5, 2013 CME Class III Milk Futures The weekly price trend for Class III Milk points down from its August 2011 high, and the latest breakdown below
Global Market Overview
 ASIA E.U U.S.A Global Market Overview Friday 29 June 2018 Indian Rupee hit hard by Oil prices that are currently at a three-and-half year high. BoJ reduced purchases of Japanese Government Bonds (JGBs)
Gold Outlook. Bear bug hits gold!!! CMP - $1150. ICICI Securities Ltd. Retail Equity Research. November 5, 2014
 Gold Outlook. Gold price performance of last 5 years 44% -36% 30% 10% 7% -28% -5% 2010 2011 2012 2013 YTD Year 2014 Bear bug hits gold!!! CMP - $1150 Global commodity prices have remained in a downward
On Our Technical Watch
 By Lawrence Yeo Eng Chien l lawrenceyeo@kenanga.com.my Figure 1: Daily Charting FBMKLCI Basic Data 52-week High 1,795.00 (in Million) 52-week Low 1,611.88 KLCI Vol 136.57 Current Level 1,791.01 Bursa Vol
Weekly outlook for Mar
 Weekly outlook for Mar. 26 30 2018 Summary The S&P500 index is expected to test February's low first and bounce from it before the Good Friday holiday. The end of the month and the end of the quarter may
Technical analysis & Charting The Foundation of technical analysis is the Chart.
 Technical analysis & Charting The Foundation of technical analysis is the Chart. Charts Mainly there are 2 types of charts 1. Line Chart 2. Candlestick Chart Line charts A chart shown below is the Line
Research Desk Stock Broking
 Research Desk Stock Broking ValueMax Mar 01, 2018 ValueMax Monthly Investment Ideas ValueMax helps clients to take a long stance on stocks from the S&P BSE-100 universe. Comprising monthly technical investment
Technical Analysis. Weekly Comment. Global. SPX Overbought Relief Rally in Europe!! Equities Sales Trading Commentary
 h Technical Analysis Equities Sales Trading Commentary Weekly Comment Global Michael Riesner Marc Müller 03/07/2012 michael.riesner@ubs.com marc.mueller@ubs.com +41-44-239 1676 +41-44-239 1789 SPX Overbought
Table of Contents. Risk Disclosure. Things we will be going over. 2 Most Common Chart Layouts Anatomy of a candlestick.
 Table of Contents Risk Disclosure Things we will be going over 2 Most Common Chart Layouts Anatomy of a candlestick Candlestick chart Anatomy of a BAR PLOT Indicators Trend-Lines Volume MACD RSI The Stochastic
DAILY TECHNICAL REPORT MA S-TERM. 16 December, 2011 L-TERM MULTI-WEEK OBJECTIVES/COMMENTS ENTRY LEVEL STRATEGY/ POSITION
 MA S-TERM MULTI-DAY Please note: None of the strategies below represent trading advice or trading recommendations of any kind. Please refer to our full disclaimer. L-TERM MULTI-WEEK STRATEGY/ POSITION
TOP ECONOMIC EVENTS OF THE DAY
 November 14 th 2018 TOP ECONOMIC EVENTS OF THE DAY TIME CURRENCY EVENT EXPECTED PREVIO US CONSENSUS IMPACT 12:30AM AUD Wage Price Index QoQ Q3 0.6%(Actual) 0.6% 0.65 NEGATIVE FOR AUD 09:30AM GBP Inflation
On Our Technical Watch
 By the Kenanga Research Team l research@kenanga.com.my Figure 1: Daily Charting FBMKLCI Basic Data Technical Ratings 52-week High 1,729.13 (in Million) 52-week Low 1,600.92 KLCI Vol 93.61 Current Level