MAGIC FOREX DIVERGENCE Trading Guide
|
|
|
- Frederick Sherman Baldwin
- 6 years ago
- Views:
Transcription

1 Tim Trush & Julie Lavrin Introducing MAGIC FOREX DIVERGENCE Trading Guide Your guide to financial freedom. Tim Trush, Julie Lavrin, T&J Profit Club, 2017, All rights reserved
2 Table Of Contents Chapter I: Divergence and market psychology I.1. Trend strength 3 Our goal is to find the point where the trend is so weak that it is probably going to reverse. I.2. What is a divergence? 4 How to find the pattern that results in trend reversal. I.3. Indicator soup 5 It doesn't matter what indicator is your best friend. Chapter II: The Holy Grail strategy II.1. Chart set-up 6 Set up your chart. II.2. Catch the massive move 7 One simple exit approach is shown in the next examples. II.3. Examples 8 The following charts are created with Divergence Pattern Recognizer. Divergence can be used on any time-frame, any currency pair, stock or commodity. Chapter III: Smart approach 12 Divergence patterns can lead to consolidation, correction, or full trend reversal. With a solid strategy, you can make a quick profit on the small correction, or minor trend reversal. 2

3 Chapter I: Divergence and market psychology I.1. Trend strength Look at the following scheme. 1. Buyers believe that the trend has recovered, or a new trend has begun and they want to make money. So they open long positions and drive the price higher. The trend accelerates as more buyers jump into the market. 2. When the buyers take profits, the trend weakens. Buyers still dominate, but they calm down because they are afraid that the trend is coming to the end. 3. When there are no more buyers in the market, the trend is going to reverse. Sellers dominate. Our goal is to find the point where the trend is so weak that it is probably going to reverse. A good tool helping us to measure the character of the trend is the RSI indicator (Relative Strength Index). When the RSI rises above 70, the market is considered to be overbought. When the RSI falls below 30, the market is considered to be oversold. This is a good old story, but we will use the RSI indicator another way. 3
4 I.2. What is a divergence? Now, look at the same chart again. There are two significant highs labeled A and B in the price chart and the corresponding highs in the RSI chart. In the price chart, we see that B is higher than A. That means that the price is still going up. In the RSI chart, it's just the opposite: B is lower than A. It means that the trend weakens and it is probably going to reverse. And the trend has actually reversed! Let's say it again. Bearish Divergence Price makes two significant highs. The second is higher. RSI makes two significant highs, but the second is lower. Bullish Divergence Price makes two significant lows. The second is lower. RSI makes two significant lows, but the second is higher. 4

5 I.3. Indicator soup We have used the RSI indicator in the examples, but it can be replaced with any momentum indicator such as CCI, Stochastic Oscillator or MACD. All these indicators are derived from price so there are no better or worse indicators. It's only about preference. It doesn't matter what indicator is your best friend. Every approach is equally good. We prefer the MACD indicator because of its nice smooth diagram. The MACD divergence is easy to recognize directly from the MACD chart. 5

6 Chapter II: The Holy Grail strategy II.1. Chart set-up Add the MACD indicator with default settings to the chart. We recommend to hide the grid by pressing CTRL+G. Here we see a bearish divergence pattern. The two significant highs are connected with a red line. The line in the price chart is sloping up, but the line in the MACD chart is sloping down. This is how divergence is recognized. 6
7 II.2. Catch the massive move MACD divergence is a very reliable pattern. Sometimes, chart pattern traders see the double top pattern and Elliott wave traders see the shortened fifth wave instead. But they all refer to the same thing the divergence pattern. Most traders don't realize that MACD divergence is exactly what they are looking for! Our approach removes the subjectivity because the divergence pattern is well defined. There are numerous ways to catch the quick move happening after divergences. More details in the Divergence Master Trader book. One simple approach to exit is a candlestick reversal pattern as shown in the next examples. 7

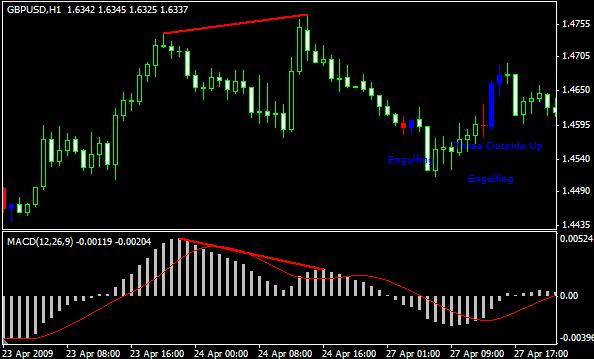
 or red line (bearish divergence) in both price chart and")
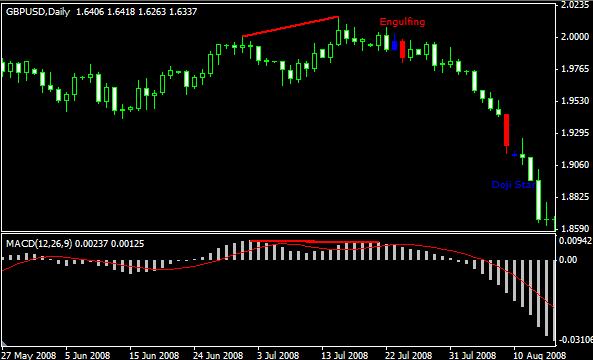
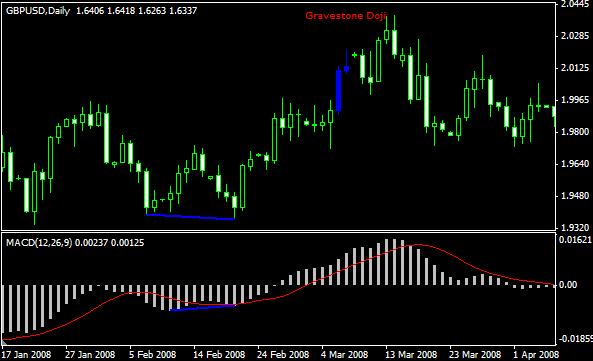
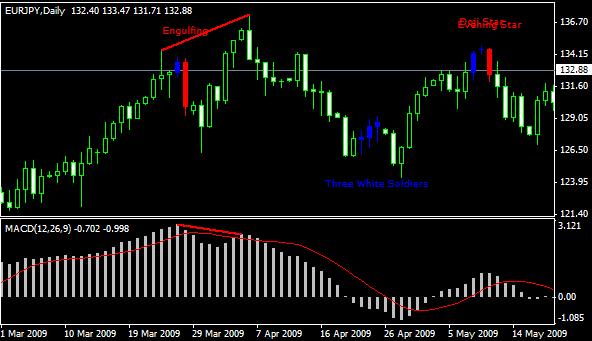
8 II.3. Examples The following charts are created with Divergence Pattern Recognizer. The divergence pattern is recognized and automatically marked with blue line (bullish divergence) or red line (bearish divergence) in both price chart and MACD chart. The line connects the significant lows / highs. 8
9 9
10 10

11 The last example shows how we predicted the big trend reversal on GBP/USD, Weekly. The bearish divergence signal was confirmed with strong Lucky Spike! We went short with confidence and made money on long-term downtrend. Divergence can be used on any time-frame, any currency pair, stock or commodity. 11


12 Chapter III: Smart approach A definite plan about where to enter, where to place Stop Loss and where to exit is needed. Divergence patterns can lead to consolidation, correction, or full trend reversal. With a solid strategy, you can make a quick profit on the small correction, or minor trend reversal. When the trend reverses, you should stay with the trend for as long as possible. You should also be able to filter small divergence patterns in a sideways or choppy market. When the price is moving up and down in the range, the MACD is moving around the zero line, giving too many invalid signals. The Golden Rule explained in the Divergence Master Trader book protects us from such situations and limits the entry points only to significant divergence patterns. All features built in the Divergence Pattern Recognizer helps the trader to find reliable divergence patterns automatically. The following example shows taking a quick profit on a candlestick reversal pattern, or riding the new trend starting just from the market top! 12
Chapter 2.3. Technical Analysis: Technical Indicators
 Chapter 2.3 Technical Analysis: Technical Indicators 0 TECHNICAL ANALYSIS: TECHNICAL INDICATORS Charts always have a story to tell. However, from time to time those charts may be speaking a language you
Forex Sentiment Report Q2 FORECAST WEAK AS LONG AS BELOW April
 Forex Sentiment Report 08 April 2015 www.ads-securities.com Q2 FORECAST WEAK AS LONG AS BELOW 1.1200 Targets on a break of 1.1534/35: 1.1740/50 1.1870/75 1.2230/35 Targets on a break of 1.0580/70: 1.0160
Using Acceleration Bands, CCI & Williams %R
 Price Headley s Simple Trading System for Stock, ETF & Option Traders Using Acceleration Bands, CCI & Williams %R How Technical Indicators Can Help You Find the Big Trends For any type of trader, correctly
MagicBreakout Forex Trading Strategy
 Tim Trush & Julie Lavrin introduce MagicBreakout Forex Trading Strategy Your guide to financial freedom. Tim Trush, Julie Lavrin, T&J Profit Club, 2007, All rights reserved www.magicbreakout.com Table
Advanced Trading Systems Collection MACD DIVERGENCE FOREX TRADING SYSTEM
 MACD DIVERGENCE FOREX TRADING SYSTEM 1 This system will cover the MACD divergence. With this forex trading system you can trade any currency pair (I suggest EUR/USD and GBD/USD when you start), and you
Using Acceleration Bands and Williams %R
 Price Headley s Simple Trading System for Stock, ETF & Option Traders Using Acceleration Bands and Williams %R How Technical Indicators Can Help You Find the Big Trends For option traders, correctly forecasting
1. Introduction 2. Chart Basics 3. Trend Lines 4. Indicators 5. Putting It All Together
 Technical Analysis: A Beginners Guide 1. Introduction 2. Chart Basics 3. Trend Lines 4. Indicators 5. Putting It All Together Disclaimer: Neither these presentations, nor anything on Twitter, Cryptoscores.org,
Quad EMA Strategy. by Admiral Markets Trading Camp
 Quad EMA Strategy by Admiral Markets Trading Camp Contents About the Author 3 Strategy Description 4 Exponential Moving Average 5 Awesome Oscillator 9 MACD Indicator 13 Conclusion 19 About the Author Nenad
Chapter 2.3. Technical Indicators
 1 Chapter 2.3 Technical Indicators 0 TECHNICAL ANALYSIS: TECHNICAL INDICATORS Charts always have a story to tell. However, sometimes those charts may be speaking a language you do not understand and you
INTERMEDIATE EDUCATION GUIDE
 INTERMEDIATE EDUCATION GUIDE CONTENTS Key Chart Patterns That Every Trader Needs To Know Continution Patterns Reversal Patterns Statistical Indicators Support And Resistance Fibonacci Retracement Moving
Williams Percent Range
 Williams Percent Range (Williams %R or %R) By Marcille Grapa www.surefiretradingchallenge.com RISK DISCLOSURE STATEMENT / DISCLAIMER AGREEMENT Trading any financial market involves risk. This report and
Technical Analysis. Dealing Room Peter Leonidou. Peter Leonidou
 Technical Analysis Dealing Room Questions Traders Should Ask What is the trend? What is the pivot point? What is the support levels? What is the resistance levels? Strong or weaker USD? What 1. Trade
Convergence and Divergence
 Convergence and Divergence Momentum: The Verge of Success Momentum plays a key role in trend analysis. Trends are composed of a series of price swings. It is a trader s edge to know when a trend is slowing
Introduction. Technicians (also known as quantitative analysts or chartists) usually look at price, volume and psychological indicators over time.
 usually look at price, volume and psychological indicators over time.") Technical Analysis Introduction Technical Analysis is the study of market action, primarily through the use of charts, for the purpose of forecasting future price trends. Technicians (also known as quantitative
Technical Analysis Introduction Technical Analysis is the study of market action, primarily through the use of charts, for the purpose of forecasting future price trends. Technicians (also known as quantitative
Compiled by Timon Rossolimos
 Compiled by Timon Rossolimos - 2 - The Seven Best Forex Indicators -All yours! Dear new Forex trader, Everything we do in life, we do for a reason. Why have you taken time out of your day to read this
The Technical Edge Page 1. The Technical Edge. Part 1. Indicator types: price, volume, and moving averages and momentum
 The Technical Edge Page 1 The Technical Edge INDICATORS Technical analysis relies on the study of a range of indicators. These come in many specific types, based on calculations or price patterns. For
Technical analysis & Charting The Foundation of technical analysis is the Chart.
 Technical analysis & Charting The Foundation of technical analysis is the Chart. Charts Mainly there are 2 types of charts 1. Line Chart 2. Candlestick Chart Line charts A chart shown below is the Line
Secrets of Forex Trading
 Secrets of Forex Trading www.elliott-wave.webs.com Spatial Trades 2/5/2013 Spatial Trades Inc. SURESH UPRETY Table of Contents CALENDAR ANALYSIS... 4 UNDERSTANDING OSCILLATORS AND VOLUME... 6 ELLIOTT WAVE
Bollinger Trading Methods. Play 1 - The Squeeze
 Overview: Play 1 - The Squeeze Play 2 - The Trend Trade Play 3 - Reversals Wrap up Bollinger Trading Methods Play 1 - The Squeeze The Squeeze The most popular strategy Looks to enter a trend early on Anticipates
Introduction. Technical analysis is the attempt to forecast stock prices on the basis of market-derived data.
 Technical Analysis Introduction Technical analysis is the attempt to forecast stock prices on the basis of market-derived data. Technicians (also known as quantitative analysts or chartists) usually look
 1 www.candlecharts.com 2 BONUS www. candlecharts.com/special/swing-trading-2/ 3 www. candlecharts.com/special/swing-trading-2/ 4 www. candlecharts.com/special/swing-trading-2/ 5 www. candlecharts.com/special/swing-trading-2/
Hidden Divergence. Hello there, you will be excited about the information contained in this report.
 Hidden Divergence Hello there, you will be excited about the information contained in this report. Isn t it remarkable how people like us who are in the Trading business have taken frequently interesting
Stock Market Basics Series
 Stock Market Basics Series HOW DO I TRADE STOCKS.COM Copyright 2012 Stock Market Basics Series THE STOCHASTIC OSCILLATOR A Little Background The Stochastic Oscillator was developed by the late George Lane
Understanding Oscillators & Indicators March 4, Clarify, Simplify & Multiply
 Understanding Oscillators & Indicators March 4, 2015 Clarify, Simplify & Multiply Disclaimer U.S. Government Required Disclaimer Commodity Futures Trading Commission Futures and Options trading has large
Trading the Hidden Divergence. Presented by Sunil Mangwani
 Trading the Hidden Divergence Indicators in technical analysis. Indicators along with chart patterns, trend lines, resistance / support levels etc., are an essential part of technical analysis. But there
AUTHOR: NG EE HWA, TRAINER, CHARTNEXUS TRADING WITH RSI
 AUTHOR: NG EE HWA, TRAINER, CHARTNEXUS TRADING WITH RSI While the use of Relative Strength Index (RSI) to get technical buy and sell signals in a range-bound market is well understood, the use of this
The six technical indicators for timing entry and exit in a short term trading program
 The six technical indicators for timing entry and exit in a short term trading program Definition Technical analysis includes the study of: Technical analysis the study of a stock s price and trends; volume;
BONUS. www. candlecharts.com/special/swing-trading-2/
 BONUS www. candlecharts.com/special/swing-trading-2/ 1 www. candlecharts.com/special/swing-trading-2/ www. candlecharts.com/special/swing-trading-2/ www. candlecharts.com/special/swing-trading-2/ 2 www.
Three Techniques for Spotting Market Twists and Turns. Riding the Roller
 Three Techniques for Spotting Market Twists and Turns Riding the Roller Coaster Learn to Spot the Twists and Turns Whether you re new to forex or you ve been trading a while, you know how the unexpected
FOREX TRADING STRATEGIES.
 FOREX TRADING STRATEGIES www.ifcmarkets.com www.ifcmarkets.com 2 One of the most powerful means of winning a trade is the portfolio of Forex trading strategies applied by traders in different situations.
TD AMERITRADE Technical Analysis Night School Week 2
 TD AMERITRADE Technical Analysis Night School Week 2 Hosted By Derek Moore Director, National Education For the audio portion of today s webcast, please enable your computer speakers. Past performance
Now You Can Have These Trading Gems- Free!
 Presents Killer Patterns Now You Can Have These Trading Gems- Free! The Trading Info Revealed Here is not the Same as the Proven WizardTrader.com Methods But Works Well With Them 1 Copyright Information
Icoachtrader Consulting Service WELCOME TO. Trading Boot Camp. Day 5
 Icoachtrader Consulting Service www.icoachtrader.weebly.com WELCOME TO Trading Boot Camp Day 5 David Ha Ngo Trading Coach Phone: 1.650.899.1088 Email: icoachtrader@gmail.com The information presented is
BUY SELL PRO. Improve Profitability & Reduce Risk with BUY SELL Pro. Ultimate BUY SELL Indicator for All Time Frames
 BUY SELL PRO Improve Profitability & Reduce Risk with BUY SELL Pro Ultimate BUY SELL Indicator for All Time Frames Risk Disclosure DISCLAIMER: Crypto, futures, stocks and options trading involves substantial
DAY TRADING GUIDE TRADE ON EVERY MOVE CATCH ME IF YOU CAN.
 DAY TRADING GUIDE TRADE ON EVERY MOVE CATCH ME IF YOU CAN. RISK WARNING PAST PERFORMANCE DOES NOT INDICATE FUTURE RESULTS. TRADE WITH STRICT MINIMAL MONEY MANAGEMENT TO AVOID PSYCHOLOGICAL EMOTION WHILE
Combining Rsi With Rsi
 Working Two Stop Levels Combining Rsi With Rsi Optimization and stop-losses can help you minimize risks and give you better returns. channels, and so forth should be kept to a minimum. DAVID GOLDIN ou
The Schaff Trend Cycle
 The Schaff Trend Cycle by Brian Twomey This indicator can be used with great reliability to catch moves in the currency markets. Doug Schaff, president and founder of FX Strategy, created the Schaff trend
Compass FX
 SYNERGY Trading Method Disclaimer Unique experiences and past performances do not guarantee future results. Trading in the off-exchange Foreign Exchange market (Forex) is very speculative in nature, involves
Using Oscillators & Indicators Properly May 7, Clarify, Simplify & Multiply
 Using Oscillators & Indicators Properly May 7, 2016 Clarify, Simplify & Multiply Disclaimer U.S. Government Required Disclaimer Commodity Futures Trading Commission Futures and Options trading has large
Swing Trading Strategies that Work
 Swing Trading Strategies that Work Jesse Livermore, one of the greatest traders who ever lived once said that the big money is made in the big swings of the market. In this regard, Livermore successfully
Table of Contents. Risk Disclosure. Things we will be going over. 2 Most Common Chart Layouts Anatomy of a candlestick.
 Table of Contents Risk Disclosure Things we will be going over 2 Most Common Chart Layouts Anatomy of a candlestick Candlestick chart Anatomy of a BAR PLOT Indicators Trend-Lines Volume MACD RSI The Stochastic
COPYRIGHTED MATERIAL. Index. P1:a/b P2:c/d QC:e/f T1:g ind JWBK244-Miner August 14, :52 Printer: Yet to come
 Index A AA. See American Airlines ABC (simple) correction, 58 64 followed by new lows, 61 guidelines, 60 momentum reversal, 81 price targets, 100 ABC zigzag, 58 Alternate price projection (APP) external,
Module 12. Momentum Indicators & Oscillators
 Module 12 Momentum Indicators & Oscillators Oscillators or Indicators Now we will talk about momentum indicators The term momentum refers to the velocity of a price trend. This indicator measures whether
Forex trading using VSA (Volume Spread Analysis)
") Forex trading using VSA (Volume Spread Analysis) Most traders are familiar with technical and fundamental analysis. There are several ways to use these two methods to analyze the forex market, but, in
Forex trading using VSA (Volume Spread Analysis) Most traders are familiar with technical and fundamental analysis. There are several ways to use these two methods to analyze the forex market, but, in
Presents. SPY the MARKET. With. Bill Corcoran
 Presents SPY the MARKET With Bill Corcoran I am not a registered broker-dealer or investment adviser. I will mention that I consider certain securities or positions to be good candidates for the types
RISK DISCLOSURE STATEMENT / DISCLAIMER AGREEMENT
 RISK DISCLOSURE STATEMENT / DISCLAIMER AGREEMENT Trading any financial market involves risk. This report and all and any of its contents are neither a solicitation nor an offer to Buy/Sell any financial
EZ Trade FOREX Day Trading System. by Beau Diamond
 EZ Trade FOREX Day Trading System by Beau Diamond The EZ Trade FOREX Day Trading System is mainly used with four different currency pairs; the EUR/USD, USD/CHF, GBP/USD and AUD/USD, but some trades are
STEP. Establish Short-Term Trend & Retracements. What is a trend?
 Establish Short-Term Trend & Retracements STEP 3 In Step Three, you will establish Short- Term Trend and Retracements on daily charts. By defining the trend and retracement, you will gain knowledge that
I prefer to use the CCI indicator to trade divergences and it has worked well for me over the past 10 years.
 Make 100 pips Trading Divergences. There are several ways to trade divergences and several indicators that can help you identify the divergence between price and the indicator itself. I prefer to use the
How I Trade Profitably Every Single Month without Fail
 How I Trade Profitably Every Single Month without Fail First of all, let me take some time to introduce myself to you. I am Koon Hwee (KH Lee) and I am a full time currency trader. I have a passion for
With that, let s dive into the steps. Step 1 Identify range bound markets on Daily or 4 Hour Charts
 If you have been trading for any length of time, you have probably noticed that the markets are moving sideways A LOT. Consolidation is a huge part of the market s balance and so it makes sense to learn
OSCILLATORS. TradeSmart Education Center
 OSCILLATORS TradeSmart Education Center TABLE OF CONTENTS Oscillators Bollinger Bands... Commodity Channel Index.. Fast Stochastic... KST (Short term, Intermediate term, Long term) MACD... Momentum Relative
Class 7: Moving Averages & Indicators. Quick Review
 Today s Class Moving Averages Class 7: Moving Averages & Indicators 3 Key Ways to use Moving Averages Intro To Indicators 2 Indicators Strength of Lines Quick Review Great for establishing point of Support
Multi Indicator Usage Concepts 4/1/2012 Brooky-Indicators.com Brooky
 Multi Indicator Usage Concepts www.brooky-indicator.com 4/1/2012 Brooky-Indicators.com Brooky U.S. Government Required Disclaimer Commodity Futures Trading Commission Futures, Currency and Options trading
Presents. The Trading Information Revealed Here is not the Same as the WizardTrader.com Methods -- But Together They Pack a Powerful Punch
 Presents Killer Patterns Now You Can Have These Trading Gems -- Free! The Trading Information Revealed Here is not the Same as the WizardTrader.com Methods -- But Together They Pack a Powerful Punch 1
GUIDE TO STOCK trading tools
 P age 1 GUIDE TO STOCK trading tools VI. TECHNICAL INDICATORS AND OSCILLATORS I. Introduction to Indicators and Oscillators Technical indicators, to start, are data points derived from a specific formula.
50 Pips A Day Forex Strategy. How To Build A Solid Trading System. By Laurentiu Damir. Copyright 2012 by Laurentiu Damir
 50 Pips A Day Forex Strategy How To Build A Solid Trading System By Laurentiu Damir Copyright 2012 by Laurentiu Damir All rights reserved. No part of this book may be reproduced or transmitted in any form
This is the complete: Fibonacci Golden Zone Strategy Guide
 This is the complete: Fibonacci Golden Zone Strategy Guide In this strategy report, we are going to share with you a simple Fibonacci Trading Strategy that uses the golden ratio which is a special mathematical
TECHNICAL INDICATORS
 TECHNICAL INDICATORS WHY USE INDICATORS? Technical analysis is concerned only with price Technical analysis is grounded in the use and analysis of graphs/charts Based on several key assumptions: Price
Technical Analysis Indicators
 Technical Analysis Indicators William s Percent R Rules, Scans, Adding Filters, Breakout, Retest, and Application across MTFs Course Instructor: Price Headley, CFA, CMT BigTrends Coaching Access to BigTrends
Technicals & Time Frame
 Advanced Charting Neither Better Trades or any of its personnel are registered broker-dealers or investment advisers. I will mention that I consider certain securities or positions to be good candidates
(c) Copyright
 Copyright") PDFaid.Com #1 Pdf Solutions How to Use Yahoo Chart? Based on swing High/Low This strategy is for those who take several positions everyday and their trading style is scalping type, in high quantity is
PDFaid.Com #1 Pdf Solutions How to Use Yahoo Chart? Based on swing High/Low This strategy is for those who take several positions everyday and their trading style is scalping type, in high quantity is
CMT LEVEL I CURRICULUM Self-Evaluation
 CMT LEVEL I CURRICULUM Self-Evaluation DEAR CFA CHARTERHOLDER, As a CFA charterholder, the requirement that you sit for the CMT Level I exam is waived. However, the content in the CMT Level I Curriculum
Technical Analysis and Charting Part II Having an education is one thing, being educated is another.
 Chapter 7 Technical Analysis and Charting Part II Having an education is one thing, being educated is another. Technical analysis is a very broad topic in trading. There are many methods, indicators, and
TOP 3 INDICATOR BOOT CAMP: PERCENT R
 BIGTRENDS.COM TOP 3 INDICATOR BOOT CAMP: PERCENT R PRICE HEADLEY, CFA, CMT Let s Get Started! Educate Understand the tools you have for trading. Learn what this indicator is and how you can profit from
An Introduction to Candlesticks for Options Using Nison Candlesticks as the Foundation to your option trading
 Using Nison Candlesticks as the Foundation to your option trading, CMT President: Candlecharts.com Candlestick Benefits Easy to Understand Early Reversals Safety First East + West All markets All Time
Top 10 BEST Forex Trading Strategies PDF Report Ebook Author
 Top 10 BEST Forex Trading Strategies PDF Report Ebook Author Top 10 Best Forex Trading Strategies PDF Report If you re in the pursuit of nding the Best Forex trading Strategy and the keys to choosing a
USING THE STOCHASTIC OSCILLATOR 12th February 2015
 TAFX USING THE STOCHASTIC OSCILLATOR 12th February 2015 Disclaimer is in no way affiliated or representative of any other company, organisation, club or society, and the views presented are solely our
Raising Investment Standards TRADING SEMINAR
 Raising Investment Standards TRADING SEMINAR Raising Investment Standards DISCLAIMER Leveraged foreign exchange and options trading carries a significant level of risk, and may not be suitable for all
4 Keys to Trend Trading Tech Analysis. There is no Holy Grail of Trading Only Tools & Rules
 4 Keys to Trend Trading Tech Analysis There is no Holy Grail of Trading Only Tools & Rules Disclaimer U.S. GOVERNMENT REQUIRED DISCLAIMER COMMODITY FUTURES TRADING COMMISSION FUTURES AND OPTIONS TRADING
Introduction to MTPredictor Page 1. By: Steve Griffiths, MTPredictor developer September 2016
 Page 1 Introduction to MTPredictor By: Steve Griffiths, MTPredictor developer September 2016 Welcome to this introduction to MTPredictor, where I would like to take a look at the automatic routines and
Level I Learning Objectives by chapter
 Level I Learning Objectives by chapter 1. Introduction to the Evolution of Technical Analysis Describe the development of modern technical analysis Describe the origins of technical analysis 2. A New Age
Technical Indicators
 Taken From: Technical Analysis of the Financial Markets A Comprehensive Guide to Trading Methods & Applications John Murphy, New York Institute of Finance, Published 1999 Technical Indicators Technical
REDISCOVER THE LOST ART OF CHART READING
 REDISCOVER THE LOST ART OF CHART READING Using Volume Spread Analysis BY: Todd Krueger Most traders are aware of the two widely known approaches used to analyze a market, fundamental analysis and technical
THE CYCLE TRADING PATTERN MANUAL
 TIMING IS EVERYTHING And the use of time cycles can greatly improve the accuracy and success of your trading and/or system. THE CYCLE TRADING PATTERN MANUAL By Walter Bressert There is no magic oscillator
Forex Seasonal Patterns:
 Forex Seasonal Patterns: The seasonal patterns of the EUR/USD, GBP/USD, USD/JPY, AUD/USD, USD/CAD and Dollar Index ~By Cory Mitchell, CMT~ Use seasonality to discover when forex pairs typically rally and
Lara s Weekly. S&P500 + GOLD + USOIL Elliott Wave & Technical Analysis. Lara Iriarte CMT 23 February, 2018
 Lara s Weekly S&P500 + GOLD + USOIL Elliott Wave & Technical Analysis Lara Iriarte CMT 23 February, 2018 S&P 500 Contents S&P 500 GOLD USOIL About Disclaimer 3 18 36 48 48 S&P 500 S&P 500 Upwards movement
IronFX. technical indicators
 IronFX technical indicators Average Directional Index (ADX) The Average Directional Index (ADX) helps traders see if a trend is developing in the charts and whether the trend is strengthening or weakening.
For general trading knowledge, please get a beginners guide or simply got to :
 www.forexripper.com About The System For general trading knowledge, please get a beginners guide or simply got to : www.babypips.com For more interactive information about the market, there are hundreds
BONUS.
 1 BONUS www.candlecharts.com 2 www.candlecharts.com 3 www.candlecharts.com 4 www.candlecharts.com 5 www.candlecharts.com 6 www.candlecharts.com 7 www.candlecharts.com 8 SWING TRADING USING CANDLESTICKS
The Engulfing Trader Copyright 2014
 Www.ForexWinners.Ru Prologue and Introduction This book is for all those that are just fed up with all the hype out there in the market. So called guru s selling expensive strategies and systems guaranteeing
Resistance to support
 1 2 2.3.3.1 Resistance to support In this example price is clearly consolidated and we can expect a breakout at some time in the future. This breakout could be short or it could be long. 3 2.3.3.1 Resistance
Additional Reading Material on Technical Analysis
 Additional Reading Material on Relevant for 1. Module 7 (Financial Statement Analysis and Asset Valuation) 2. Module 18 (Securities and Derivatives Trading [Products and Analysis]) Copyright 2017 Securities
CHARTS. Bar Line Candlestick Charts are the basis of technical analysis They are a graphic display of price action. Notes:
 TECHNICAL ANALYSIS CHARTS Bar Line Candlestick Charts are the basis of technical analysis They are a graphic display of price action Candlestick charts have become the industry standard for technical traders.
Trade Ideas A.I. Strategy Descriptions Revised : 10/04/2017
 Trade Ideas A.I. Strategy Descriptions Revised : 10/04/2017 The 5 Day Bounce The trigger for this alert has to cross above resistance while also making a 60 minute high on stocks that are trying to bounce
Technical Analysis Workshop Series. Session 11 Semester 2 Week 5 Oscillators Part 2
 Technical Analysis Workshop Series Session 11 Semester 2 Week 5 Oscillators Part 2 DISCLOSURES & DISCLAIMERS This research material has been prepared by NUS Invest. NUS Invest specifically prohibits the
charts to also be in the overbought area before taking the trade. If I took the trade right away, you can see on the M1 chart stochastics that the
 When you get the signal, you first want to pull up the chart for that pair and time frame of the signal in the Web Analyzer. First, I check to see if the candles are near the outer edge of the Bollinger
Tim Trush & Julie Lavrin. Introducing CANDLESTICK SNIPER. Tim Trush, Julie Lavrin, T&J Profit Club, 2017, All rights reserved
 Tim Trush & Julie Lavrin Introducing CANDLESTICK SNIPER Tim Trush, Julie Lavrin, T&J Profit Club, 2017, All rights reserved www.tjprofitclub.com Table Of Contents Chapter I: You need to know what you are
Introduction 3. Charts: line, bar and candle 4. Critical price levels 6
 Contents page Introduction 3 Charts: line, bar and candle 4 Critical price levels 6 Resistance, support and pivot points 6 Definitions 6 Reasoning 7 Pivot points 8 Fibonacci retracements 9 Relative Strength
20.2 Charting the Market
 NPTEL Course Course Title: Security Analysis and Portfolio Management Course Coordinator: Dr. Jitendra Mahakud Module-10 Session-20 Technical Analysis-II 20.1. Other Instruments of Technical Analysis Several
Power Ranger Strategy
 Power Ranger Strategy Power Ranger Strategy Strategy Concept Using the common oscillator, the Stochastic to identify entry for early range trading. Time-frame H1 and above. Currency Pairs All currency
Trend Channels: How to Identify Easy Profit-Making Opportunities Using Simple Chart Analysis
 Trend Channels: How to Identify Easy Profit-Making Opportunities Using Simple Chart Analysis Trend channels produce a very powerful trading technique. They are very visible, which makes them easy to utilize
.. /-!"::- '..- ( \.- - '-/../ '
 ....'-/ -!"::- ' ( \.-../ ' /- Triple Shot Forex Trading System The term "Day Trading" usually refers to the act of buying and selling a financial instrument within the same day. In the Forex market, a
Bollinger Bands Forex Trading Strategy With 20 Period Moving Average
 Bollinger Bands Forex Trading Strategy With 20 Period Moving Average The bollinger bands forex trading strategy with 20 period moving average is a very simple forex strategy that works very well for all
Introduction to MTPredictor Page 1. By: Steve Griffiths, MTPredictor developer August 2018
 Page 1 Introduction to MTPredictor By: Steve Griffiths, MTPredictor developer August 2018 Welcome to this introduction to MTPredictor, where I would like to take a look at the automatic routines and advanced
Top Down Analysis Success Demands Singleness of Purpose
 Chapter 9 Top Down Analysis Success Demands Singleness of Purpose Armed with a little knowledge about the stock and options market as well as a desire to trade, many new traders are faced with the daunting
CHAPTER I. Lesson 1. What is Forex
 CHAPTER I Lesson 1 What is Forex Forex come by the words Foreign Exchange. The market is the biggest market in the world open 24 hours every business day and with the volume of $1.5 trillion every day.
Fast Track Stochastic:
 Fast Track Stochastic: For discussion, the nuts and bolts of trading the Stochastic Indicator in any market and any timeframe are presented herein at the request of Beth Shapiro, organizer of the Day Traders
Forexsignal30 Extreme ver. 2 Tutorials
 Forexsignal30 Extreme ver. 2 Tutorials Forexsignal30.com is a manual trading system that is composed of several indicators that mutually cooperate with each other. Very difficult to find indicators that
Gambit Trading Suite Setup Guide. V2.31 PUBLIC BETA March 2017
 Gambit Trading Suite Setup Guide V2.31 PUBLIC BETA March 2017 Gambit Trading Suite - Intro The Gambit Trading Suite is a set of indicators developed in Pine script to be used on Tradingview.com. The goal