Presents. SPY the MARKET. With. Bill Corcoran
|
|
|
- Felicia Harper
- 5 years ago
- Views:
Transcription


1 Presents SPY the MARKET With Bill Corcoran
2 I am not a registered broker-dealer or investment adviser. I will mention that I consider certain securities or positions to be good candidates for the types of strategies we are discussing or illustrating. Because I consider the securities or positions appropriate to the discussion or for illustration purposes does not mean that I am telling you to trade the strategies or securities. Keep in mind that we are not providing you with recommendations or personalized advice about your trading activities. The information we are providing is not tailored to any particular individual. Any mention of a particular security is not a recommendation to buy, sell, or hold that or any other security or a suggestion that it is suitable for any specific person. Keep in mind that all trading involves a risk of loss, and this will always be the situation, regardless of whether we are discussing strategies that are intended to limit risk. I am not subject to trading restrictions. Myself and other instructors could have a position in a security or initiate a position in a security at any time.
3 Let s Talk I was reluctant to do this class. This strategy relies heavily on Day Trading. Day Trading is deceptive. It can be a lot of work.
4 Why Day Trade? Are you attracted to Day Trading? Most Day Traders like avoiding overnight Headline Risk Money is at risk for a short period of time. Profit (and loss) can be generated very quickly. There are almost always opportunities somewhere in Day Trades.
5 Why Not Day Trade? Are you afraid of Day Trading? Day Trading typically requires big leverage to exploit small moves. Margin requirements can be large (PDT rule). Commissions and bid x ask spreads eat up profit. Swing and Trend Trades generate bigger profit.
6 Day Trade vs. Swing Trade Day Trade Swing Trade Shorter time frame Smaller moves in price Bigger position size Lower Reward to Risk Higher win to loss Focus on 5 and 1 min. chart Daily chart as a reference Longer time frame Bigger moves in price Smaller position size Higher reward to risk Focus on Daily Chart 5 min. chart to refine entry and exit

7 Swing Trade Entry
8 Swing Trade Exit Days

9 Day Trade Entry

10 Day Trade Exit minutes
11 Sooooo? Day Trading can offer opportunity when the markets are choppy, unpredictable or flat. Day Trading can offer quick profits. The short time frame can mean quick exits which can increase win to loss ratios. Day Trading is exciting and can be fun. I will share how we can address commissions and bid x ask spreads.
12 Normal? Traditional day trading involves taking big positions in cheap stocks to exploit a small move. 10,000 shares of a $3 stock and looking for a $.05 move would be a typical trade. That s $30,000 chasing a $500 profit minus commissions and spreads. If it goes against you, you could lose more.
13 Options Day Trading Options can provide better leverage. 1 option contract controls 100 shares of stock. Option prices around $1/share on $200 stocks are not unusual. A $200 stock is likely to move more than a $3 stock. That means 100 contracts controls the same 10,000 shares but for around $10,000 on a stock that will move more.
14 The Catch Better leverage can have it s costs. While stocks may have $.01 to $.05 bid x ask spreads, option spreads are frequently more than $.60/ share. Options that have time left before expiration are costly, sometimes very costly. Commissions for trading options can be higher than they are on stocks.
15 The SPY The SPY is an Exchange Traded Fund (ETF) that tracks the S&P precisely at 1/10 the cost. While you cannot purchase the Market (S&P), you can buy and sell shares of the SPY. You can trade options on the SPY.
16 Why Day Trade The SPY? The SPY and it s options trade until 4:15 PM EST, 15 minutes past the rest of the market. SPY weekly options expire twice a week, one on Wednesday and one on Friday. The proximity to expiration means a higher delta at a lower price. The bid x ask spreads on the SPY options are typically $.01 and rarely more than $.05. The daily volume on SPY options is HUUUUGE.

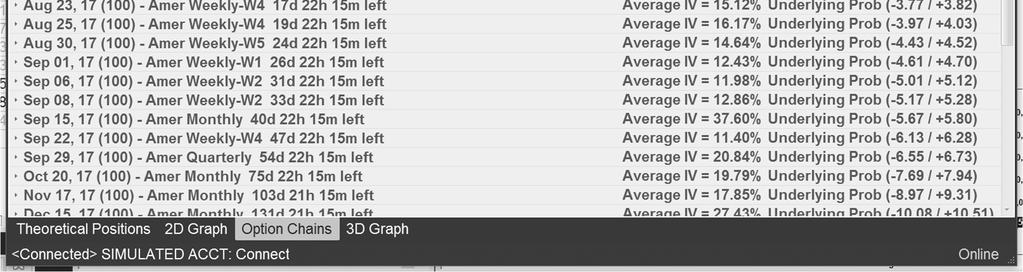
17 Multiple Weekly Expirations

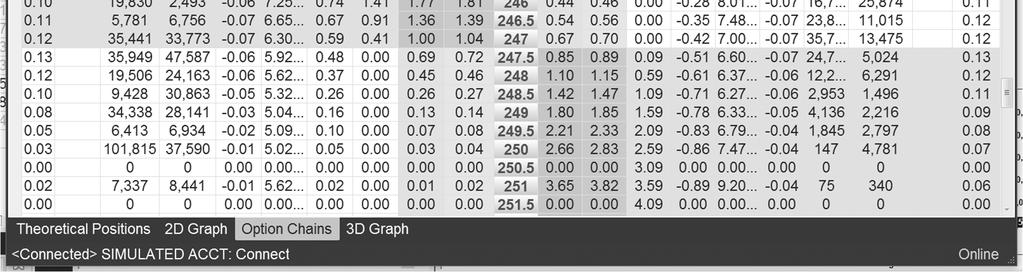
18 Volume and OI
19 SPY Swing and Trend Trades? You should be looking at the chart of the S&P every day. We tend to Day Trade inside of and in the direction of, Swing Trades. The bid x ask spreads on the SPY options are typically $.01 and rarely more than $.05. The daily volume on SPY options is HUUUUGE. This makes the SPY an ideal Swing and Trend trading candidate.
20 SPY Trend
21 TECHNICAL ANALYSIS
22 Technical Analysis If you suck at chart reading you will suck at trading. The chart tells us all we need to know. Patterns tend to repeat. Charting is scalable and transferable. Most trades should be in the direction of the daily chart. (there are exceptions)
23 The Chart A picture is worth a thousand Dollars! A picture of the market psychology. Tells us what the market is thinking. Pure supply and demand in picture form.
24 The Chart Chart patterns occur in multiple time frames. Chart patterns occur in all asset classes. Anytime there is a buyer and a seller there is likely a chart pattern being created.
25 Candlestick Charts Break down individual trading periods. Can identify market sentiment in each trading period. Patterns can emerge within individual candlesticks or even groups of candlesticks.
26 Bullish Candlestick HIGH CLOSE OPEN LOW
27 Bearish Candlestick OPEN HIGH CLOSE LOW
28 Candlestick Reversal Patterns Evening Star or doji reversal Morning Star or doji reversal Bullish Engulfing Bearish Engulfing Bullish Harami Bearish Harami Bullish piercing Bearish Dark Cloud
29 Evening Star Reversal Pattern

30 Doji Reversal (Engulfing)
31 Morning Star Reversal Pattern

32 Bullish Doji Reversal
33 Bearish Engulfing Reversal Pattern

34 Bearish Engulfing
35 Bullish Engulfing Reversal Pattern

36 Bullish Engulfing?
37 Bearish Harami Reversal Pattern

38 Bearish Harami
39 Bullish Harami Reversal Pattern

40 Bullish Harami
41 Continuation Patterns
42 Rising Three Method Pattern
43
44 Falling Three Method Pattern
45
46 Volume Bullish Price is rising Volume is rising Bearish Price is falling Volume is rising
47 Reversal Volume Potential Bullish Reversal Price is falling and approaching support Volume is falling Watch for reversal patterns Potential Bullish Reversal Price is rising and approaching resistance Volume is falling Watch for reversal patterns
48 The Bullish Blow Off Potential Bullish Reversal Stock price has been falling sharply Stock Price starts to reverse, leaving long wick below Volume is spiking to unusual highs, typically 1/3 or more higher than the opening volume for the day. Volume spike occurs when massive buy orders are triggered due to the sell off.
49 The Bearish Blow Off Potential Bearish Reversal Stock price has been climbing sharply Stock Price starts to reverse, leaving long wick above Volume is spiking to unusual highs, typically 1/3 or more higher than the opening volume for the day. Volume spike occurs when massive buy orders are triggered due to the rally.
50 Blow Off
51 Bollinger Bands Bands measure Volatility Can act as Support or Resistance BB mean can act as support/resistance. Can signal changes in momentum
52 Bollinger Band Top Stock price moves aggressively above the upper band. Price retraces below the upper band. Stock price rallies but fails to reach the upper band before retracing lower. Can signal a loss in momentum.

53 Bollinger Band Top
54 Bollinger Band Bottom Stock price moves aggressively below the lower band. Price retraces above the lower band. Stock price sells off but fails to reach the lower band before retracing higher. Can signal a loss in momentum.

55 Bollinger Band Bottom
56 Bollinger Band Channel Bollinger Bands and the 20 SMA are moving essentially sideways. Stock price moves below the lower band or above the upper band but fails to stay beyond the band. The stock price is likely to revert to the opposite band.

57 Bollinger Band Channel

58 Bollinger Band Channel
59 Multi Time Frame Confirmation We are day trading in very compressed time frames. The daily chart is a reference. The five minute chart is our primary tool for observing price activity. The one minute chart is used to confirm price activity observation on the five minute chart to confirm good entry and aggressive exits.


60 Multi Time Frame Template 12:57 12:55
61 STRATEGY
62 Day Trading the SPY What follows are descriptions strategies specific to day trading the SPY weekly options. Due to the compressed time frame of these options, we will trade the nearest expiration. As we are trading in compressed time frames we will seek options delta of at least.65 or higher. The profit target on these SPY day trades is.10/share. This will require significantly higher leverage to create acceptable net realized profit.
63 General Considerations Day trading is fast! This style of day trading is faster. Be aware of the Pattern Day Trader (PDT) rule and how it can help you. You are not going to learn or see enough in this workshop alone to be successful, you MUST practice.
64 Risk Considerations Stop management, risk management and awareness of win/loss ratios are critical. A higher win/loss ratio changes the risk dynamic and allows for higher risk metrics. A smaller reward to risk ratio is a factor in this type of trading and also affects risk metrics.
65 Position Size Position size should be considered in relation to total account value. Exploiting relatively small moves using high probability technical setups can potentially create higher win/loss ratios. His means we can afford to set up near 1:1 reward to risk ratio trades. The profit target on these SPY day trades is.10/share, therefore the net realized loss can approach.10/share, including the spread. Even with the potential for higher win/loss ratios, potential net realized loss on a single trade should not exceed 7.5%-10% of total account value.
66 The Blitz Trade
67 The Blitz Trade The Blitz is a quick all in/all out trade seeking a.10 move in the option price. This trade can be taken when a more significant move is unlikely or a reversal after a short move is likely. This strategy can work well for the Bollinger Band Channel. Upon confirming a technical entry, a large position in a high delta option is taken, keeping risk management rules in mind. A sell limit order for.10 above the purchase price is entered. A sell stop order for between.05 and.08 is entered as an OCO order.

68 The Blitz Entry In with 100 cts.85 delta,.06 stop
69 The Blitz Exit Out with 100 ctsat.10 profit = $1000 less commisions
70 The 80/20 Trade
71 The 80/20 Trade This trade can be taken when a more significant move is likely and when the SPY appears to be in a momentum move. This strategy can work well for the Day Trend when the SPY is trending between the outer Bollinger Band and the 10 EMA. Upon confirming a technical entry, a large position in a high delta option is taken, keeping risk management rules in mind. A sell limit order for.10 above the purchase price is entered on 80% of the position. A sell stop order for between.05 and.08 is initially entered as an OCO order on the full position. Once the sell order for.10 is triggered, the stop on the remaining 20% of the position size is moved to the 10 SMA.
72 80/20 Entry In with 100 contracts,.73delta,.08stop,.10 sell limit
73 80/20 Exit 80 Out of 80 contracts, remaining 20 have.82 delta,.02 stop

74 80/20 Exit 20 Early exit on BB top for.80 profit Exit 20 ctson the break of the 10 EMA with.60 profit
75 Today and Tomorrow Trade This trade is a hybrid, day/swing trade. This strategy can work well when the Day Trend trade carries into the close and when daily chart indicates a likelihood of continued movement in the direction of the Day Trend. The trade can only be converted on residual positions left over from 80/20 Trade setups. Because the trade will be held overnight, standard swing trade risk metrics apply.

76 Today and Tomorrow Residual 20 ctposition held overnight based on daily chart
77 Magic Minute Trade This trade is an extremely compressed version of the Blitz. This strategy can work well when the SPY goes into a lower volume channel during late morning and lunch. Bid x ask spread must be.01 Delta must approach 1.00 (expiration day) Sell limits are at , stops are similar. Trades are only taken at the upper or lower band on the 1 minute chart.

78 Magic Minute Entry In 100 cts,.95 delta.05selllimit,.04stop

79 Magic Minute Exit Out of 100 cts with a.05profit
80 Magic Minutes
81 Don t Do It! You know enough to be really dangerous. You need practice, a lot of it. I would prefer to teach this to you over and over. We need to spend some time focused on this strategy
Technicals & Time Frame
 Advanced Charting Neither Better Trades or any of its personnel are registered broker-dealers or investment advisers. I will mention that I consider certain securities or positions to be good candidates
CONNECING THE DOTS Candlesticks & Convergence of Clues. The Art & Science of Active Trend Trading
 CONNECING THE DOTS Candlesticks & Convergence of Clues The Art & Science of Active Trend Trading Disclaimer U.S. Government Required Disclaimer Commodity Futures Trading Commission Futures and Options
The Art & Science of Active Trend Trading
 CONNECTING THE DOTS Candlesticks & Convergence of Clues The Art & Science of Active Trend Trading Copyright ATTS 2007-2015 1 Dennis W. Wilborn, P.E. Founder, President Active Trend Trading dww@activetrendtrading.com
The Art & Science of Active Trend Trading
 Candlesticks Looking for U-Turns The Art & Science of Active Trend Trading Copywrite ATTS 2007-2015 1 Disclaimer U.S. Government Required Disclaimer Commodity Futures Trading Commission Futures and Options
How many of you are or will be trading a small account?
 Dean Storholt I am not a registered broker-dealer or investment adviser. I will mention that I consider certain securities or positions to be good candidates for the types of strategies we are discussing
The Art & Science of Active Trend Trading
 CONNECTING THE DOTS Candlesticks & Convergence of Clues The Art & Science of Active Trend Trading Copywrite ATTS 2007-2015 1 Dennis W. Wilborn, P.E. Founder, President Active Trend Trading dww@activetrendtrading.com
Mastering the Markets
 www.mastermindtraders.com Presents Mastering the Markets Your Path to Financial Freedom DISCLAIMER Neither or any of its personnel are registered broker-dealers or investment advisors. We may mention that
Lighting the Way: Using Candlestick Patterns. The Art & Science of Active Trend Trading
 Lighting the Way: Using Candlestick Patterns The Art & Science of Active Trend Trading Disclaimer U.S. Government Required Disclaimer Commodity Futures Trading Commission Futures and Options trading has
Stacking Indicators Getting a GREAT entry! TWEEZERS Tweezer top/bottom at the band The stock is trending up Gap down (against the trend) Any moving
 Any moving") Dean Storholt I am not a registered broker-dealer or investment adviser. I will mention that I consider certain securities or positions to be good candidates for the types of strategies we are discussing
Dean Storholt I am not a registered broker-dealer or investment adviser. I will mention that I consider certain securities or positions to be good candidates for the types of strategies we are discussing
Day Trading Strategies. Day Strategies. and Examples. & Risk Management COPYRIGHTED MATERIAL: ANDREW AZIZ (C)
") Day Trading Strategies Day Strategies and Examples & Risk Management ANDREW AZIZ SESSION 4 Disclaimer BearBullTraders.com employees, contractors, shareholders and affiliates, are NOT an investment advisory
Day Trading Strategies Day Strategies and Examples & Risk Management ANDREW AZIZ SESSION 4 Disclaimer BearBullTraders.com employees, contractors, shareholders and affiliates, are NOT an investment advisory
Icoachtrader Consulting Service WELCOME TO. Trading Boot Camp. Day 5
 Icoachtrader Consulting Service www.icoachtrader.weebly.com WELCOME TO Trading Boot Camp Day 5 David Ha Ngo Trading Coach Phone: 1.650.899.1088 Email: icoachtrader@gmail.com The information presented is
Candlestick Secrets for Profiting in Options Seminar Nison Candlesticks to Guide Your Option Trades. Nison Chart Challenge 7 - Read Steve s Mind
 Nison Chart Challenge 7 - Read Steve s Mind 1) How could we have used NCS after the first hammer to find a good trade set up and decrease time decay? 2) What outright or spread could we have done? 3) When
Technical Analysis Workshop Series. Session Six 1, 2, 3 Price-Bars Patterns
 Technical Analysis Workshop Series Session Six 1, 2, 3 Price-Bars Patterns DISCLOSURES & DISCLAIMERS This research material has been prepared by NUS Invest. NUS Invest specifically prohibits the redistribution
Buy Now, Paid Later. Learning LEAP Leverage Strategies. By Markay Latimer
 Buy Now, Paid Later Learning LEAP Leverage Strategies By Markay Latimer Neither Better Trades or any of its personnel are registered broker-dealers or investment advisers. I will mention that I consider
Stacking Indicators Getting a GREAT entry! TWEEZERS Tweezer top/bottom at the band The stock is trending up Gap down (against the trend) Any moving
 Any moving") Dean Storholt I am not a registered broker-dealer or investment adviser. I will mention that I consider certain securities or positions to be good candidates for the types of strategies we are discussing
Dean Storholt I am not a registered broker-dealer or investment adviser. I will mention that I consider certain securities or positions to be good candidates for the types of strategies we are discussing
Candlestick Secrets for Profiting in Options Seminar Nison Candlesticks to Guide Your Option Trades
 Nison Candlestick Secrets For Profiting in Options Presentedby Steve Nison President: candlecharts.com Quickly finding the best opportunities in the options markets Nison candlesticks for option strategies
presented by Thomas Wood MicroQuant SM Divergence Trading Workshop Day One Naked Trading Part 2
 presented by Thomas Wood MicroQuant SM Divergence Trading Workshop Day One Naked Trading Part 2 Risk Disclaimer Trading or investing carries a high level of risk, and is not suitable for all persons. Before
Candlestick Secrets for Profiting in Options Seminar Nison Candlesticks to Guide Your Option Trades
 Nison Candlestick Secrets For Profiting in Options Presented by Steve Nison President: candlecharts.com Quickly finding the best opportunities in the options markets Nison candlesticks for option strategies
Introduction. Technicians (also known as quantitative analysts or chartists) usually look at price, volume and psychological indicators over time.
 usually look at price, volume and psychological indicators over time.") Technical Analysis Introduction Technical Analysis is the study of market action, primarily through the use of charts, for the purpose of forecasting future price trends. Technicians (also known as quantitative
Technical Analysis Introduction Technical Analysis is the study of market action, primarily through the use of charts, for the purpose of forecasting future price trends. Technicians (also known as quantitative
Candlesticks Discoveries Probability of Success Aug 6, 2016
 Candlesticks Discoveries Probability of Success Aug 6, 2016 The Art & Science of Active Trend Trading Disclaimer U.S. Government Required Disclaimer Commodity Futures Trading Commission Futures and Options
2.0. Learning to Profit from Futures Trading with an Unfair Advantage! Income Generating Strategies Essential Trading Tips & Market Insights
 2.0 Learning to Profit from Futures Trading with an Unfair Advantage! Income Generating Strategies Essential Trading Tips & Market Insights Income Generating Strategies Essential Trading Tips & Market
 Disclaimer The candlestick patterns explained in this book are intended to provide information only.. Use these patterns is at your discretion. The use and application of the included patterns can involve
presented by Thomas Wood MicroQuant SM Divergence Trading Workshop Day One Black Gold
 presented by Thomas Wood MicroQuant SM Divergence Trading Workshop Day One Black Gold Risk Disclaimer Trading or investing carries a high level of risk, and is not suitable for all persons. Before deciding
Intra-Day Trading Techniques
 Pristine.com Presents Intra-Day Trading Techniques With Greg Capra Co-Founder of Pristine.com, and Co-Author of the best selling book, Tools and Tactics for the Master Day Trader Copyright 2001, Pristine
Orders, Level 2, Price Action COPYRIGHTED MATERIAL: ANDREW AZIZ (C) 1
 1") Orders, Level 2, Price Action ANDREW AZIZ SESSION 3 COPYRIGHTED MATERIAL: ANDREW AZIZ (C) WWW.BEARBULLTRADERS.COM 1 Disclaimer BearBullTraders.com employees, contractors, shareholders and affiliates, are
Orders, Level 2, Price Action ANDREW AZIZ SESSION 3 COPYRIGHTED MATERIAL: ANDREW AZIZ (C) WWW.BEARBULLTRADERS.COM 1 Disclaimer BearBullTraders.com employees, contractors, shareholders and affiliates, are
An Introduction to Candlesticks for Options Using Nison Candlesticks as the Foundation to your option trading
 Using Nison Candlesticks as the Foundation to your option trading, CMT President: Candlecharts.com Candlestick Benefits Easy to Understand Early Reversals Safety First East + West All markets All Time
 1 www.candlecharts.com 2 BONUS www. candlecharts.com/special/swing-trading-2/ 3 www. candlecharts.com/special/swing-trading-2/ 4 www. candlecharts.com/special/swing-trading-2/ 5 www. candlecharts.com/special/swing-trading-2/
Monster Market Movers
 Monster Market Movers Prerequisite Manual Better Trades Coach Robert Roy Neither Mastermind Traders or any of its personnel are registered broker-dealers or investment advisers. I will mention that I consider
The Master Trader Counter-Trend Trade Set-Ups
 The Master Trader Counter-Trend Trade Set-Ups Trading Concepts, Inc. The Master Trader Counter-Trend Trade Set-Ups By Todd Mitchell Copyright 2014 by Trading Concepts, Inc. All Rights Reserved This training
11-Hour Options 2.0 The Next Evolution of Success
 presented by Thomas Wood MicroQuant SM Identifying Key Support and Resistance Levels 11-Hour Options 2.0 The Next Evolution of Success Risk Disclaimer Trading or investing carries a high level of risk,
BONUS. www. candlecharts.com/special/swing-trading-2/
 BONUS www. candlecharts.com/special/swing-trading-2/ 1 www. candlecharts.com/special/swing-trading-2/ www. candlecharts.com/special/swing-trading-2/ www. candlecharts.com/special/swing-trading-2/ 2 www.
Knowing When to Buy or Sell a Stock
 Knowing When to Buy or Sell a Stock Overview Review & Market direction Driving forces of market change Support & Resistance Basic Charting Review & Market Direction How many directions can a stock s price
Weekly Options Secrets Revealed: A Proven Options Trading Plan
 Weekly Options Secrets Revealed: A Proven Options Trading Plan When talking about stock options there are many common questions that come up. Which strike price should I trade? Should I buy or sell the
- My 4 Favorite Trades - Essential Trades of a Professional Trader
 presented by Thomas Wood MicroQuant SM Divergence Trading Workshop Day One - My 4 Favorite Trades - Essential Trades of a Professional Trader Risk Disclaimer Trading or investing carries a high level of
Candlestick Signals and Option Trades (Part 3, advanced) Hour One
 Hour One") Candlestick Signals and Option Trades (Part 3, advanced) Hour One 1. Hedges, long and short A hedge is any strategy designed to reduce or eliminate market risk. This applies to equity positions and the
Candlestick Signals and Option Trades (Part 3, advanced) Hour One 1. Hedges, long and short A hedge is any strategy designed to reduce or eliminate market risk. This applies to equity positions and the
Strategic Trade Management. A Comprehensive Trading Plan for Managing Risk in Option Trading
 Strategic Trade Management A Comprehensive Trading Plan for Managing Risk in Option Trading 1 Neither Better Trades or any of its personnel are registered broker-dealers or investment advisers. I will
Trading Lessons from the Intraday Frame (study)
") 1 Daily "Idealized Trades" Report Trading Lessons from the Intraday Frame (study) 1 2018 TheoTrade LLC. All rights reserved. 2 Trading Lessons from the Intraday Frame (1-mi) Major Companies Reporting Earnings
1 Daily "Idealized Trades" Report Trading Lessons from the Intraday Frame (study) 1 2018 TheoTrade LLC. All rights reserved. 2 Trading Lessons from the Intraday Frame (1-mi) Major Companies Reporting Earnings
WORKBOOK. The FX Trader s EDGE BLUEPRINT ENCORE EVENT. How to Capture Low Hanging Profits in the New Year Using 3 Simple Blueprints
 WORKBOOK The FX Trader s EDGE BLUEPRINT ENCORE EVENT How to Capture Low Hanging Profits in the New Year Using 3 Simple Blueprints Jody Samuels, Juan Maldonado and Neil Bradford Disclaimer This workbook
The Strategies Working Best in Today s E-Mini Market
 The Strategies Working Best in Today s E-Mini Market Todd Mitchell Craig Hill Legal Disclaimer No claim is made by Trading Concepts, Inc. that the trading strategies shown here will result in profits and
Data-Driven Trading. Market Adaptation. Stocks & Commodities V. 29:12 (34-39): Data-Driven Trading by Steve Palmquist
: Data-Driven Trading by Steve Palmquist") be up by the end of the year, and about a quarter thought the market would be down. The second question was, How many of you do not care whether the market is up or down by the end of the year? In the
be up by the end of the year, and about a quarter thought the market would be down. The second question was, How many of you do not care whether the market is up or down by the end of the year? In the
2.0. Learning to Profit from Futures Trading with an Unfair Advantage! Income Generating Strategies Starting the Trading Day
 2.0 Learning to Profit from Futures Trading with an Unfair Advantage! Income Generating Strategies Starting the Trading Day Income Generating Strategies Starting the Trading Day Pre-Market Analysis Before
Trading Success Principles Floor Trader Pivots
 Trading Success Principles Floor Trader Pivots Trading Concepts, Inc. Trading Success Principles Floor Trader Pivots By Todd Mitchell Copyright 2014 by Trading Concepts, Inc. All Rights Reserved This training
Candlesticks What They Really Mean! March 3, 2018
 Candlesticks What They Really Mean! March 3, 2018 Active Trend Trading Dennis W. Wilborn Disclaimer U.S. Government Required Disclaimer Commodity Futures Trading Commission Futures and Options trading
Fundamental Analysis is the study of Financial Statements and Ratios which help evaluate a company s overall Value and Growth potential.
 Trading vs. Investing Investing is defined as taking a stake in a company in hopes of benefiting from their prosperity through price appreciation and dividend payouts. Fundamental Analysis is the study
Chapter Eight. Japanese Candle Chart
 Chapter Eight Japanese Candle Chart Candle chart (also called candlestick) analysis has been used since the 18 th century by Japanese rice traders to predict the rice price s movement. According to sources,
Introduction. Technical analysis is the attempt to forecast stock prices on the basis of market-derived data.
 Technical Analysis Introduction Technical analysis is the attempt to forecast stock prices on the basis of market-derived data. Technicians (also known as quantitative analysts or chartists) usually look
BUY SELL PRO. Improve Profitability & Reduce Risk with BUY SELL Pro. Ultimate BUY SELL Indicator for All Time Frames
 BUY SELL PRO Improve Profitability & Reduce Risk with BUY SELL Pro Ultimate BUY SELL Indicator for All Time Frames Risk Disclosure DISCLAIMER: Crypto, futures, stocks and options trading involves substantial
Day Trade Warrior. Chapter 5. Intraday Chart Patterns
 Day Trade Warrior Chapter 5. Intraday Chart Patterns What do we know? We have learned about Managing Risk (2:1 profit loss ratio 50% success target) We have learned how to find the Right Stocks (high relative
2.0. Learning to Profit from Futures Trading with an Unfair Advantage! The Master Trader Price Action Analysis
 2.0 Learning to Profit from Futures Trading with an Unfair Advantage! The Master Trader Is an important concept in trading, whether you re a Day Trader, Swing Trader, or Position Trader. Is in-depth Price
With that, let s dive into the steps. Step 1 Identify range bound markets on Daily or 4 Hour Charts
 If you have been trading for any length of time, you have probably noticed that the markets are moving sideways A LOT. Consolidation is a huge part of the market s balance and so it makes sense to learn
Bollinger Trading Methods. Play 1 - The Squeeze
 Overview: Play 1 - The Squeeze Play 2 - The Trend Trade Play 3 - Reversals Wrap up Bollinger Trading Methods Play 1 - The Squeeze The Squeeze The most popular strategy Looks to enter a trend early on Anticipates
PART 3 - CHART PATTERNS & TECHNICAL INDICATORS
 Tyler Chianelli s EASYOPTIONTRADING by OPTION TRADING COACH PART 3 - CHART PATTERNS & TECHNICAL INDICATORS A SIMPLE SYSTEM FOR TRADING OPTIONS WORKS IN UP, DOWN, AND SIDEWAYS MARKETS PART 3.1 - PRIMARY
Presents Mastering the Markets Trading Earnings
 www.mastermindtraders.com Presents Mastering the Markets Trading Earnings 1 DISCLAIMER Neither MasterMind Traders or any of its personnel are registered broker-dealers or investment advisors. We may mention
When traders make trading decisions based on repeated price patterns that once formed,
 Trading Strategy / Gert.Nurme@iBrokers.ee Price Action Trading Strategy Introduction WHAT IS PRICE ACTION TRADING? When traders make trading decisions based on repeated price patterns that once formed,
CHARTS. Bar Line Candlestick Charts are the basis of technical analysis They are a graphic display of price action. Notes:
 TECHNICAL ANALYSIS CHARTS Bar Line Candlestick Charts are the basis of technical analysis They are a graphic display of price action Candlestick charts have become the industry standard for technical traders.
Chapter 2.3. Technical Analysis: Technical Indicators
 Chapter 2.3 Technical Analysis: Technical Indicators 0 TECHNICAL ANALYSIS: TECHNICAL INDICATORS Charts always have a story to tell. However, from time to time those charts may be speaking a language you
Coaching Session FIVE
 Coaching Session FIVE Coaching Session FIVE Counter-Trend Trade Set-Ups Program Summary Trading Plan Execution The Master Trader Powerful Price Pattern Trades Trade Management Initial Trend Entry Trading
I Always Come Back To This One Method
 I Always Come Back To This One Method I can attribute my largest and most consistent gains to this very method of trading, It always work and never fails although I ve been known to still screw it up once
FOREX INDICATORS. THEIR PRIORITY and USE
 FOREX INDICATORS THEIR PRIORITY and USE by G. C. Smith U.S. Government Required Disclaimer Trading foreign exchange markets on margin carries a high level of risk, and may not be suitable for all investors.
Active Trend Trading Rules Review
 Active Trend Trading Rules Review Active Trend Trader: Dennis W. Wilborn A Trend Should Be Assumed to Continue in Effect Until Such Time as Its Reversal Has Been Definitely Signaled Edwards & Magee Disclaimer
Using Acceleration Bands, CCI & Williams %R
 Price Headley s Simple Trading System for Stock, ETF & Option Traders Using Acceleration Bands, CCI & Williams %R How Technical Indicators Can Help You Find the Big Trends For any type of trader, correctly
Orders, Level 2, Price Action
 Orders, Level 2, Price Action ANDREW AZIZ SESSION 3 Disclaimer BearBullTraders.com employees, contractors, shareholders and affiliates, are NOT an investment advisory service, a registered investment advisor
Forex Sentiment Report Q2 FORECAST WEAK AS LONG AS BELOW April
 Forex Sentiment Report 08 April 2015 www.ads-securities.com Q2 FORECAST WEAK AS LONG AS BELOW 1.1200 Targets on a break of 1.1534/35: 1.1740/50 1.1870/75 1.2230/35 Targets on a break of 1.0580/70: 1.0160
Trading Lessons from the Intraday Frame (study)
") 1 Daily "Idealized Trades" Report Trading Lessons from the Intraday Frame (study) 1 2018 TheoTrade LLC. All rights reserved. 2 Trading Lessons from the Intraday Frame (1-mi) 2 2018 TheoTrade LLC. All rights
1 Daily "Idealized Trades" Report Trading Lessons from the Intraday Frame (study) 1 2018 TheoTrade LLC. All rights reserved. 2 Trading Lessons from the Intraday Frame (1-mi) 2 2018 TheoTrade LLC. All rights
Chapter 2.3. Technical Indicators
 1 Chapter 2.3 Technical Indicators 0 TECHNICAL ANALYSIS: TECHNICAL INDICATORS Charts always have a story to tell. However, sometimes those charts may be speaking a language you do not understand and you
The Engulfing Trader Copyright 2014
 Www.ForexWinners.Ru Prologue and Introduction This book is for all those that are just fed up with all the hype out there in the market. So called guru s selling expensive strategies and systems guaranteeing
TRADING PLAN Trading Philosophy / Trading Psychology: Golden Trading Rules:
 TRADING PLAN Trading Philosophy / Trading Psychology: I believe that Financial Markets are 100% psychology driven. Price patterns are a reflection of the collective psychology of a large number of traders.
Naked Trading and Price Action
 presented by Thomas Wood MicroQuant SM Divergence Trading Workshop Day One Naked Trading and Price Action Risk Disclaimer Trading or investing carries a high level of risk, and is not suitable for all
50 Pips A Day Forex Strategy. How To Build A Solid Trading System. By Laurentiu Damir. Copyright 2012 by Laurentiu Damir
 50 Pips A Day Forex Strategy How To Build A Solid Trading System By Laurentiu Damir Copyright 2012 by Laurentiu Damir All rights reserved. No part of this book may be reproduced or transmitted in any form
Chapter 3. Price Action
 Chapter 3 Price Action The movement of price in any market is called Price Action. This movement is caused by the beliefs and trading systems of hundreds of thousands of worldwide traders that the market
What Came First... Fundamentals or the Technicals? By Jared Martinez
 What Came First... Fundamentals or the Technicals? By Jared Martinez I am honored to share my thoughts on our methodologies, focusing on the current technical movements and conditions of the FOREX Markets,
The Launchpad Strategy
 presented by Thomas Wood MicroQuant SM Divergence Trading Workshop Day One The Launchpad Strategy Risk Disclaimer Trading or investing carries a high level of risk, and is not suitable for all persons.
Credits And Debits. Learning How to Use Credit Spread Strategies
 Credits And Debits Learning How to Use Credit Spread Strategies Neither Better Trades or any of its personnel are registered broker-dealers or investment advisers. I will mention that I consider certain
Binary Options Trading Strategies How to Become a Successful Trader?
 Binary Options Trading Strategies or How to Become a Successful Trader? Brought to You by: 1. Successful Binary Options Trading Strategy Successful binary options traders approach the market with three
TECHNICAL INDICATORS
 TECHNICAL INDICATORS WHY USE INDICATORS? Technical analysis is concerned only with price Technical analysis is grounded in the use and analysis of graphs/charts Based on several key assumptions: Price
The Synthetic Futures Position. Goal
 The Synthetic Futures Position Goal To try to profit from a trending market using an option strategy that allows entry at a reduced cost while offering the same potential for unlimited profit (and loss)
Wave-to-Wave Trading Analysis June 1, 2012
 Trading Wave-to-Wave 1 Wave-to-Wave Trading Analysis June 1, 2012 S&P 500 Index ETF (SPY) Successful traders understand that there are waves within waves 5-minute waves inside of 60-minute waves inside
Class 7: Moving Averages & Indicators. Quick Review
 Today s Class Moving Averages Class 7: Moving Averages & Indicators 3 Key Ways to use Moving Averages Intro To Indicators 2 Indicators Strength of Lines Quick Review Great for establishing point of Support
If you have traded forex long enough, you will notice that sometimes, price has an uncanny ability to reverse exactly at or around fibonacci levels.
 Fibonacci Forex Trading Strategy With Reversal Candlesticks The Fibonacci forex trading strategy with reversal candlesticks is simply about using fibonacci retracements in conjunction with reversal candlesticks.
Test Your Chapter 1 Knowledge
 Self-Test Answers Test Your Chapter 1 Knowledge 1. Which is the preferred chart type in LOCKIT? The preferred chart type in LOCKIT is the candle chart because candle patterns are part of the decision-making
Interactive Practice Questions
 Bonus Handouts Interactive Q and A companion for video workshop Secrets of Becoming a Samurai Trader: Advanced Candlestick Charting Techniques with Steve Nison These extra handouts (which are not part
Trading the Hidden Divergence. Presented by Sunil Mangwani
 Trading the Hidden Divergence Indicators in technical analysis. Indicators along with chart patterns, trend lines, resistance / support levels etc., are an essential part of technical analysis. But there
MAGIC FOREX DIVERGENCE Trading Guide
 Tim Trush & Julie Lavrin Introducing MAGIC FOREX DIVERGENCE Trading Guide Your guide to financial freedom. Tim Trush, Julie Lavrin, T&J Profit Club, 2017, All rights reserved www.forexmystery.com Table
90 Days Trading Bonds
 90 Days Trading Bonds with Chip Cole 2015, All Rights Reserved. Order Flow Analytics, Inc. 1 Trading & Training chip@orderflowanalytics.com dbvaello@orderflowanalytics.com 2015, All Rights Reserved. Order
Apiary Fund Trading Plan
 Apiary Fund Trading Plan Position Size Always set stop < 2% of account balance. 75% of trades should be between.5% and 1% of account balance. Chart Setup OSMA and SMA Strategy Chart Setup Monitor and focus
Technical Analysis for Options Trading. Fidelity Brokerage Services LLC, Member NYSE, SIPC, 900 Salem Street, Smithfield, RI
 Technical Analysis for Options Trading Fidelity Brokerage Services LLC, Member NYSE, SIPC, 900 Salem Street, Smithfield, RI 02917 747561.2.0 Disclosures Options trading entails significant risk and is
Figure 3.6 Swing High
 Swing Highs and Lows A swing high is simply any turning point where rising price changes to falling price. I define a swing high (SH) as a price bar high, preceded by two lower highs (LH) and followed
INTERMEDIATE EDUCATION GUIDE
 INTERMEDIATE EDUCATION GUIDE CONTENTS Key Chart Patterns That Every Trader Needs To Know Continution Patterns Reversal Patterns Statistical Indicators Support And Resistance Fibonacci Retracement Moving
Copyright by Profits Run, Inc. Published by: Profits Run, Inc Beck Rd Unit F1. Wixom, MI
 DISCLAIMER: Stock, forex, futures, and options trading is not appropriate for everyone. There is a substantial risk of loss associated with trading these markets. Losses can and will occur. No system or
1. Introduction 2. Chart Basics 3. Trend Lines 4. Indicators 5. Putting It All Together
 Technical Analysis: A Beginners Guide 1. Introduction 2. Chart Basics 3. Trend Lines 4. Indicators 5. Putting It All Together Disclaimer: Neither these presentations, nor anything on Twitter, Cryptoscores.org,
Scalp Trading Strategies
 Scalp Trading Strategies Services Disclaimer (for full disclosure, see Disclaimers section of website) Information Contained within our website and affiliates is not a substitute for professional advice
Day Trading with Steve Title goes Lucas here
 Forex System Development Workshop Day Trading with Steve Title goes Lucas here www.fxrenew.com FX Renew Disclaimer The information on this site is not directed at residents in any country or jurisdiction
Resistance to support
 1 2 2.3.3.1 Resistance to support In this example price is clearly consolidated and we can expect a breakout at some time in the future. This breakout could be short or it could be long. 3 2.3.3.1 Resistance
5 Pillars of Active Trend Trading Timing is More Important than Price. ~~ W.D. Gann
 5 Pillars of Active Trend Trading Timing is More Important than Price. ~~ W.D. Gann Dennis W. Wilborn Disclaimer U.S. Government Required Disclaimer Commodity Futures Trading Commission Futures and Options
 Jack Schwager s Planned Trading Approach 1.Define your trading philosophy or system 2. Choose your markets to be traded 3. Specify your risk parameters A. Minimum risk per trade B. Stop loss strategy C.
Bollinger Bands Forex Trading Strategy With 20 Period Moving Average
 Bollinger Bands Forex Trading Strategy With 20 Period Moving Average The bollinger bands forex trading strategy with 20 period moving average is a very simple forex strategy that works very well for all
Trading Lessons from the Intraday Frame (study)
") 1 Daily "Idealized Trades" Report Trading Lessons from the Intraday Frame (study) 1 2018 TheoTrade LLC. All rights reserved. 2 Trading Lessons from the Intraday Frame (1-mi) 2 2018 TheoTrade LLC. All rights
1 Daily "Idealized Trades" Report Trading Lessons from the Intraday Frame (study) 1 2018 TheoTrade LLC. All rights reserved. 2 Trading Lessons from the Intraday Frame (1-mi) 2 2018 TheoTrade LLC. All rights
The Best Technical Indicator in the World
 The Best Technical Indicator in the World Presented by Andrew Keene Past performance is not indicative of future results. RISK DISCLAIMER Day trading, short term trading, options trading, and futures trading
THE CANDLESTICK TRADING BIBLE
 1 Content Introduction 4 Overview 6 History of Candlesticks 8 What is a Candlestick 11 Candlestick Patterns 14 The Engulfing Bar Candlestick 16 The Doji Candlestick Pattern 20 The Dragon Fly Doji Pattern
Compass FX
 SYNERGY Trading Method Disclaimer Unique experiences and past performances do not guarantee future results. Trading in the off-exchange Foreign Exchange market (Forex) is very speculative in nature, involves