Technical Analysis Workshop Series. Session Six 1, 2, 3 Price-Bars Patterns
|
|
|
- Phebe Hood
- 6 years ago
- Views:
Transcription
1 Technical Analysis Workshop Series Session Six 1, 2, 3 Price-Bars Patterns
2 DISCLOSURES & DISCLAIMERS This research material has been prepared by NUS Invest. NUS Invest specifically prohibits the redistribution of this material in whole or in part without the written permission of NUS Invest. The research officer(s) primarily responsible for the content of this research material, in whole or in part, certifies that their views are accurately expressed and they will not receive direct or indirect compensation in exchange for expressing specific recommendations or views in this research material. INTRODUCTION REVERSAL S PRACTICE
3 DISCLOSURES & DISCLAIMERS Nothing in this research material constitutes a representation that any investment strategy or recommendation contained herein is suitable or appropriate to a recipient s individual circumstances or otherwise constitutes a personal recommendation. It is published solely for information purposes, it does not constitute an advertisement and is not to be construed as a solicitation or an offer to buy or sell any securities or related financial instruments. No representation or warranty, either expressed or implied, is provided in relation to the accuracy, completeness or reliability of the information contained herein. The research material should not be regarded by recipients as a substitute for the exercise of their own judgement. Any opinions expressed in this research material are subject to change without notice. CHART TYPES REVERSAL SUPPORT & S RESISTANCE TRENDLINES & CHANNELS PIVOT POINTS S
4 Agenda Background Candlestick Anatomy Gaps 1-Bar Pattern Hammer/ Hanging Man Shooting Star/ Inverted Hammer Spinning Top Doji 2-Bars Pattern Bullish/ Bearish Engulfing Dark cloud cover/ Piercing Line Harami Tweezer Top/ Bottom 3-Bars Pattern Morning/ Evening Star Price Trading Strategies Pin Bar Setup Inside Bar Setup Fakey Bar Setup
5 Background
6 Japanese Candlestick Stresses relationship between open and close prices
 of candle stick indicates volatility Upward candlestick usually or green or blue Downward candlestick usually black or red Bearish Candle Bullish")
7 Candle Anatomy Body: Distance between open and closing Tip of upper wick/shadow: Highest price of that period Bottom of lower wick/shadow/hair: Lowest price of that period Range (length) of candle stick indicates volatility Upward candlestick usually or green or blue Downward candlestick usually black or red Bearish Candle Bullish Candle
 Effect of news after stock market closed for the day (e.g.")
8 Gaps/ Windows Gap: Current open is not the same as prior closing price No price and no volume transacted hands between the gap (area on price chart where there is no trades) Effect of news after stock market closed for the day (e.g. earnings report) Psychology: Can act as resistance/ support (news that sparked the gap is still in play)
9 Gaps Daily Chart Wal-Mart (WMT)
10 1 Price-Bar Pattern
11 1-Bar Pattern Long Lower Shadow - Bullish signal - Lower shadow must be at least the size of the real body - Longer lower shadow: more reliable that it is a bullish trend Long Upper Shadow - Bearish signal - Upper shadow must be at least the size of the real body - Longer upper shadow: more reliable that it is a bearish trend
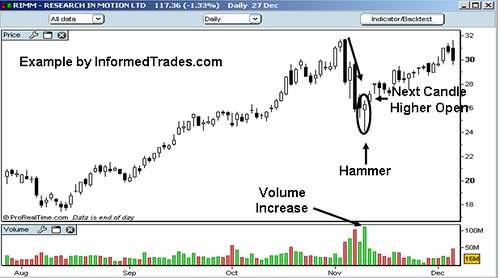
12 Hammer Found in downtrend Short body at the top of price range Little to no upper shadow Lower shadow must be at least twice the length of real-body Signals: Reversal pattern when found in a downtrend Short-term outlook indication Real body can be black or white (white: stronger signal)
13 Hammer Low reliability, requires confirmation Bullish gap for next session Subsequent session shows white real body above that of the hammer s real body Significance/ Strength: Length of Lower Shadow Colour Buyers drive prices back up to close near the highs Long lower wick indicates initial selling prices
14
15 Hanging Man Found in uptrend Short body at the top of price range Little to no upper shadow Lower shadow must be at least twice the length of real-body Warning of a potential downward Short-term outlook indication Also requires confirmation
16 Hanging Man 1. Uptrend 2. Gap Up 3. Lower Shadow at least twice as big as Real Body 4. Real Body Bullish or Bearish; better if Bearish 5. Confirmation Candle Greater gap: Higher likelihood of reversal
17 Shooting Star Found in uptrend Short body at the bottom of price range Little to no lower shadow Upper shadow must be at least twice the length of real-body Signals: Reversal pattern Short-term outlook indication Real body can be black or white (black: stronger signal)
18 Shooting Star Low reliability, requires confirmation Bearish gap for next session Subsequent session shows black real body below that of the shooting star s real body Significance/ Strength: Length of Upper Shadow Colour Long upper wick indicates initial buying prices Open Bears were able to reject bulls completely (or push prices even lower by closing below open)
19 Shooting Star 1. Uptrend 2. Upper shadow at least twice as big as real body 3. Real body bullish or bearish (bearish: stronger indication)
20 Inverted Hammer Found in downtrend Short body at the bottom of price range Little to no lower shadow Upper shadow must be at least twice the length of real-body Signals: Reversal pattern Short-term outlook indication Real body can be black or white (white: stronger signal)

21 Inverted Hammer
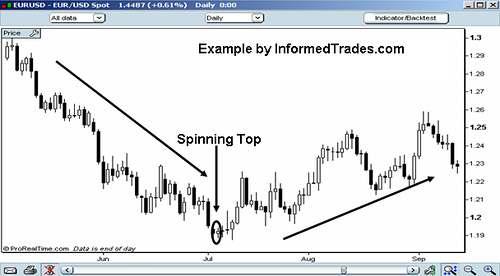
22 Spinning Top & Doji Short body in the middle of two long wicks Market closed relatively unchanged Indicates indecision ( standoff after significant price movement) Trend losing momentum; possible turning point Buyers in control Doji/ Long-legged Doji: stronger signal Open and close are the same Insignificant in sideway markets Sellers in control
23
24 More DojiPatterns Dragonfly Doji Gravestone Doji Four Price Doji Long lower, no upper Long upper, no lower Same upper, lower, open & close Very rare Low volume situations
25 2 Price-Bars Pattern

26 Bullish Engulfing Candle When found in a downtrend: Bullish candle opens lower than previous candle s close, closes higher than previous candle s open Potential sign that trend is reversing Gap down Indicates control has shifted from sellers to buyers

27 Bullish Engulfing 1. Downtrend 2. Bearish Candle 3. Gap Down 4. Bullish Candle 5. Close above previous Bearish Candle

28 Bearish Engulfing Candle When found in a uptrend: Gap Up Gap up: Bullish sign But: Bulls only push prices up slightly before bears take over and push prices much lower Potential sign that trend is reversing Indicates control has shifted from buyers to sellers

29 Bearish Engulfing Greater size difference: Increased significance 1. Uptrend 2. Bullish Candle 3. Gap Up 4. Bearish candle 5. Close below previous Bullish Candle

30 Dark Cloud Cover Bullish candle closes below the middle of previous candle Gap Up Rejection of Gap: Bearish sign Retracement: Additional significance

31 Piercing Line Pattern Bearish candle closes below the middle of previous candle Rejection of Gap: Bullish Sign Retracement: Additional significance Gap down

32 Harami Bearish Harami Large bullish, followed by small bearish Gap down, unable to retrace Uncertainty entering the market Bullish Harami Large bearish, followed by small bullish Gap up Reversal Pattern

33 Harami In an Uptrend 1. Uptrend 2. Bullish Candle 3. Gap Down 4. Small Bullish Candle In a Downtrend 1. Downtrend 2. Bearish Candle 3. Gap Up 4. Small Bullish Candle
 Sometimes eliminates entire gains from")
34 TweezerTop & Bottom Bearish Tweezer Top Day 1 Close about equal to Day 2 Open Occurs during an uptrend (closes near the high) Sentiments reverses completely the next day Bullish Tweezer Bottom Occurs during downtrend (closing the day near the lows) Sometimes eliminates entire gains from previous day
35 TweezerBottom 1. Downtrend 2. Bearish Candle 3. Day 1 Lows about equal to Day 2 Lows 4. Bullish Candle
 High of Day 3 Gap Up to Prior Highs; Bulls rejected")
36 TweezerTop High of Day 1 Resistance Line High of Day 2 (Bulls rejected) High of Day 3 Gap Up to Prior Highs; Bulls rejected again
37 3 Price-Bars Pattern
 Bullish: stronger sign Day 3: Bullish gap up Prices pushed further upward, sometimes eliminating all Day 1")
38 Morning Star Consists of 3 candlesticks Bearish Gap: Bears are in control during opening Day 2: Prices are not pushed much lower (small / neutral candlestick) Bullish: stronger sign Day 3: Bullish gap up Prices pushed further upward, sometimes eliminating all Day 1 losses

39 Morning Star 1. Downtrend 2. Bearish Candle 3. Gap Down 4. Small Bullish/ Bearish Candle 5. Gap Up 6. Bullish Candle Powerful bullish reversal pattern!

40 Evening Star Consists of 3 candlesticks: - Bullish, Small/ Neutral, Bearish Presence of bullish gap, bearish gap Day 2: Prices are not pushed much higher Bearish: stronger sign Day 3: Large bearish candlestick Prices pushed further downward, sometimes eliminating all of Day 1 s gains

41 Evening Star 1. Uptrend 2. Bullish Candle 3. Gap Up 4. Small Bullish/ Bearish Candle 5. Gap Down 6. Bullish Candle Morning Star Pattern
42 Price Acting Trading Strategies
43 Pin Bar Setup Pin bar: middle of a 3-bar formation Open and Close of pin bar is within (or very close) price range of bar 1 and 3 Shadow of pin bar sticks out Longer, more significant Pin bars occurring at important support/ resistance level can be very accurate Bullish Pin Bar Bearish Pin Bar Can be taken as counter trend if well-defined and protrude significantly from surrounding price bars Indicates strong rejection occurred Preferably on daily chart time frame
44 Pin Bar Setup Pin bars occurring the context of a trending market Obvious bullish pin bars with the overall uptrend Two large bullish pin bars bring an end to the previous downtrend
45 Inside Bar Setup Inside bar: Bar (or series of bars) completely contained within preceding bar Not the same as harami Inside bars in strong trending markets breakout plays in that direction ( pauses ) Two inside bars contained within range of mother bar Mother bar
46 Inside Bar Setup Inside bar setups traded with the near-term momentum often give rise to large moves. Daily AUDUSD chart
47 Fakey Setup Inside/Haramibar + False break, then closes back within range Fakey setup Fakey entry: triggered as price moves back up past the high of the inside bar (or the low in the case of a bearish fakey) Amateurs tried to pick market top, pros stepped in and flushed out amateurs in a flurry of buying
48 Fakey Setup Substantial push higher after false-break to the downside False-break / Fakey setup
49 Thank You! CHART CONSTRUCTION SUPPORT & RESISTANCE
50 Q & A CHART CONSTRUCTION SUPPORT & RESISTANCE
Chapter Eight. Japanese Candle Chart
 Chapter Eight Japanese Candle Chart Candle chart (also called candlestick) analysis has been used since the 18 th century by Japanese rice traders to predict the rice price s movement. According to sources,
Introduction. Technical analysis is the attempt to forecast stock prices on the basis of market-derived data.
 Technical Analysis Introduction Technical analysis is the attempt to forecast stock prices on the basis of market-derived data. Technicians (also known as quantitative analysts or chartists) usually look
Technical Analysis Workshop Series. Session Two
 Technical Analysis Workshop eries ession Two DICLOURE & DICLAIMER This research material has been prepared by NU Invest. NU Invest specifically prohibits the redistribution of this material in whole or
PART 3 - CHART PATTERNS & TECHNICAL INDICATORS
 Tyler Chianelli s EASYOPTIONTRADING by OPTION TRADING COACH PART 3 - CHART PATTERNS & TECHNICAL INDICATORS A SIMPLE SYSTEM FOR TRADING OPTIONS WORKS IN UP, DOWN, AND SIDEWAYS MARKETS PART 3.1 - PRIMARY
Introduction. Technicians (also known as quantitative analysts or chartists) usually look at price, volume and psychological indicators over time.
 usually look at price, volume and psychological indicators over time.") Technical Analysis Introduction Technical Analysis is the study of market action, primarily through the use of charts, for the purpose of forecasting future price trends. Technicians (also known as quantitative
Technical Analysis Introduction Technical Analysis is the study of market action, primarily through the use of charts, for the purpose of forecasting future price trends. Technicians (also known as quantitative
Reversal Candles. Candlestick Bearish Reversal Patterns. Bearish Confirmation. Existing Downtrend
 Candlestick Bearish Reversal Patterns There are dozens of bearish reversal patterns. We have elected to narrow the field by selecting a few of the most popular patterns for detailed explanations. Below
Candlesticks Discoveries Probability of Success Aug 6, 2016
 Candlesticks Discoveries Probability of Success Aug 6, 2016 The Art & Science of Active Trend Trading Disclaimer U.S. Government Required Disclaimer Commodity Futures Trading Commission Futures and Options
The Art & Science of Active Trend Trading
 Candlesticks Looking for U-Turns The Art & Science of Active Trend Trading Copywrite ATTS 2007-2015 1 Disclaimer U.S. Government Required Disclaimer Commodity Futures Trading Commission Futures and Options
CONNECING THE DOTS Candlesticks & Convergence of Clues. The Art & Science of Active Trend Trading
 CONNECING THE DOTS Candlesticks & Convergence of Clues The Art & Science of Active Trend Trading Disclaimer U.S. Government Required Disclaimer Commodity Futures Trading Commission Futures and Options
CHARTS. Bar Line Candlestick Charts are the basis of technical analysis They are a graphic display of price action. Notes:
 TECHNICAL ANALYSIS CHARTS Bar Line Candlestick Charts are the basis of technical analysis They are a graphic display of price action Candlestick charts have become the industry standard for technical traders.
The Art & Science of Active Trend Trading
 CONNECTING THE DOTS Candlesticks & Convergence of Clues The Art & Science of Active Trend Trading Copyright ATTS 2007-2015 1 Dennis W. Wilborn, P.E. Founder, President Active Trend Trading dww@activetrendtrading.com
JAPANESE CANDLESTICKS
 Edited by Kaspirano JAPANESE CANDLESTICKS In the 1600s, the Japanese developed a method of technical analysis to analyze the price of rice contracts. This technique is called candlestick charting. Steven
Lighting the Way: Using Candlestick Patterns. The Art & Science of Active Trend Trading
 Lighting the Way: Using Candlestick Patterns The Art & Science of Active Trend Trading Disclaimer U.S. Government Required Disclaimer Commodity Futures Trading Commission Futures and Options trading has
Technical Analysis Workshop Series. Session Three
 Technical Analysis Workshop Series Session Three DISCLOSURES & DISCLAIMERS This research material has been prepared by NUS Invest. NUS Invest specifically prohibits the redistribution of this material
Introduction...1 Part I: Getting Familiar with Candlestick Charting and Technical Analysis...7. Part V: The Part of Tens...315
 Contents at a Glance Introduction...1 Part I: Getting Familiar with Candlestick Charting and Technical Analysis...7 Chapter 1: Understanding Charting and Where Candlesticks Fit In...9 Chapter 2: Getting
The Art & Science of Active Trend Trading
 CONNECTING THE DOTS Candlesticks & Convergence of Clues The Art & Science of Active Trend Trading Copywrite ATTS 2007-2015 1 Dennis W. Wilborn, P.E. Founder, President Active Trend Trading dww@activetrendtrading.com
On Our Technical Watch
 By the Kenanga Research Team l research@kenanga.com.my Figure 1: Daily Charting FBMKLCI Index Basic Data 52-week High 1,729.13 (in Million) 52-week Low 1,600.92 KLCI Vol 199.37 Current Level 1,662.92 Bursa
Interactive Practice Questions
 Bonus Handouts Interactive Q and A companion for video workshop Secrets of Becoming a Samurai Trader: Advanced Candlestick Charting Techniques with Steve Nison These extra handouts (which are not part
Forex Sentiment Report Q2 FORECAST WEAK AS LONG AS BELOW April
 Forex Sentiment Report 08 April 2015 www.ads-securities.com Q2 FORECAST WEAK AS LONG AS BELOW 1.1200 Targets on a break of 1.1534/35: 1.1740/50 1.1870/75 1.2230/35 Targets on a break of 1.0580/70: 1.0160
 Disclaimer The candlestick patterns explained in this book are intended to provide information only.. Use these patterns is at your discretion. The use and application of the included patterns can involve
On Our Technical Watch
 By the Kenanga Research Team l research@kenanga.com.my Figure 1: Daily Charting FBMKLCI Basic Data 52-week High 1,759.76 (in Million) 52-week Low 1,611.88 KLCI Vol 129.13 Current Level 1,740.60 Bursa Vol
On Our Technical Watch
 By the Kenanga Research Team l research@kenanga.com.my Figure 1: Daily Charting FBMKLCI Index Basic Data 52-week High 1,729.13 (in Million) 52-week Low 1,600.92 KLCI Vol 85.75 Current Level 1,665.32 Bursa
TWEEZERS TOPS AND BOTTOMS
 88 The Basics TWEEZERS TOPS AND BOTTOMS Tweezers are two or more candlestick lines with matching highs or lows. They are called tweezers because they are compared to the two prongs of a tweezers. In a
Candlesticks What They Really Mean! March 3, 2018
 Candlesticks What They Really Mean! March 3, 2018 Active Trend Trading Dennis W. Wilborn Disclaimer U.S. Government Required Disclaimer Commodity Futures Trading Commission Futures and Options trading
Technical Analysis. Prepared by: Mr. SOUR Ramo
 Technical Analysis Prepared by: Mr. SOUR Ramo 1 Contain 1. Introduction 2. Candle Chart 3. Trend Analysis 4. Pattern Analysis 2 1.Introduce 1.1 What is Technical Analysis? Technical analysis is a tool
On Our Technical Watch
 By the Kenanga Research Team l research@kenanga.com.my Figure 1: Daily Charting FBMKLCI Basic Data Technical Ratings 52-week High 1,729.13 (in Million) 52-week Low 1,600.92 KLCI Vol 99.25 Current Level
On Our Technical Watch
 By the Kenanga Research Team l research@kenanga.com.my Figure 1: Daily Charting FBMKLCI Basic Data 52-week High 1,759.76 (in Million) 52-week Low 1,611.88 KLCI Vol 84.65 Current Level 1,733.93 Bursa Vol
Intra-Day Trading Techniques
 Pristine.com Presents Intra-Day Trading Techniques With Greg Capra Co-Founder of Pristine.com, and Co-Author of the best selling book, Tools and Tactics for the Master Day Trader Copyright 2001, Pristine
presented by Thomas Wood MicroQuant SM Divergence Trading Workshop Day One Naked Trading Part 2
 presented by Thomas Wood MicroQuant SM Divergence Trading Workshop Day One Naked Trading Part 2 Risk Disclaimer Trading or investing carries a high level of risk, and is not suitable for all persons. Before
On Our Technical Watch
 By the Kenanga Research Team l research@kenanga.com.my Figure 1: Daily Charting FBMKLCI Basic Data 52-week High 1,759.76 (in Million) 52-week Low 1,611.88 KLCI Vol 112.14 Current Level 1,735.84 Bursa Vol
On Our Technical Watch
 By the Kenanga Research Team l research@kenanga.com.my Figure 1: Daily Charting FBMKLCI Basic Data Technical Ratings 52-week High 1,729.13 (in Million) 52-week Low 1,600.92 KLCI Vol 93.61 Current Level
On Our Technical Watch
 By the Kenanga Research Team l research@kenanga.com.my Figure 1: Daily Charting FBMKLCI Basic Data 52-week High 1,757.99 (in Million) 52-week Low 1,611.88 KLCI Vol 137.65 Current Level 1,754.42 Bursa Vol
Technical Analysis Workshop Series. Session 11 Semester 2 Week 5 Oscillators Part 2
 Technical Analysis Workshop Series Session 11 Semester 2 Week 5 Oscillators Part 2 DISCLOSURES & DISCLAIMERS This research material has been prepared by NUS Invest. NUS Invest specifically prohibits the
On Our Technical Watch
 By the Kenanga Research Team l research@kenanga.com.my Figure 1: Daily Charting FBMKLCI Basic Data 52-week High 1,729.13 (in Million) 52-week Low 1,611.88 KLCI Vol 166.34 Current Level 1,708.08 Bursa Vol
On Our Technical Watch
 By Lawrence Yeo Eng Chien l lawrenceyeo@kenanga.com.my Figure 1: Daily Charting FBMKLCI Basic Data 52-week High 1,795.00 (in Million) 52-week Low 1,611.88 KLCI Vol 136.57 Current Level 1,791.01 Bursa Vol
How to Spot Candlestick Formations in the Stock Market & What to Do Once You Spot Them
 How to Spot Candlestick Formations in the Stock Market & What to Do Once You Spot Them WHAT IS A CANDLESTICK? ACandlestick measures price fluctuations within a defined period of time. Colors differentiate
On Our Technical Watch
 By the Kenanga Research Team l research@kenanga.com.my Figure 1: Daily Charting FBMKLCI Basic Data 52-week High 1,757.99 (in Million) 52-week Low 1,611.88 KLCI Vol 174.33 Current Level 1,748.30 Bursa Vol
On Our Technical Watch
 By the Kenanga Research Team l research@kenanga.com.my Figure 1: Daily Charting FBMKLCI Basic Data 52-week High 1,759.76 (in Million) 52-week Low 1,611.88 KLCI Vol 140.99 Current Level 1,738.18 Bursa Vol
Test Your Chapter 1 Knowledge
 Self-Test Answers Test Your Chapter 1 Knowledge 1. Which is the preferred chart type in LOCKIT? The preferred chart type in LOCKIT is the candle chart because candle patterns are part of the decision-making
Agenda. Who is Recognia. Event Driven Technical Analysis. Types of Technical Events. Finding and Validating Ideas using Recognia Q & A
 Disclaimer The information presented here is for educational and informational purposes only. The inclusion of any specific securities detailed is for illustrative purposes only. No information contained
On Our Technical Watch
 By Lawrence Yeo Eng Chien / lawrenceyeo@kenanga.com.my ; Steven Chan / steven.chan@kenanga.com.my; Muhammad Afif Zulkaplly / muhammad.afif@kenanga.com.my Figure 1: Daily Charting FBMKLCI Basic Data 52-week
THE CANDLESTICK TRADING BIBLE
 1 Content Introduction 4 Overview 6 History of Candlesticks 8 What is a Candlestick 11 Candlestick Patterns 14 The Engulfing Bar Candlestick 16 The Doji Candlestick Pattern 20 The Dragon Fly Doji Pattern
On Our Technical Watch
 By Lawrence Yeo / lawrenceyeo@kenanga.com.my; Steven Chan / steven.chan@kenanga.com.my; Muhammad Afif Bin Zulkaplly / muhammad.afif@kenanga.com.my Figure 1: Daily Charting FBMKLCI Basic Data 52-week High
On Our Technical Watch
 By Lawrence Yeo / lawrenceyeo@kenanga.com.my; Steven Chan / steven.chan@kenanga.com.my; Muhammad Afif Bin Zulkaplly / muhammad.afif@kenanga.com.my Figure 1: Daily Charting FBMKLCI Basic Data 52-week High
S&P Cash Long Term: Uptrend Intact. Monthly Log Chart
 Andy Dodd MSTA - +44 020 7031 4651 adodd@louiscapital.com Twitter : @louiscaptech S&P Cash Long Term: Uptrend Intact Despite an initial slowdown in momentum following the break above 2120 in July, which
Trading Stocks Successfully. Ten Primary Reversal Patterns
 Trading Stocks Successfully Ten Primary Reversal Patterns TRADING RISK DISCLAIMER All the information shared in this course is provided for educational purposes only. Any trades placed upon reliance on
The Most Important Price Action Patterns for Babon Traders
 The Most Important Price Action Patterns for Babon Traders There are dozens of different Price Action formations and Japanese candles' formations, as a matter of fact almost any so called "expert" and
Candlestick Secrets for Profiting in Options Seminar The Foundation of Options
 Option Spreads 45 Bull Vertical Spreads Bull call (debit) & Bull put (credit) 46 Bull Call Spreads Buy lower strike (95) call Sell higher strike (100) call (same expiration) Which of these two strikes
CMT LEVEL I CURRICULUM Self-Evaluation
 CMT LEVEL I CURRICULUM Self-Evaluation DEAR CFA CHARTERHOLDER, As a CFA charterholder, the requirement that you sit for the CMT Level I exam is waived. However, the content in the CMT Level I Curriculum
On Our Technical Watch
 By the Kenanga Research Team l research@kenanga.com.my Figure 1: Daily Charting FBMKLCI Basic Data 52-week High 1,759.76 (in Million) 52-week Low 1,611.88 KLCI Vol 142.09 Current Level 1,744.67 Bursa Vol
On Our Technical Watch
 By the Kenanga Research Team l research@kenanga.com.my Figure 1: Daily Charting FBMKLCI Basic Data 52-week High 52-week Low Current Level Intraday High Intraday Low 1,729.13 1,611.88 1,688.84 1,690.91
Trend Channels: How to Identify Easy Profit-Making Opportunities Using Simple Chart Analysis
 Trend Channels: How to Identify Easy Profit-Making Opportunities Using Simple Chart Analysis Trend channels produce a very powerful trading technique. They are very visible, which makes them easy to utilize
2.0. Learning to Profit from Futures Trading with an Unfair Advantage! The Master Trader Price Action Analysis
 2.0 Learning to Profit from Futures Trading with an Unfair Advantage! The Master Trader Is an important concept in trading, whether you re a Day Trader, Swing Trader, or Position Trader. Is in-depth Price
FOREX. analysing made easy. UNDERSTANDING TECHNICAL ANALYSIS An educational tool by Blackwell Global
 FOREX analysing made easy UNDERSTANDING TECHNICAL ANALYSIS An educational tool by Blackwell Global Risk Warning: Forex and CFDs are leveraged products and you may lose your initial deposit as well as substantial
 1 www.candlecharts.com 2 BONUS www. candlecharts.com/special/swing-trading-2/ 3 www. candlecharts.com/special/swing-trading-2/ 4 www. candlecharts.com/special/swing-trading-2/ 5 www. candlecharts.com/special/swing-trading-2/
INTERMEDIATE EDUCATION GUIDE
 INTERMEDIATE EDUCATION GUIDE CONTENTS Key Chart Patterns That Every Trader Needs To Know Continution Patterns Reversal Patterns Statistical Indicators Support And Resistance Fibonacci Retracement Moving
Mastering the Markets
 www.mastermindtraders.com Presents Mastering the Markets Your Path to Financial Freedom DISCLAIMER Neither or any of its personnel are registered broker-dealers or investment advisors. We may mention that
S&P Cash Long Term: Uptrend Intact. Monthly Log Chart
 Andy Dodd MSTA - +44 020 7031 4651 adodd@louiscapital.com Twitter : @louiscaptech S&P Cash Long Term: Uptrend Intact Despite an initial slowdown in momentum following the break above 2120 in July, which
Candlestick Forum Boot Camp. High Profit Patterns. Why is it important to know the patterns? Eliminates emotions
 Candlestick Forum Boot Camp High Profit Patterns Why is it important to know the patterns? Eliminates emotions 1 Advanced Candlestick Patterns Fry Pan Bottom Dumpling Top Cradle Pattern Jay-Hook Scoop
DAILY DAY TRADING PLAN
 DAILY DAY TRADING PLAN Gatherplace will be used to place all of your trades. You will be using the 5 minute chart for the trade setup and the 1 minute chart for your entry, stop and trailing stop.you will
SXXP *351.51* Key Resistance
 Andy Dodd MSTA - +44 020 7031 4651 adodd@louiscapital.com Twitter : @louiscaptech Equity Index Technical Dashboard The table below is intended as an easy to read reference of key levels and trends. For
Part 2: ASX charts - more charting tools. OHLC / Bar chart
 Part 2: ASX charts - more charting tools OHLC / Bar chart A bar chart simply takes the information from the day's trading and plots that information on a single vertical 'bar'. A tab on the left side of
Candlestick Signals and Option Trades (Part 3, advanced) Hour One
 Hour One") Candlestick Signals and Option Trades (Part 3, advanced) Hour One 1. Hedges, long and short A hedge is any strategy designed to reduce or eliminate market risk. This applies to equity positions and the
Candlestick Signals and Option Trades (Part 3, advanced) Hour One 1. Hedges, long and short A hedge is any strategy designed to reduce or eliminate market risk. This applies to equity positions and the
Presents. SPY the MARKET. With. Bill Corcoran
 Presents SPY the MARKET With Bill Corcoran I am not a registered broker-dealer or investment adviser. I will mention that I consider certain securities or positions to be good candidates for the types
Candlestick Secrets for Profiting in Options Seminar Nison Candlesticks to Guide Your Option Trades. Nison Chart Challenge 7 - Read Steve s Mind
 Nison Chart Challenge 7 - Read Steve s Mind 1) How could we have used NCS after the first hammer to find a good trade set up and decrease time decay? 2) What outright or spread could we have done? 3) When
2 Powerful Price Patterns & Simple Truth About Trends. Trading Concepts, Inc.
 2 Powerful Price Patterns & Simple Truth About Trends RANGE Price Action Analysis Interpreting the OPEN, HIGH, LOW, & CLOSE on a Price Bar or Candlestick & comparing it to the Prior Price Bar or Candlestick
Technical Analysis Workshop Series. Session Eight Commodity Channel Index
 Technical Analysis Workshop Series Session Eight DISCLOSURES & DISCLAIMERS This research material has been prepared by NUS Invest. NUS Invest specifically prohibits the redistribution of this material
On Our Technical Watch
 By Lawrence Yeo / lawrenceyeo@kenanga.com.my; Steven Chan / steven.chan@kenanga.com.my; Muhammad Afif Bin Zulkaplly / muhammad.afif@kenanga.com.my Figure 1: Daily Charting FBMKLCI Basic Data 52-week High
BONUS. www. candlecharts.com/special/swing-trading-2/
 BONUS www. candlecharts.com/special/swing-trading-2/ 1 www. candlecharts.com/special/swing-trading-2/ www. candlecharts.com/special/swing-trading-2/ www. candlecharts.com/special/swing-trading-2/ 2 www.
TRADING ACADEMY MODULE-3 TECHNICAL ANALYSIS SECTION-6 PRICE ACTION. LEVEL-1: THE COMPLETE GUIDE TO TRADING FOREX & CFDs
 TRADING ACADEMY LEVEL-1: THE COMPLETE GUIDE TO TRADING FOREX & CFDs MODULE-3 TECHNICAL ANALYSIS SECTION-6 PRICE ACTION TRADING ACADEMY LIMITED MODULE-3: TECHNICAL ANALYSIS SECTION-6: PRICE ACTION TRADING
Syl Desaulniers Nison Certified Trainer Nison Candle Software Tech Support
 Syl Desaulniers Nison Certified Trainer Nison Candle Software Tech Support Legal Notice: This webcast and recording is Candlecharts.com and may not be copied, retransmitted, nor distributed in any manner
By Tri, Senior Analyst
 1/1/2014 Trend Following By Tri, Senior Analyst NUS Students Investment Society NATIONAL UNIVERSITY OF SINGAPORE Introduction Trend following was introduced by Richard Dennis when he taught trading strategies
SXXP and SX5E nearing their downtrends. Gold remains a short in line with the trend. Dollar index at key support. EURUSD bearish candle
 Andy Dodd MSTA - +44 020 7031 4651 adodd@louiscapital.com Twitter : @louiscaptech SXXP and SX5E nearing their downtrends. Gold remains a short in line with the trend Dollar index at key support EURUSD
CANDLE STICK SIGNALS. This book is given for reference. So readers may or may not read it.
 CANDLE STICK SIGNALS This book is given for reference. So readers may or may not read it. : The History of Japanese Candlesticks : Throughout Candlestick Analysis you are going to find many war-like references.
Technical analysis & Charting The Foundation of technical analysis is the Chart.
 Technical analysis & Charting The Foundation of technical analysis is the Chart. Charts Mainly there are 2 types of charts 1. Line Chart 2. Candlestick Chart Line charts A chart shown below is the Line
An Introduction to Candlesticks for Options Using Nison Candlesticks as the Foundation to your option trading
 Using Nison Candlesticks as the Foundation to your option trading, CMT President: Candlecharts.com Candlestick Benefits Easy to Understand Early Reversals Safety First East + West All markets All Time
BUY SELL PRO. Improve Profitability & Reduce Risk with BUY SELL Pro. Ultimate BUY SELL Indicator for All Time Frames
 BUY SELL PRO Improve Profitability & Reduce Risk with BUY SELL Pro Ultimate BUY SELL Indicator for All Time Frames Risk Disclosure DISCLAIMER: Crypto, futures, stocks and options trading involves substantial
Figure 3.6 Swing High
 Swing Highs and Lows A swing high is simply any turning point where rising price changes to falling price. I define a swing high (SH) as a price bar high, preceded by two lower highs (LH) and followed
Technical Analysis Workshop Series. Session Ten Semester 2 Week 4 Oscillators Part 1
 Technical Analysis Workshop Series Session Ten Semester 2 Week 4 Oscillators Part 1 DISCLOSURES & DISCLAIMERS This research material has been prepared by NUS Invest. NUS Invest specifically prohibits the
Stephen W. Bigalow Over 30 years of investment experience, including eight years as a stockbroker with major Wall Street firms.
 Stephen W. Bigalow Over 30 years of investment experience, including eight years as a stockbroker with major Wall Street firms. Business and Economics degree from Cornell University Active member of AAPTA,
EU50 Future (VG1) Futures: Short Term View / Levels. Andy Dodd - MSTA adodd 25th April 2018.
 Futures: Short Term View / Levels. Andy Dodd - MSTA adodd 25th April 2018.") Andy Dodd - MSTA +44 20 7031 4651 Twitter @louiscaptech adodd 2018 EU50 Future (VG1) Daily Chart Position Supports Resistances Position Size Short 3391 3354 3336 3319 3282 3418 3441 3481 3502 100% 3286
Andy Dodd - MSTA +44 20 7031 4651 Twitter @louiscaptech adodd 2018 EU50 Future (VG1) Daily Chart Position Supports Resistances Position Size Short 3391 3354 3336 3319 3282 3418 3441 3481 3502 100% 3286
Tradeciety s Price Action Guide
 Tradeciety s Price Action Guide Welcome... 3 Who am I?... 3 Some impressions from my trading & traveling lifestyle... 4 What Is Price Action?... 6 Candlesticks vs. Chart patterns... 7 Top 3 Candlestick
Introduction to Technical Analysis
 Introduction to Technical Analysis All About Chart Patterns, Candlesticks and Technical Studies rjofutures.rjobrien.com 800-441-1616 A division of R.J. O Brien Important Information About Trading Futures
Candlestick Secrets for Profiting in Options Seminar Nison Candlesticks to Guide Your Option Trades
 Nison Candlestick Secrets For Profiting in Options Presentedby Steve Nison President: candlecharts.com Quickly finding the best opportunities in the options markets Nison candlesticks for option strategies
Candlestick Secrets for Profiting in Options Seminar Nison Candlesticks to Guide Your Option Trades
 Nison Candlestick Secrets For Profiting in Options Presented by Steve Nison President: candlecharts.com Quickly finding the best opportunities in the options markets Nison candlesticks for option strategies
3 Price Action Signals to Compliment ANY Approach to ANY Market
 3 Price Action Signals to Compliment ANY Approach to ANY Market Introduction: It is important to start this report by being clear that these signals and tactics for using Price Action are meant to compliment
The 4 Step Process for FOREX Trading Mastery
 The 4 Step Process for FOREX Trading Mastery The 4 Step Process for FOREX Trading Mastery 1. Identifying Market Condition 2. Identifying a Trade Set-Up Steps 1 & 2 were discussed in the 2 nd Video 3. Determining
Equities: Weekly Technical Overview 2nd October 2016
 Andy Dodd MSTA - +44 020 7031 4651 adodd@louiscapital.com Twitter : @louiscaptech Equities: Weekly Technical Overview 2nd October 2016 Equity Index Technical Dashboard The table below is intended as an
The Advanced Binary Options E-Book From SuperTraderTV
 The Advanced Binary Options E-Book From SuperTraderTV Welcome to SuperTraderTV's Advanced Binary Options E-Book This easy-to-use e-book will take the complex topic of Binary Options and make it simple
GBPUSD: downtrend intact but room for more upside short term
 Andy Dodd MSTA - +44 020 7031 4651 adodd@louiscapital.com Twitter : @louiscaptech SX5E: at downtrend SXXP: Potential bullish break but needs confirmation DAX: target reached and rally tiring SPX: 2543
Orders, Level 2, Price Action COPYRIGHTED MATERIAL: ANDREW AZIZ (C) 1
 1") Orders, Level 2, Price Action ANDREW AZIZ SESSION 3 COPYRIGHTED MATERIAL: ANDREW AZIZ (C) WWW.BEARBULLTRADERS.COM 1 Disclaimer BearBullTraders.com employees, contractors, shareholders and affiliates, are
Orders, Level 2, Price Action ANDREW AZIZ SESSION 3 COPYRIGHTED MATERIAL: ANDREW AZIZ (C) WWW.BEARBULLTRADERS.COM 1 Disclaimer BearBullTraders.com employees, contractors, shareholders and affiliates, are
THE USE OF CHARTS FOR THE TECHNICAL ANALYSIS OF THE SHARES QUOTED ON THE STOCK EXCHANGE
 THE USE OF CHARTS FOR THE TECHNICAL ANALYSIS OF THE SHARES QUOTED ON THE STOCK EXCHANGE Siminic Marian University of Craiova, Faculty of Economics and Business Administration, Craiova, 13 A.I. Cuza st,
Knowing When to Buy or Sell a Stock
 Knowing When to Buy or Sell a Stock Overview Review & Market direction Driving forces of market change Support & Resistance Basic Charting Review & Market Direction How many directions can a stock s price
Introduction. Leading and Lagging Indicators
 1/12/2013 Introduction to Technical Indicators By Stephen, Research Analyst NUS Students Investment Society NATIONAL UNIVERSITY OF SINGAPORE Introduction Technical analysis comprises two main categories:
DAILY TECHNICAL REPORT
 RESEARCH TEAM DAILY TECHNICAL REPORT DISCLAIMER & DISCLOSURES Please read the disclaimer and the disclosures which can be found at the end of this report EUR / USD Grinding higher. EUR/USD continues its
Class 6: Trading the Lanes (In-depth Line Drawing and Charting) Review of Class So Far
 Review of Class So Far") Today s Class Class 6: Trading the Lanes (In-depth Line Drawing and Charting) Review of class so far Where we are going from here More in-depth technical analysis Trading with brackets (neutral trading)
Today s Class Class 6: Trading the Lanes (In-depth Line Drawing and Charting) Review of class so far Where we are going from here More in-depth technical analysis Trading with brackets (neutral trading)
Day Trading Strategies. Day Strategies. and Examples. & Risk Management COPYRIGHTED MATERIAL: ANDREW AZIZ (C)
") Day Trading Strategies Day Strategies and Examples & Risk Management ANDREW AZIZ SESSION 4 Disclaimer BearBullTraders.com employees, contractors, shareholders and affiliates, are NOT an investment advisory
Day Trading Strategies Day Strategies and Examples & Risk Management ANDREW AZIZ SESSION 4 Disclaimer BearBullTraders.com employees, contractors, shareholders and affiliates, are NOT an investment advisory
Wedge Pattern Breakouts: Explosive Winning Trades
 Wedge Pattern Breakouts: Explosive Winning Trades Prices move in patterns! This is due to one basic investment truism. Human nature exhibits the same habits when it comes to managing investment funds which
DAILY TECHNICAL REPORT
 RESEARCH TEAM DAILY TECHNICAL REPORT DISCLAIMER & DISCLOSURES Please read the disclaimer and the disclosures which can be found at the end of this report EUR / USD Further sideways trading. EUR/USD sideways