Day Trade Warrior. Chapter 5. Intraday Chart Patterns
|
|
|
- Harriet Welch
- 6 years ago
- Views:
Transcription

1 Day Trade Warrior Chapter 5. Intraday Chart Patterns
2 What do we know? We have learned about Managing Risk (2:1 profit loss ratio 50% success target) We have learned how to find the Right Stocks (high relative volume) We have learned what good Daily Charts look like and how to find pockets or windows of no support/resistance
3 How to find Entries? We know the right stocks how to we find buy and sell spots? CHART PATTERNS Flags are my favorite HFT s can t find patterns the way retail Traders can, that s why patterns work best on stocks everyone is trading that day.
4 Intraday vs Daily charts When we have a super strong stock it can override a poor daily chart. A great daily chart usually can t override a poor intraday chart or a lack of intraday volume Focus on the stock being a Stock in Play! Some of the biggest home run trades will have both great daily and intraday charts
5 Volume Makes the Pattern We NEED volume to make a pattern resolve. Without volume, the pattern will fail. Ask, do we have High Relative Volume? Is Volume coming in at the Breakout Spot? Volume confirms we are right, other people see the pattern too!
6 Trend Continuation Setups Breakouts are Best 9:30-12 We look to get into a stock already trending. We must look for safe entries. We can trade Pull Backs and Breakouts. We set tight stop because we are buying stocks usually somewhat extended. I find the cleanest breakouts occur at the open then slow down going into Lunch at 12noon. Afternoon setups usually only work if there is really good consolidation with a TIGHT stop.
7 Trend Continuation Requirements We look for immediate resolution or we bail out. Ideal Trending Stocks have clean Daily Charts with Windows We trade most aggressively 9:30-10am and 3:30pm-4pm. The first 30min and last 30min is when we typically see the most momentum.
8 Catalyst Required For Trending Stocks I like to know there is a catalyst. A catalyst can be earnings, press release, or other type of news that impacts the stock. This gives us the reason traders will be excited to trade this stock. We want to be trading the stocks everyone is talking about. They are being closely watched, and will typically have cleaner FOLLOW THROUGH.
9 Flat Top Breakout Pattern Ascending Wedge Patterns This is one of my Favorite Patterns Coiling is good, Period of Consolidation We don t want to see a U shape or Double Top formation, this is bearish. Flat Top Breakouts are a PATTERN
10 Flat Top Pattern Entry Indicators I look to buy the resistance breakout and set my stop at the low of the last 5minutes candle. If I don t get immediately breakout, I often sell ½ or all my position and wait. We should see quick resolution when these ascending wedges breakout. The long period of coiling is building strength for the break. If the break doesn t come with volume, it s also a bad sign.
11 Flat Top Pattern Exit Indicators Stop is the low of the last 5min candle If I risk 10 cents my goal is to make 20 cents. Once I can sell ½ at 20 cents, I will adjust my stop to breakeven to protect profits. At this point, I will use a trailing stop, adjust my stop as the stock moves up.

12 Intraday and Daily Coming Together

13 Flat Top Breakout

14 Flat Top Breakout

15 Flat Top Breakout

16 Flat Top Breakout

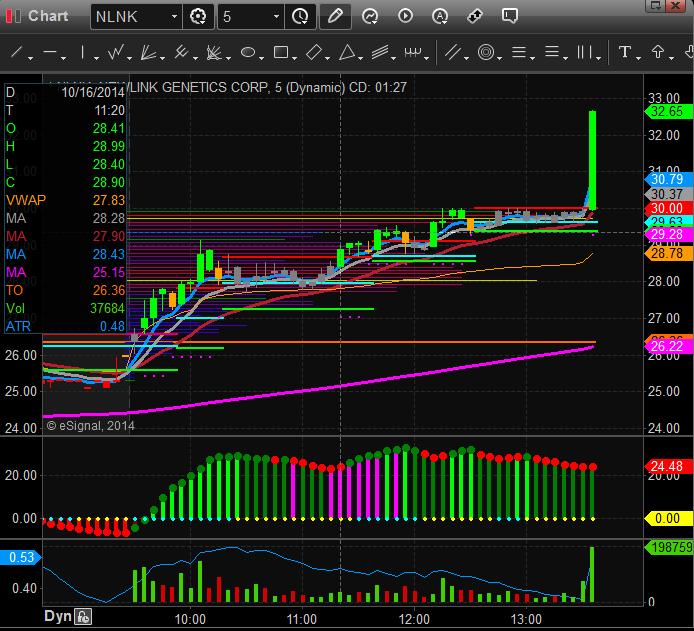
17 Flat Top Breakout Pattern

18 Flat Bottom Breakdowns Pattern
19 Bull Flag Pattern Bull Flags are a little riskier but work best on high volume stocks in the morning. I look for these patterns and then trade them on the Surging Up/Momentum Strategy I will review tomorrow Quick Ramp up, small pull back, then go
20 Bull Flag Pattern - Entry Requirements I Look for a sharp ramp up, and a small pull back. The pull back can t be more than 30% of the move up, and MUST hold the 50% retracement line. I buy the first candle (1min if heavy opening range vol, 5min if lighter mid-day vol) to make a new high. Stop is at the low of the pull back.
21 Bull Flag Pattern - Exit Indicators Like the Flat Top Exit Indicators, I set my stop at the low of the last 5min candle, and will keep a partial position as long as possible. Once I have hit my 2:1 profit loss ratio, I will sell ½ and adjust my stop to breakeven.

22 Bull Flag Breakout Pattern

23 Bull Flag Breakout Pattern

24 High Flying Bull Flag Pattern with excellent daily chart

25 Bull Flag Breakout Pattern

26 Bull Flag Breakout Pattern

27 Bull Flag Pattern (volume)
28 Bear Flags Bear Flags will have a quick drop, then a few candles of bouncing. Then more selling. Any pause in Selling is considered Bearish Entry requirements and Exit Indicators are the same as Bull Flags except in reverse.

29 Bear Flags
30 Moving Average Pull Back Pattern (essentially a longer forming flag) Many Stocks will Trend Up and Pull Back to a Moving Average before another Move up. These Pull Backs are Buying Opportunities if the Moving Averages Hold Which Moving Average is in Play? 5ema, 9ema, 20ema, etc Smart Buyers look to buy the 1 st pull back on a strong stock Therefore, we must scan for stocks making a QUICK move, and try to be one of the buyers

31 Moving Average Pull Back Pattern
32 News & IPO Trades Always Remember to Let the Dust Settle When News Breaks, The combination of high frequency Traders and aggressive retail traders can create huge volatility. News is risky! Wait until a PATTERN is forming, bull flag, flat top, etc. Volume 1 st candle, 200k shares, 2 nd candle, 20k shares, NO GOOD

33 News example

34 News example

35 IPO example
36 Intraday Chart Patterns We focus on strong intraday chart patterns as another measure to reduce our risk. All the steps we ve taken, from stock selection to pattern selection, are based on reducing risk and improving our probability for success.
37 Extras & Links me with questions
Day Trade Warrior. Introduction to Trading
 Day Trade Warrior Introduction to Trading Introduction to Trading I m a Pattern Trader! I trade Patterns I can lose 40% of the time and still make money because I use Risk Management Principals. Over 60%
Day Trade Warrior. Advanced Trading Course Daily Chart Patterns & Understanding Triggers & Windows
 Day Trade Warrior Advanced Trading Course Daily Chart Patterns & Understanding Triggers & Windows Charting is Technical Analysis Technical Analysis is a form of interpreting price action and critical areas
- My 4 Favorite Trades - Essential Trades of a Professional Trader
 presented by Thomas Wood MicroQuant SM Divergence Trading Workshop Day One - My 4 Favorite Trades - Essential Trades of a Professional Trader Risk Disclaimer Trading or investing carries a high level of
Technicals & Time Frame
 Advanced Charting Neither Better Trades or any of its personnel are registered broker-dealers or investment advisers. I will mention that I consider certain securities or positions to be good candidates
Nov 7 th, 2010 By: Chris Vermeulen. SPX s Running Correction, Gold Shines, Cup of Oil Breaks Out!
 Nov 7 th, 2010 By: Chris Vermeulen SPX s Running Correction, Gold Shines, Cup of Oil Breaks Out! The financial markets continue to climb the wall of worry on the back of more Fed Quantitative Easing. Those
Tommy s Revenge 2.0 Module 2 Part 2
 1 Mark Deaton here with your follow-up to Module 2. Going to cover a few things in this video and try to keep it short and sweet. We re going to look at Stock Fetcher and how we can use Stock Fetcher to
Free signal generator for traders
 Free signal generator for traders Trader s Bulletin Pivot Point Trading Strategy 1. Just download the FREE tool 2. Key in a few numbers 3. And follow the simple techniques by Mark Rose To make money from
Day Trading Strategies. Day Strategies. and Examples. & Risk Management COPYRIGHTED MATERIAL: ANDREW AZIZ (C)
") Day Trading Strategies Day Strategies and Examples & Risk Management ANDREW AZIZ SESSION 4 Disclaimer BearBullTraders.com employees, contractors, shareholders and affiliates, are NOT an investment advisory
Day Trading Strategies Day Strategies and Examples & Risk Management ANDREW AZIZ SESSION 4 Disclaimer BearBullTraders.com employees, contractors, shareholders and affiliates, are NOT an investment advisory
BUY SELL PRO. Improve Profitability & Reduce Risk with BUY SELL Pro. Ultimate BUY SELL Indicator for All Time Frames
 BUY SELL PRO Improve Profitability & Reduce Risk with BUY SELL Pro Ultimate BUY SELL Indicator for All Time Frames Risk Disclosure DISCLAIMER: Crypto, futures, stocks and options trading involves substantial
 Jack Schwager s Planned Trading Approach 1.Define your trading philosophy or system 2. Choose your markets to be traded 3. Specify your risk parameters A. Minimum risk per trade B. Stop loss strategy C.
Naked Trading and Price Action
 presented by Thomas Wood MicroQuant SM Divergence Trading Workshop Day One Naked Trading and Price Action Risk Disclaimer Trading or investing carries a high level of risk, and is not suitable for all
INTERMEDIATE EDUCATION GUIDE
 INTERMEDIATE EDUCATION GUIDE CONTENTS Key Chart Patterns That Every Trader Needs To Know Continution Patterns Reversal Patterns Statistical Indicators Support And Resistance Fibonacci Retracement Moving
How to Day Trade with the VWAP COPYRIGHT (C) ANDREW AZIZ
 ANDREW AZIZ") How to Day Trade with the VWAP Disclaimer BearBullTraders.com employees, contractors, shareholders and affiliates, are NOT an investment advisory service, a registered investment advisor or a broker-dealer
How to Day Trade with the VWAP Disclaimer BearBullTraders.com employees, contractors, shareholders and affiliates, are NOT an investment advisory service, a registered investment advisor or a broker-dealer
DAILY DAY TRADING PLAN
 DAILY DAY TRADING PLAN Gatherplace will be used to place all of your trades. You will be using the 5 minute chart for the trade setup and the 1 minute chart for your entry, stop and trailing stop.you will
Presents. SPY the MARKET. With. Bill Corcoran
 Presents SPY the MARKET With Bill Corcoran I am not a registered broker-dealer or investment adviser. I will mention that I consider certain securities or positions to be good candidates for the types
11-Hour Options 2.0 The Next Evolution of Success
 presented by Thomas Wood MicroQuant SM Identifying Key Support and Resistance Levels 11-Hour Options 2.0 The Next Evolution of Success Risk Disclaimer Trading or investing carries a high level of risk,
Trading Lessons from the Intraday Frame (study)
") 1 Daily "Idealized Trades" Report Trading Lessons from the Intraday Frame (study) 1 2018 TheoTrade LLC. All rights reserved. 2 Trading Lessons from the Intraday Frame (1-mi) 2 2018 TheoTrade LLC. All rights
1 Daily "Idealized Trades" Report Trading Lessons from the Intraday Frame (study) 1 2018 TheoTrade LLC. All rights reserved. 2 Trading Lessons from the Intraday Frame (1-mi) 2 2018 TheoTrade LLC. All rights
6 TRADE SETUPS YOU CAN START USING RIGHT NOW. includes: Ryan's top charting patterns
 6 TRADE SETUPS YOU CAN START USING RIGHT NOW includes: Ryan's top charting patterns SharePlanner's Top Setups for TRADING LONG & SHORT Far too often we clutter our trading strategy with hundreds of different
Trade Setups, Rules & Trading Strategies
 Trade Setups, Rules & Trading Strategies dba of FreeTradingVideos.com, Inc. v.1411 Using Technical Analysis to Enter, Manage and Exit Trades Quote of the Day At Grok Trade, we do not trade Trading Patterns.
Trade Ideas A.I. Strategy Descriptions Revised : 10/04/2017
 Trade Ideas A.I. Strategy Descriptions Revised : 10/04/2017 The 5 Day Bounce The trigger for this alert has to cross above resistance while also making a 60 minute high on stocks that are trying to bounce
Page 1 of 96 Order your Copy Now Understanding Chart Patterns
 Page 1 of 96 Page 2 of 96 Preface... 5 Who should Read this book... 6 Acknowledgement... 7 Chapter 1. Introduction... 8 Chapter 2. Understanding Charts Convention used in the book. 11 Chapter 3. Moving
Stacking Indicators Getting a GREAT entry! TWEEZERS Tweezer top/bottom at the band The stock is trending up Gap down (against the trend) Any moving
 Any moving") Dean Storholt I am not a registered broker-dealer or investment adviser. I will mention that I consider certain securities or positions to be good candidates for the types of strategies we are discussing
Dean Storholt I am not a registered broker-dealer or investment adviser. I will mention that I consider certain securities or positions to be good candidates for the types of strategies we are discussing
Technical Analysis Indicators
 Technical Analysis Indicators William s Percent R Rules, Scans, Adding Filters, Breakout, Retest, and Application across MTFs Course Instructor: Price Headley, CFA, CMT BigTrends Coaching Access to BigTrends
Naked Trading - Double Top Chart Pattern Strategy
 Naked Trading - Double Top Chart Pattern Strategy If you really want to learn a profitable way to trade then look no further, the Double Top chart pattern strategy uses simple and sound trading principles
2010. Trading Concepts, Inc. All Rights Reserved. For More Information Please Visit
 E-Mini Volume Breakout System By Todd Mitchell For additional information, please go to http://www.eminisuccessformula.com Copyright 2010 by Trading Concepts, Inc. All Rights Reserved. U.S. Government
presented by Thomas Wood MicroQuant SM Divergence Trading Workshop Day One Black Gold
 presented by Thomas Wood MicroQuant SM Divergence Trading Workshop Day One Black Gold Risk Disclaimer Trading or investing carries a high level of risk, and is not suitable for all persons. Before deciding
Wave-to-Wave Trading Analysis June 1, 2012
 Trading Wave-to-Wave 1 Wave-to-Wave Trading Analysis June 1, 2012 S&P 500 Index ETF (SPY) Successful traders understand that there are waves within waves 5-minute waves inside of 60-minute waves inside
Following Institutional Footprints
 Strategies Following Institutional Footprints Trading Expansions of Range and Volume Equity market cycles provide opportunity in every phase of liquidity. The greatest possibilities are evident when expansion-of-range-and-volume
Explanation of the 5 / 15-Minute Trading Rules
 5 / 15-Minute Trading Rules 1 Explanation of the 5 / 15-Minute Trading Rules Trading during the first ½ hour of the day can be very tricky and if one were able to gather all of the statistics for retail
In this report, I will give you a step by step set of instructions for utilizing The Lazy River Scalping Strategy my favorite scalping method.
 What is Scalping? In short, scalping is the idea of taking quick trades (typically on smaller time frames) that only need to go a short distance before you cash out of the position and then to do this
2.0. Learning to Profit from Futures Trading with an Unfair Advantage! Income Generating Strategies Essential Trading Tips & Market Insights
 2.0 Learning to Profit from Futures Trading with an Unfair Advantage! Income Generating Strategies Essential Trading Tips & Market Insights Income Generating Strategies Essential Trading Tips & Market
EJ_4H Method Part III
 EJ_4H Method Part III Trailing price: Protecting your hard-earned money against reversals or even flurries is one of the most important parts of money management. Most of platforms have such feature that
presented by Thomas Wood MicroQuant SM Divergence Trading Workshop Day One Naked Trading Part 2
 presented by Thomas Wood MicroQuant SM Divergence Trading Workshop Day One Naked Trading Part 2 Risk Disclaimer Trading or investing carries a high level of risk, and is not suitable for all persons. Before
90 Days Trading Bonds
 90 Days Trading Bonds with Chip Cole 2015, All Rights Reserved. Order Flow Analytics, Inc. 1 Trading & Training chip@orderflowanalytics.com dbvaello@orderflowanalytics.com 2015, All Rights Reserved. Order
Tradeciety s Price Action Guide
 Tradeciety s Price Action Guide Welcome... 3 Who am I?... 3 Some impressions from my trading & traveling lifestyle... 4 What Is Price Action?... 6 Candlesticks vs. Chart patterns... 7 Top 3 Candlestick
The Art & Science of Active Trend Trading
 CONNECTING THE DOTS Candlesticks & Convergence of Clues The Art & Science of Active Trend Trading Copyright ATTS 2007-2015 1 Dennis W. Wilborn, P.E. Founder, President Active Trend Trading dww@activetrendtrading.com
Divergence and Momentum Trading
 presented by Thomas Wood MicroQuant SM Divergence Trading Workshop Day One Divergence and Momentum Trading Risk Disclaimer Trading or investing carries a high level of risk, and is not suitable for all
How many of you are or will be trading a small account?
 Dean Storholt I am not a registered broker-dealer or investment adviser. I will mention that I consider certain securities or positions to be good candidates for the types of strategies we are discussing
Copyright Alpha Markets Ltd.
 Page 1 Trading Strategies - Module 3 Welcome to this unit on Trading Strategies. In this module we will be explaining the core components of a trading strategy and how you can begin to incorporate analysis
The Art & Science of Active Trend Trading
 Candlesticks Looking for U-Turns The Art & Science of Active Trend Trading Copywrite ATTS 2007-2015 1 Disclaimer U.S. Government Required Disclaimer Commodity Futures Trading Commission Futures and Options
Market Observations as of Nov 17, 2017
 Market Observations as of Nov 17, 2017 By Carl Jorgensen - For Objective Traders - For educational purposes only. Not Financial Advice. This week we saw a variety of market moves. The daily charts for
How to Play The Almighty Breakout with uncanny accuracy
 How to Play The Almighty Breakout with uncanny accuracy Copyright 2010 * ifundtraders, LLC. * 2576 Broadway, #158, NY, NY, 10025 Copyright 2010 * ifundtraders, LLC. * 2576 Broadway, #158, NY, NY, 10025
3 Price Action Signals to Compliment ANY Approach to ANY Market
 3 Price Action Signals to Compliment ANY Approach to ANY Market Introduction: It is important to start this report by being clear that these signals and tactics for using Price Action are meant to compliment
TOP 3 INDICATOR BOOT CAMP: PERCENT R
 BIGTRENDS.COM TOP 3 INDICATOR BOOT CAMP: PERCENT R PRICE HEADLEY, CFA, CMT Let s Get Started! Educate Understand the tools you have for trading. Learn what this indicator is and how you can profit from
Trading Lessons from the Intraday Frame (study)
") 1 Daily "Idealized Trades" Report Trading Lessons from the Intraday Frame (study) 1 2018 TheoTrade LLC. All rights reserved. 2 Trading Lessons from the Intraday Frame (1-mi) Major Companies Reporting Earnings
1 Daily "Idealized Trades" Report Trading Lessons from the Intraday Frame (study) 1 2018 TheoTrade LLC. All rights reserved. 2 Trading Lessons from the Intraday Frame (1-mi) Major Companies Reporting Earnings
BONUS. www. candlecharts.com/special/swing-trading-2/
 BONUS www. candlecharts.com/special/swing-trading-2/ 1 www. candlecharts.com/special/swing-trading-2/ www. candlecharts.com/special/swing-trading-2/ www. candlecharts.com/special/swing-trading-2/ 2 www.
Trading Lessons from the Intraday Frame (study)
") 1 Daily "Idealized Trades" Report Trading Lessons from the Intraday Frame (study) 1 2018 TheoTrade LLC. All rights reserved. 2 Trading Lessons from the Intraday Frame (1-mi) Major Companies Reporting Earnings
1 Daily "Idealized Trades" Report Trading Lessons from the Intraday Frame (study) 1 2018 TheoTrade LLC. All rights reserved. 2 Trading Lessons from the Intraday Frame (1-mi) Major Companies Reporting Earnings
CHARTS. Bar Line Candlestick Charts are the basis of technical analysis They are a graphic display of price action. Notes:
 TECHNICAL ANALYSIS CHARTS Bar Line Candlestick Charts are the basis of technical analysis They are a graphic display of price action Candlestick charts have become the industry standard for technical traders.
The Art & Science of Active Trend Trading
 CONNECTING THE DOTS Candlesticks & Convergence of Clues The Art & Science of Active Trend Trading Copywrite ATTS 2007-2015 1 Dennis W. Wilborn, P.E. Founder, President Active Trend Trading dww@activetrendtrading.com
PRICE ACTION CONTEXT
 TRADING WITH PRICE ACTION CONTEXT CHRIS CAPRE 2ndSkiesForex.com If you think this ebook is going to be about learning a price action setup, you re wrong. It ll be about something much more powerful. For
presented by Thomas Wood MicroQuant SM Divergence Trading Workshop Day One Bond Trading Success
 presented by Thomas Wood MicroQuant SM Divergence Trading Workshop Day One Bond Trading Success Risk Disclaimer Trading or investing carries a high level of risk, and is not suitable for all persons. Before
 1 www.candlecharts.com 2 BONUS www. candlecharts.com/special/swing-trading-2/ 3 www. candlecharts.com/special/swing-trading-2/ 4 www. candlecharts.com/special/swing-trading-2/ 5 www. candlecharts.com/special/swing-trading-2/
RISK DISCLOSURE STATEMENT / DISCLAIMER AGREEMENT
 RISK DISCLOSURE STATEMENT / DISCLAIMER AGREEMENT Trading any financial market involves risk. This report and all and any of its contents are neither a solicitation nor an offer to Buy/Sell any financial
FOREX INDICATORS. THEIR PRIORITY and USE
 FOREX INDICATORS THEIR PRIORITY and USE by G. C. Smith U.S. Government Required Disclaimer Trading foreign exchange markets on margin carries a high level of risk, and may not be suitable for all investors.
Trading Lessons from the Intraday Frame (study)
") 1 Daily "Idealized Trades" Report Trading Lessons from the Intraday Frame (study) 1 2018 TheoTrade LLC. All rights reserved. 2 Trading Lessons from the Intraday Frame (1-min) 2 2018 TheoTrade LLC. All
1 Daily "Idealized Trades" Report Trading Lessons from the Intraday Frame (study) 1 2018 TheoTrade LLC. All rights reserved. 2 Trading Lessons from the Intraday Frame (1-min) 2 2018 TheoTrade LLC. All
The Strategies Working Best in Today s E-Mini Market
 The Strategies Working Best in Today s E-Mini Market Todd Mitchell Craig Hill Legal Disclaimer No claim is made by Trading Concepts, Inc. that the trading strategies shown here will result in profits and
Trading Lessons from the Intraday Frame (study)
") 1 Daily "Idealized Trades" Report Trading Lessons from the Intraday Frame (study) 1 2018 TheoTrade LLC. All rights reserved. 2 Trading Lessons from the Intraday Frame (1-mi) 2 2018 TheoTrade LLC. All rights
1 Daily "Idealized Trades" Report Trading Lessons from the Intraday Frame (study) 1 2018 TheoTrade LLC. All rights reserved. 2 Trading Lessons from the Intraday Frame (1-mi) 2 2018 TheoTrade LLC. All rights
Market Observations as of Mar 2, 2018
 Market Observations as of Mar 2, 2018 By Carl Jorgensen - For Objective Traders - For educational purposes only. Not Financial Advice. The markets were mixed this week as volatility raised its head back
Petri Redelinghuys
 Petri Redelinghuys // @TraderPetri Becoming a better trader The first step is persistence You re still at it, well done! Learning must be the focus 90% of traders lose all their money and fail 10% of traders
Part 1. ForEx Easy Mode
 Part 1 DISCLAIMER Any income claims are typical of top performers not all users and your results will vary. Past performance of any system is not indicative of future results. Trading foreign exchange
Today s Tech Tip: Special Report
 Today s Tech Tip: Special Report Dennis W. Wilborn, Sr. ActiveTrendTrading.com dww@activetrendtrading.com Breakouts or Bounces both Good, but which is Best? Disclaimer U.S. Government Required Disclaimer
The Best Technical Indicator in the World
 The Best Technical Indicator in the World Presented by Andrew Keene Past performance is not indicative of future results. RISK DISCLAIMER Day trading, short term trading, options trading, and futures trading
Market Observations - as of Aug 17, 2018
 Market Observations - as of Aug 17, 2018 By Carl Jorgensen - For Objective Traders - For educational purposes only. Not Financial Advice. This week we saw a reversal of roles from the prior week. This
1 P a g e. Executive Summary
 Executive Summary Based on this week s deduction of observable facts, we continue to favor the major a at SPX 1867, major b at SPX 2021 and major c down to SPX 1830-1850ies around October 9-12. How exactly
The Avalanche (Reverse for a Phoenix )
") The Avalanche (Reverse for a Phoenix ) The 6 Building Blocks of Price Development (Ideal Scenario): Momentum: Above average pace on the reversal from highs, followed by slower than average upside as support
The Avalanche (Reverse for a Phoenix ) The 6 Building Blocks of Price Development (Ideal Scenario): Momentum: Above average pace on the reversal from highs, followed by slower than average upside as support
CONNECING THE DOTS Candlesticks & Convergence of Clues. The Art & Science of Active Trend Trading
 CONNECING THE DOTS Candlesticks & Convergence of Clues The Art & Science of Active Trend Trading Disclaimer U.S. Government Required Disclaimer Commodity Futures Trading Commission Futures and Options
 www.forexschoolonline.com CHECKLIST 7 Rules to a High Probability A+ Trade - CHECKLIST The checklist is below; Below the checklist is a detailed explanation of each point. You can also download the checklist
Weekly outlook for April 30 May
 Weekly outlook for April 30 May 4 2018 Summary The S&P500 index is having trouble deciding if it will rally or decline. This indecision makes trading less profitable. Wait for a break-out direction to
THE TREND RIDING STRATEGY
 THE TREND RIDING STRATEGY IMPORTANT : As an added bonus for downloading this report, you also received additional free training videos. To access your bonuses, go to: http://www.sublimeforexchampions.com/
Figure 3.6 Swing High
 Swing Highs and Lows A swing high is simply any turning point where rising price changes to falling price. I define a swing high (SH) as a price bar high, preceded by two lower highs (LH) and followed
Weekly outlook for April 23, 2018
 Weekly outlook for April 23, 2018 Summary The S&P 500 index is expected to go down further if price stays below the 2700 level. A weekly doji candle formed on the intermediate-term chart, and the short-term
Forex Range Trading With Price Action Forex Trading System By Laurentiu Damir
 Forex Range Trading With Price Action Forex Trading System By Laurentiu Damir Copyright 2012 by Laurentiu Damir All rights reserved. No part of this book may be reproduced or transmitted in any form or
2. Know the stock's history of gaps, and find relatively cheap options to trade the average gap
 MY TOP 5 EARNINGS TACTICS FOR OPTIONS TRADERS... INCLUDING MY #1 OPTIONS STRATEGY FOR EARNINGS SEASON Introduction Why trade around earnings? Any option buyer knows that the ultimate options purchase is
Market Observations - as of Jul 27, 2018
 Market Observations - as of Jul 27, 2018 By Carl Jorgensen - For Objective Traders - For educational purposes only. Not Financial Advice. This week began with most markets continuing their bullish trends
Trading Lessons from the Intraday Frame (study)
") 1 Daily "Idealized Trades" Report Trading Lessons from the Intraday Frame (study) 1 2018 TheoTrade LLC. All rights reserved. 2 Trading Lessons from the Intraday Frame (1-mi) 2 2018 TheoTrade LLC. All rights
1 Daily "Idealized Trades" Report Trading Lessons from the Intraday Frame (study) 1 2018 TheoTrade LLC. All rights reserved. 2 Trading Lessons from the Intraday Frame (1-mi) 2 2018 TheoTrade LLC. All rights
Continuing Divergence How to trade it and how to manage it Vladimir Ribakov s Divergence University
 Continuing Divergence How to trade it and how to manage it What we will learn Confirm the divergence Prepare next entries Set the target Stop Loss Yes or No? Examples + Test Confirmations It s VERY important
TRADE PLANNING WITH SIMPLE SUPPORT & RESISTANCE. Presented by Nabil Mattar FX Technical Analyst
 TRADE PLANNING WITH SIMPLE SUPPORT & RESISTANCE Presented by Nabil Mattar FX Technical Analyst 1 DISCLAIMER IG Asia Pte Ltd (Co. Reg. No. 20051002K) holds a capital markets services licence from the Monetary
Technical Analysis Basics. Identifying Tops
 Technical Analysis Basics. Identifying Tops June 2011 1 Sign Up Now to Upshots forex trade signals disclaimer The information provided in this report is for educational purposes only. It is not a recommendation
E-Mini Volume Breakout System
 E-Mini Volume Breakout System By Todd Mitchell & Craig Hill For additional bonus information and videos, please go to http://www.eminisuccessformula.com/blog Copyright 2010 by Trading Concepts, Inc. All
Trading Gaps Types and Characteristics of Gaps
 Trading Gaps Types and Characteristics of Gaps Knowing where the gap is located in the chart can quickly help identify what type of gap it is... Gaps are a common occurrence in the markets. Everyday there
The Stackable Carry Trade
 The Stackable Carry Trade Introduction: The Carry Trade is a relatively popular strategy among Forex traders. The concept is to pair high yielding interest currencies against low interest currencies in
Counter Trend Trades. (Trading Against The Trend) By Russ Horn
 By Russ Horn") Counter Trend Trades (Trading Against The Trend) By Russ Horn 1 RISK DISCLOSURE STATEMENT / DISCLAIMER AGREEMENT Trading any financial market involves risk. This report and all and any of its contents
Counter Trend Trades (Trading Against The Trend) By Russ Horn 1 RISK DISCLOSURE STATEMENT / DISCLAIMER AGREEMENT Trading any financial market involves risk. This report and all and any of its contents
Trading Guidelines. Why guidelines and not rules? Because there are no rules.
 Trading Guidelines Why guidelines and not rules? Because there are no rules. 1. Everything that you see is in a gray fog. Nothing is perfectly clear. Close is close enough. If something looks like a reliable
Trading Lessons from the Intraday Frame (study)
") 1 Daily "Idealized Trades" Report Trading Lessons from the Intraday Frame (study) 1 2018 TheoTrade LLC. All rights reserved. 2 Trading Lessons from the Intraday Frame (1-mi) 2 2018 TheoTrade LLC. All rights
1 Daily "Idealized Trades" Report Trading Lessons from the Intraday Frame (study) 1 2018 TheoTrade LLC. All rights reserved. 2 Trading Lessons from the Intraday Frame (1-mi) 2 2018 TheoTrade LLC. All rights
MARKET DIAGNOSIS: UPTREND under PRESSURE
 3/22/2017 UPTREND under PRESSURE, Nasdaq leads, UP 0.5% but volume lower Wednesday Volume 16 #055 ARMCHAIR INVESTOR TREND-FOLLOWING STRATEGY* (*For that part of your portfolio which is invested in a market-tracking
WTI Crude Oil ($WTIC)
") 1 WTI Crude Oil ($WTIC) Monthly While gold is giving us mixed signals, Crude Oil is not (which actually could help in analyzing gold, assuming that Crude Oil and Gold share the same fate and are correlated
1 WTI Crude Oil ($WTIC) Monthly While gold is giving us mixed signals, Crude Oil is not (which actually could help in analyzing gold, assuming that Crude Oil and Gold share the same fate and are correlated
Trading Lessons from the Intraday Frame (study)
") 1 Daily "Idealized Trades" Report Trading Lessons from the Intraday Frame (study) 1 2 Trading Lessons from the Intraday Frame (1-mi) 2 3 Major Companies Reporting Earnings PriceLine (PCLN) Major Economic
1 Daily "Idealized Trades" Report Trading Lessons from the Intraday Frame (study) 1 2 Trading Lessons from the Intraday Frame (1-mi) 2 3 Major Companies Reporting Earnings PriceLine (PCLN) Major Economic
Advanced Trading Systems Collection. 10/21/50 EMA Forex SCALPING SYSTEM
 10/21/50 EMA Forex SCALPING SYSTEM 1 This is a fairly simple method to squeeze money out of the market with short terms trades. With this one we trade the five minute charts, and we rarely hold a trade
Weekly outlook for May 21 - May 25, 2018
 Weekly outlook for May 21 - May 25, 2018 Summary The S&P500 index is expected to hold up for a higher level. The market broke to the upside from a symmetrical triangle pattern and is consolidating above
Active Trend Trading Rules Review
 Active Trend Trading Rules Review Active Trend Trader: Dennis W. Wilborn A Trend Should Be Assumed to Continue in Effect Until Such Time as Its Reversal Has Been Definitely Signaled Edwards & Magee Disclaimer
The Synthetic Futures Position. Goal
 The Synthetic Futures Position Goal To try to profit from a trending market using an option strategy that allows entry at a reduced cost while offering the same potential for unlimited profit (and loss)
Stacking Indicators Getting a GREAT entry! TWEEZERS Tweezer top/bottom at the band The stock is trending up Gap down (against the trend) Any moving
 Any moving") Dean Storholt I am not a registered broker-dealer or investment adviser. I will mention that I consider certain securities or positions to be good candidates for the types of strategies we are discussing
Dean Storholt I am not a registered broker-dealer or investment adviser. I will mention that I consider certain securities or positions to be good candidates for the types of strategies we are discussing
Icoachtrader Consulting Service WELCOME TO. Trading Boot Camp. Day 5
 Icoachtrader Consulting Service www.icoachtrader.weebly.com WELCOME TO Trading Boot Camp Day 5 David Ha Ngo Trading Coach Phone: 1.650.899.1088 Email: icoachtrader@gmail.com The information presented is
FOREX. analysing made easy. UNDERSTANDING TECHNICAL ANALYSIS An educational tool by Blackwell Global
 FOREX analysing made easy UNDERSTANDING TECHNICAL ANALYSIS An educational tool by Blackwell Global Risk Warning: Forex and CFDs are leveraged products and you may lose your initial deposit as well as substantial
Trading Lessons from the Intraday Frame (study)
") 1 Daily "Idealized Trades" Report Trading Lessons from the Intraday Frame (study) 1 2018 TheoTrade LLC. All rights reserved. 2 Trading Lessons from the Intraday Frame (1-mi) 2 2018 TheoTrade LLC. All rights
1 Daily "Idealized Trades" Report Trading Lessons from the Intraday Frame (study) 1 2018 TheoTrade LLC. All rights reserved. 2 Trading Lessons from the Intraday Frame (1-mi) 2 2018 TheoTrade LLC. All rights
2010 Investor s Business Daily. All rights reserved.
 The comments expressed here are based upon study and interpretation of available data as it relates to our historical models of the best-performing stocks. This is not a prospectus; no effort on our part
This is the complete: Fibonacci Golden Zone Strategy Guide
 This is the complete: Fibonacci Golden Zone Strategy Guide In this strategy report, we are going to share with you a simple Fibonacci Trading Strategy that uses the golden ratio which is a special mathematical
Only trade this method when all of the following conditions exist:
 Objective: This method is based on Jesse Livermore s IPO breakout setup. It is conceptually a range breakout swing trading strategy with an objective of profiting from the momentum market anamoly during