Introduction. Technical analysis is the attempt to forecast stock prices on the basis of market-derived data.
|
|
|
- Theodora Conley
- 6 years ago
- Views:
Transcription
1 Technical Analysis
2 Introduction Technical analysis is the attempt to forecast stock prices on the basis of market-derived data. Technicians (also known as quantitative analysts or chartists) usually look at price, volume and psychological indicators over time. They are looking for trends and patterns in the data that indicate future price movements.
3 Chart Type Charting Stocks Bar Charts and Japanese Candlestick Charts Point and Figure Charts Line Chart Major Chart Patterns Price-based Indicators
4 Trend Lines Basic Technical Tools Candle stick Moving Averages Price Patterns Indicators
5 Bar Chart The chart is made up of a series of vertical lines that represent each data point. This vertical line represents the high and low for the trading period, along with the closing price. The close and open are represented on the vertical line by a horizontal dash. The opening price on a bar chart is illustrated by the dash that is located on the left side of the vertical bar. Conversely, the close is represented by the dash on the right. Generally, if the left dash (open) is lower than the right dash (close) then the bar will be shaded GREEN, representing an up period for the stock, which means it has gained value. A bar that is colored red signals that the stock has gone down in value over that period. When this is the case, the dash on the right (close) is lower than the dash on the left (open).
6 Bar Chart
 Bearish Candle: When the")
7 Candlestick Basics Candlestick charts are an effective way of visualizing price movements. There are two basic candlesticks: Bullish Candle: When the close is higher than the open (usually green or white) Bearish Candle: When the close is lower than the open (usually red or black)
8 Candlestick Parts There are three main parts to a candlestick: Upper Shadow: The vertical line between the high of the day and the close (bullish candle) or open (bearish candle). Real Body: The difference between the open and close; colored portion of the candlestick. Lower Shadow: The vertical line between the low of the day and the open (bullish candle) or close (bearish candle).
9 Candlestick Patterns Candlestick Charts is with multiple candlesticks forming reversal and continuation patterns. Bullish Engulfing Pattern Bearish Engulfing Pattern Dark Cloud Cover Doji Dragonfly Doji Gravestone Doji Evening Star Morning Star Hammer Hanging Man Harami Inverted Hammer Piercing Line Pattern Shooting Star


10 Doji The open and close are very close together, creating a very small body It represent indecision between the bulls and the bears.
11 Long-Legged Doji A long-legged Doji is the same as Doji, except the upper and lower shadows are much longer than the regular Doji formation.
12 Example of Long-Legged Doji
13 Dragonfly Doji
14 Dragonfly Doji The Dragonfly Doji is a significant bullish reversal candlestick pattern that mainly occurs at the bottom of downtrends. The most important part of the Dragonfly Doji is the long lower shadow.
15 Example of Dragonfly Doji
16 Gravestone Doji The Gravestone Doji is a significant bearish reversal candlestick pattern that mainly occur at the top of uptrends. The most important thing about the Gravestone Doji is its long upper shadow.
17 Example of Gravestone Doji
18 Hammer
19 Hammer The Hammer candlestick formation is a significant bullish reversal candlestick pattern that mainly occur at the bottom of downtrends. It has a long lower shadow twice the length of the upper body.
20 Classic Example of Hammer

21 Hanging Man
22 Hanging Man The Hanging Man candlestick formation is a bearish sign. This pattern occur mainly at the top of uptrends and is a warning of a potential reversal downward. There is a long lower shadow, which should be at least twice the length of the real body.


23 Classic Example of Hanging Man


24 Shooting Star
25 Shooting Star The Shooting Star candlestick formation is a significant bearish reversal candlestick pattern that mainly occur at the top of uptrends. There is a long upper shadow, generally defined as at least twice the length of the real body.
26 Classic Example of Shooting Star
 Bullish Candle")

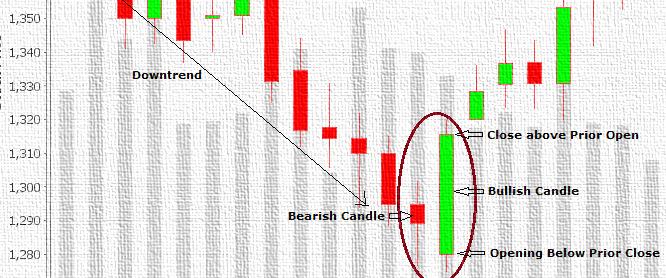
27 Piercing Pattern The Piercing Pattern is a bullish candlestick reversal pattern, There are two components of a Piercing Pattern formation: Bearish Candle(day 1) Bullish Candle (day 2) Piercing pattern will often end a minor downtrend. Green candle will close above the midpoint and opening of the bearish candle,i.e. more than halfway up the Red candle.

28 Piercing Pattern
29 Engulfing Patterns Engulfing patterns have one bearish and one bullish candle. The second candle must fully cover the first candle. Bullish or bearish, according to the second candle.
30 Bearish Engulfing Patterns

31 Bullish Engulfing Patterns
32 Morning Star
33 Morning Star It is a bullish candlestick pattern that consist of three candles. The first candle is a large bearish candle located within a defined downtrend. The second candle is a small bodied candle (bullish or bearish)that closes below the first red bar. The last candle is a large bullish candle that open above the middle candle and close near the middle of the first candle.
34 Classic Example of Morning Star
35 Evening Star
36 Evening Star An evening star is a bearish candlestick pattern consisting of three candles. The first candle is a large white bullish candlestick located with an uptrend. The middle one is a small bodied candle(bullish or bearish) that close above the first candle. The last candle is a large bearish candle that open below the second candle and closes near the first candle s center.
37 Classic Example of Evening Star
38 Bearish Harami A trend indicated by a large candlestick followed by a much smaller candlestick with that body is located within the vertical range of the larger candle's body. Such a pattern is an indication that the previous upward trend is coming to an end.

39 Bearish Harami Bearish Harami
 candlesticks engulfing a small positive (GREEN) candlestick, giving a sign of a reversal of the")
40 Bullish Harami A candlestick chart pattern in which a large candlestick is followed by a smaller candlestick whose body is located within the vertical range of the larger body. In terms of candlestick colors, the bullish harami is a downtrend of negative-colored (RED) candlesticks engulfing a small positive (GREEN) candlestick, giving a sign of a reversal of the downward trend.
41 Bullish Harami

42 Three Black Crows It is a bearish candlestick pattern that is used to the reversal of the current uptrend. This pattern consists of three consecutive long-bodied candlesticks that have closed lower than the previous day with each sessions opening occur within the body of the previous candle.
43 Three White Soldiers A bullish candlestick pattern that is used to predict the reversal of the current downtrend. This pattern consists of three consecutive long-bodied candlesticks that have closed higher than the previous day, with each session's open occurring within the body of the previous candle.
44 Dark Cloud Cover A pattern where a black candlestick follows a long white candlestick. It can be an indication of a future bearish trend. Essentially, the large black candle is forming a "dark cloud" over the preceding bullish trend. The dark cloud must have a closing price that is: within the price range of the previous day. But below the mid-point between open and closing prices of the previous day.
45 Dark Cloud Cover In candlestick charting, a pattern where a black candlestick follows a long white candlestick. It can be an indication of a future bearish trend.
46 Support & Resistance Support and resistance lines indicate likely end of trends. Resistance results from the inability to surpass prior high. Support results from the inability to break prior low. If support has broken than that level become the resistance, and vice-versa. Support Breakout Resistance
47 Historical Support & Resistance

48 Tea Break
49 Trend Lines There are three basic kinds of trends: An Up trend where price are generally increasing. A Down trend where price are generally decreasing. A Trading Range.
50 Simple Moving Averages Moving averages are used to identify current trends and trend reversals as well as to set up support and resistance levels. Moving averages can be used to quickly identify whether a stock is moving in an uptrend or a downtrend depending on the direction of the moving average. when a moving average is heading upward and the price is above it, the stock is in uptrend. Conversely, a downward sloping moving average with the price below can be used to signal a downtrend. Another method of determining momentum is to look at the order of a pair of moving averages. When a short-term average is above a longer-term average, the trend is up. On the other hand, a long-term average above a shorter-term average signals a downward movement in the trend. Conti
51 Simple Moving Averages Moving averages are a powerful tool for analyzing the trend in a stock. They provide useful support and resistance points and are very easy to use. The most common time frames that are used when creating moving averages are the 200-day, 100-day, 50-day, 20-day and 10-day. 200-days average is a good measure of trading year, a 100-day average for half a year, a 50-day average for quarter, a 20-day average for month and 10-day average for two weeks.

52 Price & Moving Average Crossover Moving average trend reversals are formed in two main ways: When the price moves through a moving average and when it moves through moving average crossovers. The first common signal is when the price moves through an important moving average. For example, when the price of a security that was in an uptrend falls below a 50-period moving average, it is a sign that the uptrend may be reversing.

53 Moving Averages Crossover The other signal of a trend reversal is when one moving average crosses through another. For example, if the 50-day moving average crosses above the 200-day moving average, it is a positive sign that the price will start to increase.
54 Head and Shoulders H&S Top This formation is characterized by two small peaks on either side of a larger peak. Left Shoulder Head Right Shoulder Neckline This is a reversal pattern, meaning that it signifies a change in the trend. H&S Bottom Neckline Left Shoulder Right Shoulder Head


55 Example of Head & Shoulder Sell Signal Minimum Target Price Based on measurement rule
56 Double Top & Double Bottom These formations are similar to the H&S formations, but there is no head. These are reversal patterns with the same measuring implications as the H&S. The Double Top is a frequent price formation at the end of a bull market. It appears as two consecutive peaks of approximately the same price on a priceversus-time chart of a market. The Double Bottom describes as the drop of a stock a rebound, another drop to the same level as the original drop, and finally another rebound. Double Top Target Target Double Bottom

57 Example of Double Bottom

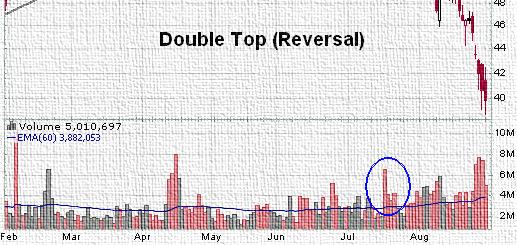
58 Example of Double Top
59 Triangles Triangles are continuation formations. Three types: Ascending Descending Symmetrical Typically, price should give break out near the apex, and typically breakout would be in the direction of the prior trend. Ascending Descending Symmetrical Symmetrical
60 Rounding Top & Bottom Rounding formations are characterized by a slow reversal of trend. Rounding Bottom The Rounding Bottom is a long-term reversal pattern that is best suited for weekly charts. It is also referred to as a saucer bottom, and represents a long consolidation period that turns from a bearish bias to a bullish bias. Rounding Top A Rounding Top may form at the end of an extended upward trend and indicates a reversal in the long-term price movement. The pattern can develop over several weeks, months or even years, and is considered a rare occurrence by many traders.


61 Example of Rounding Bottom


62 Example of Rounding Top
63 Broadening Formation These formations are like reverse triangles. Broadening Bottoms These formations usually signal a reversal of the trend. Broadening Tops


64 Example of Descending Triangle and Trading Range Nov to Mar Trading range Descending triangles
65 Technical Indicators There are, literally, hundreds of technical indicators used to generate buy and sell signals. We will look at few of the major indicators: Moving Average Convergence/Divergence (MACD) Relative Strength Index (RSI) Bollinger Bands
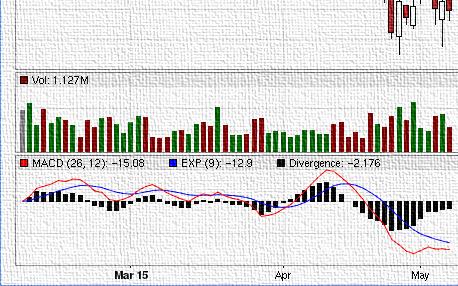
66 MACD MACD was developed by Gerald Appel as a way to keep track of a moving average crossover system. The MACD fluctuates above and below the zero line as the moving averages converge, cross and diverge. Traders can look for signal line crossovers, centerline crossovers and divergences to generate signals. When the signal line goes from negative to positive, a buy signal is generated. When the signal line goes from positive to negative, a sell signal is generated. MACD is best used in choppy (trendless) markets, and is subject to whipsaws (in and out rapidly with little or no profit).

67 Example of MACD Negative Crossover Positive Crossover
68 Relative Strength Index (RSI) RSI was developed by Welles Wilder as an oscillator to gauge overbought/oversold levels. The most important thing to understand about RSI is that a level above 70 indicates a stock is overbought, and a level below 30 indicates that it is oversold (it can range from 0 to 100). Also, realize that stocks can remain overbought or oversold for long periods of time, so RSI alone isn t always a great timing tool.
69 RSI A technical analysis tool that is banded between two extreme values and built with the results from a trend indicator for discovering short term overbought and oversold conditions. As the value of the oscillator approach the upper extreme value, the stock seem to be overbought and as it approaches to lower extreme level, it seems to be oversold.

70 Example of RSI Overbought Oversold
71 Bollinger Band Bollinger bands were created by John Bollinger (former FNN technical analyst, and regular guest on CNBC). Bollinger Bands are based on a moving average of the closing price. They are two standard deviations above and below the moving average. A buy signal is given when the stock price closes below the lower band, and a sell signal is given when the stock price closes above the upper band. When the bands contract, that is a signal that a big move is expecting, but it is impossible to say if it will be up or down.


72 Example of Bollinger Band Sell signal Buy signals
73 Thank you
Introduction. Technicians (also known as quantitative analysts or chartists) usually look at price, volume and psychological indicators over time.
 usually look at price, volume and psychological indicators over time.") Technical Analysis Introduction Technical Analysis is the study of market action, primarily through the use of charts, for the purpose of forecasting future price trends. Technicians (also known as quantitative
Technical Analysis Introduction Technical Analysis is the study of market action, primarily through the use of charts, for the purpose of forecasting future price trends. Technicians (also known as quantitative
Intermediate - Trading Analysis
 Intermediate - Trading Analysis Technical Analysis Technical analysis is the attempt to forecast currencies prices on the basis of market-derived data. Technicians (also known as quantitative analysts
PART 3 - CHART PATTERNS & TECHNICAL INDICATORS
 Tyler Chianelli s EASYOPTIONTRADING by OPTION TRADING COACH PART 3 - CHART PATTERNS & TECHNICAL INDICATORS A SIMPLE SYSTEM FOR TRADING OPTIONS WORKS IN UP, DOWN, AND SIDEWAYS MARKETS PART 3.1 - PRIMARY
Chapter Eight. Japanese Candle Chart
 Chapter Eight Japanese Candle Chart Candle chart (also called candlestick) analysis has been used since the 18 th century by Japanese rice traders to predict the rice price s movement. According to sources,
Technical Analysis. Prepared by: Mr. SOUR Ramo
 Technical Analysis Prepared by: Mr. SOUR Ramo 1 Contain 1. Introduction 2. Candle Chart 3. Trend Analysis 4. Pattern Analysis 2 1.Introduce 1.1 What is Technical Analysis? Technical analysis is a tool
Technical Analysis Workshop Series. Session Six 1, 2, 3 Price-Bars Patterns
 Technical Analysis Workshop Series Session Six 1, 2, 3 Price-Bars Patterns DISCLOSURES & DISCLAIMERS This research material has been prepared by NUS Invest. NUS Invest specifically prohibits the redistribution
20.2 Charting the Market
 NPTEL Course Course Title: Security Analysis and Portfolio Management Course Coordinator: Dr. Jitendra Mahakud Module-10 Session-20 Technical Analysis-II 20.1. Other Instruments of Technical Analysis Several
Test Your Chapter 1 Knowledge
 Self-Test Answers Test Your Chapter 1 Knowledge 1. Which is the preferred chart type in LOCKIT? The preferred chart type in LOCKIT is the candle chart because candle patterns are part of the decision-making
INTERMEDIATE EDUCATION GUIDE
 INTERMEDIATE EDUCATION GUIDE CONTENTS Key Chart Patterns That Every Trader Needs To Know Continution Patterns Reversal Patterns Statistical Indicators Support And Resistance Fibonacci Retracement Moving
JAPANESE CANDLESTICKS
 Edited by Kaspirano JAPANESE CANDLESTICKS In the 1600s, the Japanese developed a method of technical analysis to analyze the price of rice contracts. This technique is called candlestick charting. Steven
Introduction...1 Part I: Getting Familiar with Candlestick Charting and Technical Analysis...7. Part V: The Part of Tens...315
 Contents at a Glance Introduction...1 Part I: Getting Familiar with Candlestick Charting and Technical Analysis...7 Chapter 1: Understanding Charting and Where Candlesticks Fit In...9 Chapter 2: Getting
Introduction to Technical Analysis
 Introduction to Technical Analysis All About Chart Patterns, Candlesticks and Technical Studies rjofutures.rjobrien.com 800-441-1616 A division of R.J. O Brien Important Information About Trading Futures
Interactive Practice Questions
 Bonus Handouts Interactive Q and A companion for video workshop Secrets of Becoming a Samurai Trader: Advanced Candlestick Charting Techniques with Steve Nison These extra handouts (which are not part
Agenda. Who is Recognia. Event Driven Technical Analysis. Types of Technical Events. Finding and Validating Ideas using Recognia Q & A
 Disclaimer The information presented here is for educational and informational purposes only. The inclusion of any specific securities detailed is for illustrative purposes only. No information contained
Lighting the Way: Using Candlestick Patterns. The Art & Science of Active Trend Trading
 Lighting the Way: Using Candlestick Patterns The Art & Science of Active Trend Trading Disclaimer U.S. Government Required Disclaimer Commodity Futures Trading Commission Futures and Options trading has
CONNECING THE DOTS Candlesticks & Convergence of Clues. The Art & Science of Active Trend Trading
 CONNECING THE DOTS Candlesticks & Convergence of Clues The Art & Science of Active Trend Trading Disclaimer U.S. Government Required Disclaimer Commodity Futures Trading Commission Futures and Options
1. Introduction 2. Chart Basics 3. Trend Lines 4. Indicators 5. Putting It All Together
 Technical Analysis: A Beginners Guide 1. Introduction 2. Chart Basics 3. Trend Lines 4. Indicators 5. Putting It All Together Disclaimer: Neither these presentations, nor anything on Twitter, Cryptoscores.org,
The Art & Science of Active Trend Trading
 CONNECTING THE DOTS Candlesticks & Convergence of Clues The Art & Science of Active Trend Trading Copyright ATTS 2007-2015 1 Dennis W. Wilborn, P.E. Founder, President Active Trend Trading dww@activetrendtrading.com
The Art & Science of Active Trend Trading
 Candlesticks Looking for U-Turns The Art & Science of Active Trend Trading Copywrite ATTS 2007-2015 1 Disclaimer U.S. Government Required Disclaimer Commodity Futures Trading Commission Futures and Options
Reversal Candles. Candlestick Bearish Reversal Patterns. Bearish Confirmation. Existing Downtrend
 Candlestick Bearish Reversal Patterns There are dozens of bearish reversal patterns. We have elected to narrow the field by selecting a few of the most popular patterns for detailed explanations. Below
 Disclaimer The candlestick patterns explained in this book are intended to provide information only.. Use these patterns is at your discretion. The use and application of the included patterns can involve
Candlesticks Discoveries Probability of Success Aug 6, 2016
 Candlesticks Discoveries Probability of Success Aug 6, 2016 The Art & Science of Active Trend Trading Disclaimer U.S. Government Required Disclaimer Commodity Futures Trading Commission Futures and Options
CMT LEVEL I CURRICULUM Self-Evaluation
 CMT LEVEL I CURRICULUM Self-Evaluation DEAR CFA CHARTERHOLDER, As a CFA charterholder, the requirement that you sit for the CMT Level I exam is waived. However, the content in the CMT Level I Curriculum
On Our Technical Watch
 By the Kenanga Research Team l research@kenanga.com.my Figure 1: Daily Charting FBMKLCI Index Basic Data 52-week High 1,729.13 (in Million) 52-week Low 1,600.92 KLCI Vol 199.37 Current Level 1,662.92 Bursa
On Our Technical Watch
 By the Kenanga Research Team l research@kenanga.com.my Figure 1: Daily Charting FBMKLCI Basic Data 52-week High 1,759.76 (in Million) 52-week Low 1,611.88 KLCI Vol 112.14 Current Level 1,735.84 Bursa Vol
The Art & Science of Active Trend Trading
 CONNECTING THE DOTS Candlesticks & Convergence of Clues The Art & Science of Active Trend Trading Copywrite ATTS 2007-2015 1 Dennis W. Wilborn, P.E. Founder, President Active Trend Trading dww@activetrendtrading.com
CHARTS. Bar Line Candlestick Charts are the basis of technical analysis They are a graphic display of price action. Notes:
 TECHNICAL ANALYSIS CHARTS Bar Line Candlestick Charts are the basis of technical analysis They are a graphic display of price action Candlestick charts have become the industry standard for technical traders.
FinQuiz Notes
 Reading 13 Technical analysis is a security analysis technique that involves forecasting the future direction of prices by studying past market data, primarily price and volume. Technical Analysis 2. TECHNICAL
Forex Sentiment Report Q2 FORECAST WEAK AS LONG AS BELOW April
 Forex Sentiment Report 08 April 2015 www.ads-securities.com Q2 FORECAST WEAK AS LONG AS BELOW 1.1200 Targets on a break of 1.1534/35: 1.1740/50 1.1870/75 1.2230/35 Targets on a break of 1.0580/70: 1.0160
On Our Technical Watch
 By the Kenanga Research Team l research@kenanga.com.my Figure 1: Daily Charting FBMKLCI Basic Data Technical Ratings 52-week High 1,729.13 (in Million) 52-week Low 1,600.92 KLCI Vol 99.25 Current Level
On Our Technical Watch
 By the Kenanga Research Team l research@kenanga.com.my Figure 1: Daily Charting FBMKLCI Basic Data 52-week High 1,757.99 (in Million) 52-week Low 1,611.88 KLCI Vol 137.65 Current Level 1,754.42 Bursa Vol
FOREX. analysing made easy. UNDERSTANDING TECHNICAL ANALYSIS An educational tool by Blackwell Global
 FOREX analysing made easy UNDERSTANDING TECHNICAL ANALYSIS An educational tool by Blackwell Global Risk Warning: Forex and CFDs are leveraged products and you may lose your initial deposit as well as substantial
On Our Technical Watch
 By the Kenanga Research Team l research@kenanga.com.my Figure 1: Daily Charting FBMKLCI Basic Data 52-week High 1,757.99 (in Million) 52-week Low 1,611.88 KLCI Vol 174.33 Current Level 1,748.30 Bursa Vol
On Our Technical Watch
 By the Kenanga Research Team l research@kenanga.com.my Figure 1: Daily Charting FBMKLCI Basic Data Technical Ratings 52-week High 1,729.13 (in Million) 52-week Low 1,600.92 KLCI Vol 93.61 Current Level
The Technical Edge Page 1. The Technical Edge. Part 1. Indicator types: price, volume, and moving averages and momentum
 The Technical Edge Page 1 The Technical Edge INDICATORS Technical analysis relies on the study of a range of indicators. These come in many specific types, based on calculations or price patterns. For
On Our Technical Watch
 By the Kenanga Research Team l research@kenanga.com.my Figure 1: Daily Charting FBMKLCI Index Basic Data 52-week High 1,729.13 (in Million) 52-week Low 1,600.92 KLCI Vol 85.75 Current Level 1,665.32 Bursa
Additional Reading Material on Technical Analysis
 Additional Reading Material on Relevant for 1. Module 7 (Financial Statement Analysis and Asset Valuation) 2. Module 18 (Securities and Derivatives Trading [Products and Analysis]) Copyright 2017 Securities
On Our Technical Watch
 By Lawrence Yeo Eng Chien l lawrenceyeo@kenanga.com.my Figure 1: Daily Charting FBMKLCI Basic Data 52-week High 1,795.00 (in Million) 52-week Low 1,611.88 KLCI Vol 136.57 Current Level 1,791.01 Bursa Vol
On Our Technical Watch
 By Lawrence Yeo / lawrenceyeo@kenanga.com.my; Steven Chan / steven.chan@kenanga.com.my; Muhammad Afif Bin Zulkaplly / muhammad.afif@kenanga.com.my Figure 1: Daily Charting FBMKLCI Basic Data 52-week High
On Our Technical Watch
 By the Kenanga Research Team l research@kenanga.com.my Figure 1: Daily Charting FBMKLCI Basic Data 52-week High 1,759.76 (in Million) 52-week Low 1,611.88 KLCI Vol 129.13 Current Level 1,740.60 Bursa Vol
On Our Technical Watch
 By Lawrence Yeo / lawrenceyeo@kenanga.com.my; Steven Chan / steven.chan@kenanga.com.my; Muhammad Afif Bin Zulkaplly / muhammad.afif@kenanga.com.my Figure 1: Daily Charting FBMKLCI Basic Data 52-week High
OSCILLATORS. TradeSmart Education Center
 OSCILLATORS TradeSmart Education Center TABLE OF CONTENTS Oscillators Bollinger Bands... Commodity Channel Index.. Fast Stochastic... KST (Short term, Intermediate term, Long term) MACD... Momentum Relative
Trend Channels: How to Identify Easy Profit-Making Opportunities Using Simple Chart Analysis
 Trend Channels: How to Identify Easy Profit-Making Opportunities Using Simple Chart Analysis Trend channels produce a very powerful trading technique. They are very visible, which makes them easy to utilize
On Our Technical Watch
 By the Kenanga Research Team l research@kenanga.com.my Figure 1: Daily Charting FBMKLCI Basic Data 52-week High 1,759.76 (in Million) 52-week Low 1,611.88 KLCI Vol 84.65 Current Level 1,733.93 Bursa Vol
TWEEZERS TOPS AND BOTTOMS
 88 The Basics TWEEZERS TOPS AND BOTTOMS Tweezers are two or more candlestick lines with matching highs or lows. They are called tweezers because they are compared to the two prongs of a tweezers. In a
On Our Technical Watch
 By Lawrence Yeo Eng Chien / lawrenceyeo@kenanga.com.my ; Steven Chan / steven.chan@kenanga.com.my; Muhammad Afif Zulkaplly / muhammad.afif@kenanga.com.my Figure 1: Daily Charting FBMKLCI Basic Data 52-week
THE USE OF CHARTS FOR THE TECHNICAL ANALYSIS OF THE SHARES QUOTED ON THE STOCK EXCHANGE
 THE USE OF CHARTS FOR THE TECHNICAL ANALYSIS OF THE SHARES QUOTED ON THE STOCK EXCHANGE Siminic Marian University of Craiova, Faculty of Economics and Business Administration, Craiova, 13 A.I. Cuza st,
On Our Technical Watch
 By the Kenanga Research Team l research@kenanga.com.my Figure 1: Daily Charting FBMKLCI Basic Data 52-week High 1,759.76 (in Million) 52-week Low 1,611.88 KLCI Vol 142.09 Current Level 1,744.67 Bursa Vol
Technical Stock Screener Page 1
 Technical Stock Screener www.dojispace.com Page 1 Disclaimer The information provided is not to be considered as a recommendation to buy certain stocks and is provided solely as an information resource
On Our Technical Watch
 By the Kenanga Research Team l research@kenanga.com.my Figure 1: Daily Charting FBMKLCI Basic Data 52-week High 1,729.13 (in Million) 52-week Low 1,611.88 KLCI Vol 166.34 Current Level 1,708.08 Bursa Vol
Technical analysis & Charting The Foundation of technical analysis is the Chart.
 Technical analysis & Charting The Foundation of technical analysis is the Chart. Charts Mainly there are 2 types of charts 1. Line Chart 2. Candlestick Chart Line charts A chart shown below is the Line
On Our Technical Watch
 By the Kenanga Research Team l research@kenanga.com.my Figure 1: Daily Charting FBMKLCI Basic Data 52-week High 1,759.76 (in Million) 52-week Low 1,611.88 KLCI Vol 140.99 Current Level 1,738.18 Bursa Vol
On Our Technical Watch
 By the Kenanga Research Team l research@kenanga.com.my Figure 1: Daily Charting FBMKLCI Basic Data 52-week High 52-week Low Current Level Intraday High Intraday Low 1,729.13 1,611.88 1,688.84 1,690.91
Technical Analysis Workshop Series. Session Two
 Technical Analysis Workshop eries ession Two DICLOURE & DICLAIMER This research material has been prepared by NU Invest. NU Invest specifically prohibits the redistribution of this material in whole or
Technical Stock Market and Stock Analysis UCLA Extension
 Technical Stock Market and Stock Analysis UCLA Extension Date: February 4, 2012 Duration: Instructor: 9:00 AM - 4:00 PM Andrew Lais Investment Executive and General Principal Course Topics and Aim: This
Our aim at S.T.I. is to make Technical Analysis as simple and uncomplicated as possible.
 By MPFX Our aim at S.T.I. is to make Technical Analysis as simple and uncomplicated as possible. We will try to explain the concepts of each indicator in Plain English and include examples where possible.
Technical Analysis. January 22, 2004 Howard L. Simons
 Technical Analysis Howard L. Simons hsimons@aol.com Components of Trading Trading has three components, in descending order of importance Understanding your own risk tolerance and objectives Managing money
INTRODUCTION DEFINITION. What does Technical Analysis mean?
 Chapter 1 Chapter 2 INTRODUCTION DEFINITION The methods used to analyze securities and make investment decisions fall into two very broad categories: fundamental analysis and technical analysis. Fundamental
Chapter 2.3. Technical Indicators
 1 Chapter 2.3 Technical Indicators 0 TECHNICAL ANALYSIS: TECHNICAL INDICATORS Charts always have a story to tell. However, sometimes those charts may be speaking a language you do not understand and you
FOREX TRADING STRATEGIES.
 FOREX TRADING STRATEGIES www.ifcmarkets.com www.ifcmarkets.com 2 One of the most powerful means of winning a trade is the portfolio of Forex trading strategies applied by traders in different situations.
On Our Technical Watch
 By Lawrence Yeo / lawrenceyeo@kenanga.com.my; Steven Chan / steven.chan@kenanga.com.my; Muhammad Afif Bin Zulkaplly / muhammad.afif@kenanga.com.my Figure 1: Daily Charting FBMKLCI Basic Data 52-week High
Table of Contents. Risk Disclosure. Things we will be going over. 2 Most Common Chart Layouts Anatomy of a candlestick.
 Table of Contents Risk Disclosure Things we will be going over 2 Most Common Chart Layouts Anatomy of a candlestick Candlestick chart Anatomy of a BAR PLOT Indicators Trend-Lines Volume MACD RSI The Stochastic
2 Day Executive Workshop on Technical Analysis
 National Stock Exchange of India Limited 2 Day Executive Workshop on Technical Analysis OVERVIEW Technical Analysis is a science worth exploring for each market participant. Given the volatile nature of
IFMC INSTITUTE COURSE BROCHURE
 IFMC INSTITUTE COURSE BROCHURE IFMC BRANCHES LAJPAT NAGAR (DELHI) VAISHALI GHAZIABAD NORTH CAMPUS (DELHI) NOIDA E-90, FIRST FLOOR, LAJPAT NAGAR 1, NEW DELHI - 110024 PLOT No. 3, 2 ND FLOOR, RELIANCE PLAZA
Index. Chaikin Money Flow (CMF), 59 chartists, 32 33, 44 confirmation, 31, contrarian trading, 4, 29
, 59 chartists, 32 33, 44 confirmation, 31, contrarian trading, 4, 29") Notes Introduction 1. High-Frequency Trading, New York Times, October 10, 2011. 2. Securities and Exchange Commission (SEC) at www.sec.gov/answers/ pumpdump.htm. 1 Options: Trading Basics 1. In future
Notes Introduction 1. High-Frequency Trading, New York Times, October 10, 2011. 2. Securities and Exchange Commission (SEC) at www.sec.gov/answers/ pumpdump.htm. 1 Options: Trading Basics 1. In future
How to Spot Candlestick Formations in the Stock Market & What to Do Once You Spot Them
 How to Spot Candlestick Formations in the Stock Market & What to Do Once You Spot Them WHAT IS A CANDLESTICK? ACandlestick measures price fluctuations within a defined period of time. Colors differentiate
Candlestick Secrets for Profiting in Options Seminar The Foundation of Options
 Option Spreads 45 Bull Vertical Spreads Bull call (debit) & Bull put (credit) 46 Bull Call Spreads Buy lower strike (95) call Sell higher strike (100) call (same expiration) Which of these two strikes
Intra-Day Trading Techniques
 Pristine.com Presents Intra-Day Trading Techniques With Greg Capra Co-Founder of Pristine.com, and Co-Author of the best selling book, Tools and Tactics for the Master Day Trader Copyright 2001, Pristine
What is Technical Analysis
 Reg. office: International School of Financial Market, Plot no. 152 - P (LGF), Sec - 38, Medicity Road, Gurgaon - 122002 Contact no. : 0124-2200689,+919540008689, 9654446629 Web : www.isfm.co.in, Email
Candlestick Forum Boot Camp. High Profit Patterns. Why is it important to know the patterns? Eliminates emotions
 Candlestick Forum Boot Camp High Profit Patterns Why is it important to know the patterns? Eliminates emotions 1 Advanced Candlestick Patterns Fry Pan Bottom Dumpling Top Cradle Pattern Jay-Hook Scoop
Methodology. Our team of analysts uses technical and chartist analysis to draw an opinion and make decisions. The preferred chartist elements are:
 Methodology Technical analysis is at the heart of TRADING CENTRAL's expertise. Our methodology is proven. Our chartist and quantitative approach allows us to intervene on different investment horizons.
Candlestick Signals and Option Trades (Part 3, advanced) Hour One
 Hour One") Candlestick Signals and Option Trades (Part 3, advanced) Hour One 1. Hedges, long and short A hedge is any strategy designed to reduce or eliminate market risk. This applies to equity positions and the
Candlestick Signals and Option Trades (Part 3, advanced) Hour One 1. Hedges, long and short A hedge is any strategy designed to reduce or eliminate market risk. This applies to equity positions and the
Glossary of Technical Analysis Terms
 George Davis, CMT Chief Technical Analyst RBC Dominion Securities Inc. +1 416 842 6633 george.davis@rbccm.com Global FX Strategy 13 January 2010 Glossary of Technical Analysis Terms Introduction Although
What is it really? Presentation to the Melbourne ATAA meeting 8 October, Technical Analysis What is it really?
 1 What is it really? What is it really? Presentation to the Melbourne ATAA meeting 8 October, 2009 The share market can seem mystical and almost like black magic; but with the right support and assistance,
TD AMERITRADE Technical Analysis Night School Week 2
 TD AMERITRADE Technical Analysis Night School Week 2 Hosted By Derek Moore Director, National Education For the audio portion of today s webcast, please enable your computer speakers. Past performance
Notices and Disclaimer
 Part 2 March 14, 2013 Saul Seinberg Notices and Disclaimer } This is a copyrighted presentation. It may not be copied or used in whole or in part for any purpose without prior written consent from the
Candlesticks What They Really Mean! March 3, 2018
 Candlesticks What They Really Mean! March 3, 2018 Active Trend Trading Dennis W. Wilborn Disclaimer U.S. Government Required Disclaimer Commodity Futures Trading Commission Futures and Options trading
 1 www.candlecharts.com 2 BONUS www. candlecharts.com/special/swing-trading-2/ 3 www. candlecharts.com/special/swing-trading-2/ 4 www. candlecharts.com/special/swing-trading-2/ 5 www. candlecharts.com/special/swing-trading-2/
.. /-!"::- '..- ( \.- - '-/../ '
 ....'-/ -!"::- ' ( \.-../ ' /- Triple Shot Forex Trading System The term "Day Trading" usually refers to the act of buying and selling a financial instrument within the same day. In the Forex market, a
Chapter 2.3. Technical Analysis: Technical Indicators
 Chapter 2.3 Technical Analysis: Technical Indicators 0 TECHNICAL ANALYSIS: TECHNICAL INDICATORS Charts always have a story to tell. However, from time to time those charts may be speaking a language you
An Introduction to Candlesticks for Options Using Nison Candlesticks as the Foundation to your option trading
 Using Nison Candlesticks as the Foundation to your option trading, CMT President: Candlecharts.com Candlestick Benefits Easy to Understand Early Reversals Safety First East + West All markets All Time
Please read the following risk disclosure before you proceed.
 Please read the following risk disclosure before you proceed. The risk of loss in trading commodity futures contracts can be substantial. You should therefore carefully consider whether such trading is
Technical Analysis Workshop Series. Session 11 Semester 2 Week 5 Oscillators Part 2
 Technical Analysis Workshop Series Session 11 Semester 2 Week 5 Oscillators Part 2 DISCLOSURES & DISCLAIMERS This research material has been prepared by NUS Invest. NUS Invest specifically prohibits the
Candlestick Secrets for Profiting in Options Seminar Nison Candlesticks to Guide Your Option Trades
 Nison Candlestick Secrets For Profiting in Options Presentedby Steve Nison President: candlecharts.com Quickly finding the best opportunities in the options markets Nison candlesticks for option strategies
Market Snapshot. Key Resistance level 17,350 (R1) 17,586 (R2) 17,750 (R3) Key Support level 16,830 (S1) 16,589 (S2) 16,353 (S3)
 17,586 (R2) 17,750 (R3) Key Support level 16,830 (S1) 16,589 (S2) 16,353 (S3)") By the Kenanga Research Team l research@kenanga.com.my KLCI BURSA 21-Jul RSI (13D) SMAVG (21D) KLCI 1,868.6 37.5 1,885.4 FTSE EMAS 13,041.9 45.2 13,103.0 FTSE Smallcap 18,705.8 82.1 18,264.5 FTSE MESDAQ
By the Kenanga Research Team l research@kenanga.com.my KLCI BURSA 21-Jul RSI (13D) SMAVG (21D) KLCI 1,868.6 37.5 1,885.4 FTSE EMAS 13,041.9 45.2 13,103.0 FTSE Smallcap 18,705.8 82.1 18,264.5 FTSE MESDAQ
Profitable Patterns. Do you believe there are profits to be made in stocks? With the right tools, anyone can make consistent money in stocks.
 Profitable Patterns Do you believe there are profits to be made in stocks? With the right tools, anyone can make consistent money in stocks. Level of RESISTANCE Price per share has NOT been able to "Break
BONUS. www. candlecharts.com/special/swing-trading-2/
 BONUS www. candlecharts.com/special/swing-trading-2/ 1 www. candlecharts.com/special/swing-trading-2/ www. candlecharts.com/special/swing-trading-2/ www. candlecharts.com/special/swing-trading-2/ 2 www.
Last Gasp in the Dollar. Market Update May 18, Seattle Technical Advisors
 SeattleTA provides investment managers with technical analysis of the equity, fixed-income, commodity, and currency markets. While equities are expected to take a hit this week, the big news is expected
CANDLE STICK SIGNALS. This book is given for reference. So readers may or may not read it.
 CANDLE STICK SIGNALS This book is given for reference. So readers may or may not read it. : The History of Japanese Candlesticks : Throughout Candlestick Analysis you are going to find many war-like references.
THE CANDLESTICK TRADING BIBLE
 1 Content Introduction 4 Overview 6 History of Candlesticks 8 What is a Candlestick 11 Candlestick Patterns 14 The Engulfing Bar Candlestick 16 The Doji Candlestick Pattern 20 The Dragon Fly Doji Pattern
Candlestick Secrets for Profiting in Options Seminar Nison Candlesticks to Guide Your Option Trades
 Nison Candlestick Secrets For Profiting in Options Presented by Steve Nison President: candlecharts.com Quickly finding the best opportunities in the options markets Nison candlesticks for option strategies
Williams Percent Range
 Williams Percent Range (Williams %R or %R) By Marcille Grapa www.surefiretradingchallenge.com RISK DISCLOSURE STATEMENT / DISCLAIMER AGREEMENT Trading any financial market involves risk. This report and
BUY SELL PRO. Improve Profitability & Reduce Risk with BUY SELL Pro. Ultimate BUY SELL Indicator for All Time Frames
 BUY SELL PRO Improve Profitability & Reduce Risk with BUY SELL Pro Ultimate BUY SELL Indicator for All Time Frames Risk Disclosure DISCLAIMER: Crypto, futures, stocks and options trading involves substantial
presented by Thomas Wood MicroQuant SM Divergence Trading Workshop Day One Naked Trading Part 2
 presented by Thomas Wood MicroQuant SM Divergence Trading Workshop Day One Naked Trading Part 2 Risk Disclaimer Trading or investing carries a high level of risk, and is not suitable for all persons. Before
Syl Desaulniers Nison Certified Trainer Nison Candle Software Tech Support
 Syl Desaulniers Nison Certified Trainer Nison Candle Software Tech Support Legal Notice: This webcast and recording is Candlecharts.com and may not be copied, retransmitted, nor distributed in any manner
Market Update April 20, 2015
 SeattleTA provides investment managers with technical analysis of the equity, fixed-income, commodity, and The forecast for a high on April 15 was spot-on (there s no kill switch on awesome!). The monthly
The very first calculations for average gain and average loss are simple 14- period averages.
 Introduction Developed by J. Welles Wilder, the Relative Strength Index (RSI) is a momentum oscillator that measures the speed and change of price movements. RSI oscillates between zero and 100. Traditionally,
Moving Average Convergence Divergence (MACD) by
 by") Moving Average Convergence Divergence (MACD) by www.surefire-trading.com Ty Young Hi, this is Ty Young with Surefiretrading.com and today we will be discussing the Moving Average Convergence/Divergence
Moving Average Convergence Divergence (MACD) by www.surefire-trading.com Ty Young Hi, this is Ty Young with Surefiretrading.com and today we will be discussing the Moving Average Convergence/Divergence
Wedge Pattern Breakouts: Explosive Winning Trades
 Wedge Pattern Breakouts: Explosive Winning Trades Prices move in patterns! This is due to one basic investment truism. Human nature exhibits the same habits when it comes to managing investment funds which
Compiled by Timon Rossolimos
 Compiled by Timon Rossolimos - 2 - The Seven Best Forex Indicators -All yours! Dear new Forex trader, Everything we do in life, we do for a reason. Why have you taken time out of your day to read this