Candlestick Forum Boot Camp. High Profit Patterns. Why is it important to know the patterns? Eliminates emotions
|
|
|
- Vernon Morrison
- 6 years ago
- Views:
Transcription
1 Candlestick Forum Boot Camp High Profit Patterns Why is it important to know the patterns? Eliminates emotions 1
2 Advanced Candlestick Patterns Fry Pan Bottom Dumpling Top Cradle Pattern Jay-Hook Scoop Pattern Belt Hold Breakout Patterns High Probabilty Patterns Pennants Channels Fibonacci Distance from MA s Double Bottoms/Tops Fry Pan Bottom The downtrend starts waning with the appearance of small trading bodies As the trend starts slowly curling up, a gap up in price indicates that strong buying sentiment has now returned 2


3 Fry Pan Bottom Long Rounded Curved bottom Fry Pan Bottom minutes, days, months The indecisive rounding bottom is the predominant factor Fry Pan Bottom - Past Analysis Big Percent move at top has a different meaning when a pattern can be identified 3


4 Fry Pan Bottom measuring point A dimple usually marks the Halfway point Fry pan bottom Fry Pan Bottom - Dollar analysis 4


5 Fry Pan Bottom expectations Should not have breached bottom curvature Fry pan Bottom Failure Fry Pan Bottom where to buy? 5


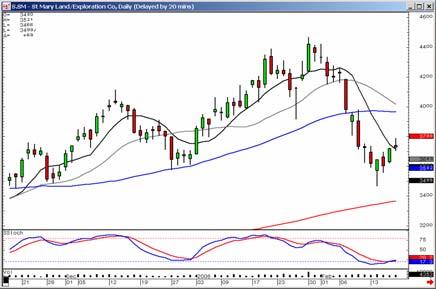
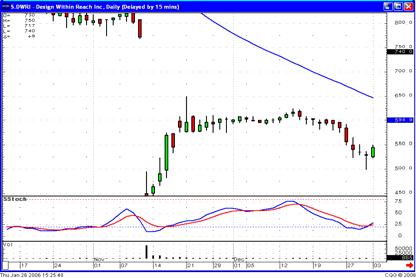
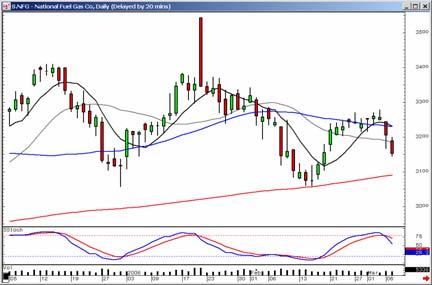
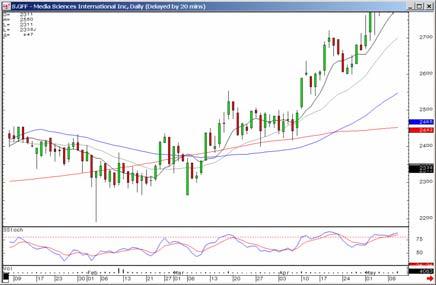
6 Fry Pan Bottom with MA confirmation Fry Pan Bottom - A Break Out or Failure? Easy identification of a failure, which makes for easy stop loss procedures Fry Pan Bottom can become a Cup and Handle CUP Handle Or a J-hook pattern 6


7 What shows a Fry Pan Bottom failure? Fry Pan Bottom Exuberant buying Want to see break out buying Fry Pan Bottom What to expect? 7


8 Fry Pan Bottom What is expected? Opposite the Fry pan Bottom Dumpling Top The Dumpling Top- an identifiable characteristic Lousy trading atmosphere 8


9 Cradle Pattern The Cradle Pattern is a symmetric bottom pattern that is easy to identify. A downtrend becomes obvious with a large black candle at the bottom. A series of small or indecisive trading days trade in a flat area. A bullish candle, more powerful with a Bullish Engulfing signal, is formed of approximately the same magnitude as a Bearish candle at the end of the downtrend. This signifies that the Bulls have come out of the indecisive trading area with decisive force. Cradle pattern Cradle Pattern 9


10 Cradle Pattern Cradle pattern Cradle Pattern at the MA s 10


11 Cradle pattern Cradle Pattern What is expected after a Cradle pattern? 11
12 Jay Hook Pattern The first move of the uptrend is very strong. A candlestick sell signal indicates a pullback about to occur. After a few days, small indecisive candles start to appear Doji, small Hammers, Bullish Engulfing signals Jay Hook Pattern The first test becomes the recent high Indecision as found in candlestick sell signals at the recent high becomes a quick indicator to get out of the position A Bullish candle breaching the recent high illustrates that investor sentiment is taking prices up Jay Hook Pattern How to differentiate between profit taking and a full-scale reversal. 12


13 J-hook Jayhook patterns build strong trends What s identifies a Jayhook pullback? Indecisive trading 13


14 Jay Hook J-Hook How to Identify The pull back is stopped when Candlestick buy signals appear Stochastics do not get to the Oversold area J-hook - what is first criteria? A strong price trend 14


15 J-Hook What forewarns a possible J-Hook? Bearish Harami says to sell J-Hook with added confirmation Indecisive trading at a major moving average Adds more evidence of a J-hook pattern potential J-Hook Easy Expectations 15


16 J-Hook Relatively Quick Pull Back and Reversal J-hook - No Decisive selling on the pull back Selling did not show any confirmation J-Hook The signals make identifying easy A hammer, an Inverted Hammer, then bullish confirmation Sets up for easy entry and exit strategies 16


17 J-Hook what is next target? Bearish J-hook Scoop Pattern An extended flat trading area Followed by a pullback Buy signals bring price back up to flat trading range Once price breaks above flat range, look for strong uptrend 17


18 Scoop Pattern formation Scoop Pattern- Completed Scoop Pattern 18


19 Scoop pattern Scoop pattern off the MA s Scoop pattern - Do not scan for a Scoop 19


20 Scoop pattern Use it to analyze Scoop Pattern - What should happen upon confirming? Scoop Pattern - A strong trend to potential targets 20


21 Scoop pattern - And if it doesn t work Scoop where are the targets? 21


22 Scoop Where are the targets? Longer term chart makes shorter term chart easier to read Scoop = Targets 22


23 Belt Hold Pattern Strong prevailing trend The candlestick body should be the opposite color of the prevailing trend Gap on the open, continuing the trend The open is the high or low of that trend The length of the body should be a long body. Belthold Belthold - Adds strength to existing trends 23


24 Belthold shows the sellers are flushed out Belthold gets rid of the last of the sellers Belthold 24

25 Belthold Belthold Bearish Belthold 25

26 Belthold Act as good continuation patterns Belthold works for Funds 26


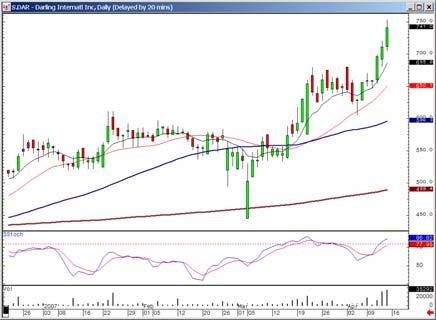
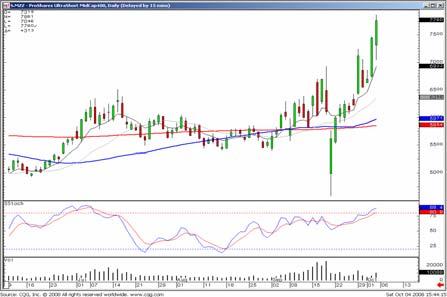
27 Breakout Patterns Knowing Knowing when to get on board and when to take profits. Breakouts Breakouts 27


28 Break Out or gap up at top? Breakout? What is previous chart showing? Breakout when is the profit taking over? 28

29 Breakout where to buy? Breakouts tell you something Analyzing The Market 29


30 DOW what pattern? DOW where could it go? DOW where can it go? 30

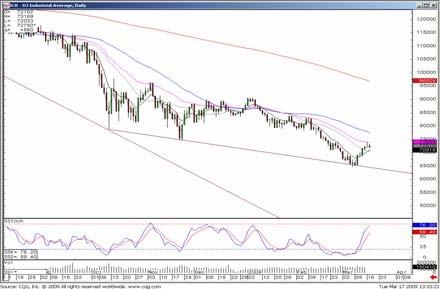
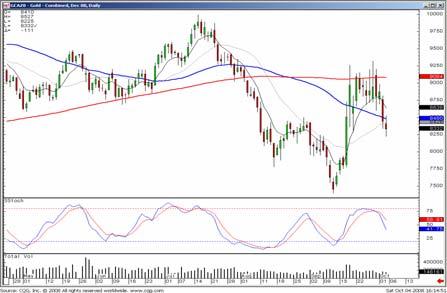
31 Where did it go? Trendlines are watched by everybody Gold 31


32 Trading Gaps Gaps represent enthusiasm to get into a position to the point that investors will pay prices away from any of the previous day's trading range. Great for identifying panic selling at the bottom and exuberant buying at the top. Gaps when they are meaningful Gaps with signals at major technical levels 32


33 Gaps or they can be very obvious Gaps Doji followed by a gap down, get out asap Gaps when to get out, when to watch gor buy signals 33


34 Gaps at bottom, look for the signals Gaps Kickers signals are the strongest signals The Gap is built into the signal Trading Channels 34


35 Trading channels signals that tops and bottoms Trend channels Trading channels -- breakout 35


36 Trading channel -- breakout Trading channels buy and sell points Pennant breakouts 36


37 Pennant breakouts which direction Pennant breakouts Pennant breakouts 37


38 Pennant breakouts Double Bottoms Why is this bottoming action significant? 38


39 What does a double bottom due to the bears psyche? The Bulls liked this area before The Bulls like this area before 39


40 Double Tops tell the same story Moving Averages - Magnets MA s support and targets 40


41 MA s act as magnets MA s and patterns MA s once breached, will come back and test 41


42 MA s Targets MA s first attempts usually fail MA s once breached, act as support 42

43 Targets when pattern is identified GAP Fry Pan Bottom can become a Cup and Handle CUP Handle Or a J-hook pattern Wave


44 The T-line Why is it important to know the patterns? It prepares you to react to an expected results 44
Trend Channels: How to Identify Easy Profit-Making Opportunities Using Simple Chart Analysis
 Trend Channels: How to Identify Easy Profit-Making Opportunities Using Simple Chart Analysis Trend channels produce a very powerful trading technique. They are very visible, which makes them easy to utilize
Wedge Pattern Breakouts: Explosive Winning Trades
 Wedge Pattern Breakouts: Explosive Winning Trades Prices move in patterns! This is due to one basic investment truism. Human nature exhibits the same habits when it comes to managing investment funds which
The Bobble Pattern. High Profit Candlestick Pattern Results
 The Bobble Pattern High Profit Candlestick Pattern Results Candlestick analysis provides the opportunity to be in a high profit/high probability trades setups based on one simple factor, human emotions.
Lighting the Way: Using Candlestick Patterns. The Art & Science of Active Trend Trading
 Lighting the Way: Using Candlestick Patterns The Art & Science of Active Trend Trading Disclaimer U.S. Government Required Disclaimer Commodity Futures Trading Commission Futures and Options trading has
CONNECING THE DOTS Candlesticks & Convergence of Clues. The Art & Science of Active Trend Trading
 CONNECING THE DOTS Candlesticks & Convergence of Clues The Art & Science of Active Trend Trading Disclaimer U.S. Government Required Disclaimer Commodity Futures Trading Commission Futures and Options
Technical Analysis Workshop Series. Session Six 1, 2, 3 Price-Bars Patterns
 Technical Analysis Workshop Series Session Six 1, 2, 3 Price-Bars Patterns DISCLOSURES & DISCLAIMERS This research material has been prepared by NUS Invest. NUS Invest specifically prohibits the redistribution
Candlesticks Discoveries Probability of Success Aug 6, 2016
 Candlesticks Discoveries Probability of Success Aug 6, 2016 The Art & Science of Active Trend Trading Disclaimer U.S. Government Required Disclaimer Commodity Futures Trading Commission Futures and Options
Introduction. Technical analysis is the attempt to forecast stock prices on the basis of market-derived data.
 Technical Analysis Introduction Technical analysis is the attempt to forecast stock prices on the basis of market-derived data. Technicians (also known as quantitative analysts or chartists) usually look
Introduction. Technicians (also known as quantitative analysts or chartists) usually look at price, volume and psychological indicators over time.
 usually look at price, volume and psychological indicators over time.") Technical Analysis Introduction Technical Analysis is the study of market action, primarily through the use of charts, for the purpose of forecasting future price trends. Technicians (also known as quantitative
Technical Analysis Introduction Technical Analysis is the study of market action, primarily through the use of charts, for the purpose of forecasting future price trends. Technicians (also known as quantitative
PART 3 - CHART PATTERNS & TECHNICAL INDICATORS
 Tyler Chianelli s EASYOPTIONTRADING by OPTION TRADING COACH PART 3 - CHART PATTERNS & TECHNICAL INDICATORS A SIMPLE SYSTEM FOR TRADING OPTIONS WORKS IN UP, DOWN, AND SIDEWAYS MARKETS PART 3.1 - PRIMARY
Reversal Candles. Candlestick Bearish Reversal Patterns. Bearish Confirmation. Existing Downtrend
 Candlestick Bearish Reversal Patterns There are dozens of bearish reversal patterns. We have elected to narrow the field by selecting a few of the most popular patterns for detailed explanations. Below
The Art & Science of Active Trend Trading
 Candlesticks Looking for U-Turns The Art & Science of Active Trend Trading Copywrite ATTS 2007-2015 1 Disclaimer U.S. Government Required Disclaimer Commodity Futures Trading Commission Futures and Options
Chapter Eight. Japanese Candle Chart
 Chapter Eight Japanese Candle Chart Candle chart (also called candlestick) analysis has been used since the 18 th century by Japanese rice traders to predict the rice price s movement. According to sources,
Weekly outlook for April 30 May
 Weekly outlook for April 30 May 4 2018 Summary The S&P500 index is having trouble deciding if it will rally or decline. This indecision makes trading less profitable. Wait for a break-out direction to
The Art & Science of Active Trend Trading
 CONNECTING THE DOTS Candlesticks & Convergence of Clues The Art & Science of Active Trend Trading Copyright ATTS 2007-2015 1 Dennis W. Wilborn, P.E. Founder, President Active Trend Trading dww@activetrendtrading.com
The Art & Science of Active Trend Trading
 CONNECTING THE DOTS Candlesticks & Convergence of Clues The Art & Science of Active Trend Trading Copywrite ATTS 2007-2015 1 Dennis W. Wilborn, P.E. Founder, President Active Trend Trading dww@activetrendtrading.com
Test Your Chapter 1 Knowledge
 Self-Test Answers Test Your Chapter 1 Knowledge 1. Which is the preferred chart type in LOCKIT? The preferred chart type in LOCKIT is the candle chart because candle patterns are part of the decision-making
Introduction...1 Part I: Getting Familiar with Candlestick Charting and Technical Analysis...7. Part V: The Part of Tens...315
 Contents at a Glance Introduction...1 Part I: Getting Familiar with Candlestick Charting and Technical Analysis...7 Chapter 1: Understanding Charting and Where Candlesticks Fit In...9 Chapter 2: Getting
JAPANESE CANDLESTICKS
 Edited by Kaspirano JAPANESE CANDLESTICKS In the 1600s, the Japanese developed a method of technical analysis to analyze the price of rice contracts. This technique is called candlestick charting. Steven
FOREX. analysing made easy. UNDERSTANDING TECHNICAL ANALYSIS An educational tool by Blackwell Global
 FOREX analysing made easy UNDERSTANDING TECHNICAL ANALYSIS An educational tool by Blackwell Global Risk Warning: Forex and CFDs are leveraged products and you may lose your initial deposit as well as substantial
CHARTS. Bar Line Candlestick Charts are the basis of technical analysis They are a graphic display of price action. Notes:
 TECHNICAL ANALYSIS CHARTS Bar Line Candlestick Charts are the basis of technical analysis They are a graphic display of price action Candlestick charts have become the industry standard for technical traders.
Technicals & Time Frame
 Advanced Charting Neither Better Trades or any of its personnel are registered broker-dealers or investment advisers. I will mention that I consider certain securities or positions to be good candidates
Big Profit Patterns Using Candlestick Signals And Gaps
 Big Profit Patterns Using Candlestick Signals And Gaps How To Make A Living Trading The Markets By Mastering Easy To Learn Techniques Hardly Anyone Else Knows About A Candlestick Forum publication - Years
 Disclaimer The candlestick patterns explained in this book are intended to provide information only.. Use these patterns is at your discretion. The use and application of the included patterns can involve
On Our Technical Watch
 By the Kenanga Research Team l research@kenanga.com.my Figure 1: Daily Charting FBMKLCI Basic Data 52-week High 1,757.99 (in Million) 52-week Low 1,611.88 KLCI Vol 174.33 Current Level 1,748.30 Bursa Vol
INTERMEDIATE EDUCATION GUIDE
 INTERMEDIATE EDUCATION GUIDE CONTENTS Key Chart Patterns That Every Trader Needs To Know Continution Patterns Reversal Patterns Statistical Indicators Support And Resistance Fibonacci Retracement Moving
On Our Technical Watch
 By Lawrence Yeo Eng Chien l lawrenceyeo@kenanga.com.my Figure 1: Daily Charting FBMKLCI Basic Data 52-week High 1,795.00 (in Million) 52-week Low 1,611.88 KLCI Vol 136.57 Current Level 1,791.01 Bursa Vol
Icoachtrader Consulting Service WELCOME TO. Trading Boot Camp. Day 5
 Icoachtrader Consulting Service www.icoachtrader.weebly.com WELCOME TO Trading Boot Camp Day 5 David Ha Ngo Trading Coach Phone: 1.650.899.1088 Email: icoachtrader@gmail.com The information presented is
How to Spot Candlestick Formations in the Stock Market & What to Do Once You Spot Them
 How to Spot Candlestick Formations in the Stock Market & What to Do Once You Spot Them WHAT IS A CANDLESTICK? ACandlestick measures price fluctuations within a defined period of time. Colors differentiate
On Our Technical Watch
 By the Kenanga Research Team l research@kenanga.com.my Figure 1: Daily Charting FBMKLCI Index Basic Data 52-week High 1,729.13 (in Million) 52-week Low 1,600.92 KLCI Vol 199.37 Current Level 1,662.92 Bursa
On Our Technical Watch
 By the Kenanga Research Team l research@kenanga.com.my Figure 1: Daily Charting FBMKLCI Basic Data Technical Ratings 52-week High 1,729.13 (in Million) 52-week Low 1,600.92 KLCI Vol 93.61 Current Level
COPYRIGHTED MATERIAL. Index. P1: SBT ind JWBT192-Yotov October 8, :55 Printer: Yet to come
 Index All Industries Activity, 60, 61 Australian dollar (AUD), 54 Balance of trade, 61 Bank of Canada, 55 Bank of England, 55, 56, 63 Bank of Japan, 55, 60, 62 63 Bar charts, 73 Base currency, 2, 51 Bearish
Intra-Day Trading Techniques
 Pristine.com Presents Intra-Day Trading Techniques With Greg Capra Co-Founder of Pristine.com, and Co-Author of the best selling book, Tools and Tactics for the Master Day Trader Copyright 2001, Pristine
On Our Technical Watch
 By the Kenanga Research Team l research@kenanga.com.my Figure 1: Daily Charting FBMKLCI Basic Data 52-week High 1,759.76 (in Million) 52-week Low 1,611.88 KLCI Vol 112.14 Current Level 1,735.84 Bursa Vol
On Our Technical Watch
 By the Kenanga Research Team l research@kenanga.com.my Figure 1: Daily Charting FBMKLCI Basic Data 52-week High 1,729.13 (in Million) 52-week Low 1,611.88 KLCI Vol 166.34 Current Level 1,708.08 Bursa Vol
TRADING ACADEMY MODULE-3 TECHNICAL ANALYSIS SECTION-6 PRICE ACTION. LEVEL-1: THE COMPLETE GUIDE TO TRADING FOREX & CFDs
 TRADING ACADEMY LEVEL-1: THE COMPLETE GUIDE TO TRADING FOREX & CFDs MODULE-3 TECHNICAL ANALYSIS SECTION-6 PRICE ACTION TRADING ACADEMY LIMITED MODULE-3: TECHNICAL ANALYSIS SECTION-6: PRICE ACTION TRADING
Level I Learning Objectives by chapter
 Level I Learning Objectives by chapter 1. Introduction to the Evolution of Technical Analysis Describe the development of modern technical analysis Describe the origins of technical analysis 2. A New Age
On Our Technical Watch
 By the Kenanga Research Team l research@kenanga.com.my Figure 1: Daily Charting FBMKLCI Index Basic Data 52-week High 1,729.13 (in Million) 52-week Low 1,600.92 KLCI Vol 85.75 Current Level 1,665.32 Bursa
CMT LEVEL I CURRICULUM Self-Evaluation
 CMT LEVEL I CURRICULUM Self-Evaluation DEAR CFA CHARTERHOLDER, As a CFA charterholder, the requirement that you sit for the CMT Level I exam is waived. However, the content in the CMT Level I Curriculum
 Jack Schwager s Planned Trading Approach 1.Define your trading philosophy or system 2. Choose your markets to be traded 3. Specify your risk parameters A. Minimum risk per trade B. Stop loss strategy C.
Introduction to Technical Analysis
 Introduction to Technical Analysis All About Chart Patterns, Candlesticks and Technical Studies rjofutures.rjobrien.com 800-441-1616 A division of R.J. O Brien Important Information About Trading Futures
On Our Technical Watch
 By Lawrence Yeo / lawrenceyeo@kenanga.com.my; Steven Chan / steven.chan@kenanga.com.my; Muhammad Afif Bin Zulkaplly / muhammad.afif@kenanga.com.my Figure 1: Daily Charting FBMKLCI Basic Data 52-week High
On Our Technical Watch
 By the Kenanga Research Team l research@kenanga.com.my Figure 1: Daily Charting FBMKLCI Basic Data 52-week High 1,759.76 (in Million) 52-week Low 1,611.88 KLCI Vol 129.13 Current Level 1,740.60 Bursa Vol
On Our Technical Watch
 By the Kenanga Research Team l research@kenanga.com.my Figure 1: Daily Charting FBMKLCI Basic Data 52-week High 1,757.99 (in Million) 52-week Low 1,611.88 KLCI Vol 137.65 Current Level 1,754.42 Bursa Vol
Naked Trading - Double Top Chart Pattern Strategy
 Naked Trading - Double Top Chart Pattern Strategy If you really want to learn a profitable way to trade then look no further, the Double Top chart pattern strategy uses simple and sound trading principles
Stephen W. Bigalow Over 30 years of investment experience, including eight years as a stockbroker with major Wall Street firms.
 Stephen W. Bigalow Over 30 years of investment experience, including eight years as a stockbroker with major Wall Street firms. Business and Economics degree from Cornell University Active member of AAPTA,
On Our Technical Watch
 By Lawrence Yeo Eng Chien / lawrenceyeo@kenanga.com.my ; Steven Chan / steven.chan@kenanga.com.my; Muhammad Afif Zulkaplly / muhammad.afif@kenanga.com.my Figure 1: Daily Charting FBMKLCI Basic Data 52-week
On Our Technical Watch
 By the Kenanga Research Team l research@kenanga.com.my Figure 1: Daily Charting FBMKLCI Basic Data 52-week High 52-week Low Current Level Intraday High Intraday Low 1,729.13 1,611.88 1,688.84 1,690.91
Technical Analysis Workshop Series. Session Two
 Technical Analysis Workshop eries ession Two DICLOURE & DICLAIMER This research material has been prepared by NU Invest. NU Invest specifically prohibits the redistribution of this material in whole or
On Our Technical Watch
 By the Kenanga Research Team l research@kenanga.com.my Figure 1: Daily Charting FBMKLCI Basic Data 52-week High 1,759.76 (in Million) 52-week Low 1,611.88 KLCI Vol 84.65 Current Level 1,733.93 Bursa Vol
Chapter 3. Price Action
 Chapter 3 Price Action The movement of price in any market is called Price Action. This movement is caused by the beliefs and trading systems of hundreds of thousands of worldwide traders that the market
On Our Technical Watch
 By the Kenanga Research Team l research@kenanga.com.my Figure 1: Daily Charting FBMKLCI Basic Data Technical Ratings 52-week High 1,729.13 (in Million) 52-week Low 1,600.92 KLCI Vol 99.25 Current Level
What Came First... Fundamentals or the Technicals? By Jared Martinez
 What Came First... Fundamentals or the Technicals? By Jared Martinez I am honored to share my thoughts on our methodologies, focusing on the current technical movements and conditions of the FOREX Markets,
THE CANDLESTICK TRADING BIBLE
 1 Content Introduction 4 Overview 6 History of Candlesticks 8 What is a Candlestick 11 Candlestick Patterns 14 The Engulfing Bar Candlestick 16 The Doji Candlestick Pattern 20 The Dragon Fly Doji Pattern
Technical Stock Market and Stock Analysis UCLA Extension
 Technical Stock Market and Stock Analysis UCLA Extension Date: February 4, 2012 Duration: Instructor: 9:00 AM - 4:00 PM Andrew Lais Investment Executive and General Principal Course Topics and Aim: This
An Introduction to Candlesticks for Options Using Nison Candlesticks as the Foundation to your option trading
 Using Nison Candlesticks as the Foundation to your option trading, CMT President: Candlecharts.com Candlestick Benefits Easy to Understand Early Reversals Safety First East + West All markets All Time
Copyright Alpha Markets Ltd.
 Page 1 Trading Strategies - Module 3 Welcome to this unit on Trading Strategies. In this module we will be explaining the core components of a trading strategy and how you can begin to incorporate analysis
Figure 3.6 Swing High
 Swing Highs and Lows A swing high is simply any turning point where rising price changes to falling price. I define a swing high (SH) as a price bar high, preceded by two lower highs (LH) and followed
Class 7: Moving Averages & Indicators. Quick Review
 Today s Class Moving Averages Class 7: Moving Averages & Indicators 3 Key Ways to use Moving Averages Intro To Indicators 2 Indicators Strength of Lines Quick Review Great for establishing point of Support
Learning Objectives CMT Level I
 Learning Objectives CMT Level I - 2018 An Introduction to Technical Analysis Section I: Chart Development and Analysis Chapter 1 The Basic Principle of Technical Analysis - The Trend Define what is meant
Agenda. Who is Recognia. Event Driven Technical Analysis. Types of Technical Events. Finding and Validating Ideas using Recognia Q & A
 Disclaimer The information presented here is for educational and informational purposes only. The inclusion of any specific securities detailed is for illustrative purposes only. No information contained
IFMC INSTITUTE COURSE BROCHURE
 IFMC INSTITUTE COURSE BROCHURE IFMC BRANCHES LAJPAT NAGAR (DELHI) VAISHALI GHAZIABAD NORTH CAMPUS (DELHI) NOIDA E-90, FIRST FLOOR, LAJPAT NAGAR 1, NEW DELHI - 110024 PLOT No. 3, 2 ND FLOOR, RELIANCE PLAZA
Candlestick Secrets for Profiting in Options Seminar Nison Candlesticks to Guide Your Option Trades
 Nison Candlestick Secrets For Profiting in Options Presentedby Steve Nison President: candlecharts.com Quickly finding the best opportunities in the options markets Nison candlesticks for option strategies
 1 www.candlecharts.com 2 BONUS www. candlecharts.com/special/swing-trading-2/ 3 www. candlecharts.com/special/swing-trading-2/ 4 www. candlecharts.com/special/swing-trading-2/ 5 www. candlecharts.com/special/swing-trading-2/
Compiled by Timon Rossolimos
 Compiled by Timon Rossolimos - 2 - The Seven Best Forex Indicators -All yours! Dear new Forex trader, Everything we do in life, we do for a reason. Why have you taken time out of your day to read this
DAILY DAY TRADING PLAN
 DAILY DAY TRADING PLAN Gatherplace will be used to place all of your trades. You will be using the 5 minute chart for the trade setup and the 1 minute chart for your entry, stop and trailing stop.you will
Candlestick Secrets for Profiting in Options Seminar Nison Candlesticks to Guide Your Option Trades
 Nison Candlestick Secrets For Profiting in Options Presented by Steve Nison President: candlecharts.com Quickly finding the best opportunities in the options markets Nison candlesticks for option strategies
Welcome to TONI TURNER S TRADING SCHOOL. Series
 Welcome to TONI TURNER S TRADING SCHOOL Series Disclaimer This seminar, How to Read Charts: Five Easy Steps to Chart Analysis, was prepared for educational purposes only. Its contents do not recommend,
2.0. Learning to Profit from Futures Trading with an Unfair Advantage! Income Generating Strategies Essential Trading Tips & Market Insights
 2.0 Learning to Profit from Futures Trading with an Unfair Advantage! Income Generating Strategies Essential Trading Tips & Market Insights Income Generating Strategies Essential Trading Tips & Market
Knowing When to Buy or Sell a Stock
 Knowing When to Buy or Sell a Stock Overview Review & Market direction Driving forces of market change Support & Resistance Basic Charting Review & Market Direction How many directions can a stock s price
On Our Technical Watch
 By the Kenanga Research Team l research@kenanga.com.my Figure 1: Daily Charting FBMKLCI Basic Data 52-week High 1,759.76 (in Million) 52-week Low 1,611.88 KLCI Vol 142.09 Current Level 1,744.67 Bursa Vol
presented by Thomas Wood MicroQuant SM Divergence Trading Workshop Day One Naked Trading Part 2
 presented by Thomas Wood MicroQuant SM Divergence Trading Workshop Day One Naked Trading Part 2 Risk Disclaimer Trading or investing carries a high level of risk, and is not suitable for all persons. Before
THE CYCLE TRADING PATTERN MANUAL
 TIMING IS EVERYTHING And the use of time cycles can greatly improve the accuracy and success of your trading and/or system. THE CYCLE TRADING PATTERN MANUAL By Walter Bressert There is no magic oscillator
Monster Market Movers
 Monster Market Movers Prerequisite Manual Better Trades Coach Robert Roy Neither Mastermind Traders or any of its personnel are registered broker-dealers or investment advisers. I will mention that I consider
Technical Analysis Workshop Series. Session Three
 Technical Analysis Workshop Series Session Three DISCLOSURES & DISCLAIMERS This research material has been prepared by NUS Invest. NUS Invest specifically prohibits the redistribution of this material
Stacking Indicators Getting a GREAT entry! TWEEZERS Tweezer top/bottom at the band The stock is trending up Gap down (against the trend) Any moving
 Any moving") Dean Storholt I am not a registered broker-dealer or investment adviser. I will mention that I consider certain securities or positions to be good candidates for the types of strategies we are discussing
Dean Storholt I am not a registered broker-dealer or investment adviser. I will mention that I consider certain securities or positions to be good candidates for the types of strategies we are discussing
Technical Analysis. Prepared by: Mr. SOUR Ramo
 Technical Analysis Prepared by: Mr. SOUR Ramo 1 Contain 1. Introduction 2. Candle Chart 3. Trend Analysis 4. Pattern Analysis 2 1.Introduce 1.1 What is Technical Analysis? Technical analysis is a tool
FOREX TRADING STRATEGIES.
 FOREX TRADING STRATEGIES www.ifcmarkets.com www.ifcmarkets.com 2 One of the most powerful means of winning a trade is the portfolio of Forex trading strategies applied by traders in different situations.
FinQuiz Notes
 Reading 13 Technical analysis is a security analysis technique that involves forecasting the future direction of prices by studying past market data, primarily price and volume. Technical Analysis 2. TECHNICAL
Our aim at S.T.I. is to make Technical Analysis as simple and uncomplicated as possible.
 By MPFX Our aim at S.T.I. is to make Technical Analysis as simple and uncomplicated as possible. We will try to explain the concepts of each indicator in Plain English and include examples where possible.
Monthly Dairy Technical Commentary Thursday September 5, 2013
 Monthly Dairy Technical Commentary Thursday September 5, 2013 CME Class III Milk Futures The weekly price trend for Class III Milk points down from its August 2011 high, and the latest breakdown below
Lara s Weekly. S&P500 + GOLD + USOIL Elliott Wave & Technical Analysis. Lara Iriarte CMT 23 February, 2018
 Lara s Weekly S&P500 + GOLD + USOIL Elliott Wave & Technical Analysis Lara Iriarte CMT 23 February, 2018 S&P 500 Contents S&P 500 GOLD USOIL About Disclaimer 3 18 36 48 48 S&P 500 S&P 500 Upwards movement
Technical Analysis. January 22, 2004 Howard L. Simons
 Technical Analysis Howard L. Simons hsimons@aol.com Components of Trading Trading has three components, in descending order of importance Understanding your own risk tolerance and objectives Managing money
Gold, Mining Stocks on the Verge of a Major Bull Market
 Gold, Mining Stocks on the Verge of a Major Bull Market By Robert McHugh, Ph.D. In looking at the charts for Gold, Silver and Mining Stocks, it is clear that patterns and wave mappings suggest a bottom
Last Gasp in the Dollar. Market Update May 18, Seattle Technical Advisors
 SeattleTA provides investment managers with technical analysis of the equity, fixed-income, commodity, and currency markets. While equities are expected to take a hit this week, the big news is expected
The Most Important Price Action Patterns for Babon Traders
 The Most Important Price Action Patterns for Babon Traders There are dozens of different Price Action formations and Japanese candles' formations, as a matter of fact almost any so called "expert" and
On Our Technical Watch
 By the Kenanga Research Team l research@kenanga.com.my Figure 1: Daily Charting FBMKLCI Basic Data 52-week High 1,759.76 (in Million) 52-week Low 1,611.88 KLCI Vol 140.99 Current Level 1,738.18 Bursa Vol
Submerging Markets. Market Update August 3, Seattle Technical Advisors
 SeattleTA provides investment managers with technical analysis of the equity, fixed-income, commodity, and currency markets. A cycle low is expected in emerging markets this week and is confirmed by a
Trade Ideas A.I. Strategy Descriptions Revised : 10/04/2017
 Trade Ideas A.I. Strategy Descriptions Revised : 10/04/2017 The 5 Day Bounce The trigger for this alert has to cross above resistance while also making a 60 minute high on stocks that are trying to bounce
TRADE ANALYSIS. August 2017 Performance
 EUR/AUD SHORT Entry Date 01/08/2017 Entry point 1.4930 Stop-Loss 1.4980 Risk-Reward Ratio 14 Target 1.4230 As indicated on the chart we can see that the pair previously reversed to the downside between
On Our Technical Watch
 By Lawrence Yeo / lawrenceyeo@kenanga.com.my; Steven Chan / steven.chan@kenanga.com.my; Muhammad Afif Bin Zulkaplly / muhammad.afif@kenanga.com.my Figure 1: Daily Charting FBMKLCI Basic Data 52-week High
Technical Analysis and Charting Part II Having an education is one thing, being educated is another.
 Chapter 7 Technical Analysis and Charting Part II Having an education is one thing, being educated is another. Technical analysis is a very broad topic in trading. There are many methods, indicators, and
10-Year Treasury Notes ($UST Price)
") 1 Weekly Inter-market Technical Report 10-Year Treasury Notes ($UST Price) Monthly The 10-Year Note has developed a clear rising parallel trend channel that reaches now to the $128 level with confluence
1 Weekly Inter-market Technical Report 10-Year Treasury Notes ($UST Price) Monthly The 10-Year Note has developed a clear rising parallel trend channel that reaches now to the $128 level with confluence
Ichimoku Charts How to read Clouds for Profitable Advantage
 Ichimoku Charts How to read Clouds for Profitable Advantage David Linton Updata david@updata.co.uk What I will cover General Points about Technical Analysis Theory, Cloud Construction, Interpretation Examples
BONUS. www. candlecharts.com/special/swing-trading-2/
 BONUS www. candlecharts.com/special/swing-trading-2/ 1 www. candlecharts.com/special/swing-trading-2/ www. candlecharts.com/special/swing-trading-2/ www. candlecharts.com/special/swing-trading-2/ 2 www.
TWEEZERS TOPS AND BOTTOMS
 88 The Basics TWEEZERS TOPS AND BOTTOMS Tweezers are two or more candlestick lines with matching highs or lows. They are called tweezers because they are compared to the two prongs of a tweezers. In a
ART OF TRADING. Master the
 Master the ART OF TRADING EXPERT TRAINING FROM TRADING MASTERS AND COACHING PROFESSIONALS From learning the basics to creating a trading plan, our programs will help you increase your knowledge and improve
In this report, I will give you a step by step set of instructions for utilizing The Lazy River Scalping Strategy my favorite scalping method.
 What is Scalping? In short, scalping is the idea of taking quick trades (typically on smaller time frames) that only need to go a short distance before you cash out of the position and then to do this