Agenda. Who is Recognia. Event Driven Technical Analysis. Types of Technical Events. Finding and Validating Ideas using Recognia Q & A
|
|
|
- Lilian Haynes
- 6 years ago
- Views:
Transcription


1
2 Disclaimer The information presented here is for educational and informational purposes only. The inclusion of any specific securities detailed is for illustrative purposes only. No information contained in this presentation is intended to constitute a recommendation by Recognia to buy, sell, or hold any stock, option, or securities. 2
3 Agenda Who is Recognia Event Driven Technical Analysis Types of Technical Events Short-term patterns Indicators and oscillators Classic patterns Finding and Validating Ideas using Recognia Q & A 3

4 Corporate Overview Part of the Trading Central Group since Leaders in technical, fundamental and quantitative research worldwide. Major offices in London, Paris, New York, Hong Kong and Ottawa. Global coverage of stocks, ETFs, indices, options, FX and futures. Team of analysts based in Hong Kong, Paris and Ottawa. Automated analysis of 85,000 financial instruments daily. Services provisioned to 20M active traders and investors worldwide. Recognia Envisioning Workshop 4
5 Basics of Technical Analysis Looking for patterns and relationships in price and volume history that identify attitudes of buyers and sellers Shifts in the balance of supply and demand To assist in making investment and trading decisions 5
6 Market Cycles Short-term trend 2 to 6 weeks Charles Dow compared cycles to tides, waves and ripples Intermediate trend 6 weeks to 9 months Primary trend 9 months to 2 years

7 Why Study Price? The market price reflects the hopes and fears and guesses and moods, rational and irrational, of hundreds of potential buyers and sellers Price is the only figure that counts. 7
8 An Example Prices move in trends until Something changes to affect supply and demand 8

9 An Example Head & Shoulders Bottom Prices move in trends until Something changes to affect supply and demand Marked by patterns in price and volume history 9
10 Traditional Approach 10
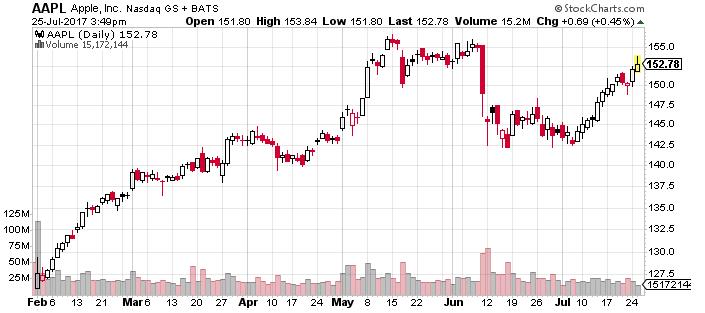
11 11
12 12
13 13
14 14
15 15
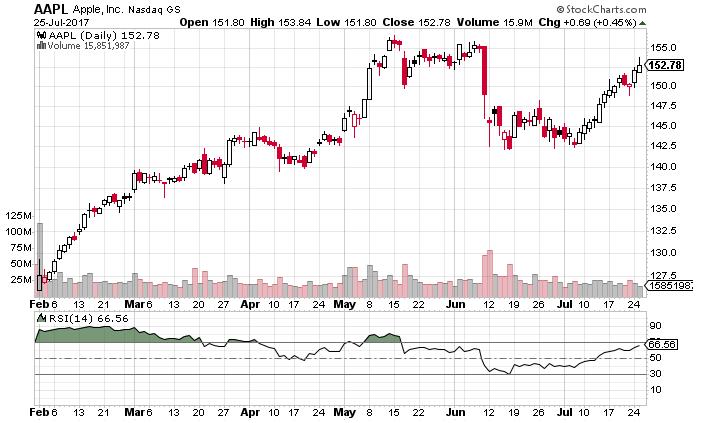
16 My Watchlist AAPL WFC GLD TSLA CSCO SPY NFLX INTC QQQ AMZN MSFT IWM GOOG FB F LLL VWO XLF And more BAC V MDY C MDLZ XLV GM TOL XLK GPRO UNP SDY SNAP NSC XLY 16
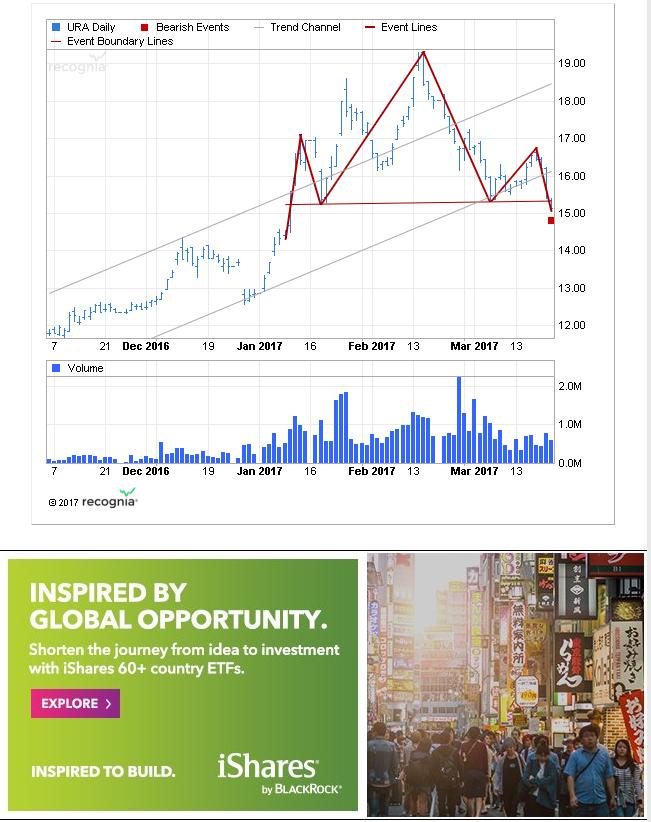
17 An Event Driven Approach 17
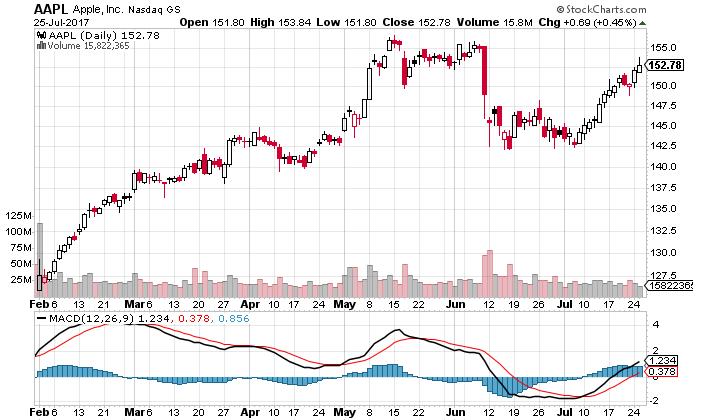
18 Recognia Technical Events Short-term Patterns Hammers Shooting stars Gap ups and downs Bullish engulfing line Bearish engulfing lines Gravestones Hanging man Inverted hammers Island bottoms Island tops Shooting stars And more Indicators and Oscillators Price Crosses Moving Average Double moving average crossovers Triple moving average crossovers MACD (Moving average convergence divergence) Momentum Relative strength indicator (RSI) Short-term KST Intermediate-term KST Long-term KST And more Classic Chart Patterns Head and shoulders tops and bottoms Symmetrical continuation triangles Double tops and bottoms Ascending continuation triangles Descending continuation triangles Bottom triangles / wedges Top triangles / wedges Continuation diamonds Continuation wedges Diamond tops and bottoms Megaphone tops and bottoms Triple tops and bottoms Upside/downside breakouts And more Recognia automatically detects 60+ different Technical Events 18
19 Technical Event Types Short-term Patterns Based on the shape and relationship of candlesticks or price bars Indicators & Oscillators Classic Patterns 19
20 Hammer
21 Hammer identified Hammer
22 Hanging Man A bearish reversal pattern Small real body and very long lower shadow
23 Hanging Man Want a lower shadow at least twice the size of the real body
24 Hanging Man Two hanging men; which is the more significant? A B
25 Bearish Engulfing Pattern Black candle s real body completely engulfs the white one
26 Bullish Engulfing Pattern White candle s real body completely engulfs the black one Bullish Engulfing Pattern
27 Bullish Engulfing Pattern Engulfing pattern after a sharp decline is usually more effective
28 Bearish Engulfing Pattern Engulfing pattern after a sharp rally is usually more effective
29 Engulfing Patterns Stronger because it engulfs the real body and wicks
30 Technical Event Classes Short-term Patterns Based on the shape and relationship of candlesticks or price bars Indicators & Oscillators Based on moving averages and various mathematical functions Classic Patterns Distinct price swings forming shape on chart 30
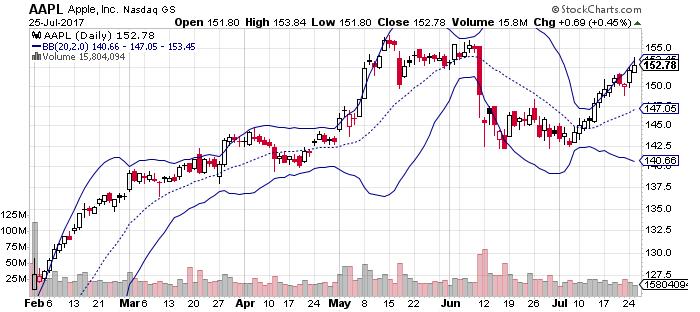
31 Various Types Trend following Smooths price so trends can be seen as lines Momentum Measures the speed or direction of price changes Stochastics Measures the position of the close price relative to the recent highs and lows 31
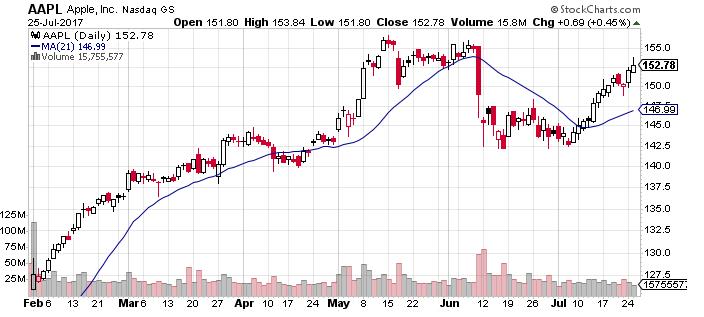
32 Moving Averages Simple Moving Average is defined to be the average price over last N days Also Exponential MA, Weighted MA, Adaptive MA, etc. Work best in trending markets Time frames are relative 200 day moving average used in silver because Kodak used it to monitor inventory levels 4 month moving average used for soybeans because that is the shelf life of margarine 32
33 200 day SMA 50 day SMA 33
34 200 day SMA 50 day SMA 34
35 Technical Event Classes Short-term Patterns Based on the shape and relationship of candlesticks or price bars Indicators & Oscillators Classic Patterns Distinct price swings forming shape on chart 35
36 Symmetrical Continuation Triangle 36
37 Confirmation Symmetrical Continuation Triangle 37
38 Pattern Height = Expected Move 38
39 Pattern Duration = Trading Horizon 39

40 Triple Bottoms / Tops The Triple Bottom starts with prices moving downward followed by three sharp lows Volume decreases with each successive low and finally bursts as the price rises above the highest high confirming a bullish price reversal Bearish counterpart is the Triple Top 40

41 Double Bottoms / Tops The Double Bottom pattern marks the reversal of a prior downtrend The price form two distinct lows are roughly the same level Price finally breaks upward above the highest high to confirm the bullish signal Bearish counterpart is the Double Top 41
42 Triangles The bullish triangle is characterized by two converging trendlines as prices reach lower highs and higher lows At roughly 2/3 to 3/4 of the distance to the apex, the price breaks upward above the upper trendline with a noticeable increase in volume Types of triangles include: top triangles, bottom triangles and bullish/bearish continuation triangles 42

43 Upside / Downside Breakouts The Upside Breakout pattern occurs when the price breaks upward through the top of a trading range marked by horizontal trendlines This bullish pattern indicates a change in sentiment amongst traders Bearish counterpart is the Downside Breakout 43
44 Megaphone Bottom / Top The rare Megaphone Bottom (a.k.a. Broadening Pattern) is characterized by its successively higher highs and lower lows which form after a downward move The bullish pattern is confirmed when the price breaks upward above the highest high and fails to fall below this level again The bearish counterpart is the Megaphone Top 44

45 Diamonds A bullish Diamond pattern is characterized by prices forming higher high and lower lows in a broadening pattern. The trading range then narrows with lower highs and higher lows forming The price breaks upward above the upper trendline signaling the formation of a new trend Volume may remain high during the formation of a Diamond pattern Types of Diamonds include: Diamond Bottom, Diamond Top, Bullish/Bearish 45
46 Rounded Bottoms / Tops A Rounded Bottom follows a downtrend forming a gradual bowlshape reflecting a shift in the balance of supply and demand. Volume tends to mirror the price pattern As sentiment turns, the price starts to move upward and volume begins to increase The bullish pattern is confirmed when the price crosses above its moving average 46

47 Recognia ETF Newsletter

48 Recognia ETF Newsletter

49 To Subscribe

50 To Subscribe e.shtml?page=add


51 Q & A 51
Introduction. Technical analysis is the attempt to forecast stock prices on the basis of market-derived data.
 Technical Analysis Introduction Technical analysis is the attempt to forecast stock prices on the basis of market-derived data. Technicians (also known as quantitative analysts or chartists) usually look
Introduction. Technicians (also known as quantitative analysts or chartists) usually look at price, volume and psychological indicators over time.
 usually look at price, volume and psychological indicators over time.") Technical Analysis Introduction Technical Analysis is the study of market action, primarily through the use of charts, for the purpose of forecasting future price trends. Technicians (also known as quantitative
Technical Analysis Introduction Technical Analysis is the study of market action, primarily through the use of charts, for the purpose of forecasting future price trends. Technicians (also known as quantitative
INTERMEDIATE EDUCATION GUIDE
 INTERMEDIATE EDUCATION GUIDE CONTENTS Key Chart Patterns That Every Trader Needs To Know Continution Patterns Reversal Patterns Statistical Indicators Support And Resistance Fibonacci Retracement Moving
CMT LEVEL I CURRICULUM Self-Evaluation
 CMT LEVEL I CURRICULUM Self-Evaluation DEAR CFA CHARTERHOLDER, As a CFA charterholder, the requirement that you sit for the CMT Level I exam is waived. However, the content in the CMT Level I Curriculum
Technical Analysis Workshop Series. Session Six 1, 2, 3 Price-Bars Patterns
 Technical Analysis Workshop Series Session Six 1, 2, 3 Price-Bars Patterns DISCLOSURES & DISCLAIMERS This research material has been prepared by NUS Invest. NUS Invest specifically prohibits the redistribution
CONNECING THE DOTS Candlesticks & Convergence of Clues. The Art & Science of Active Trend Trading
 CONNECING THE DOTS Candlesticks & Convergence of Clues The Art & Science of Active Trend Trading Disclaimer U.S. Government Required Disclaimer Commodity Futures Trading Commission Futures and Options
CHARTS. Bar Line Candlestick Charts are the basis of technical analysis They are a graphic display of price action. Notes:
 TECHNICAL ANALYSIS CHARTS Bar Line Candlestick Charts are the basis of technical analysis They are a graphic display of price action Candlestick charts have become the industry standard for technical traders.
PART 3 - CHART PATTERNS & TECHNICAL INDICATORS
 Tyler Chianelli s EASYOPTIONTRADING by OPTION TRADING COACH PART 3 - CHART PATTERNS & TECHNICAL INDICATORS A SIMPLE SYSTEM FOR TRADING OPTIONS WORKS IN UP, DOWN, AND SIDEWAYS MARKETS PART 3.1 - PRIMARY
Chapter Eight. Japanese Candle Chart
 Chapter Eight Japanese Candle Chart Candle chart (also called candlestick) analysis has been used since the 18 th century by Japanese rice traders to predict the rice price s movement. According to sources,
Technical Analysis Workshop Series. Session Three
 Technical Analysis Workshop Series Session Three DISCLOSURES & DISCLAIMERS This research material has been prepared by NUS Invest. NUS Invest specifically prohibits the redistribution of this material
The Art & Science of Active Trend Trading
 CONNECTING THE DOTS Candlesticks & Convergence of Clues The Art & Science of Active Trend Trading Copyright ATTS 2007-2015 1 Dennis W. Wilborn, P.E. Founder, President Active Trend Trading dww@activetrendtrading.com
Technical Analysis. Prepared by: Mr. SOUR Ramo
 Technical Analysis Prepared by: Mr. SOUR Ramo 1 Contain 1. Introduction 2. Candle Chart 3. Trend Analysis 4. Pattern Analysis 2 1.Introduce 1.1 What is Technical Analysis? Technical analysis is a tool
FinQuiz Notes
 Reading 13 Technical analysis is a security analysis technique that involves forecasting the future direction of prices by studying past market data, primarily price and volume. Technical Analysis 2. TECHNICAL
The Art & Science of Active Trend Trading
 CONNECTING THE DOTS Candlesticks & Convergence of Clues The Art & Science of Active Trend Trading Copywrite ATTS 2007-2015 1 Dennis W. Wilborn, P.E. Founder, President Active Trend Trading dww@activetrendtrading.com
Test Your Chapter 1 Knowledge
 Self-Test Answers Test Your Chapter 1 Knowledge 1. Which is the preferred chart type in LOCKIT? The preferred chart type in LOCKIT is the candle chart because candle patterns are part of the decision-making
The Art & Science of Active Trend Trading
 Candlesticks Looking for U-Turns The Art & Science of Active Trend Trading Copywrite ATTS 2007-2015 1 Disclaimer U.S. Government Required Disclaimer Commodity Futures Trading Commission Futures and Options
Real-time Analytics Methodology
 New High/Low New High/Low alerts are generated once daily when a stock hits a new 13 Week, 26 Week or 52 Week High/Low. Each second of the trading day, the stock price is compared to its previous 13 Week,
Lighting the Way: Using Candlestick Patterns. The Art & Science of Active Trend Trading
 Lighting the Way: Using Candlestick Patterns The Art & Science of Active Trend Trading Disclaimer U.S. Government Required Disclaimer Commodity Futures Trading Commission Futures and Options trading has
The Technical Edge Page 1. The Technical Edge. Part 1. Indicator types: price, volume, and moving averages and momentum
 The Technical Edge Page 1 The Technical Edge INDICATORS Technical analysis relies on the study of a range of indicators. These come in many specific types, based on calculations or price patterns. For
Level I Learning Objectives by chapter
 Level I Learning Objectives by chapter 1. Introduction to the Evolution of Technical Analysis Describe the development of modern technical analysis Describe the origins of technical analysis 2. A New Age
On Our Technical Watch
 By the Kenanga Research Team l research@kenanga.com.my Figure 1: Daily Charting FBMKLCI Index Basic Data 52-week High 1,729.13 (in Million) 52-week Low 1,600.92 KLCI Vol 199.37 Current Level 1,662.92 Bursa
On Our Technical Watch
 By the Kenanga Research Team l research@kenanga.com.my Figure 1: Daily Charting FBMKLCI Basic Data 52-week High 1,759.76 (in Million) 52-week Low 1,611.88 KLCI Vol 129.13 Current Level 1,740.60 Bursa Vol
FOREX. analysing made easy. UNDERSTANDING TECHNICAL ANALYSIS An educational tool by Blackwell Global
 FOREX analysing made easy UNDERSTANDING TECHNICAL ANALYSIS An educational tool by Blackwell Global Risk Warning: Forex and CFDs are leveraged products and you may lose your initial deposit as well as substantial
Profitable Patterns. Do you believe there are profits to be made in stocks? With the right tools, anyone can make consistent money in stocks.
 Profitable Patterns Do you believe there are profits to be made in stocks? With the right tools, anyone can make consistent money in stocks. Level of RESISTANCE Price per share has NOT been able to "Break
On Our Technical Watch
 By the Kenanga Research Team l research@kenanga.com.my Figure 1: Daily Charting FBMKLCI Basic Data 52-week High 1,729.13 (in Million) 52-week Low 1,611.88 KLCI Vol 166.34 Current Level 1,708.08 Bursa Vol
20.2 Charting the Market
 NPTEL Course Course Title: Security Analysis and Portfolio Management Course Coordinator: Dr. Jitendra Mahakud Module-10 Session-20 Technical Analysis-II 20.1. Other Instruments of Technical Analysis Several
SXXP and SX5E nearing their downtrends. Gold remains a short in line with the trend. Dollar index at key support. EURUSD bearish candle
 Andy Dodd MSTA - +44 020 7031 4651 adodd@louiscapital.com Twitter : @louiscaptech SXXP and SX5E nearing their downtrends. Gold remains a short in line with the trend Dollar index at key support EURUSD
On Our Technical Watch
 By Lawrence Yeo Eng Chien l lawrenceyeo@kenanga.com.my Figure 1: Daily Charting FBMKLCI Basic Data 52-week High 1,795.00 (in Million) 52-week Low 1,611.88 KLCI Vol 136.57 Current Level 1,791.01 Bursa Vol
Technical Stock Market and Stock Analysis UCLA Extension
 Technical Stock Market and Stock Analysis UCLA Extension Date: February 4, 2012 Duration: Instructor: 9:00 AM - 4:00 PM Andrew Lais Investment Executive and General Principal Course Topics and Aim: This
On Our Technical Watch
 By the Kenanga Research Team l research@kenanga.com.my Figure 1: Daily Charting FBMKLCI Index Basic Data 52-week High 1,729.13 (in Million) 52-week Low 1,600.92 KLCI Vol 85.75 Current Level 1,665.32 Bursa
On Our Technical Watch
 By Lawrence Yeo Eng Chien / lawrenceyeo@kenanga.com.my ; Steven Chan / steven.chan@kenanga.com.my; Muhammad Afif Zulkaplly / muhammad.afif@kenanga.com.my Figure 1: Daily Charting FBMKLCI Basic Data 52-week
Introduction to Technical Analysis
 Introduction to Technical Analysis All About Chart Patterns, Candlesticks and Technical Studies rjofutures.rjobrien.com 800-441-1616 A division of R.J. O Brien Important Information About Trading Futures
OSCILLATORS. TradeSmart Education Center
 OSCILLATORS TradeSmart Education Center TABLE OF CONTENTS Oscillators Bollinger Bands... Commodity Channel Index.. Fast Stochastic... KST (Short term, Intermediate term, Long term) MACD... Momentum Relative
IFMC INSTITUTE COURSE BROCHURE
 IFMC INSTITUTE COURSE BROCHURE IFMC BRANCHES LAJPAT NAGAR (DELHI) VAISHALI GHAZIABAD NORTH CAMPUS (DELHI) NOIDA E-90, FIRST FLOOR, LAJPAT NAGAR 1, NEW DELHI - 110024 PLOT No. 3, 2 ND FLOOR, RELIANCE PLAZA
On Our Technical Watch
 By the Kenanga Research Team l research@kenanga.com.my Figure 1: Daily Charting FBMKLCI Basic Data 52-week High 1,759.76 (in Million) 52-week Low 1,611.88 KLCI Vol 84.65 Current Level 1,733.93 Bursa Vol
Candlesticks Discoveries Probability of Success Aug 6, 2016
 Candlesticks Discoveries Probability of Success Aug 6, 2016 The Art & Science of Active Trend Trading Disclaimer U.S. Government Required Disclaimer Commodity Futures Trading Commission Futures and Options
How to Spot Candlestick Formations in the Stock Market & What to Do Once You Spot Them
 How to Spot Candlestick Formations in the Stock Market & What to Do Once You Spot Them WHAT IS A CANDLESTICK? ACandlestick measures price fluctuations within a defined period of time. Colors differentiate
On Our Technical Watch
 By the Kenanga Research Team l research@kenanga.com.my Figure 1: Daily Charting FBMKLCI Basic Data Technical Ratings 52-week High 1,729.13 (in Million) 52-week Low 1,600.92 KLCI Vol 93.61 Current Level
Technical Analysis Workshop Series. Session Two
 Technical Analysis Workshop eries ession Two DICLOURE & DICLAIMER This research material has been prepared by NU Invest. NU Invest specifically prohibits the redistribution of this material in whole or
presented by Thomas Wood MicroQuant SM Divergence Trading Workshop Day One Naked Trading Part 2
 presented by Thomas Wood MicroQuant SM Divergence Trading Workshop Day One Naked Trading Part 2 Risk Disclaimer Trading or investing carries a high level of risk, and is not suitable for all persons. Before
Technical Stock Screener Page 1
 Technical Stock Screener www.dojispace.com Page 1 Disclaimer The information provided is not to be considered as a recommendation to buy certain stocks and is provided solely as an information resource
Mastering the Markets
 www.mastermindtraders.com Presents Mastering the Markets Your Path to Financial Freedom DISCLAIMER Neither or any of its personnel are registered broker-dealers or investment advisors. We may mention that
On Our Technical Watch
 By Lawrence Yeo / lawrenceyeo@kenanga.com.my; Steven Chan / steven.chan@kenanga.com.my; Muhammad Afif Bin Zulkaplly / muhammad.afif@kenanga.com.my Figure 1: Daily Charting FBMKLCI Basic Data 52-week High
A handbook of the basics
 Primer Market Analysis United States 14 May 2013 A handbook of the basics Market Analysis Technical Handbook We cover the basics of Trend, Momentum and other technical indicators and methods. Stephen Suttmeier,
The six technical indicators for timing entry and exit in a short term trading program
 The six technical indicators for timing entry and exit in a short term trading program Definition Technical analysis includes the study of: Technical analysis the study of a stock s price and trends; volume;
On Our Technical Watch
 By the Kenanga Research Team l research@kenanga.com.my Figure 1: Daily Charting FBMKLCI Basic Data 52-week High 1,757.99 (in Million) 52-week Low 1,611.88 KLCI Vol 137.65 Current Level 1,754.42 Bursa Vol
On Our Technical Watch
 By the Kenanga Research Team l research@kenanga.com.my Figure 1: Daily Charting FBMKLCI Basic Data 52-week High 1,759.76 (in Million) 52-week Low 1,611.88 KLCI Vol 112.14 Current Level 1,735.84 Bursa Vol
On Our Technical Watch
 By the Kenanga Research Team l research@kenanga.com.my Figure 1: Daily Charting FBMKLCI Basic Data Technical Ratings 52-week High 1,729.13 (in Million) 52-week Low 1,600.92 KLCI Vol 99.25 Current Level
Market Observations - as of Sep 28, 2018
 Market Observations - as of Sep 28, 2018 By Carl Jorgensen - For Objective Traders - For educational purposes only. Not Financial Advice. The month week, month and quarter ended with not much change in
On Our Technical Watch
 By Lawrence Yeo / lawrenceyeo@kenanga.com.my; Steven Chan / steven.chan@kenanga.com.my; Muhammad Afif Bin Zulkaplly / muhammad.afif@kenanga.com.my Figure 1: Daily Charting FBMKLCI Basic Data 52-week High
Interactive Practice Questions
 Bonus Handouts Interactive Q and A companion for video workshop Secrets of Becoming a Samurai Trader: Advanced Candlestick Charting Techniques with Steve Nison These extra handouts (which are not part
Market Observations - as of Aug 17, 2018
 Market Observations - as of Aug 17, 2018 By Carl Jorgensen - For Objective Traders - For educational purposes only. Not Financial Advice. This week we saw a reversal of roles from the prior week. This
S&P Cash Long Term: Uptrend Intact. Monthly Log Chart
 Andy Dodd MSTA - +44 020 7031 4651 adodd@louiscapital.com Twitter : @louiscaptech S&P Cash Long Term: Uptrend Intact Despite an initial slowdown in momentum following the break above 2120 in July, which
On Our Technical Watch
 By the Kenanga Research Team l research@kenanga.com.my Figure 1: Daily Charting FBMKLCI Basic Data 52-week High 1,757.99 (in Million) 52-week Low 1,611.88 KLCI Vol 174.33 Current Level 1,748.30 Bursa Vol
Thank you For Reading
 Thank you For Reading Welcome to the second issue of the TradingFibz, LLC weekly supplemental newsletter. It is my hope that over the next month, the newsletter will take on a new look and add in additional
On Our Technical Watch
 By the Kenanga Research Team l research@kenanga.com.my Figure 1: Daily Charting FBMKLCI Basic Data 52-week High 52-week Low Current Level Intraday High Intraday Low 1,729.13 1,611.88 1,688.84 1,690.91
2 Day Executive Workshop on Technical Analysis
 National Stock Exchange of India Limited 2 Day Executive Workshop on Technical Analysis OVERVIEW Technical Analysis is a science worth exploring for each market participant. Given the volatile nature of
TECHNICAL ANALYSIS. SURI DUDDELLA Trading Broadening Top/Bottom Patterns
 SURI DUDDELLA Trading Broadening Top/Bottom Patterns 8 Broadening top and bottom patterns are considered reversal patterns and usually appear at the major tops/ bottoms. Suri Duddella discusses how to
The truth behind commonly used indicators
 Presents The truth behind commonly used indicators Pipkey Report Published by Alaziac Trading CC Suite 509, Private Bag X503 Northway, 4065, KZN, ZA www.tradeology.com Copyright 2014 by Alaziac Trading
Forex Sentiment Report Q2 FORECAST WEAK AS LONG AS BELOW April
 Forex Sentiment Report 08 April 2015 www.ads-securities.com Q2 FORECAST WEAK AS LONG AS BELOW 1.1200 Targets on a break of 1.1534/35: 1.1740/50 1.1870/75 1.2230/35 Targets on a break of 1.0580/70: 1.0160
Raising Investment Standards TRADING SEMINAR
 Raising Investment Standards TRADING SEMINAR Raising Investment Standards DISCLAIMER Leveraged foreign exchange and options trading carries a significant level of risk, and may not be suitable for all
Technical Analysis and Charting Part II Having an education is one thing, being educated is another.
 Chapter 7 Technical Analysis and Charting Part II Having an education is one thing, being educated is another. Technical analysis is a very broad topic in trading. There are many methods, indicators, and
Top Down Analysis Success Demands Singleness of Purpose
 Chapter 9 Top Down Analysis Success Demands Singleness of Purpose Armed with a little knowledge about the stock and options market as well as a desire to trade, many new traders are faced with the daunting
Learning Objectives CMT Level I
 Learning Objectives CMT Level I - 2018 An Introduction to Technical Analysis Section I: Chart Development and Analysis Chapter 1 The Basic Principle of Technical Analysis - The Trend Define what is meant
TRADING ACADEMY MODULE-3 TECHNICAL ANALYSIS SECTION-6 PRICE ACTION. LEVEL-1: THE COMPLETE GUIDE TO TRADING FOREX & CFDs
 TRADING ACADEMY LEVEL-1: THE COMPLETE GUIDE TO TRADING FOREX & CFDs MODULE-3 TECHNICAL ANALYSIS SECTION-6 PRICE ACTION TRADING ACADEMY LIMITED MODULE-3: TECHNICAL ANALYSIS SECTION-6: PRICE ACTION TRADING
JAPANESE CANDLESTICKS
 Edited by Kaspirano JAPANESE CANDLESTICKS In the 1600s, the Japanese developed a method of technical analysis to analyze the price of rice contracts. This technique is called candlestick charting. Steven
Chart Patterns & Algo. Trader
 surinotes.com s 1 Sep. 25, 2017 Chart Patterns & Algo. Trader A Weekly Magazine Stocks/Options/Futures Commodities/FX Daily/Weekly/Monthly Analysis Watchlists Auto Generated Chart Patterns/Analysis Algorithmic
Technical analysis & Charting The Foundation of technical analysis is the Chart.
 Technical analysis & Charting The Foundation of technical analysis is the Chart. Charts Mainly there are 2 types of charts 1. Line Chart 2. Candlestick Chart Line charts A chart shown below is the Line
Market Observations - as of Jun 8, 2018
 Market Observations - as of Jun 8, 2018 By Carl Jorgensen - For Objective Traders - For educational purposes only. Not Financial Advice. Over the past four months we have seen several examples of Consolidation
Thank you For Reading
 Thank you For Reading Welcome to the 7th issue of the TradingFibz, LLC weekly supplemental newsletter. Templates now available for purchase and added video each week. At some point in the near future,
On Our Technical Watch
 By the Kenanga Research Team l research@kenanga.com.my Figure 1: Daily Charting FBMKLCI Basic Data 52-week High 1,759.76 (in Million) 52-week Low 1,611.88 KLCI Vol 142.09 Current Level 1,744.67 Bursa Vol
On Our Technical Watch
 By the Kenanga Research Team l research@kenanga.com.my Figure 1: Daily Charting FBMKLCI Basic Data 52-week High 1,759.76 (in Million) 52-week Low 1,611.88 KLCI Vol 140.99 Current Level 1,738.18 Bursa Vol
The Dow Theory in Technical Analysis
 The Dow Theory in Technical Analysis INTRODUCTION Today Foreign Exchange Market is one of the popular segments of the global financial market. FOREX is the largest and the most liquid financial market
Learning Objectives CMT Level II
 Theory and Analysis Learning Objectives CMT Level II - 2018 Section I: Chart Development and Analysis Chapter 1 Charting Explain the six basic tenets of Dow Theory Interpret chart data using various chart
Additional Reading Material on Technical Analysis
 Additional Reading Material on Relevant for 1. Module 7 (Financial Statement Analysis and Asset Valuation) 2. Module 18 (Securities and Derivatives Trading [Products and Analysis]) Copyright 2017 Securities
Table of Contents. Risk Disclosure. Things we will be going over. 2 Most Common Chart Layouts Anatomy of a candlestick.
 Table of Contents Risk Disclosure Things we will be going over 2 Most Common Chart Layouts Anatomy of a candlestick Candlestick chart Anatomy of a BAR PLOT Indicators Trend-Lines Volume MACD RSI The Stochastic
Martin Pring s. Weekly InfoMovie Report. April 8, 2014
 Martin Pring s Weekly InfoMovie Report April 8, 2014 Issue 1093 Weekly InfoMovie Report 1 Key level remains $184 on the SPY. US Equity Market - Last time I pointed out that the $184 level on the S&P ETF
FOREX TRADING STRATEGIES.
 FOREX TRADING STRATEGIES www.ifcmarkets.com www.ifcmarkets.com 2 One of the most powerful means of winning a trade is the portfolio of Forex trading strategies applied by traders in different situations.
Market Observations - as of Aug 24, 2018
 Market Observations - as of Aug 24, 2018 By Carl Jorgensen - For Objective Traders - For educational purposes only. Not Financial Advice. This week we mostly saw quiet changes in leadership as sector rotation
Technical Analysis Workshop Series. Session 11 Semester 2 Week 5 Oscillators Part 2
 Technical Analysis Workshop Series Session 11 Semester 2 Week 5 Oscillators Part 2 DISCLOSURES & DISCLAIMERS This research material has been prepared by NUS Invest. NUS Invest specifically prohibits the
Trend Channels: How to Identify Easy Profit-Making Opportunities Using Simple Chart Analysis
 Trend Channels: How to Identify Easy Profit-Making Opportunities Using Simple Chart Analysis Trend channels produce a very powerful trading technique. They are very visible, which makes them easy to utilize
Introduction...1 Part I: Getting Familiar with Candlestick Charting and Technical Analysis...7. Part V: The Part of Tens...315
 Contents at a Glance Introduction...1 Part I: Getting Familiar with Candlestick Charting and Technical Analysis...7 Chapter 1: Understanding Charting and Where Candlesticks Fit In...9 Chapter 2: Getting
15 th March Gold Silver Copper Zinc Lead Aluminium Nickel Crude Oil Natural Gas Guar seed Castor seed. Bullion. Base Metal. Energy.
 15 th March 2018 Bullion Base Metal Energy Agro Gold Silver Copper Zinc Lead Aluminium Nickel Crude Oil Natural Gas Guar seed Castor seed On the daily chart MCX Gold price has given rising wedge breakdown
Intermediate - Trading Analysis
 Intermediate - Trading Analysis Technical Analysis Technical analysis is the attempt to forecast currencies prices on the basis of market-derived data. Technicians (also known as quantitative analysts
Our aim at S.T.I. is to make Technical Analysis as simple and uncomplicated as possible.
 By MPFX Our aim at S.T.I. is to make Technical Analysis as simple and uncomplicated as possible. We will try to explain the concepts of each indicator in Plain English and include examples where possible.
On Our Technical Watch
 By Lawrence Yeo / lawrenceyeo@kenanga.com.my; Steven Chan / steven.chan@kenanga.com.my; Muhammad Afif Bin Zulkaplly / muhammad.afif@kenanga.com.my Figure 1: Daily Charting FBMKLCI Basic Data 52-week High
Market Turning Points By Andre Gratian
 Market Turning Points By Andre Gratian June 21, 2015 Precision timing for all time frames through a multi-dimensional approach to forecasting using technical analysis: Cycles - Breadth - P&F and Fibonacci
Chapter 2.3. Technical Indicators
 1 Chapter 2.3 Technical Indicators 0 TECHNICAL ANALYSIS: TECHNICAL INDICATORS Charts always have a story to tell. However, sometimes those charts may be speaking a language you do not understand and you
Martin Pring s. Weekly InfoMovie Report. April 12, 2012
 Martin Pring s Weekly InfoMovie Report April 12, 2012 Issue 993 Weekly InfoMovie Report 1 Bearish US Equity Market - Last week I pointed out that this up trendline for the diffusion indicator monitoring
Reversal Candles. Candlestick Bearish Reversal Patterns. Bearish Confirmation. Existing Downtrend
 Candlestick Bearish Reversal Patterns There are dozens of bearish reversal patterns. We have elected to narrow the field by selecting a few of the most popular patterns for detailed explanations. Below
Candlestick Secrets for Profiting in Options Seminar The Foundation of Options
 Option Spreads 45 Bull Vertical Spreads Bull call (debit) & Bull put (credit) 46 Bull Call Spreads Buy lower strike (95) call Sell higher strike (100) call (same expiration) Which of these two strikes
Glossary of Technical Analysis Terms
 George Davis, CMT Chief Technical Analyst RBC Dominion Securities Inc. +1 416 842 6633 george.davis@rbccm.com Global FX Strategy 13 January 2010 Glossary of Technical Analysis Terms Introduction Although
Level I Learning Objectives by chapter (2017)
") Level I Learning Objectives by chapter (2017) 1. The Basic Principle of Technical Analysis: The Trend Define what is meant by a trend in Technical Analysis Explain why determining the trend is important
Level I Learning Objectives by chapter (2017) 1. The Basic Principle of Technical Analysis: The Trend Define what is meant by a trend in Technical Analysis Explain why determining the trend is important
Last Gasp in the Dollar. Market Update May 18, Seattle Technical Advisors
 SeattleTA provides investment managers with technical analysis of the equity, fixed-income, commodity, and currency markets. While equities are expected to take a hit this week, the big news is expected
Candlestick Signals and Option Trades (Part 3, advanced) Hour One
 Hour One") Candlestick Signals and Option Trades (Part 3, advanced) Hour One 1. Hedges, long and short A hedge is any strategy designed to reduce or eliminate market risk. This applies to equity positions and the
Candlestick Signals and Option Trades (Part 3, advanced) Hour One 1. Hedges, long and short A hedge is any strategy designed to reduce or eliminate market risk. This applies to equity positions and the
Market Observations - as of Jul 27, 2018
 Market Observations - as of Jul 27, 2018 By Carl Jorgensen - For Objective Traders - For educational purposes only. Not Financial Advice. This week began with most markets continuing their bullish trends
Candlestick Forum Boot Camp. High Profit Patterns. Why is it important to know the patterns? Eliminates emotions
 Candlestick Forum Boot Camp High Profit Patterns Why is it important to know the patterns? Eliminates emotions 1 Advanced Candlestick Patterns Fry Pan Bottom Dumpling Top Cradle Pattern Jay-Hook Scoop
Lecture 9, Part 2. Graphical Patterns Analysis. Continuation Patterns
 Lecture 9, Part 2 Graphical Patterns Analysis Continuation Patterns The graphical configurations we would look into are called continuation patterns. Such models usually mean that the period of price stagnation
What is it really? Presentation to the Melbourne ATAA meeting 8 October, Technical Analysis What is it really?
 1 What is it really? What is it really? Presentation to the Melbourne ATAA meeting 8 October, 2009 The share market can seem mystical and almost like black magic; but with the right support and assistance,