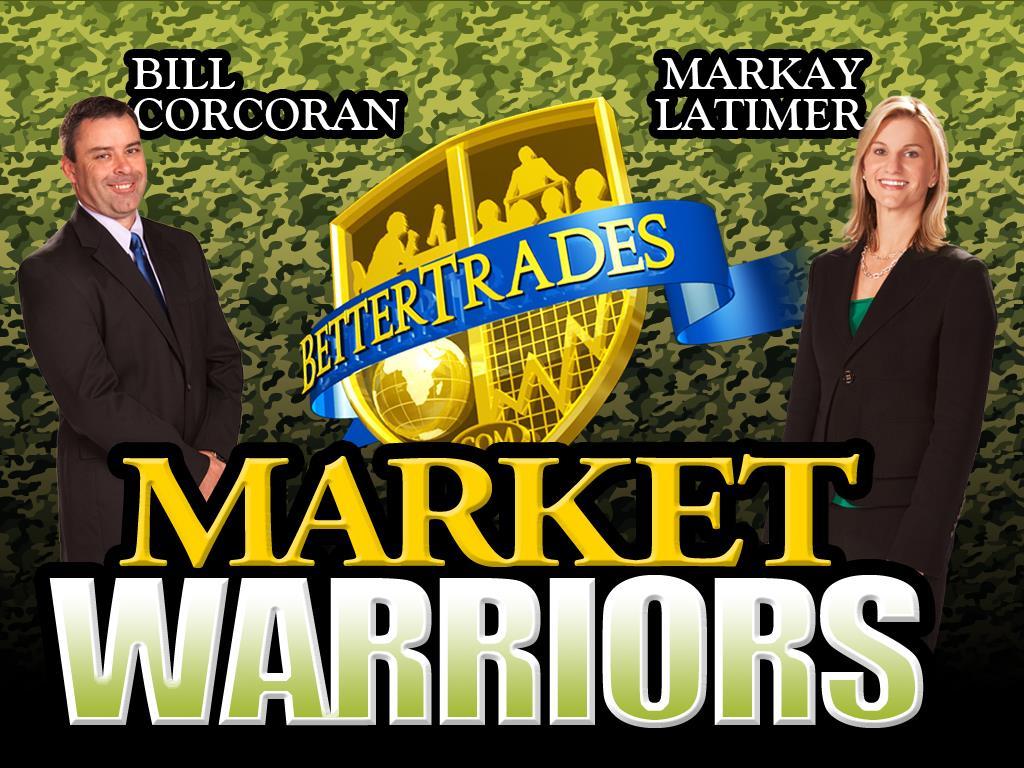
Technicals & Time Frame
|
|
|
- Eustace Anthony
- 6 years ago
- Views:
Transcription


1 Advanced Charting
2 Neither Better Trades or any of its personnel are registered broker-dealers or investment advisers. I will mention that I consider certain securities or positions to be good candidates for the types of strategies we are discussing or illustrating. Because I consider the securities or positions appropriate to the discussion or for illustration purposes does not mean that I am telling you to trade the strategies or securities. Keep in mind that we are not providing you with recommendations or personalized advice about your trading activities. The information we are providing is not tailored to any particular individual. Any mention of a particular security is not a recommendation to buy, sell, or hold that or any other security or a suggestion that it is suitable for any specific person. Keep in mind that all trading involves a risk of loss, and this will always be the situation, regardless of whether we are discussing strategies that are intended to limit risk. Also Better Trades personnel are not subject to trading restrictions. I and others at Better Trades could have a position in a security or initiate a position in a security at any time.
3 Technicals & Time Frame Technical analysis is transferable & scalable. This means that the patterns we teach you may be applied to all markets and all time frames. What you see today on a daily chart may be applied to a 15-minute, a 10-minute, a 5-minute, a 3-minute and a 1- minute chart, but the timing will be faster. What you see today on an intraday chart may be applied to a daily, but the timing will be slower.
4 Entries & Exits Obviously better entries and exits can help your profitability But, trades that go on for days are more forgiving than those that go on for minutes Thus, the shorter the trading time frame the more critical good entries and exits become
5 Seasonality Generally the markets are more bullish early in the year. There is almost always a period of bearishness and/or choppiness as things slow down in the spring or summer. If the bearishness is enough it may attract buyers and create another uptrend in the fall or toward the end of the year.
6 Summer Is Here! And we don t just see this with the weather but also in the charts. Have you noticed, the markets have slowed down and things are getting choppier? This is when you can t rely on a trend to make up for sloppy entries and or exits. Better timing is more critical than ever!
7 Early Entries & Exits Failed trend Candles Size of candles Engulfing candles Bollinger Bands Bollinger top Bollinger bottom Candles outside the bands
8 An Uptrend Is When: The stock makes higher highs and higher lows. The failure of a stock to do so signals weakness. How do we use this information? Look for an exit! Evaluate trading in the opposite direction.

9 Lower High BIIB sold off $10 from bearish engulfing candle.
10 A Downtrend Is When: The stock makes lower lows and lower highs. The failure of a stock to do so signals strength. How do we use this information? Look for an exit! Evaluate trading in the opposite direction.

11 SDS retraced $3. Higher Low
12 Candles In addition to continuation and reversal candle patterns, watch the size of the candle body The bigger the candle the stronger the momentum The smaller the candle the weaker the momentum (that may lead to tradable reversals or retracements)
13 Slowing Tighten stops as candles begin getting smaller. Use either previous close or previous candle body (engulfing).

14 Tighten stops as candles begin getting smaller. Use either previous close or previous candle body (engulfing).
15 Engulfing B.B. Tops & Bottoms Bollinger Band tops & bottoms can provide great reversal signals. Combine that pattern with engulfing candles and you have even more consistency with it. The combination may be used as an early exit and an entry into a quick swing or scalp trade.

16 BB Bottom Engulfing Candle Bullish & Bearish Reversals Doesn t engulf, but trades below last bullish candle. BB Bottom Engulfing Candle

17 Bullish trades may be considered if stock is far enough away from m.a. for potential profit. Bollinger Band Bottom Stock trades above last bearish candle.

18 Bollinger Band Bottom Stock trades above last bearish candle.

19 BB Top & Engulfing Resistance on daily chart Re-entry on bounce off 10 ema Put entry, if stocks breaks below m.a. and trends lower may use m.a. as stop.

20 Resistance on daily 10 ema
21 Different Time Frames How do you combine different time frames? Do you ever get mixed signals? How do you handle it?
22 Focus most on the time frame that reflects your current strategy Day Trades Most emphasis on intraday charts (5 min) Use daily charts for major support / resistance Swing Trades (1-5 days) Most emphasis on Magic & 5 min charts Trending Trades ( 5 days or more) Most emphasis on daily charts Use intraday charts to help with exits if daily chart & indicators show weakness (ADX, BB s, MACD, RSI)
23 Trading Outside Bands Bollinger Bands encompass most of the trading action A stock trading outside the bands sets up a rare early exit opportunity

24 Long wick at top Price Moves Back Inside Bands
25 Smaller Candles Bearish Engulfing Price Moves Back Inside Bands

26 Price moves back inside bands but doesn t trade below previous candle close

27 Add a 5 ema and use a break of average as exit.
28 Failed: Bollinger Band Squeeze Play You may know about the Bollinger Band Squeeze Play, but do you know how to profit from a failed one?

29 Failed BB Breakout No bullish entry if using 5 min. rule. Enter bearish trade on break below BB or on second down candle.

30 Failed BB breakout How do you know if this is a retracement or a reversal?
31 What If You Miss A Trade? If you missed the last entry on a trending stock: Move in with a stop pennies below the entry Higher risk of stock retracing quickly But will help with an entry on stocks that aren t pulling back Or, be patient and wait for the next retracement pattern Usually near a moving average Set stops near average
32 Exiting Losers 1. Place market order to exit when justified by the chart 2. Bracket the exit with an OCO order: 1. Set market stop below current price 2. Set limit price on other side to exit at higher price
33 Exiting Winners Set stops below moving average that is holding as support or resistance This may be done on an intraday and daily chart, depending on time frame Use trailing stops This may be helpful on an intraday basis if you are not around to watch the stock Raise stops if stock gaps in your favor

34 Always Use Gaps to Take Profits Exit calls on break below first five min candle.
35 PART 2
36 This is not Basic We are going to look beyond basic chart patterns. Look at what some of the institutions use. Will take you to new level of awareness.
37 The Chart A picture of the market psychology. Tells us what the market is thinking. Pure supply and demand in picture form.
38 The Chart Charts should be evaluated in multiple time frames. Pure price activity is foremost. Advanced Indicators can potentially enhance probabilities.
39 The Intraday Pivot
40 Intraday Pivots Can be used to identify potential intraday support and resistance. Should be used in conjunction with chart patterns. Must take intraday trends into consideration. Must take multiple time frames into consideration.
41 Pivot Point Formula The basic pivot point formula is: Pivot Point = (High + Low + Close) / 3 High, low and close are the previous day
42 Support Formulae Support Level Formulae are: S1 = (2*PP) - H S2 = PP - (H - L) S3 = L - 2*(H - PP)
43 Resistance Formulae Resistance Level Formulae are: R1 = (2*PP) - L R2 = PP + (H - L) R3 = H + 2*(PP -L)
44
45 Intro to Elliot Wave
46 History Developed by Ralph Nelson Elliot during the Great Depression He used his process to call the market low on Wednesday March 13, 1935 Tied human behavior to Fibonacci ratios
47 Waves Impulse wave In direction of the larger wave Five wave pattern Corrective wave Counter trend move Three wave pattern
48 Impulse Wave
49 Corrective Wave a b c
50 Rules Rule 1 Wave 2 cannot retrace more than 100% of Wave 1 Rule 2 Wave three cannot be the shortest impulse wave Rule 3 Wave 4 cannot overlap Wave 4
51 Rules 5 Wave 3 cannot be the shortest 3 4 Wave 4 cannot overlap wave Wave 2 cannot retrace below wave 1
52
53
54 Intro to the Ichimoku Cloud
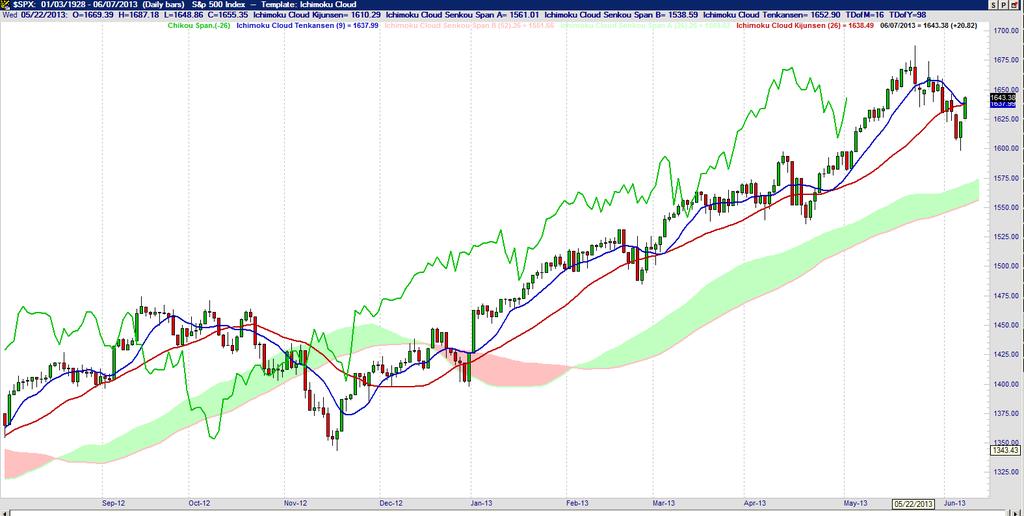
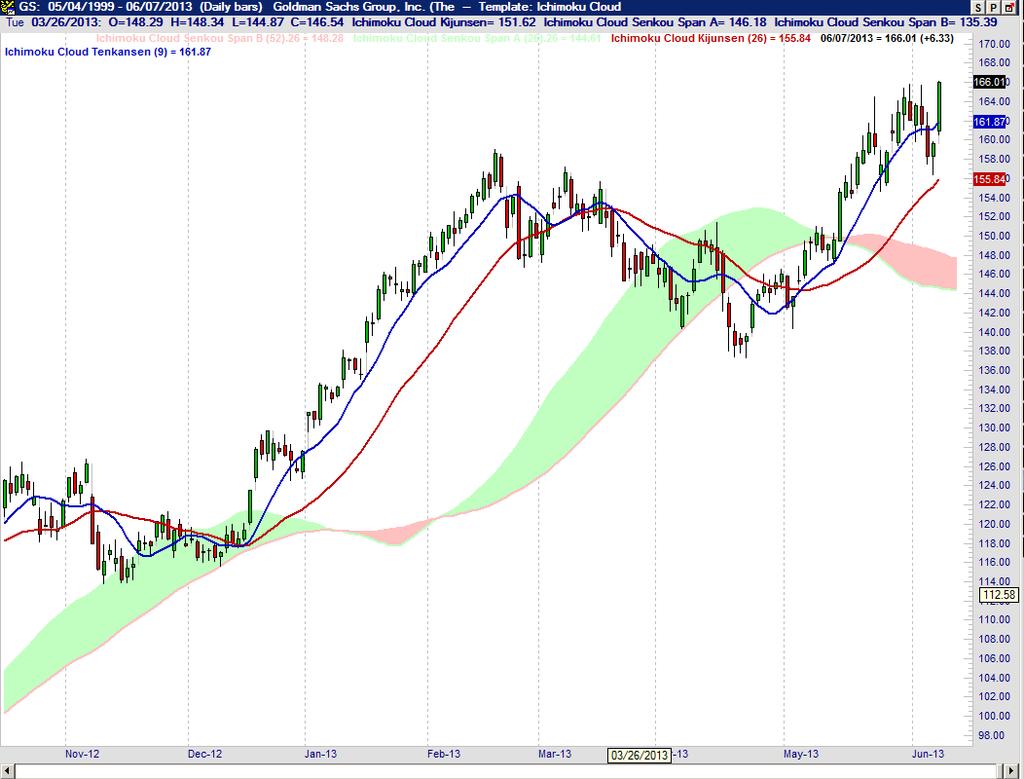
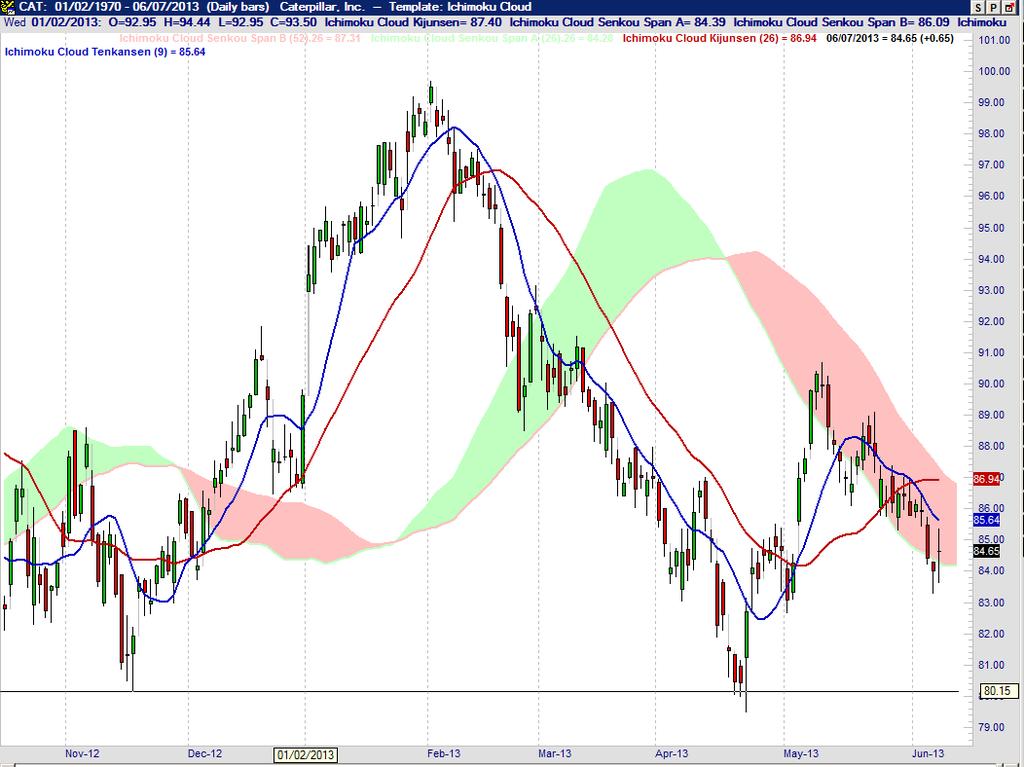
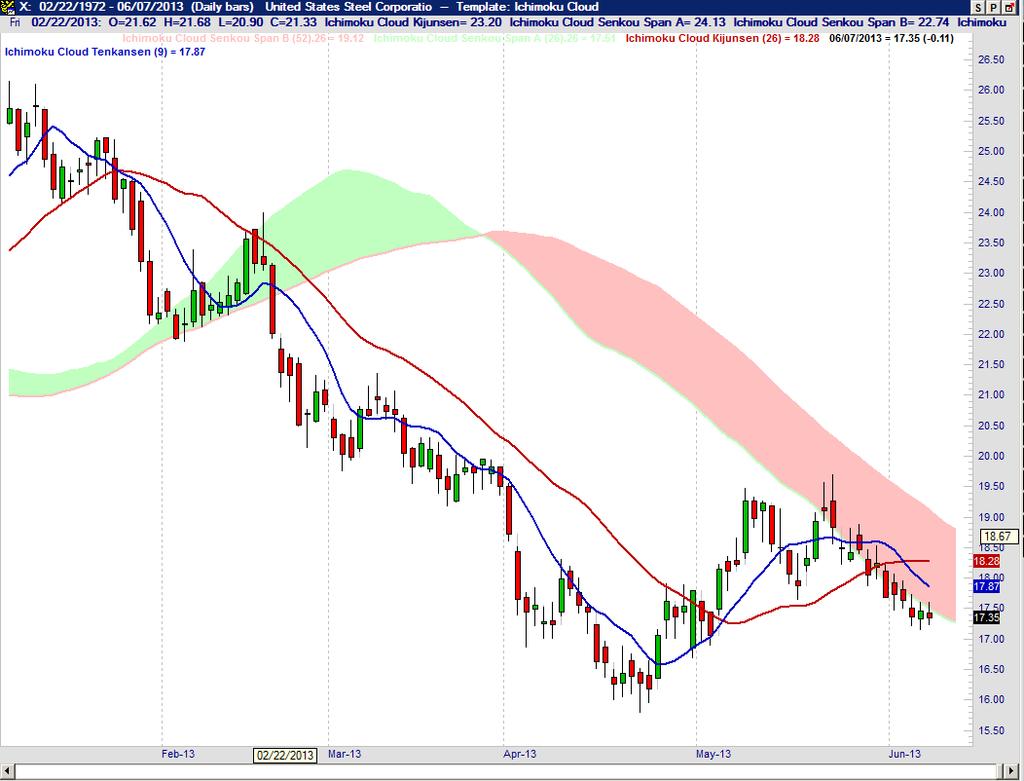
55 Ichimoku Cloud Often used by Forex and Futures Traders Can be used in multiple time frames Consists of: Tenkansen line (faster line) Kijunsen line (slower line) Chikou span line (we will remove this one for now) Support/resistance zone or cloud
56
57
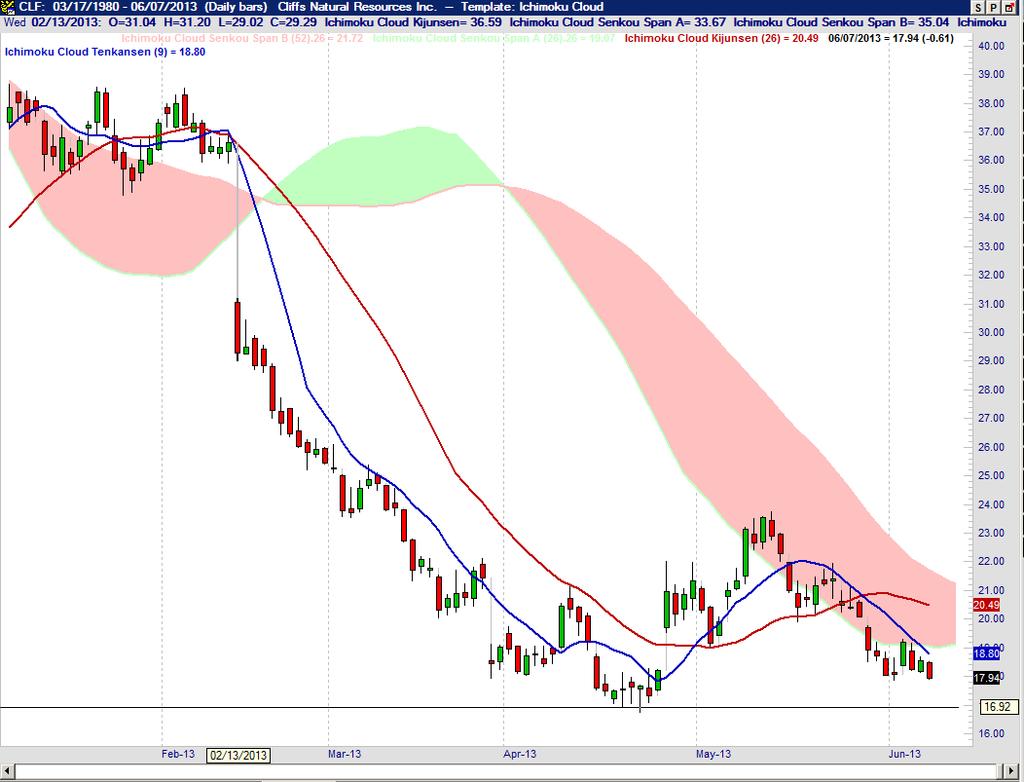
58 Ichimoku Cloud Long Signals Watch for bullish cross of fast and slow line. If the cross is below the cloud it is considered a weak signal. If the cross of the lines is in the cloud it is considered of medium strength. A cross above the cloud it is considered stronger. Watch for price action to break above the cloud.
59
60 Ichimoku Cloud Long Signals The price activity must break above the cloud to confirm the entry. The stock remains technically bullish above the cloud.
61
62 Ichimoku Cloud Long Exit Signals An early exit occurs when the price activity closes below fast line. A secondary exit occurs on the cross of the fast and slow lines. The final exit occurs if the price activity closes in or below the cloud.
63
64
65 Ichimoku Cloud Short Signals Watch for bearish cross of fast and slow line. If the cross is above the cloud it is considered a weak signal. If the cross of the lines is in the cloud it is considered of medium strength. A cross below the cloud is considered stronger. Watch for price action to break below the cloud to confirm.
66
67

68
69 MARKAY S NEXT CLASS Trade the Close with the Pros Thursday, June 13 th 1 p.m. 3:30 p.m. Eastern $249 Tonight only: $199 Online Enrollment Class will be recorded with unlimited viewings for 30 days!
70 BILL S NEXT CLASS Small Account, Big Results Monday, July 1st 8-10 p.m. Eastern $149 Tonight only: $99 Online Enrollment Class will be recorded with unlimited viewings for 30 days!
71 Neither Better Trades or any of its personnel are registered broker-dealers or investment advisers. I will mention that I consider certain securities or positions to be good candidates for the types of strategies we are discussing or illustrating. Because I consider the securities or positions appropriate to the discussion or for illustration purposes does not mean that I am telling you to trade the strategies or securities. Keep in mind that we are not providing you with recommendations or personalized advice about your trading activities. The information we are providing is not tailored to any particular individual. Any mention of a particular security is not a recommendation to buy, sell, or hold that or any other security or a suggestion that it is suitable for any specific person. Keep in mind that all trading involves a risk of loss, and this will always be the situation, regardless of whether we are discussing strategies that are intended to limit risk. Also Better Trades personnel are not subject to trading restrictions. I and others at Better Trades could have a position in a security or initiate a position in a security at any time.
Stacking Indicators Getting a GREAT entry! TWEEZERS Tweezer top/bottom at the band The stock is trending up Gap down (against the trend) Any moving
 Any moving") Dean Storholt I am not a registered broker-dealer or investment adviser. I will mention that I consider certain securities or positions to be good candidates for the types of strategies we are discussing
Dean Storholt I am not a registered broker-dealer or investment adviser. I will mention that I consider certain securities or positions to be good candidates for the types of strategies we are discussing
Presents. SPY the MARKET. With. Bill Corcoran
 Presents SPY the MARKET With Bill Corcoran I am not a registered broker-dealer or investment adviser. I will mention that I consider certain securities or positions to be good candidates for the types
Stacking Indicators Getting a GREAT entry! TWEEZERS Tweezer top/bottom at the band The stock is trending up Gap down (against the trend) Any moving
 Any moving") Dean Storholt I am not a registered broker-dealer or investment adviser. I will mention that I consider certain securities or positions to be good candidates for the types of strategies we are discussing
Dean Storholt I am not a registered broker-dealer or investment adviser. I will mention that I consider certain securities or positions to be good candidates for the types of strategies we are discussing
How many of you are or will be trading a small account?
 Dean Storholt I am not a registered broker-dealer or investment adviser. I will mention that I consider certain securities or positions to be good candidates for the types of strategies we are discussing
Technical Analysis. Dealing Room Peter Leonidou. Peter Leonidou
 Technical Analysis Dealing Room Questions Traders Should Ask What is the trend? What is the pivot point? What is the support levels? What is the resistance levels? Strong or weaker USD? What 1. Trade
 1 www.candlecharts.com 2 BONUS www. candlecharts.com/special/swing-trading-2/ 3 www. candlecharts.com/special/swing-trading-2/ 4 www. candlecharts.com/special/swing-trading-2/ 5 www. candlecharts.com/special/swing-trading-2/
2.0. Learning to Profit from Futures Trading with an Unfair Advantage! Income Generating Strategies Essential Trading Tips & Market Insights
 2.0 Learning to Profit from Futures Trading with an Unfair Advantage! Income Generating Strategies Essential Trading Tips & Market Insights Income Generating Strategies Essential Trading Tips & Market
Chapter 2.3. Technical Analysis: Technical Indicators
 Chapter 2.3 Technical Analysis: Technical Indicators 0 TECHNICAL ANALYSIS: TECHNICAL INDICATORS Charts always have a story to tell. However, from time to time those charts may be speaking a language you
BONUS. www. candlecharts.com/special/swing-trading-2/
 BONUS www. candlecharts.com/special/swing-trading-2/ 1 www. candlecharts.com/special/swing-trading-2/ www. candlecharts.com/special/swing-trading-2/ www. candlecharts.com/special/swing-trading-2/ 2 www.
Trading Lessons from the Intraday Frame (study)
") 1 Daily "Idealized Trades" Report Trading Lessons from the Intraday Frame (study) 1 2018 TheoTrade LLC. All rights reserved. 2 Trading Lessons from the Intraday Frame (1-mi) 2 2018 TheoTrade LLC. All rights
1 Daily "Idealized Trades" Report Trading Lessons from the Intraday Frame (study) 1 2018 TheoTrade LLC. All rights reserved. 2 Trading Lessons from the Intraday Frame (1-mi) 2 2018 TheoTrade LLC. All rights
Icoachtrader Consulting Service WELCOME TO. Trading Boot Camp. Day 5
 Icoachtrader Consulting Service www.icoachtrader.weebly.com WELCOME TO Trading Boot Camp Day 5 David Ha Ngo Trading Coach Phone: 1.650.899.1088 Email: icoachtrader@gmail.com The information presented is
Trading Lessons from the Intraday Frame (study)
") 1 Daily "Idealized Trades" Report Trading Lessons from the Intraday Frame (study) 1 2018 TheoTrade LLC. All rights reserved. 2 Trading Lessons from the Intraday Frame (1-mi) Major Companies Reporting Earnings
1 Daily "Idealized Trades" Report Trading Lessons from the Intraday Frame (study) 1 2018 TheoTrade LLC. All rights reserved. 2 Trading Lessons from the Intraday Frame (1-mi) Major Companies Reporting Earnings
FOREX INDICATORS. THEIR PRIORITY and USE
 FOREX INDICATORS THEIR PRIORITY and USE by G. C. Smith U.S. Government Required Disclaimer Trading foreign exchange markets on margin carries a high level of risk, and may not be suitable for all investors.
Day Trade Warrior. Chapter 5. Intraday Chart Patterns
 Day Trade Warrior Chapter 5. Intraday Chart Patterns What do we know? We have learned about Managing Risk (2:1 profit loss ratio 50% success target) We have learned how to find the Right Stocks (high relative
2.0. Learning to Profit from Futures Trading with an Unfair Advantage! Income Generating Strategies Starting the Trading Day
 2.0 Learning to Profit from Futures Trading with an Unfair Advantage! Income Generating Strategies Starting the Trading Day Income Generating Strategies Starting the Trading Day Pre-Market Analysis Before
CONNECING THE DOTS Candlesticks & Convergence of Clues. The Art & Science of Active Trend Trading
 CONNECING THE DOTS Candlesticks & Convergence of Clues The Art & Science of Active Trend Trading Disclaimer U.S. Government Required Disclaimer Commodity Futures Trading Commission Futures and Options
TECHNICAL INDICATORS
 TECHNICAL INDICATORS WHY USE INDICATORS? Technical analysis is concerned only with price Technical analysis is grounded in the use and analysis of graphs/charts Based on several key assumptions: Price
How I Trade Profitably Every Single Month without Fail
 How I Trade Profitably Every Single Month without Fail First of all, let me take some time to introduce myself to you. I am Koon Hwee (KH Lee) and I am a full time currency trader. I have a passion for
Convergence and Divergence
 Convergence and Divergence Momentum: The Verge of Success Momentum plays a key role in trend analysis. Trends are composed of a series of price swings. It is a trader s edge to know when a trend is slowing
Trading Lessons from the Intraday Frame (study)
") 1 Daily "Idealized Trades" Report Trading Lessons from the Intraday Frame (study) 1 2018 TheoTrade LLC. All rights reserved. 2 Trading Lessons from the Intraday Frame (1-mi) 2 2018 TheoTrade LLC. All rights
1 Daily "Idealized Trades" Report Trading Lessons from the Intraday Frame (study) 1 2018 TheoTrade LLC. All rights reserved. 2 Trading Lessons from the Intraday Frame (1-mi) 2 2018 TheoTrade LLC. All rights
INTERMEDIATE EDUCATION GUIDE
 INTERMEDIATE EDUCATION GUIDE CONTENTS Key Chart Patterns That Every Trader Needs To Know Continution Patterns Reversal Patterns Statistical Indicators Support And Resistance Fibonacci Retracement Moving
Buy Now, Paid Later. Learning LEAP Leverage Strategies. By Markay Latimer
 Buy Now, Paid Later Learning LEAP Leverage Strategies By Markay Latimer Neither Better Trades or any of its personnel are registered broker-dealers or investment advisers. I will mention that I consider
Day Trade Warrior. Advanced Trading Course Daily Chart Patterns & Understanding Triggers & Windows
 Day Trade Warrior Advanced Trading Course Daily Chart Patterns & Understanding Triggers & Windows Charting is Technical Analysis Technical Analysis is a form of interpreting price action and critical areas
The Art & Science of Active Trend Trading
 Candlesticks Looking for U-Turns The Art & Science of Active Trend Trading Copywrite ATTS 2007-2015 1 Disclaimer U.S. Government Required Disclaimer Commodity Futures Trading Commission Futures and Options
Apiary Fund Trading Plan
 Apiary Fund Trading Plan Position Size Always set stop < 2% of account balance. 75% of trades should be between.5% and 1% of account balance. Chart Setup OSMA and SMA Strategy Chart Setup Monitor and focus
presented by Thomas Wood MicroQuant SM Divergence Trading Workshop Day One Naked Trading Part 2
 presented by Thomas Wood MicroQuant SM Divergence Trading Workshop Day One Naked Trading Part 2 Risk Disclaimer Trading or investing carries a high level of risk, and is not suitable for all persons. Before
Trade Ideas A.I. Strategy Descriptions Revised : 10/04/2017
 Trade Ideas A.I. Strategy Descriptions Revised : 10/04/2017 The 5 Day Bounce The trigger for this alert has to cross above resistance while also making a 60 minute high on stocks that are trying to bounce
Test Your Chapter 1 Knowledge
 Self-Test Answers Test Your Chapter 1 Knowledge 1. Which is the preferred chart type in LOCKIT? The preferred chart type in LOCKIT is the candle chart because candle patterns are part of the decision-making
Gambit Trading Suite Setup Guide. V2.31 PUBLIC BETA March 2017
 Gambit Trading Suite Setup Guide V2.31 PUBLIC BETA March 2017 Gambit Trading Suite - Intro The Gambit Trading Suite is a set of indicators developed in Pine script to be used on Tradingview.com. The goal
Free signal generator for traders
 Free signal generator for traders Trader s Bulletin Pivot Point Trading Strategy 1. Just download the FREE tool 2. Key in a few numbers 3. And follow the simple techniques by Mark Rose To make money from
The Strategies Working Best in Today s E-Mini Market
 The Strategies Working Best in Today s E-Mini Market Todd Mitchell Craig Hill Legal Disclaimer No claim is made by Trading Concepts, Inc. that the trading strategies shown here will result in profits and
Trading Lessons from the Intraday Frame (study)
") 1 Daily "Idealized Trades" Report Trading Lessons from the Intraday Frame (study) 1 2018 TheoTrade LLC. All rights reserved. 2 Trading Lessons from the Intraday Frame (1-min) 2 2018 TheoTrade LLC. All
1 Daily "Idealized Trades" Report Trading Lessons from the Intraday Frame (study) 1 2018 TheoTrade LLC. All rights reserved. 2 Trading Lessons from the Intraday Frame (1-min) 2 2018 TheoTrade LLC. All
CHARTS. Bar Line Candlestick Charts are the basis of technical analysis They are a graphic display of price action. Notes:
 TECHNICAL ANALYSIS CHARTS Bar Line Candlestick Charts are the basis of technical analysis They are a graphic display of price action Candlestick charts have become the industry standard for technical traders.
Trading Lessons from the Intraday Frame (study)
") 1 Daily "Idealized Trades" Report Trading Lessons from the Intraday Frame (study) 1 2018 TheoTrade LLC. All rights reserved. 2 Trading Lessons from the Intraday Frame (1-mi) 2 2018 TheoTrade LLC. All rights
1 Daily "Idealized Trades" Report Trading Lessons from the Intraday Frame (study) 1 2018 TheoTrade LLC. All rights reserved. 2 Trading Lessons from the Intraday Frame (1-mi) 2 2018 TheoTrade LLC. All rights
The Art & Science of Active Trend Trading
 CONNECTING THE DOTS Candlesticks & Convergence of Clues The Art & Science of Active Trend Trading Copyright ATTS 2007-2015 1 Dennis W. Wilborn, P.E. Founder, President Active Trend Trading dww@activetrendtrading.com
Technical Analysis Indicators
 Technical Analysis Indicators William s Percent R Rules, Scans, Adding Filters, Breakout, Retest, and Application across MTFs Course Instructor: Price Headley, CFA, CMT BigTrends Coaching Access to BigTrends
Class 7: Moving Averages & Indicators. Quick Review
 Today s Class Moving Averages Class 7: Moving Averages & Indicators 3 Key Ways to use Moving Averages Intro To Indicators 2 Indicators Strength of Lines Quick Review Great for establishing point of Support
1. Introduction 2. Chart Basics 3. Trend Lines 4. Indicators 5. Putting It All Together
 Technical Analysis: A Beginners Guide 1. Introduction 2. Chart Basics 3. Trend Lines 4. Indicators 5. Putting It All Together Disclaimer: Neither these presentations, nor anything on Twitter, Cryptoscores.org,
Ichimoku Kinko Hyo System PDF Strategy Guide + MT4 Indicator Download
 Ichimoku Kinko Hyo System PDF Strategy Guide + MT4 Indicator Download ForexStrategiesWork.com Congratulations! You might not know it yet but you are in for a REAL treat in the Forex World. You now have
Divergence and Momentum Trading
 presented by Thomas Wood MicroQuant SM Divergence Trading Workshop Day One Divergence and Momentum Trading Risk Disclaimer Trading or investing carries a high level of risk, and is not suitable for all
Monster Market Movers
 Monster Market Movers Prerequisite Manual Better Trades Coach Robert Roy Neither Mastermind Traders or any of its personnel are registered broker-dealers or investment advisers. I will mention that I consider
Weekly outlook for Nov. 27 Dec
 Weekly outlook for Nov. 27 Dec. 1 2017 Summary For the ES we expect a minor pullback in the early part of the week, followed by a rally into the weekly close. There are four option expirations this week
Coaching Session FIVE
 Coaching Session FIVE Coaching Session FIVE Counter-Trend Trade Set-Ups Program Summary Trading Plan Execution The Master Trader Powerful Price Pattern Trades Trade Management Initial Trend Entry Trading
The goal for Part One is to develop a common language that you and I
 PART ONE Basic Training The goal for Part One is to develop a common language that you and I can use. The rest of the book will discuss how the technical indicators highlighted in the first two chapters
The Art & Science of Active Trend Trading
 CONNECTING THE DOTS Candlesticks & Convergence of Clues The Art & Science of Active Trend Trading Copywrite ATTS 2007-2015 1 Dennis W. Wilborn, P.E. Founder, President Active Trend Trading dww@activetrendtrading.com
Level I Learning Objectives by chapter
 Level I Learning Objectives by chapter 1. Introduction to the Evolution of Technical Analysis Describe the development of modern technical analysis Describe the origins of technical analysis 2. A New Age
Trading Lessons from the Intraday Frame (study)
") 1 Daily "Idealized Trades" Report Trading Lessons from the Intraday Frame (study) 1 2018 TheoTrade LLC. All rights reserved. 2 Trading Lessons from the Intraday Frame (1-mi) 2 2018 TheoTrade LLC. All rights
1 Daily "Idealized Trades" Report Trading Lessons from the Intraday Frame (study) 1 2018 TheoTrade LLC. All rights reserved. 2 Trading Lessons from the Intraday Frame (1-mi) 2 2018 TheoTrade LLC. All rights
3 Price Action Signals to Compliment ANY Approach to ANY Market
 3 Price Action Signals to Compliment ANY Approach to ANY Market Introduction: It is important to start this report by being clear that these signals and tactics for using Price Action are meant to compliment
50 Pips A Day Forex Strategy. How To Build A Solid Trading System. By Laurentiu Damir. Copyright 2012 by Laurentiu Damir
 50 Pips A Day Forex Strategy How To Build A Solid Trading System By Laurentiu Damir Copyright 2012 by Laurentiu Damir All rights reserved. No part of this book may be reproduced or transmitted in any form
Figure 3.6 Swing High
 Swing Highs and Lows A swing high is simply any turning point where rising price changes to falling price. I define a swing high (SH) as a price bar high, preceded by two lower highs (LH) and followed
Trading Lessons from the Intraday Frame (study)
") 1 Daily "Idealized Trades" Report Trading Lessons from the Intraday Frame (study) 1 2018 TheoTrade LLC. All rights reserved. 2 Trading Lessons from the Intraday Frame (1-min) 2 2018 TheoTrade LLC. All
1 Daily "Idealized Trades" Report Trading Lessons from the Intraday Frame (study) 1 2018 TheoTrade LLC. All rights reserved. 2 Trading Lessons from the Intraday Frame (1-min) 2 2018 TheoTrade LLC. All
OSCILLATORS. TradeSmart Education Center
 OSCILLATORS TradeSmart Education Center TABLE OF CONTENTS Oscillators Bollinger Bands... Commodity Channel Index.. Fast Stochastic... KST (Short term, Intermediate term, Long term) MACD... Momentum Relative
EMINI We will start promptly at 8 PM Eastern
 EASYEMINITRADE.COM EMINI We will start promptly at 8 PM Eastern EASY EMINI TRADE Ichimoku Kinko Hyo Equilibrium Chart At A Glance Using Multiple Time Frames For Your Analysis Basic Understanding Of
The Master Trader Counter-Trend Trade Set-Ups
 The Master Trader Counter-Trend Trade Set-Ups Trading Concepts, Inc. The Master Trader Counter-Trend Trade Set-Ups By Todd Mitchell Copyright 2014 by Trading Concepts, Inc. All Rights Reserved This training
90 Days Trading Bonds
 90 Days Trading Bonds with Chip Cole 2015, All Rights Reserved. Order Flow Analytics, Inc. 1 Trading & Training chip@orderflowanalytics.com dbvaello@orderflowanalytics.com 2015, All Rights Reserved. Order
- My 4 Favorite Trades - Essential Trades of a Professional Trader
 presented by Thomas Wood MicroQuant SM Divergence Trading Workshop Day One - My 4 Favorite Trades - Essential Trades of a Professional Trader Risk Disclaimer Trading or investing carries a high level of
presented by Thomas Wood MicroQuant SM Divergence Trading Workshop Day One Black Gold
 presented by Thomas Wood MicroQuant SM Divergence Trading Workshop Day One Black Gold Risk Disclaimer Trading or investing carries a high level of risk, and is not suitable for all persons. Before deciding
MULTI-TIMEFRAME TREND TRADING
 1. SYNOPSIS The system described is a trend-following system on a slow timeframe that uses optimized (that is, contrarian) entries and exits on a fast timeframe at the tops and bottoms of retraces against
How To Read Charts Like A Pro Your guide to reading stock charts!
 How To Read Charts Like A Pro Your guide to reading stock charts! Courtesy of Swing-Trade-Stocks.com You may distribute this book FREELY or use it as part of a commercial package as long as this page and
Intra-Day Trading Techniques
 Pristine.com Presents Intra-Day Trading Techniques With Greg Capra Co-Founder of Pristine.com, and Co-Author of the best selling book, Tools and Tactics for the Master Day Trader Copyright 2001, Pristine
Tommy s Revenge 2.0 Module 2 Part 2
 1 Mark Deaton here with your follow-up to Module 2. Going to cover a few things in this video and try to keep it short and sweet. We re going to look at Stock Fetcher and how we can use Stock Fetcher to
Trading Lessons from the Intraday Frame (study)
") 1 Daily "Idealized Trades" Report Trading Lessons from the Intraday Frame (study) 1 2018 TheoTrade LLC. All rights reserved. 2 Trading Lessons from the Intraday Frame (1-mi) 2 2018 TheoTrade LLC. All rights
1 Daily "Idealized Trades" Report Trading Lessons from the Intraday Frame (study) 1 2018 TheoTrade LLC. All rights reserved. 2 Trading Lessons from the Intraday Frame (1-mi) 2 2018 TheoTrade LLC. All rights
 Jack Schwager s Planned Trading Approach 1.Define your trading philosophy or system 2. Choose your markets to be traded 3. Specify your risk parameters A. Minimum risk per trade B. Stop loss strategy C.
Advance Certificate in Trading : A PROGRAM FOR SELF-INVESTORS
 Advance Certificate in Trading : A PROGRAM FOR SELF-INVESTORS [Stock Commodity-Forex] Duration: 4 Months Fee: 33,000 + Service Tax Training: Weekends / Weekdays Certifications: Certified Trader Certificate
Candlestick Forum Boot Camp. High Profit Patterns. Why is it important to know the patterns? Eliminates emotions
 Candlestick Forum Boot Camp High Profit Patterns Why is it important to know the patterns? Eliminates emotions 1 Advanced Candlestick Patterns Fry Pan Bottom Dumpling Top Cradle Pattern Jay-Hook Scoop
Ichimoku Charts How to read Clouds for Profitable Advantage
 Ichimoku Charts How to read Clouds for Profitable Advantage David Linton Updata david@updata.co.uk What I will cover General Points about Technical Analysis Theory, Cloud Construction, Interpretation Examples
Naked Trading - Double Top Chart Pattern Strategy
 Naked Trading - Double Top Chart Pattern Strategy If you really want to learn a profitable way to trade then look no further, the Double Top chart pattern strategy uses simple and sound trading principles
Trading Lessons from the Intraday Frame (study)
") 1 Daily "Idealized Trades" Report Trading Lessons from the Intraday Frame (study) 1 2018 TheoTrade LLC. All rights reserved. 2 Trading Lessons from the Intraday Frame (1-min) 2 2018 TheoTrade LLC. All
1 Daily "Idealized Trades" Report Trading Lessons from the Intraday Frame (study) 1 2018 TheoTrade LLC. All rights reserved. 2 Trading Lessons from the Intraday Frame (1-min) 2 2018 TheoTrade LLC. All
Chapter 2.3. Technical Indicators
 1 Chapter 2.3 Technical Indicators 0 TECHNICAL ANALYSIS: TECHNICAL INDICATORS Charts always have a story to tell. However, sometimes those charts may be speaking a language you do not understand and you
Scalp Trading Strategies
 Scalp Trading Strategies Services Disclaimer (for full disclosure, see Disclaimers section of website) Information Contained within our website and affiliates is not a substitute for professional advice
Moving Average Convergence Divergence (MACD) by
 by") Moving Average Convergence Divergence (MACD) by www.surefire-trading.com Ty Young Hi, this is Ty Young with Surefiretrading.com and today we will be discussing the Moving Average Convergence/Divergence
Moving Average Convergence Divergence (MACD) by www.surefire-trading.com Ty Young Hi, this is Ty Young with Surefiretrading.com and today we will be discussing the Moving Average Convergence/Divergence
SCEPTRE TRADING A COURSE IN DAY AND SWING TRADING
 SCEPTRE TRADING A COURSE IN DAY AND SWING TRADING STOCK PRICE CHARACTERISTICS AND TRADING TECHNIQUES INTRODUCTION Overview of where we re going this week during the course Why use technical analysis to
READ THIS FIRST! A. Tenkan Sen/Kijun Sen Cross
 READ THIS FIRST! Ichimoku is a finely-tuned, integrated charting system where the five lines all work in concert to produce the end result. We emphasize the word "system" here because it is absolutely
Technical Analysis Workshop Series. Session Six 1, 2, 3 Price-Bars Patterns
 Technical Analysis Workshop Series Session Six 1, 2, 3 Price-Bars Patterns DISCLOSURES & DISCLAIMERS This research material has been prepared by NUS Invest. NUS Invest specifically prohibits the redistribution
Day Trading Strategies. Day Strategies. and Examples. & Risk Management COPYRIGHTED MATERIAL: ANDREW AZIZ (C)
") Day Trading Strategies Day Strategies and Examples & Risk Management ANDREW AZIZ SESSION 4 Disclaimer BearBullTraders.com employees, contractors, shareholders and affiliates, are NOT an investment advisory
Day Trading Strategies Day Strategies and Examples & Risk Management ANDREW AZIZ SESSION 4 Disclaimer BearBullTraders.com employees, contractors, shareholders and affiliates, are NOT an investment advisory
Lighting the Way: Using Candlestick Patterns. The Art & Science of Active Trend Trading
 Lighting the Way: Using Candlestick Patterns The Art & Science of Active Trend Trading Disclaimer U.S. Government Required Disclaimer Commodity Futures Trading Commission Futures and Options trading has
Introduction. Technicians (also known as quantitative analysts or chartists) usually look at price, volume and psychological indicators over time.
 usually look at price, volume and psychological indicators over time.") Technical Analysis Introduction Technical Analysis is the study of market action, primarily through the use of charts, for the purpose of forecasting future price trends. Technicians (also known as quantitative
Technical Analysis Introduction Technical Analysis is the study of market action, primarily through the use of charts, for the purpose of forecasting future price trends. Technicians (also known as quantitative
The Engulfing Trader Copyright 2014
 Www.ForexWinners.Ru Prologue and Introduction This book is for all those that are just fed up with all the hype out there in the market. So called guru s selling expensive strategies and systems guaranteeing
NEWSLETTER SWING TRADING. 28 Feb Intelligent Analysis to point your decisions in the right direction
 NEWSLETTER 28 Feb 2018 Intelligent Analysis to point your decisions in the right direction SWING TRADING Newsletter contains index, stocks and sector recommendations along with market outlook. It also
Trading Lessons from the Intraday Frame (study)
") 1 Daily "Idealized Trades" Report Trading Lessons from the Intraday Frame (study) 1 2018 TheoTrade LLC. All rights reserved. 2 Trading Lessons from the Intraday Frame (1-mi) 2 2018 TheoTrade LLC. All rights
1 Daily "Idealized Trades" Report Trading Lessons from the Intraday Frame (study) 1 2018 TheoTrade LLC. All rights reserved. 2 Trading Lessons from the Intraday Frame (1-mi) 2 2018 TheoTrade LLC. All rights
EZ Trade FOREX Day Trading System. by Beau Diamond
 EZ Trade FOREX Day Trading System by Beau Diamond The EZ Trade FOREX Day Trading System is mainly used with four different currency pairs; the EUR/USD, USD/CHF, GBP/USD and AUD/USD, but some trades are
ART OF TRADING. Master the
 Master the ART OF TRADING EXPERT TRAINING FROM TRADING MASTERS AND COACHING PROFESSIONALS From learning the basics to creating a trading plan, our programs will help you increase your knowledge and improve
10-Year Treasury Notes ($UST Price)
") 1 Weekly Inter-market Technical Report 10-Year Treasury Notes ($UST Price) Monthly The 10-Year Note has developed a clear rising parallel trend channel that reaches now to the $128 level with confluence
1 Weekly Inter-market Technical Report 10-Year Treasury Notes ($UST Price) Monthly The 10-Year Note has developed a clear rising parallel trend channel that reaches now to the $128 level with confluence
Chapter 3. Price Action
 Chapter 3 Price Action The movement of price in any market is called Price Action. This movement is caused by the beliefs and trading systems of hundreds of thousands of worldwide traders that the market
The Avalanche (Reverse for a Phoenix )
") The Avalanche (Reverse for a Phoenix ) The 6 Building Blocks of Price Development (Ideal Scenario): Momentum: Above average pace on the reversal from highs, followed by slower than average upside as support
The Avalanche (Reverse for a Phoenix ) The 6 Building Blocks of Price Development (Ideal Scenario): Momentum: Above average pace on the reversal from highs, followed by slower than average upside as support
TRADE PLANNING WITH SIMPLE SUPPORT & RESISTANCE. Presented by Nabil Mattar FX Technical Analyst
 TRADE PLANNING WITH SIMPLE SUPPORT & RESISTANCE Presented by Nabil Mattar FX Technical Analyst 1 DISCLAIMER IG Asia Pte Ltd (Co. Reg. No. 20051002K) holds a capital markets services licence from the Monetary
10-Year Treasury Notes ($UST Price)
") 1 Weekly Inter-market Technical Report 10-Year Treasury Notes ($UST Price) Monthly Continuing from last week's report, bonds (notes) appear to be on a strong buy signal on the monthly chart, as price is
1 Weekly Inter-market Technical Report 10-Year Treasury Notes ($UST Price) Monthly Continuing from last week's report, bonds (notes) appear to be on a strong buy signal on the monthly chart, as price is
SPX for the smaller major-4 triangle or SPX to complete the double zigzag. Figure 1.
 Today s break -finally- below SPX2625 (and SPX2613) places the Ball now firmly in the Bears camp, albeit today s strong rally off the lows. And the two main bear counts remain the focus for now: SPX2579-2568
Technical Analysis Basics. Identifying Tops
 Technical Analysis Basics. Identifying Tops June 2011 1 Sign Up Now to Upshots forex trade signals disclaimer The information provided in this report is for educational purposes only. It is not a recommendation
PART 3 - CHART PATTERNS & TECHNICAL INDICATORS
 Tyler Chianelli s EASYOPTIONTRADING by OPTION TRADING COACH PART 3 - CHART PATTERNS & TECHNICAL INDICATORS A SIMPLE SYSTEM FOR TRADING OPTIONS WORKS IN UP, DOWN, AND SIDEWAYS MARKETS PART 3.1 - PRIMARY
Wave-to-Wave Trading Analysis June 1, 2012
 Trading Wave-to-Wave 1 Wave-to-Wave Trading Analysis June 1, 2012 S&P 500 Index ETF (SPY) Successful traders understand that there are waves within waves 5-minute waves inside of 60-minute waves inside
Orders, Level 2, Price Action COPYRIGHTED MATERIAL: ANDREW AZIZ (C) 1
 1") Orders, Level 2, Price Action ANDREW AZIZ SESSION 3 COPYRIGHTED MATERIAL: ANDREW AZIZ (C) WWW.BEARBULLTRADERS.COM 1 Disclaimer BearBullTraders.com employees, contractors, shareholders and affiliates, are
Orders, Level 2, Price Action ANDREW AZIZ SESSION 3 COPYRIGHTED MATERIAL: ANDREW AZIZ (C) WWW.BEARBULLTRADERS.COM 1 Disclaimer BearBullTraders.com employees, contractors, shareholders and affiliates, are
very High Probability High Risk/Reward Ratio Risk Management Capital Efficiency
 First, I look for Stocks and ETF s (Exchange Trades Funds) to TRADE, this is different than a long term Buy and Hold investment strategy. The typical time that I hold each Stock or ETF is one month to
Weekly outlook for April 23, 2018
 Weekly outlook for April 23, 2018 Summary The S&P 500 index is expected to go down further if price stays below the 2700 level. A weekly doji candle formed on the intermediate-term chart, and the short-term
Forex Sentiment Report Q2 FORECAST WEAK AS LONG AS BELOW April
 Forex Sentiment Report 08 April 2015 www.ads-securities.com Q2 FORECAST WEAK AS LONG AS BELOW 1.1200 Targets on a break of 1.1534/35: 1.1740/50 1.1870/75 1.2230/35 Targets on a break of 1.0580/70: 1.0160
DAILY DAY TRADING PLAN
 DAILY DAY TRADING PLAN Gatherplace will be used to place all of your trades. You will be using the 5 minute chart for the trade setup and the 1 minute chart for your entry, stop and trailing stop.you will
Subject: Daily report explanatory notes, page 2 Version: 0.9 Date: Dec 29, 2013 Author: Ken Long
 Subject: Daily report explanatory notes, page 2 Version: 0.9 Date: Dec 29, 2013 Author: Ken Long Description Example from Dec 23, 2013 1. Market Classification: o Shows market condition in one of 9 conditions,
Three Techniques for Spotting Market Twists and Turns. Riding the Roller
 Three Techniques for Spotting Market Twists and Turns Riding the Roller Coaster Learn to Spot the Twists and Turns Whether you re new to forex or you ve been trading a while, you know how the unexpected
Weekly outlook for April 30 May
 Weekly outlook for April 30 May 4 2018 Summary The S&P500 index is having trouble deciding if it will rally or decline. This indecision makes trading less profitable. Wait for a break-out direction to
Thanks for Checking out The Parabolic SAR Trading Strategy Report that we have developed for you to learn and apply to your trading system..
 Thanks for Checking out The Parabolic SAR Trading Strategy Report that we have developed for you to learn and apply to your trading system.. This Trading Strategy will teach you how to catch new trends