presented by Thomas Wood MicroQuant SM Divergence Trading Workshop Day One Naked Trading Part 2
|
|
|
- Morgan Summers
- 6 years ago
- Views:
Transcription


1 presented by Thomas Wood MicroQuant SM Divergence Trading Workshop Day One Naked Trading Part 2
2 Risk Disclaimer Trading or investing carries a high level of risk, and is not suitable for all persons. Before deciding to trade or invest you should carefully consider your investment objectives, level of experience, and ability to tolerate risk. This content is subject to change at any time without notice, and is provided for the sole purpose of education and assistance in making independent investment decisions. ValueCharts.com has taken reasonable measures to ensure the accuracy of the information contained herein; however, ValueCharts.com does not guarantee its accuracy and is not liable for any loss or damage which may result directly or indirectly from such content or from an inability to access such information or any delay in or failure of the transmission or the receipt of any instruction or notification in connection therewith. Any past performance results are shown for illustration and example only, are hypothetical and as such have many inherent limitations. No representation is being made that any account will or is likely to achieve profits or losses similar to those shown. Past performance is not necessarily indicative of future results.
3 CFTC Rule 4.41 (Hypothetical Disclaimer) U.S. Government Required Disclaimer - Commodity Futures Trading Commission Futures and Options trading has large potential rewards, but also large potential risk. You must be aware of the risks and be willing to accept them in order to invest in the futures and options markets. Don't trade with money you can't afford to lose. This is neither a solicitation nor an offer to Buy/Sell futures, stocks or options on the same. No representation is being made that any account will or is likely to achieve profits or losses similar to those discussed on this web site. The past performance of any trading system or methodology is not necessarily indicative of future results. CFTC RULE HYPOTHETICAL OR SIMULATED PERFORMANCE RESULTS HAVE CERTAIN LIMITATIONS. UNLIKE AN ACTUAL PERFORMANCE RECORD, SIMULATED RESULTS DO NOT REPRESENT ACTUAL TRADING. ALSO, SINCE THE TRADES HAVE NOT BEEN EXECUTED, THE RESULTS MAY HAVE UNDER-OR- OVER COMPENSATED FOR THE IMPACT, IF ANY, OF CERTAIN MARKET FACTORS, SUCH AS LACK OF LIQUIDITY. SIMULATED TRADING PROGRAMS IN GENERAL ARE ALSO SUBJECT TO THE FACT THAT THEY ARE DESIGNED WITH THE BENEFIT OF HINDSIGHT. NO REPRESENTATION IS BEING MADE THAT ANY ACCOUNT WILL OR IS LIKELY TO ACHIEVE PROFIT OR LOSSES SIMILAR TO THOSE SHOWN. NO REPRESENTATION IS BEING MADE THAT ANY ACCOUNT WILL, OR IS LIKELY TO ACHIEVE PROFITS OR LOSSES SIMILAR TO THOSE DISCUSSED WITHIN THIS SITE, SUPPORT AND TEXTS. OUR COURSE(S), PRODUCTS AND SERVICES SHOULD BE USED AS LEARNING AIDS ONLY AND SHOULD NOT BE USED TO INVEST REAL MONEY. IF YOU DECIDE TO INVEST REAL MONEY, ALL TRADING DECISIONS SHOULD BE YOUR OWN.
4 Naked Trading Pt. 2 Workshop Naked Trading Pt. 2 Workshop Becoming Consistent in Trading Trading Psychology Fundamentals of Candlestick Trading Highest Probability Candlestick Reversals Adding Filters to Candlestick Setups Adding Momentum Filters to Increase Probability of Success How to Increase Success, But Still Have Actionable Signals
5 Rules for Being Consistently Profitable
6 Rules to Become Consistently Profitable One of the most sought after aspects of trading is consistency. One of the most important things missing from most traders performance is. Consistency. There are a few things we can do to help us become more consistent with our trading, and in turn, become more consistent with our profits.
7 Rules to Become Consistently Profitable Maintain a good reward risk ratio. By keeping a good R/R ratio (>2/1) it takes a lot of pressure off of us as traders to always be right. If we have a 2/1 reward risk ratio, we only need to be correct 34% of the time to be profitable because 1 winner pays for 2 losers. This will help smooth out our equity curve and minimize the drawdowns we experience throughout our trading careers. (You will have losses, it is part of trading, do not worry about them)
8 Rules to Become Consistently Profitable In order to become a consistently profitable trader, we first must become a CONSISTENT trader. If we are not consistently placing the same type of trade, using the same setups in the same markets, then we cannot expect to see consistency in our equity curve. The goal of trading should be to make our equity curve become as smooth as possible from lower left to upper right
9 Rules to Become Consistently Profitable One reason many large funds and many professional traders use algorithms in their trading, is because they ALWAYS do what they are coded to do. If we want to get the same type of consistency in our own trading, we need to make our trades follow a specific set of rules. The rules we follow can be anything we want them to be. We just need to make sure we are removing the variability in the types of trades we are placing.
10 Rules to Become Consistently Profitable One of the best things we can do to combat the inconsistency in our trading, is by creating, and FOLLOWING, a trading plan. Most traders do not take the time to create a trading plan, but this is one of the BEST things we can do to become more consistent as a trader. A good trading plan will include all of the following information:
11 Rules to Become Consistently Profitable When will I be trading? What time of day do you plan on placing orders and identifying setups? Markets behave differently during different times of day, so if we want to get consistent results, we need to be consistent with the time of day that we are placing trades.
12 Rules to Become Consistently Profitable What size account will I be trading? This should also outline the number of contracts/shares/lots you will be placing in each market. We want to keep our gains and losses consistent across all different markets so that we can maintain a good reward to risk ratio. We do not want to be risking $500 in GC then risking $200 in ES because we could have 2 losers in GC and 1 winner in ES and still end up negative.
13 Rules to Become Consistently Profitable What are my risk and loss limits? In order to become consistent, we need to make sure we NEVER have a blowup day where we have massive losses. We need to control our daily and weekly and monthly losses so that we can continue trading. We also need to limit the maximum amount we will risk on each trade, there is no Loading the Boat on one perfect trade.
14 Rules to Become Consistently Profitable What markets will I be trading? We need to know what markets we will be trading and stick to them. Each market moves differently, so if we want to get consistent results with the strategies we are using, we need to make sure the markets are consistently the same.
15 Rules to Become Consistently Profitable What type of trading will I be doing? Am I a swing, day, position trader or am I a scalper? If we want consistent results from the strategies we are using, then we need to be consistently looking for the same trade. That means, we do not cut winners short just because we decide this is a scalp trade Remember, we are removing the variables in our trading in order to make it as consistent as possible.
16 Rules to Become Consistently Profitable What strategies will I be trading? This may be the largest section in your trading plan. It should outline every aspect of the trades you are going to be placing: Setup (setups and timeframes) Entry Signal (setups and timeframes) Initial Stop Placement Stop Management (When to Breakeven etc.) Exit Logic
17 Rules to Become Consistently Profitable How will I monitor the performance of my trading? How are we going to be monitoring our performance? Daily, Weekly, Monthly? How do we decide if we are doing good or doing bad with our trading? What is a reasonable return we should be expecting? Etc.
18 Rules to Become Consistently Profitable If you have trouble following your trading plan, you may want to try writing it out by hand. Studies have shown that we are more likely to actually follow a set of rules if we manually write them out ourselves. Make sure you review your trading plan every day, a good trade is a trade that follows your plan. NOT just a trade that makes money.
19 Questions on Rules to Become Consistent?
20 Trading Psychology, Preparing Your Mind to Trade
21 Preparing Your Mind to Trade In order to become consistent with our trading and to make it easier for us to follow our rules from our trading plan, we need to get our mind ready to become a trader. Most things in life that have always helped us, such as not giving up, sticking to something, being a leader, etc. are not necessarily good for our trading career.
22 Preparing Your Mind to Trade We do not want to stick to a bad trade idea, we do not want to keep trading even after we hit our loss limit, we do not want to try and get back at the market, we do not want to be the leader so to speak and jump in on a move just because we want it to happen. If we can become aware of the emotions we have while trading, then we can combat them by following rules, or telling ourselves that I know I want to do this, but this will hurt more than help
23 Preparing Your Mind to Trade We can also do things to convince ourselves that our strategies work, even if we find ourselves doubting. One thing we can do to help make ourselves believers is to keep a trade log. We want to track every trade we place and be able to go back and see that our strategy has worked hundreds of times in the past. If you do not have this record, go back and look at historical charts. Find the setups you are going to be trading, and take screen shots of them.
24 Preparing Your Mind to Trade The reason we do this is so that we can say to ourselves look, it has worked 500 times and if I had stuck with my plan, this is how much I could have made this will help to make us believe in ourselves and control the emotions that arise when we start trading. We also do not want to look at our trading account as money necessarily, meaning do not go well there goes a vacation, or a new car etc.
25 Preparing Your Mind to Trade The value of our account is just a tool to let us participate in the fluctuations of the market. The goal is to follow our rules and the consistency and profits will come. We want to be able to look at our account value objectively, not with any emotion involved. It is a game, we win the game by following the game plan, the game plan is written out for us in our trading plan.
26 Questions on Trading Psychology, Preparing Your Mind to Trade?
27 Fundamentals of Candlestick Trading
28 Fundamentals of Candlestick Trading How do you read a candlestick? There are two parts, the Body and the Wick The Body of the candle is the distance between the open and the close of the price bar. The Wick of the candle is the highest high and lowest low above/below the body. So the total range the candle moved.


29 Fundamentals of Candlestick Trading What is a candlestick chart?
30 Fundamentals of Candlestick Trading Why do we use candlestick charts? Goal is to give us a way of analyzing market psychology based on price action. When we look back through history, certain price patterns appear over and over, these patterns can tip us off to how a market will typically behave in specific conditions.
31 Fundamentals of Candlestick Trading With any candlestick reversal pattern, there are a few rules you want to follow. The price bar must CLOSE before we can say that is a bullish reversal so we do not enter because a candle looks like a hammer we wait until it closes, then we can decide if it really is or is not a hammer.
32 Fundamentals of Candlestick Trading When we go to enter a trade, we have three different options depending on how aggressive you want to be: Enter on the open of the next bar Enter on the break of the previous bars high/low Enter on the break of the high/low of the previous bars body
33 Fundamentals of Candlestick Trading One of my favorite ways to use candlestick patterns is as a signal that a market could be preparing to reverse direction. There are a lot of patterns that candlestick traders use and many traders have different requirements for a candlestick to be good for a setup.
34 Fundamentals of Candlestick Trading There are four main bullish patterns that I watch for when trading. Hammers Inverted Hammers Dragonfly Doji s Bullish Engulfing Patterns
35 Fundamentals of Candlestick Trading With all of my bullish reversal patterns, I want to have the close of the price bar HIGHER than the open. So I want to see the buyers win the price bar for a bullish reversal. I want to see all bullish reversal patterns be located at the bottom of a down move. With a hammer or inverted hammer, we want to see the wick roughly 2x or more, the size of the body.

36 Hammer Candlestick Reversal

37 Inverted Hammer Candlestick Reversal

38 Dragonfly Doji Candlestick Reversal

39 Bullish Engulfing Candlestick Reversal
40 Fundamentals of Candlestick Trading There are four main bearish patterns that I watch for when trading. Shooting Star Hanging Man Gravestone Doji s Bearish Engulfing Patterns
41 Fundamentals of Candlestick Trading With all of my Bearish reversal patterns, I want to have the close of the price bar LOWER than the open. So I want to see the sellers win the price bar for a bearish reversal. I want to see all bearish reversal patterns located at the top of an up move. With a shooting star or hanging man, we want to see the wick roughly 2x or more, the size of the body.

42 Shooting Star Candlestick Reversal

43 Hanging Man Candlestick Reversal

44 Gravestone Doji Candlestick Reversal

45 Bearish Engulfing Candlestick Reversal
46 Questions on the Fundamentals of Candlestick Trading?
47 Adding Filters to Candlestick Patterns
48 Adding Filters to Candlestick Patterns Trading Candlestick reversals alone is a valid way of finding trade setups. However, we can increase the probability of success with candlestick trades by adding filters, or other indications that a market should move the desired direction. The more things we have pointing to a specific direction, the higher the probability that we will have a successful trade.
49 Adding Filters to Candlestick Patterns One of the easiest filters we can add for our candlestick reversals is Exponential Moving Averages. We can apply an 8 EMA as a gravity line and have a requirement of the market being pulled away from the 8 EMA. This is for counter trend reversals. We can also apply a 50 EMA and if price is below the 50, we only look for shorts, if it is above the 50 we only look for longs. This is essentially a very simple trend filter.
50 Adding Filters to Candlestick Patterns When we are trading with the trend, using the 50 EMA as a filter for directional bias, then we are looking to time an entry on a retracement using a candlestick to show us when the market is ready to resume the underlying trend. When we have a candlestick reversal going counter trend, we are looking for the market to enter consolidation, not completely reverse trend.

51 Adding Filters to Candlestick Patterns
52 Adding Filters to Candlestick Patterns

53 Adding Filters to Candlestick Patterns
54 Adding Filters to Candlestick Patterns
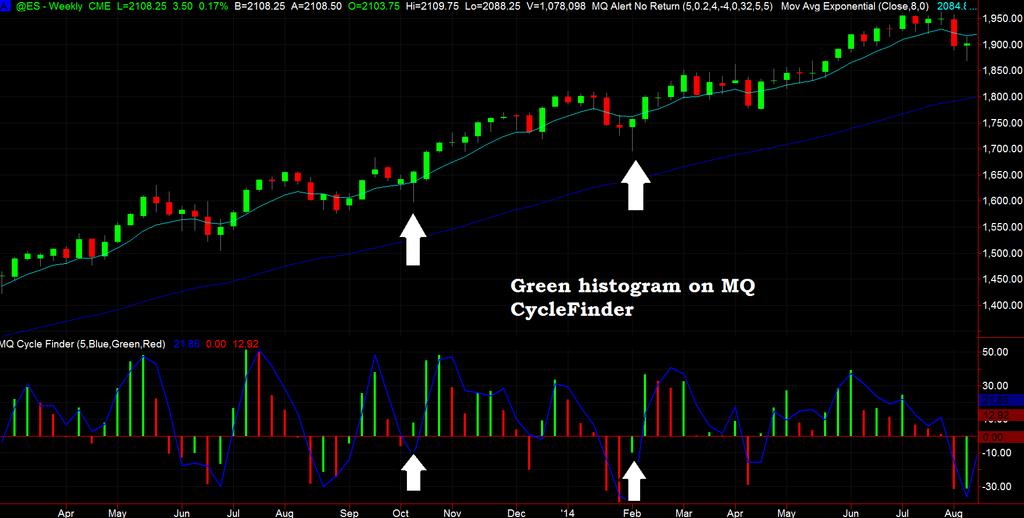
55 Adding Filters to Candlestick Patterns Although using EMA s as filters is still a valid way of trading, and will have better success than using just the candlesticks alone, we can further improve our success by adding the MQ CycleFinder indicator as a filter as well. When we have a bearish candlestick reversal, we want the MQ CycleFinder indicator to show a bearish (red) histogram bar. When we have a bullish candlestick reversal, we want the CycleFinder to show a bullish (green) histogram bar.

56 Adding Filters to Candlestick Patterns

57 Adding Filters to Candlestick Patterns

58 Adding Filters to Candlestick Patterns

59 Adding Filters to Candlestick Patterns

60 CANDLESTICK FILTER QUIZ!

61 CANDLESTICK FILTER QUIZ!
62 Questions on Adding Filters to Candlestick Trading?
63 How to Read MQ Momentum and MACD
64 How to Read MQ Momentum and MACD You can read the MQ Momentum and MACD indicators essentially the same way. They are both made up of two indicator lines, then a histogram showing the spread between the fast and slow lines. The further the fast line is away from the slow line, the larger the histogram bars become. The closer the indicator lines are together, the smaller the histogram becomes.
65 How to Read MQ Momentum and MACD When we are looking at the indicator to determine momentum, we are looking at both indicator lines AND the histogram. We want to see the indicator putting in higher high and higher lows on bullish moves and lower high lower lows on bearish moves. Just like when we are reading price action, we are looking at the pivots not just the line angling down or up.
66 How to Read MQ Momentum and MACD We also want to see increasing strength on the histogram in the direction of the trade we want to place. This can be higher bullish histogram sets, and/or higher bearish histogram sets, to show bullish momentum. Or lower bullish histogram sets and/or lower bearish histogram sets for bearish momentum.

67 How to Read MQ Momentum and MACD

68 How to Read MQ Momentum and MACD
69 Questions on How to Read MQ Momentum and MACD?
70 Adding Momentum Filters to Breakouts
71 Adding Momentum Filters to Breakouts Now that you understand how to read the momentum indicator, we can start talking about adding this momentum filter to different trade setups. One of the best filters to add, in my opinion, is a momentum filter. The reason I like adding momentum as a filter is because it will often times make the market jump your direction much faster. So we have less time spent with unrealized losses, and less time risking money in the market trying to get that winner.
72 Adding Momentum Filters to Breakouts If we are breaking support or breaking through a trendline, we want to see the MQ Momentum indicator lines also breaking through previous swing lows or see our histograms showing growing strength in the direction of the breakout. If momentum does not agree on the direction of the breakout, than the probability of a false break is much higher and it is better to pass on the trade.
73 Adding Momentum Filters to Breakouts When drawing trendlines, we are not just connecting previous bars lows together, we are connecting pivot points. It is better to connect 3 or more pivots, if we cannot connect 3 or more, we connect the two most significant pivots. (when I say significant, I mean the market hit a price point, then moved the opposite direction for a significant distance)

74 Adding Momentum Filters to Breakouts

75 Adding Momentum Filters to Breakouts

76 Adding Momentum Filters to Breakouts

77 Adding Momentum Filters to Breakouts

78 Adding Momentum Filters to Breakouts

79 Adding Momentum Filters to Breakouts
80 Adding Momentum Filters to Breakouts Adding a momentum filter can increase the success of your support and resistance/trendline breakouts significantly, however, for those traders that want to increase the probabilities of a successful trade even more, we can add additional filters. Two things you can watch for after a support or resistance/trendline break is for a bull/bear flag or a trendline retest + bull/bear flag.
81 Adding Momentum Filters to Breakouts A bull/bear flag takes place when you have an up/down move, then the next price bar has a lower high or higher low than the previous price bar, and the momentum histogram stays green/red the entire move. You enter the flag on the third (or more) price bar when it breaks the previous bars high/low.
82 Adding Momentum Filters to Breakouts Once you form the flag and trigger the entry, after the trendline break, the market should move your direction very quickly (2 price bars) and should not go back below/above the low/high of the flag. A lot of times we are able to significantly increase our reward risk ratio by using this setup because the stop is placed fairly close to the entry, just beyond the bottom/top of the flag.

83 Adding Momentum Filters to Breakouts

84 Adding Momentum Filters to Breakouts

85 Adding Momentum Filters to Breakouts

86 Adding Momentum Filters to Breakouts

87 Adding Momentum Filters to Breakouts

88 Adding Momentum Filters to Breakouts

89 Adding Momentum Filters to Breakouts
90 Questions on Adding Momentum Filters to Breakouts?
91 Breakout + Momentum Quiz!

92 Adding Momentum Filters to Breakouts

93 Adding Momentum Filters to Breakouts

94 Adding Momentum Filters to Breakouts

95 Adding Momentum Filters to Breakouts

96 Adding Momentum Filters to Breakouts

97 Adding Momentum Filters to Breakouts

98 Adding Momentum Filters to Breakouts

99 Adding Momentum Filters to Breakouts
100 Questions on Momentum Filters and Breakouts?
101 How Many Filters Do I Need?
102 How Many Filters Do I Need? There is a limit on how many filters you want to add to your setups. We need to balance the desire for higher probability trades, and the fact that we have to actually have trades to place. The best way to check to see if you are using too many filters is to check your trade log. How many trades have you placed over the past week, day, month etc.? Are you reaching your goals for trading? Day Trading I want to have about 2-3 trades per day for $300-$400/contract.
103 FINAL Q&A!
104 Want the Indicators You Saw Today? ValueCharts Futures Trading Room Bundle: MQ Momentum MQ CycleFinder SS Momentum Trender Pro ValueBars MQ Momentum Indicator:
Divergence and Momentum Trading
 presented by Thomas Wood MicroQuant SM Divergence Trading Workshop Day One Divergence and Momentum Trading Risk Disclaimer Trading or investing carries a high level of risk, and is not suitable for all
presented by Thomas Wood MicroQuant SM Divergence Trading Workshop Day One Black Gold
 presented by Thomas Wood MicroQuant SM Divergence Trading Workshop Day One Black Gold Risk Disclaimer Trading or investing carries a high level of risk, and is not suitable for all persons. Before deciding
C y c l e C a n d l e s T r a d i n g W o r k s h o p
 C y c l e C a n d l e s Trading Workshop Risk Disclaimer Trading or investing carries a high level of risk, and is not suitable for all persons. Before deciding to trade or invest you should carefully
Becoming a Consistent Trader
 presented by Thomas Wood MicroQuant SM Divergence Trading Workshop Day One Becoming a Consistent Trader Risk Disclaimer Trading or investing carries a high level of risk, and is not suitable for all persons.
Naked Trading and Price Action
 presented by Thomas Wood MicroQuant SM Divergence Trading Workshop Day One Naked Trading and Price Action Risk Disclaimer Trading or investing carries a high level of risk, and is not suitable for all
presented by Thomas Wood MicroQuant SM Divergence Trading Workshop Day One Bond Trading Success
 presented by Thomas Wood MicroQuant SM Divergence Trading Workshop Day One Bond Trading Success Risk Disclaimer Trading or investing carries a high level of risk, and is not suitable for all persons. Before
The Launchpad Strategy
 presented by Thomas Wood MicroQuant SM Divergence Trading Workshop Day One The Launchpad Strategy Risk Disclaimer Trading or investing carries a high level of risk, and is not suitable for all persons.
- My 4 Favorite Trades - Essential Trades of a Professional Trader
 presented by Thomas Wood MicroQuant SM Divergence Trading Workshop Day One - My 4 Favorite Trades - Essential Trades of a Professional Trader Risk Disclaimer Trading or investing carries a high level of
11-Hour Options 2.0 The Next Evolution of Success
 presented by Thomas Wood MicroQuant SM Identifying Key Support and Resistance Levels 11-Hour Options 2.0 The Next Evolution of Success Risk Disclaimer Trading or investing carries a high level of risk,
Real Life Fibonacci Trading & Dynamic Targeting with MQ Trend
 presented by Thomas Wood MicroQuant SM Divergence Trading Workshop Day One Real Life Fibonacci Trading & Dynamic Targeting with MQ Trend Risk Disclaimer Trading or investing carries a high level of risk,
No-BS Trading System
 No-BS Trading System Techniques The Professionals Don t Want To Be Revealed DISCLAIMER U.S. Government Required Disclaimer - Commodity Futures Trading Commission Futures and Options trading has large potential
Technical Analysis Workshop Series. Session Six 1, 2, 3 Price-Bars Patterns
 Technical Analysis Workshop Series Session Six 1, 2, 3 Price-Bars Patterns DISCLOSURES & DISCLAIMERS This research material has been prepared by NUS Invest. NUS Invest specifically prohibits the redistribution
The Art & Science of Active Trend Trading
 Candlesticks Looking for U-Turns The Art & Science of Active Trend Trading Copywrite ATTS 2007-2015 1 Disclaimer U.S. Government Required Disclaimer Commodity Futures Trading Commission Futures and Options
The Art & Science of Active Trend Trading
 CONNECTING THE DOTS Candlesticks & Convergence of Clues The Art & Science of Active Trend Trading Copyright ATTS 2007-2015 1 Dennis W. Wilborn, P.E. Founder, President Active Trend Trading dww@activetrendtrading.com
CONNECING THE DOTS Candlesticks & Convergence of Clues. The Art & Science of Active Trend Trading
 CONNECING THE DOTS Candlesticks & Convergence of Clues The Art & Science of Active Trend Trading Disclaimer U.S. Government Required Disclaimer Commodity Futures Trading Commission Futures and Options
Intra-Day Trading Techniques
 Pristine.com Presents Intra-Day Trading Techniques With Greg Capra Co-Founder of Pristine.com, and Co-Author of the best selling book, Tools and Tactics for the Master Day Trader Copyright 2001, Pristine
Candlesticks Discoveries Probability of Success Aug 6, 2016
 Candlesticks Discoveries Probability of Success Aug 6, 2016 The Art & Science of Active Trend Trading Disclaimer U.S. Government Required Disclaimer Commodity Futures Trading Commission Futures and Options
Free Forex Midnight Setup Strategy
 Free Forex Midnight Setup Strategy User s Guide Reviewed and recommended by Rita Lasker www.ritalasker.com Read this There are lots of different strategies on the market. We test most of them and want
Candlesticks What They Really Mean! March 3, 2018
 Candlesticks What They Really Mean! March 3, 2018 Active Trend Trading Dennis W. Wilborn Disclaimer U.S. Government Required Disclaimer Commodity Futures Trading Commission Futures and Options trading
WORKBOOK. The FX Trader s EDGE BLUEPRINT ENCORE EVENT. How to Capture Low Hanging Profits in the New Year Using 3 Simple Blueprints
 WORKBOOK The FX Trader s EDGE BLUEPRINT ENCORE EVENT How to Capture Low Hanging Profits in the New Year Using 3 Simple Blueprints Jody Samuels, Juan Maldonado and Neil Bradford Disclaimer This workbook
Active Trend Trading Rules Review
 Active Trend Trading Rules Review Active Trend Trader: Dennis W. Wilborn A Trend Should Be Assumed to Continue in Effect Until Such Time as Its Reversal Has Been Definitely Signaled Edwards & Magee Disclaimer
The Art & Science of Active Trend Trading
 CONNECTING THE DOTS Candlesticks & Convergence of Clues The Art & Science of Active Trend Trading Copywrite ATTS 2007-2015 1 Dennis W. Wilborn, P.E. Founder, President Active Trend Trading dww@activetrendtrading.com
DAILY DAY TRADING PLAN
 DAILY DAY TRADING PLAN Gatherplace will be used to place all of your trades. You will be using the 5 minute chart for the trade setup and the 1 minute chart for your entry, stop and trailing stop.you will
Lighting the Way: Using Candlestick Patterns. The Art & Science of Active Trend Trading
 Lighting the Way: Using Candlestick Patterns The Art & Science of Active Trend Trading Disclaimer U.S. Government Required Disclaimer Commodity Futures Trading Commission Futures and Options trading has
Technical Analysis Basics. Identifying Tops
 Technical Analysis Basics. Identifying Tops June 2011 1 Sign Up Now to Upshots forex trade signals disclaimer The information provided in this report is for educational purposes only. It is not a recommendation
INTERMEDIATE EDUCATION GUIDE
 INTERMEDIATE EDUCATION GUIDE CONTENTS Key Chart Patterns That Every Trader Needs To Know Continution Patterns Reversal Patterns Statistical Indicators Support And Resistance Fibonacci Retracement Moving
How to Fix the Top 10 Fatal Errors of Trading One Flaw at a Time. #2 Trading Strategies before Knowing Systems. From the Active Trend Trader
 How to Fix the Top 10 Fatal Errors of Trading One Flaw at a Time #2 Trading Strategies before Knowing Systems From the Active Trend Trader Disclaimer U.S. GOVERNMENT REQUIRED DISCLAIMER COMMODITY FUTURES
90 Days Trading Bonds
 90 Days Trading Bonds with Chip Cole 2015, All Rights Reserved. Order Flow Analytics, Inc. 1 Trading & Training chip@orderflowanalytics.com dbvaello@orderflowanalytics.com 2015, All Rights Reserved. Order
The truth behind commonly used indicators
 Presents The truth behind commonly used indicators Pipkey Report Published by Alaziac Trading CC Suite 509, Private Bag X503 Northway, 4065, KZN, ZA www.tradeology.com Copyright 2014 by Alaziac Trading
Go No Go Indicators: Part 2
 Go No Go Indicators: Part 2 March 22, 2017 Dennis W. Wilborn Active Trend Trading Disclaimer U.S. Government Required Disclaimer Commodity Futures Trading Commission Futures and Options trading has large
Understanding Oscillators & Indicators March 4, Clarify, Simplify & Multiply
 Understanding Oscillators & Indicators March 4, 2015 Clarify, Simplify & Multiply Disclaimer U.S. Government Required Disclaimer Commodity Futures Trading Commission Futures and Options trading has large
RISK DISCLOSURE STATEMENT / DISCLAIMER AGREEMENT
 RISK DISCLOSURE STATEMENT / DISCLAIMER AGREEMENT Trading any financial market involves risk. This report and all and any of its contents are neither a solicitation nor an offer to Buy/Sell any financial
3 Price Action Signals to Compliment ANY Approach to ANY Market
 3 Price Action Signals to Compliment ANY Approach to ANY Market Introduction: It is important to start this report by being clear that these signals and tactics for using Price Action are meant to compliment
Presents. SPY the MARKET. With. Bill Corcoran
 Presents SPY the MARKET With Bill Corcoran I am not a registered broker-dealer or investment adviser. I will mention that I consider certain securities or positions to be good candidates for the types
BUY SELL PRO. Improve Profitability & Reduce Risk with BUY SELL Pro. Ultimate BUY SELL Indicator for All Time Frames
 BUY SELL PRO Improve Profitability & Reduce Risk with BUY SELL Pro Ultimate BUY SELL Indicator for All Time Frames Risk Disclosure DISCLAIMER: Crypto, futures, stocks and options trading involves substantial
Using Oscillators & Indicators Properly May 7, Clarify, Simplify & Multiply
 Using Oscillators & Indicators Properly May 7, 2016 Clarify, Simplify & Multiply Disclaimer U.S. Government Required Disclaimer Commodity Futures Trading Commission Futures and Options trading has large
FOREX INDICATORS. THEIR PRIORITY and USE
 FOREX INDICATORS THEIR PRIORITY and USE by G. C. Smith U.S. Government Required Disclaimer Trading foreign exchange markets on margin carries a high level of risk, and may not be suitable for all investors.
Counter Trend Trades. (Trading Against The Trend) By Russ Horn
 By Russ Horn") Counter Trend Trades (Trading Against The Trend) By Russ Horn 1 RISK DISCLOSURE STATEMENT / DISCLAIMER AGREEMENT Trading any financial market involves risk. This report and all and any of its contents
Counter Trend Trades (Trading Against The Trend) By Russ Horn 1 RISK DISCLOSURE STATEMENT / DISCLAIMER AGREEMENT Trading any financial market involves risk. This report and all and any of its contents
Trading Essentials Framework Money Management & Trade Sizing
 Trading Essentials Framework Money Management & Trade Sizing Module 9 Money Management & Trade Sizing By Todd Mitchell Copyright 2014 by Todd Mitchell All Rights Reserved This training program, or parts
ValueCharts for Sierra Chart
 ValueCharts for Sierra Chart Contents: What are ValueCharts? What are ValueAlerts SM? What are ValueBars SM? What are ValueLevels SM? What are ValueFlags SM? What are SignalBars SM? What is MQ Cycle Finder?
Forex Renko Charts FX Trading System
 Forex Renko Charts FX Trading System Disclaimer FOREX trading, online foreign exchange trading, foreign currency trading and Forex options trading involves risk of loss and is not appropriate for all investors.
 Disclaimer The candlestick patterns explained in this book are intended to provide information only.. Use these patterns is at your discretion. The use and application of the included patterns can involve
Compiled by Timon Rossolimos
 Compiled by Timon Rossolimos - 2 - The Seven Best Forex Indicators -All yours! Dear new Forex trader, Everything we do in life, we do for a reason. Why have you taken time out of your day to read this
1. Introduction 2. Chart Basics 3. Trend Lines 4. Indicators 5. Putting It All Together
 Technical Analysis: A Beginners Guide 1. Introduction 2. Chart Basics 3. Trend Lines 4. Indicators 5. Putting It All Together Disclaimer: Neither these presentations, nor anything on Twitter, Cryptoscores.org,
Introduction. Technical analysis is the attempt to forecast stock prices on the basis of market-derived data.
 Technical Analysis Introduction Technical analysis is the attempt to forecast stock prices on the basis of market-derived data. Technicians (also known as quantitative analysts or chartists) usually look
Your FREE Strategy...
 Your FREE Strategy... 1 Disclaimer This report is designed to provide helpful advice regarding the subject matter(s) covered. The author and distributors do not engage in the practice of providing legal
Icoachtrader Consulting Service WELCOME TO. Trading Boot Camp. Day 5
 Icoachtrader Consulting Service www.icoachtrader.weebly.com WELCOME TO Trading Boot Camp Day 5 David Ha Ngo Trading Coach Phone: 1.650.899.1088 Email: icoachtrader@gmail.com The information presented is
Resistance to support
 1 2 2.3.3.1 Resistance to support In this example price is clearly consolidated and we can expect a breakout at some time in the future. This breakout could be short or it could be long. 3 2.3.3.1 Resistance
RISK DISCLOSURE STATEMENT / DISCLAIMER AGREEMENT
 RISK DISCLOSURE STATEMENT / DISCLAIMER AGREEMENT Trading any financial market involves risk. This report and all and any of its contents are neither a solicitation nor an offer to Buy/Sell any financial
Williams Percent Range
 Williams Percent Range (Williams %R or %R) By Marcille Grapa www.surefiretradingchallenge.com RISK DISCLOSURE STATEMENT / DISCLAIMER AGREEMENT Trading any financial market involves risk. This report and
Chapter Eight. Japanese Candle Chart
 Chapter Eight Japanese Candle Chart Candle chart (also called candlestick) analysis has been used since the 18 th century by Japanese rice traders to predict the rice price s movement. According to sources,
Technicals & Time Frame
 Advanced Charting Neither Better Trades or any of its personnel are registered broker-dealers or investment advisers. I will mention that I consider certain securities or positions to be good candidates
 ADDING THE MACD Forex Strategy Master Published by Old Tree Publishing CC Suite 509, Private Bag X503 Northway, 4065, KZN, ZA www.oldtreepublishing.com Copyright 2013 by Old Tree Publishing CC, KZN, ZA
5 Pillars of Active Trend Trading Timing is More Important than Price. ~~ W.D. Gann
 5 Pillars of Active Trend Trading Timing is More Important than Price. ~~ W.D. Gann Dennis W. Wilborn Disclaimer U.S. Government Required Disclaimer Commodity Futures Trading Commission Futures and Options
Tradeciety s Price Action Guide
 Tradeciety s Price Action Guide Welcome... 3 Who am I?... 3 Some impressions from my trading & traveling lifestyle... 4 What Is Price Action?... 6 Candlesticks vs. Chart patterns... 7 Top 3 Candlestick
Data-Driven Trading. Market Adaptation. Stocks & Commodities V. 29:12 (34-39): Data-Driven Trading by Steve Palmquist
: Data-Driven Trading by Steve Palmquist") be up by the end of the year, and about a quarter thought the market would be down. The second question was, How many of you do not care whether the market is up or down by the end of the year? In the
be up by the end of the year, and about a quarter thought the market would be down. The second question was, How many of you do not care whether the market is up or down by the end of the year? In the
Advanced Trading Systems Collection MACD DIVERGENCE FOREX TRADING SYSTEM
 MACD DIVERGENCE FOREX TRADING SYSTEM 1 This system will cover the MACD divergence. With this forex trading system you can trade any currency pair (I suggest EUR/USD and GBD/USD when you start), and you
How To Limit Losses & Let Profits Run. Presented by: Darrell Martin Updated
 How To Limit Losses & Let Profits Run Updated 5-28-2013 Presented by: Darrell Martin www.apexinvesting.com www.apexinvesting.com 2012 2012 Apex Apex Investing Institute LLC LLC All All Right Right Reserved
Hire Us to Trade for You Full-Time
 Copyright 50PipsADay.com All rights reserved. Unauthorised resell or copying of this material is unlawful. No portion of this ebook may be copied or resold without written permission. 50PipsADay.com reserves
With that, let s dive into the steps. Step 1 Identify range bound markets on Daily or 4 Hour Charts
 If you have been trading for any length of time, you have probably noticed that the markets are moving sideways A LOT. Consolidation is a huge part of the market s balance and so it makes sense to learn
INSIDE DAYS. The One Trading Secret That Could Make You Rich
 The One Trading Secret That Could Make You Rich INSIDE DAYS What 'Inside Days' Are, How To Identify Them, The Setup, How They Work, Entrance Criteria, Management and Exit Criteria for MAXIMUM PROFITS IMPORTANT
Trading Lessons from the Intraday Frame (study)
") 1 Daily "Idealized Trades" Report Trading Lessons from the Intraday Frame (study) 1 2018 TheoTrade LLC. All rights reserved. 2 Trading Lessons from the Intraday Frame (1-mi) Major Companies Reporting Earnings
1 Daily "Idealized Trades" Report Trading Lessons from the Intraday Frame (study) 1 2018 TheoTrade LLC. All rights reserved. 2 Trading Lessons from the Intraday Frame (1-mi) Major Companies Reporting Earnings
Climb to Profits WITH AN OPTIONS LADDER
 Climb to Profits WITH AN OPTIONS LADDER We believe what matters most is the level of income your portfolio produces... Lattco uses many different factors and criteria to analyze, filter, and identify stocks
 1 www.candlecharts.com 2 BONUS www. candlecharts.com/special/swing-trading-2/ 3 www. candlecharts.com/special/swing-trading-2/ 4 www. candlecharts.com/special/swing-trading-2/ 5 www. candlecharts.com/special/swing-trading-2/
Trade Setups, Rules & Trading Strategies
 Trade Setups, Rules & Trading Strategies dba of FreeTradingVideos.com, Inc. v.1411 Using Technical Analysis to Enter, Manage and Exit Trades Quote of the Day At Grok Trade, we do not trade Trading Patterns.
USER GUIDE
 USER GUIDE http://www.winningsignalverifier.com DISCLAIMER Please be aware of the loss, risk, personal or otherwise consequences of the use and application of this book s content. The author and the publisher
Day Trading Strategies. Day Strategies. and Examples. & Risk Management COPYRIGHTED MATERIAL: ANDREW AZIZ (C)
") Day Trading Strategies Day Strategies and Examples & Risk Management ANDREW AZIZ SESSION 4 Disclaimer BearBullTraders.com employees, contractors, shareholders and affiliates, are NOT an investment advisory
Day Trading Strategies Day Strategies and Examples & Risk Management ANDREW AZIZ SESSION 4 Disclaimer BearBullTraders.com employees, contractors, shareholders and affiliates, are NOT an investment advisory
Stacking Indicators Getting a GREAT entry! TWEEZERS Tweezer top/bottom at the band The stock is trending up Gap down (against the trend) Any moving
 Any moving") Dean Storholt I am not a registered broker-dealer or investment adviser. I will mention that I consider certain securities or positions to be good candidates for the types of strategies we are discussing
Dean Storholt I am not a registered broker-dealer or investment adviser. I will mention that I consider certain securities or positions to be good candidates for the types of strategies we are discussing
No duplication of transmission of the material included within except with express written permission from the author.
 Copyright Option Genius LLC. All Rights Reserved No duplication of transmission of the material included within except with express written permission from the author. Be advised that all information is
Chapter 2.3. Technical Analysis: Technical Indicators
 Chapter 2.3 Technical Analysis: Technical Indicators 0 TECHNICAL ANALYSIS: TECHNICAL INDICATORS Charts always have a story to tell. However, from time to time those charts may be speaking a language you
Everything you need to know about the trade alerts you ve been hearing about.
 11 YEAR Everything you need to know about the trade alerts you ve been hearing about. SCORECARD RESULTS FULL MARKET BREAKDOWN COMPLETE ALERT DETAILS INSTITUTIONAL-GRADE TRADE ALERTS: FUTURES, FOREX & INDICES
4 Keys to Trend Trading Tech Analysis. There is no Holy Grail of Trading Only Tools & Rules
 4 Keys to Trend Trading Tech Analysis There is no Holy Grail of Trading Only Tools & Rules Disclaimer U.S. GOVERNMENT REQUIRED DISCLAIMER COMMODITY FUTURES TRADING COMMISSION FUTURES AND OPTIONS TRADING
CHARTS. Bar Line Candlestick Charts are the basis of technical analysis They are a graphic display of price action. Notes:
 TECHNICAL ANALYSIS CHARTS Bar Line Candlestick Charts are the basis of technical analysis They are a graphic display of price action Candlestick charts have become the industry standard for technical traders.
The Master Trader Counter-Trend Trade Set-Ups
 The Master Trader Counter-Trend Trade Set-Ups Trading Concepts, Inc. The Master Trader Counter-Trend Trade Set-Ups By Todd Mitchell Copyright 2014 by Trading Concepts, Inc. All Rights Reserved This training
The Blade Forex Strategies
 The Blade Forex Strategies 1 Introduction 3 Before making a trade 5 Money management 5 Over trading 6 Cutting losses and letting profits run 7 Make a trading plan 7 Record your trading results 8 Be careful
When traders make trading decisions based on repeated price patterns that once formed,
 Trading Strategy / Gert.Nurme@iBrokers.ee Price Action Trading Strategy Introduction WHAT IS PRICE ACTION TRADING? When traders make trading decisions based on repeated price patterns that once formed,
Trading Guidelines. Why guidelines and not rules? Because there are no rules.
 Trading Guidelines Why guidelines and not rules? Because there are no rules. 1. Everything that you see is in a gray fog. Nothing is perfectly clear. Close is close enough. If something looks like a reliable
The Engulfing Trader Copyright 2014
 Www.ForexWinners.Ru Prologue and Introduction This book is for all those that are just fed up with all the hype out there in the market. So called guru s selling expensive strategies and systems guaranteeing
Trading Lessons from the Intraday Frame (study)
") 1 Daily "Idealized Trades" Report Trading Lessons from the Intraday Frame (study) 1 2018 TheoTrade LLC. All rights reserved. 2 Trading Lessons from the Intraday Frame (1-mi) 2 2018 TheoTrade LLC. All rights
1 Daily "Idealized Trades" Report Trading Lessons from the Intraday Frame (study) 1 2018 TheoTrade LLC. All rights reserved. 2 Trading Lessons from the Intraday Frame (1-mi) 2 2018 TheoTrade LLC. All rights
Forex Advantage Blueprint
 Forex Advantage Blueprint Complimentary Report!! www.forexadvantageblueprint.com Copyright Protected www.forexadvantageblueprint.com - 1 - Limits of liability/disclaimer of Warranty The author and publishers
Different Classes Of Divergence
 Russ Horn Presents Different Classes Of Divergence RISK DISCLOSURE STATEMENT / DISCLAIMER AGREEMENT Trading any financial market involves risk. This report and all and any of its contents are neither a
FOREX UNKNOWN SECRET. by Karl Dittmann DISCLAIMER
 FOREX UNKNOWN SECRET by Karl Dittmann DISCLAIMER Please be aware of the loss, risk, personal or otherwise consequences of the use and application of this book s content. The author and the publisher are
Technical Analysis Workshop Series. Session Two
 Technical Analysis Workshop eries ession Two DICLOURE & DICLAIMER This research material has been prepared by NU Invest. NU Invest specifically prohibits the redistribution of this material in whole or
Trading Tops and Bottoms DAILY T&B REPORT. Let Us Find The Highs And Lows For You. November 7, 2017
 Trading Tops and Bottoms DAILY T&B REPORT Let Us Find The Highs And Lows For You November 7, 2017 DISCLAIMER Videos, newsletters and notifications from Trading Tops and Bottoms are for educational purposes
In this report, I will give you a step by step set of instructions for utilizing The Lazy River Scalping Strategy my favorite scalping method.
 What is Scalping? In short, scalping is the idea of taking quick trades (typically on smaller time frames) that only need to go a short distance before you cash out of the position and then to do this
Swing Trading Strategies that Work
 Swing Trading Strategies that Work Jesse Livermore, one of the greatest traders who ever lived once said that the big money is made in the big swings of the market. In this regard, Livermore successfully
FOREX {BY- SUMIT} Contact me in facebook Sumit das
 FOREX LEARN THE CORE OF PRICE ACTION TRADING FOR CONSISTENT RESULT AND PROFIT WITH 3W SYSTEM {BY- SUMIT} Copy right 2016 Contact me in facebook Sumit das All Rights Reserved. No part of this publication
Trading Lessons from the Intraday Frame (study)
") 1 Daily "Idealized Trades" Report Trading Lessons from the Intraday Frame (study) 1 2018 TheoTrade LLC. All rights reserved. 2 Trading Lessons from the Intraday Frame (1-mi) 2 2018 TheoTrade LLC. All rights
1 Daily "Idealized Trades" Report Trading Lessons from the Intraday Frame (study) 1 2018 TheoTrade LLC. All rights reserved. 2 Trading Lessons from the Intraday Frame (1-mi) 2 2018 TheoTrade LLC. All rights
Losing When Good Trade Goes Bad
 Webinar 21 Feb 2017 (futures.io) Losing When Good Trade Goes Bad Al Brooks How to Trade Forex Price Action Part Video #54 Brooks Trading Course BrooksTradingCourse.com BrooksPriceAction.com Main Points
Stay on the Right Side & Finishing the Year Strong! From the Active Trend Trader
 Stay on the Right Side & Finishing the Year Strong! From the Active Trend Trader Disclaimer U.S. GOVERNMENT REQUIRED DISCLAIMER COMMODITY FUTURES TRADING COMMISSION FUTURES AND OPTIONS TRADING HAS LARGE
RISK DISCLOSURE STATEMENT / DISCLAIMER AGREEMENT
 RISK DISCLOSURE STATEMENT / DISCLAIMER AGREEMENT Trading any financial market involves risk. This report and all and any of its contents are neither a solicitation nor an offer to Buy/Sell any financial
Scalp Trading Strategies
 Scalp Trading Strategies Services Disclaimer (for full disclosure, see Disclaimers section of website) Information Contained within our website and affiliates is not a substitute for professional advice
Compilation Of Tips And Uses Of FGS
 Compilation Of Tips And Uses Of FGS Copyright 2012 ForexGeometry.com NOTE: ANY INFORMATION CONTAINED IN THIS DOCUMENT IS FOR EDUCATIONAL PURPOSES ONLY AND IS NOT FINANCIAL ADVICE. U.S. GOVERNMENT REQUIRED
Compass FX
 SYNERGY Trading Method Disclaimer Unique experiences and past performances do not guarantee future results. Trading in the off-exchange Foreign Exchange market (Forex) is very speculative in nature, involves
The Strategies Working Best in Today s E-Mini Market
 The Strategies Working Best in Today s E-Mini Market Todd Mitchell Craig Hill Legal Disclaimer No claim is made by Trading Concepts, Inc. that the trading strategies shown here will result in profits and
The Synthetic Futures Position. Goal
 The Synthetic Futures Position Goal To try to profit from a trending market using an option strategy that allows entry at a reduced cost while offering the same potential for unlimited profit (and loss)
PROFIT TRADE SCANNER. USER GUIDE
 PROFIT TRADE SCANNER USER GUIDE http://www.profittradescanner.com DISCLAIMER Please be aware of the loss, risk, personal or otherwise consequences of the use and application of this book s content. The
Introduction. Technicians (also known as quantitative analysts or chartists) usually look at price, volume and psychological indicators over time.
 usually look at price, volume and psychological indicators over time.") Technical Analysis Introduction Technical Analysis is the study of market action, primarily through the use of charts, for the purpose of forecasting future price trends. Technicians (also known as quantitative
Technical Analysis Introduction Technical Analysis is the study of market action, primarily through the use of charts, for the purpose of forecasting future price trends. Technicians (also known as quantitative
Poseidon FX System (previously known as Currency Messenger System 2) Poseidon system indicators:
 Poseidon system indicators:") Poseidon FX System (previously known as Currency Messenger System 2) Poseidon system indicators: It uses 5 different indicators Mes Signal 2 Indicator which gives you buy and sell arrow signal on the screen.
Poseidon FX System (previously known as Currency Messenger System 2) Poseidon system indicators: It uses 5 different indicators Mes Signal 2 Indicator which gives you buy and sell arrow signal on the screen.