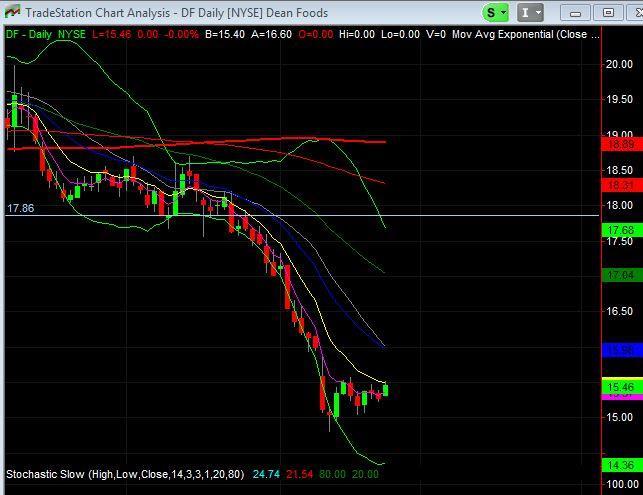
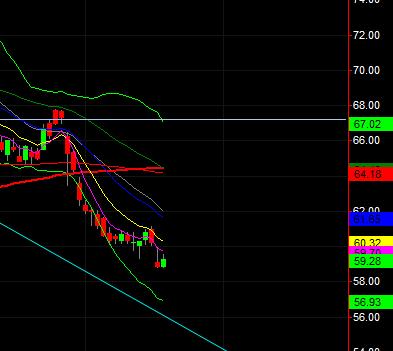
Stacking Indicators Getting a GREAT entry! TWEEZERS Tweezer top/bottom at the band The stock is trending up Gap down (against the trend) Any moving
|
|
|
- Annice Barber
- 5 years ago
- Views:
Transcription

1 Dean Storholt
2 I am not a registered broker-dealer or investment adviser. I will mention that I consider certain securities or positions to be good candidates for the types of strategies we are discussing or illustrating. Because I consider the securities or positions appropriate to the discussion or for illustration purposes does not mean that I am telling you to trade the strategies or securities. Keep in mind that we are not providing you with recommendations or personalized advice about your trading activities. The information we are providing is not tailored to any particular individual. Any mention of a particular security is not a recommendation to buy, sell, or hold that or any other security or a suggestion that it is suitable for any specific person. Keep in mind that all trading involves a risk of loss, and this will always be the situation, regardless of whether we are discussing strategies that are intended to limit risk. I am not subject to trading restrictions. Myself and other instructors could have a position in a security or initiate a position in a security at any time.
3
4 Stacking Indicators Getting a GREAT entry! TWEEZERS Tweezer top/bottom at the band The stock is trending up Gap down (against the trend) Any moving average the longer the term, the stronger it is The gap takes it to a major moving avg sma More than one average in same area Gaps to the Bollinger band Rising/Falling 3 at a moving average Bullish or bearish engulfing candle
5 Stacking Indicators Day count / candle count Old levels of horizontal support/resistance Can include round numbers Retirement pattern at a moving average Repetitive retirement can = TWEEZER Break above the first 5 minute candle Pivot Points Bollinger Band Squeeze/Breakout Volume lower volume indicates its only retracing Blow off move? Fibonacci s Keltners
6 Stacking Indicators Double tops/bottoms Head and shoulders/neckline Old levels of horizontal support/resistance Can include round numbers Rectangles Ascending wicks / decending wicks Stochastics MACD RSI ADX DMI +, DMI-
7 Stacking Indicators Start by stacking indicators on the daily chart Like to have at least 4 Then move to the five minute chart and continue stacking Can even continue stacking on the one minute chart
8 Stacking Indicators Good CALL entry? The more the merrier
9 Trading Rules How many of you have a set of rules? Do they change as you grow? Some of my old ones: If you don t have the entry, don t take the trade Miss the if s You don t need exposure
10 Trading Rules 1. BELIEVE!! Trade from a position of faith, not fear 2. Check the angle of the bands (and moving avgs) 3. Avoid Calls at the top band 4. Avoid Puts at the bottom band 5. Trade in the direction of the trend 6. Don t be emotional 7. Use a stop 8. Buy at least 2 contracts 9. Let the winners run 10. Trust your instincts
11 Trading Rules 1. BELIEVE!! Trade from a position of faith, not fear 2. Check the angle of the bands (and moving avgs) 3. Avoid Calls at the top band 4. Avoid Puts at the bottom band 5. Trade in the direction of the trend 6. Don t be emotional 7. Use a stop 8. Let the winners run 9. Trust your instincts 10. FOLLOW YOUR RULES!
12 Trading Rules 1. BELIEVE!! Trade from a position of faith, not fear How do we do this? Practice Plan the trade BEFORE you execute it If we know our entry and our exit, we know what our risk will be. If our risk is acceptable, no fear Follow the plan
13 Trading Rules 2. Check the angle of the bands (and moving avgs) Why is this important? Horizontal bands are stronger Angled bands are slipperier Horizontal moving averages are weaker Angled moving averages are stronger

14 Trading Rules 2. Check the angle of the bands (and moving avgs)
 Move band to ma (horizontal) Move band to ma")
15 Bollinger Bands If you don t have Bollinger bands on your chart, We cannot be friends!! Stocks behave 3 ways: Move band to band (horizontal) Move band to ma (horizontal) Move band to ma (angled) Money channel
16 Trading Rules 2. Check the angle of the bands (and moving avgs) Horizontal Bands Is the stock moving band to band?
17 Bollinger Band Angle Stack TWEEZER?!?!

18 Bollinger Band Angle SELL SOME?? WHY?? RELOAD?
19 Trading Rules 2. Check the angle of the bands (and moving avgs) Angled Bands The steeper the angle the slicker it is!!!

20 Bollinger Band Angle
21 Trading Rules 2. Check the angle of the bands (and moving avgs) The steeper the slope, the slippery they are Stocks are most likely to follow the steep band angle Moving Averages become more relevant why?

22

23
24 Trading Rules This is where they form the money channel Can be used to time premium selling or add ons Steep band angles need a reason to turn! News Previous support / resistance Bollinger band top or bottom What confirms that it has turned?
25 Bollinger Band Angled Stack
26 Bollinger Band Angled $100 Move +-

27 Bollinger Band Angled Sell calls Add Recognize $ chnl 5ema
28 Trading Rules 3. AVOID CALLS AT THE TOP BAND This and #4 are probably my most important rules! I assume that stocks move from band to band 1 min 5 min Daily This is typically true with horizontal bands If we go band to band, and we are at the top band, what direction are we likely to go?
29 Trading Rules 3. AVOID CALLS AT THE TOP BAND WOO XHOO ITS BREAKING OUT!!!
30 Trading Rules 3. AVOID CALLS AT THE TOP BAND WOO XHOO ITS BREAKING OUT!!!
31 Trading Rules 3. AVOID CALLS AT THE TOP BAND WOO XHOO ITS BREAKING OUT!!! NO MANS LAND
32 Trading Rules 3. AVOID CALLS AT THE TOP BAND WOO XHOO ITS BREAKING OUT!!! NO MANS LAND

33 Trading Rules 3. AVOID CALLS AT THE TOP BAND WOO XHOO ITS BREAKING OUT!!!
34 Trading Rules 4. Avoid Puts at the bottom band Same reasons as calls Stocks move from band to band If we go band to band, and we are at the bottom band, what direction are we likely to go?

35 Trading Rules 4. Avoid Puts at the bottom band OMG ITS BREAKING DOWN!!! Trending Up Gap against the trend Gap to the 200ema Gap to the 5ema off daily
36 Trading Rules The move from outside of a band to inside of a band can often be an EXCELLENT entry for a trade in the opposite direction!!! The distance to the moving average is the determining factor in whether or not to take the trade Is the distance worth playing?
37 Trading Rules 3. Avoid calls at the top band 4. Avoid puts at the bottom band Why do I say AVOID? Exceptions???
38 Bollinger Band Squeeze Bands get very close together Bands usually horizontal Can signal AWESOME breakouts / breakdowns Often give us the avoid calls exception!

39 Bollinger Band Squeeze
40 Bollinger Band Exceptions Outside band gives us the avoid calls exception! If stock outside the top band, go ahead and buy calls If stock outside bottom band, go ahead and buy puts REMEMBER The reason for the entry is the reason for the exit!!! Therefore when it gets inside the band, tighten stop or exit
41 Bollinger Band Exceptions Outside Bollinger Bands How long outside band? Daily chart vs 5 min chart Inside band can give us a nice entry in the opposite direction Steeply angled bands may only retrace to MA!!!!

42 Bollinger Band Exceptions
43 Bollinger Band See Saw What is a see saw?? A see saw occurs when a candlestick is approaching one of the Bollinger bands and we would expect a direction change
44 Bollinger Band See Saw What is a see saw?? A see saw occurs when a candlestick is approaching one of the Bollinger bands and we would expect a direction change The angle formed by the bands should be 130 degrees or less
45 Bollinger Band See Saw What is a see saw?? A see saw occurs when a candlestick is approaching one of the Bollinger bands and we would expect a direction change The angle formed by the bands should be 130 degrees or less The see saw means that the stock will NOT do what we want for 2-6 candles
46 Bollinger Band See Saw What does a see saw mean?? The see saw means that the stock will NOT do what we want for 2-6 candles If we are expecting a bounce off the bottom band, it wont (sideways to down) If we are expecting a failure at the top band, it wont (sideways or up) Often gets us outside the band (3-5 candles)

47 Bollinger Band See Saw PUT ENTRY?
48 Bollinger Band See Saw What happened to the band angle? What else? Stay in puts?
49 Bollinger Band See Saw Defend the gap Anyone want calls here? We re at the bottom band See saw means 2-6 days of not doing what we want

50 Bollinger Band See Saw Band angle? How about calls here? First candle inside the band day 5 of see saw Last time it took us from $200 - $175

51 Bollinger Band See Saw What if we drew this support line on our chart? When it hit the second time, could we enter? Is it too A G G R E S S I V E???.49 cents apart
52 Steep Band Angles Steep band angles need a reason to turn! News Previous support / resistance Bollinger band top or bottom What confirms that it has turned?
53 The Hook When we have steep band angles and we get a reason for the turn, be it old support or a reversal pattern, we need to pay attention to the band angle as the candlestick approaches the moving average
54 The Hook When we have steep band angles and we get a reason for the turn, be it old support or a reversal pattern, we need to pay attention to the band angle as the candlestick approaches the moving average If you don t get a hook by the time it reaches a relevant moving average, close part of your position or tighten your stop. Or both
55 The Hook
56 The Hook
57 The Hook

58 The Diving Board
59 Trade Entry Entry Rules 1- What direction is the stock going (DAILY CHART) Avoid calls on bearish stocks Avoid puts on bullish stocks Don t swim upstream, its harder Day trade exception 2- Where is the stock on the 5 min 3- Is it near a Bollinger band? Moving average? 4- Wait for a retracement to the 10ema or 20 simple ma You may miss a trade
60 Trade Entry Entry Rules 5- Know where your stop is. Below your entry If the band is your entry, can your stop move? Stay within your risk tolerance 6- Limit the number of positions you have until you set a hard stop or you have neutralized your risk in current trade. 7- Once you have your indicators stacked on the daily chart, go to the 5 minute chart and begin stacking them again. 8- Think ahead of the turn. Be the wick!
61 Option Selection Delta Buy as much delta as you can Use delta to calculate stop/determine risk I often use lower deltas Own set of risks What is our target? How much intrinsic value will we have at target? Protect with stop market orders Time How long did it take to make the move last time? Add 7-10 days
62 Where do you set stops? THE REASON FOR YOUR ENTRY IS THE REASON FOR YOUR EXIT! Stack indicators for stronger support/resistance The closer our entry is to our exit, the smaller the cost That s why Tweezers get so much love from me I like to be first to the party!!!!

63 Legging in and out
64 Legging in and out PROS: Excellent in choppy markets Allows you to pocket profit while maintaining exposure Helps control your emotions In a no lose trade Without taking profit slices the chop may only eat up your time value
65 Legging in and out CONS: You may be left with a tiny position if the stock never retraces
66 Legging in and out Many times stocks will FAIL or BOUNCE off of a moving average. Is the moving average flat or angled? The 20sma is the main one I focus on, UNLESS the stock is following a different one RESPECT THE 20 SIMPLE MOVING AVERAGE! Once the candlestick goes thru a moving average, that average can become the stop

67 Market Prep
68 Market Prep What are bands doing? Are they Horizontal or Angled? Horizontal: Is stock near the band? Reversal pattern near band? Angled: Is it near the band? Is it near the moving average? Is the stock in No Mans Land?
69 Market Prep Is the stock going band to band? What is the distance between the bands? Is it playable? What are the stochastics doing?

70

71 Market Prep 1. Prioritize candidates 2. Make checklist 3. Set alerts on platform 4. Snap lines on 5 min charts 1) HD 2) CLB 3) DE 4) LVS 5) NTES

72 Market Prep
73 Another Market Prep Class? Another 4 hour class Take to the next level Diving Board More about option selection, risk management
74 Weekly Market Prep Class? Get together EVERY Sunday For 2 hours Analyze charts Snap lines and set alerts
75 I am not a registered broker-dealer or investment adviser. I will mention that I consider certain securities or positions to be good candidates for the types of strategies we are discussing or illustrating. Because I consider the securities or positions appropriate to the discussion or for illustration purposes does not mean that I am telling you to trade the strategies or securities. Keep in mind that we are not providing you with recommendations or personalized advice about your trading activities. The information we are providing is not tailored to any particular individual. Any mention of a particular security is not a recommendation to buy, sell, or hold that or any other security or a suggestion that it is suitable for any specific person. Keep in mind that all trading involves a risk of loss, and this will always be the situation, regardless of whether we are discussing strategies that are intended to limit risk. I am not subject to trading restrictions. Myself and other instructors could have a position in a security or initiate a position in a security at any time.

76 Trading Log
Stacking Indicators Getting a GREAT entry! TWEEZERS Tweezer top/bottom at the band The stock is trending up Gap down (against the trend) Any moving
 Any moving") Dean Storholt I am not a registered broker-dealer or investment adviser. I will mention that I consider certain securities or positions to be good candidates for the types of strategies we are discussing
Dean Storholt I am not a registered broker-dealer or investment adviser. I will mention that I consider certain securities or positions to be good candidates for the types of strategies we are discussing
How many of you are or will be trading a small account?
 Dean Storholt I am not a registered broker-dealer or investment adviser. I will mention that I consider certain securities or positions to be good candidates for the types of strategies we are discussing
Technicals & Time Frame
 Advanced Charting Neither Better Trades or any of its personnel are registered broker-dealers or investment advisers. I will mention that I consider certain securities or positions to be good candidates
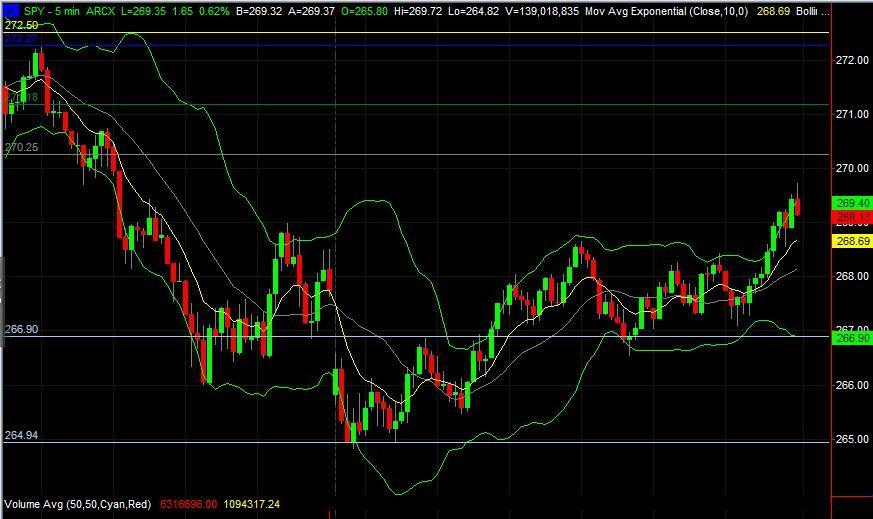
Presents. SPY the MARKET. With. Bill Corcoran
 Presents SPY the MARKET With Bill Corcoran I am not a registered broker-dealer or investment adviser. I will mention that I consider certain securities or positions to be good candidates for the types
EJ_4H Method Part III
 EJ_4H Method Part III Trailing price: Protecting your hard-earned money against reversals or even flurries is one of the most important parts of money management. Most of platforms have such feature that
1. Introduction 2. Chart Basics 3. Trend Lines 4. Indicators 5. Putting It All Together
 Technical Analysis: A Beginners Guide 1. Introduction 2. Chart Basics 3. Trend Lines 4. Indicators 5. Putting It All Together Disclaimer: Neither these presentations, nor anything on Twitter, Cryptoscores.org,
Monster Market Movers
 Monster Market Movers Prerequisite Manual Better Trades Coach Robert Roy Neither Mastermind Traders or any of its personnel are registered broker-dealers or investment advisers. I will mention that I consider
2.0. Learning to Profit from Futures Trading with an Unfair Advantage! Income Generating Strategies Starting the Trading Day
 2.0 Learning to Profit from Futures Trading with an Unfair Advantage! Income Generating Strategies Starting the Trading Day Income Generating Strategies Starting the Trading Day Pre-Market Analysis Before
presented by Thomas Wood MicroQuant SM Divergence Trading Workshop Day One Naked Trading Part 2
 presented by Thomas Wood MicroQuant SM Divergence Trading Workshop Day One Naked Trading Part 2 Risk Disclaimer Trading or investing carries a high level of risk, and is not suitable for all persons. Before
INTERMEDIATE EDUCATION GUIDE
 INTERMEDIATE EDUCATION GUIDE CONTENTS Key Chart Patterns That Every Trader Needs To Know Continution Patterns Reversal Patterns Statistical Indicators Support And Resistance Fibonacci Retracement Moving
Test Your Chapter 1 Knowledge
 Self-Test Answers Test Your Chapter 1 Knowledge 1. Which is the preferred chart type in LOCKIT? The preferred chart type in LOCKIT is the candle chart because candle patterns are part of the decision-making
CONNECING THE DOTS Candlesticks & Convergence of Clues. The Art & Science of Active Trend Trading
 CONNECING THE DOTS Candlesticks & Convergence of Clues The Art & Science of Active Trend Trading Disclaimer U.S. Government Required Disclaimer Commodity Futures Trading Commission Futures and Options
2.0. Learning to Profit from Futures Trading with an Unfair Advantage! Income Generating Strategies Essential Trading Tips & Market Insights
 2.0 Learning to Profit from Futures Trading with an Unfair Advantage! Income Generating Strategies Essential Trading Tips & Market Insights Income Generating Strategies Essential Trading Tips & Market
- My 4 Favorite Trades - Essential Trades of a Professional Trader
 presented by Thomas Wood MicroQuant SM Divergence Trading Workshop Day One - My 4 Favorite Trades - Essential Trades of a Professional Trader Risk Disclaimer Trading or investing carries a high level of
The Art & Science of Active Trend Trading
 CONNECTING THE DOTS Candlesticks & Convergence of Clues The Art & Science of Active Trend Trading Copyright ATTS 2007-2015 1 Dennis W. Wilborn, P.E. Founder, President Active Trend Trading dww@activetrendtrading.com
Day Trade Warrior. Chapter 5. Intraday Chart Patterns
 Day Trade Warrior Chapter 5. Intraday Chart Patterns What do we know? We have learned about Managing Risk (2:1 profit loss ratio 50% success target) We have learned how to find the Right Stocks (high relative
 1 www.candlecharts.com 2 BONUS www. candlecharts.com/special/swing-trading-2/ 3 www. candlecharts.com/special/swing-trading-2/ 4 www. candlecharts.com/special/swing-trading-2/ 5 www. candlecharts.com/special/swing-trading-2/
Technical Analysis Indicators
 Technical Analysis Indicators William s Percent R Rules, Scans, Adding Filters, Breakout, Retest, and Application across MTFs Course Instructor: Price Headley, CFA, CMT BigTrends Coaching Access to BigTrends
TECHNICAL INDICATORS
 TECHNICAL INDICATORS WHY USE INDICATORS? Technical analysis is concerned only with price Technical analysis is grounded in the use and analysis of graphs/charts Based on several key assumptions: Price
BONUS. www. candlecharts.com/special/swing-trading-2/
 BONUS www. candlecharts.com/special/swing-trading-2/ 1 www. candlecharts.com/special/swing-trading-2/ www. candlecharts.com/special/swing-trading-2/ www. candlecharts.com/special/swing-trading-2/ 2 www.
Divergence and Momentum Trading
 presented by Thomas Wood MicroQuant SM Divergence Trading Workshop Day One Divergence and Momentum Trading Risk Disclaimer Trading or investing carries a high level of risk, and is not suitable for all
FOREX. analysing made easy. UNDERSTANDING TECHNICAL ANALYSIS An educational tool by Blackwell Global
 FOREX analysing made easy UNDERSTANDING TECHNICAL ANALYSIS An educational tool by Blackwell Global Risk Warning: Forex and CFDs are leveraged products and you may lose your initial deposit as well as substantial
FOREX INDICATORS. THEIR PRIORITY and USE
 FOREX INDICATORS THEIR PRIORITY and USE by G. C. Smith U.S. Government Required Disclaimer Trading foreign exchange markets on margin carries a high level of risk, and may not be suitable for all investors.
Day Trading Strategies. Day Strategies. and Examples. & Risk Management COPYRIGHTED MATERIAL: ANDREW AZIZ (C)
") Day Trading Strategies Day Strategies and Examples & Risk Management ANDREW AZIZ SESSION 4 Disclaimer BearBullTraders.com employees, contractors, shareholders and affiliates, are NOT an investment advisory
Day Trading Strategies Day Strategies and Examples & Risk Management ANDREW AZIZ SESSION 4 Disclaimer BearBullTraders.com employees, contractors, shareholders and affiliates, are NOT an investment advisory
The Art & Science of Active Trend Trading
 CONNECTING THE DOTS Candlesticks & Convergence of Clues The Art & Science of Active Trend Trading Copywrite ATTS 2007-2015 1 Dennis W. Wilborn, P.E. Founder, President Active Trend Trading dww@activetrendtrading.com
Active Trend Trading Rules Review
 Active Trend Trading Rules Review Active Trend Trader: Dennis W. Wilborn A Trend Should Be Assumed to Continue in Effect Until Such Time as Its Reversal Has Been Definitely Signaled Edwards & Magee Disclaimer
Coaching Session FIVE
 Coaching Session FIVE Coaching Session FIVE Counter-Trend Trade Set-Ups Program Summary Trading Plan Execution The Master Trader Powerful Price Pattern Trades Trade Management Initial Trend Entry Trading
Figure 3.6 Swing High
 Swing Highs and Lows A swing high is simply any turning point where rising price changes to falling price. I define a swing high (SH) as a price bar high, preceded by two lower highs (LH) and followed
DAILY DAY TRADING PLAN
 DAILY DAY TRADING PLAN Gatherplace will be used to place all of your trades. You will be using the 5 minute chart for the trade setup and the 1 minute chart for your entry, stop and trailing stop.you will
Class 6: Trading the Lanes (In-depth Line Drawing and Charting) Review of Class So Far
 Review of Class So Far") Today s Class Class 6: Trading the Lanes (In-depth Line Drawing and Charting) Review of class so far Where we are going from here More in-depth technical analysis Trading with brackets (neutral trading)
Today s Class Class 6: Trading the Lanes (In-depth Line Drawing and Charting) Review of class so far Where we are going from here More in-depth technical analysis Trading with brackets (neutral trading)
Table of Contents. Risk Disclosure. Things we will be going over. 2 Most Common Chart Layouts Anatomy of a candlestick.
 Table of Contents Risk Disclosure Things we will be going over 2 Most Common Chart Layouts Anatomy of a candlestick Candlestick chart Anatomy of a BAR PLOT Indicators Trend-Lines Volume MACD RSI The Stochastic
Strategic Trade Management. A Comprehensive Trading Plan for Managing Risk in Option Trading
 Strategic Trade Management A Comprehensive Trading Plan for Managing Risk in Option Trading 1 Neither Better Trades or any of its personnel are registered broker-dealers or investment advisers. I will
Trade Ideas A.I. Strategy Descriptions Revised : 10/04/2017
 Trade Ideas A.I. Strategy Descriptions Revised : 10/04/2017 The 5 Day Bounce The trigger for this alert has to cross above resistance while also making a 60 minute high on stocks that are trying to bounce
WELCOME
 www.facebook.com/fxdd www.twitter.com/fxdd WELCOME Part 1: Building the Forex Traders Foundation Greg Michalowski Email: greg@fxdd.com www.livestream.com/fxdd www.fxddnow.com Twitter: gregmikefx Disclaimer
Price Action - The Footprint of the Money Judy MacKeigan - Buffy
 Price Action - The Footprint of the Money Judy MacKeigan - Buffy "What is Price Action?" is a frequently asked question by aspiring traders. Traders who ask, feel it is a well kept secret when all they
What Came First... Fundamentals or the Technicals? By Jared Martinez
 What Came First... Fundamentals or the Technicals? By Jared Martinez I am honored to share my thoughts on our methodologies, focusing on the current technical movements and conditions of the FOREX Markets,
Page 1 of 96 Order your Copy Now Understanding Chart Patterns
 Page 1 of 96 Page 2 of 96 Preface... 5 Who should Read this book... 6 Acknowledgement... 7 Chapter 1. Introduction... 8 Chapter 2. Understanding Charts Convention used in the book. 11 Chapter 3. Moving
TRADING PLAN Trading Philosophy / Trading Psychology: Golden Trading Rules:
 TRADING PLAN Trading Philosophy / Trading Psychology: I believe that Financial Markets are 100% psychology driven. Price patterns are a reflection of the collective psychology of a large number of traders.
Lighting the Way: Using Candlestick Patterns. The Art & Science of Active Trend Trading
 Lighting the Way: Using Candlestick Patterns The Art & Science of Active Trend Trading Disclaimer U.S. Government Required Disclaimer Commodity Futures Trading Commission Futures and Options trading has
Trading Lessons from the Intraday Frame (study)
") 1 Daily "Idealized Trades" Report Trading Lessons from the Intraday Frame (study) 1 2018 TheoTrade LLC. All rights reserved. 2 Trading Lessons from the Intraday Frame (1-mi) Major Companies Reporting Earnings
1 Daily "Idealized Trades" Report Trading Lessons from the Intraday Frame (study) 1 2018 TheoTrade LLC. All rights reserved. 2 Trading Lessons from the Intraday Frame (1-mi) Major Companies Reporting Earnings
Technical Analysis. Dealing Room Peter Leonidou. Peter Leonidou
 Technical Analysis Dealing Room Questions Traders Should Ask What is the trend? What is the pivot point? What is the support levels? What is the resistance levels? Strong or weaker USD? What 1. Trade
Market Observations as of Mar 2, 2018
 Market Observations as of Mar 2, 2018 By Carl Jorgensen - For Objective Traders - For educational purposes only. Not Financial Advice. The markets were mixed this week as volatility raised its head back
Trade Setups, Rules & Trading Strategies
 Trade Setups, Rules & Trading Strategies dba of FreeTradingVideos.com, Inc. v.1411 Using Technical Analysis to Enter, Manage and Exit Trades Quote of the Day At Grok Trade, we do not trade Trading Patterns.
Candlestick Secrets for Profiting in Options Seminar Nison Candlesticks to Guide Your Option Trades. Nison Chart Challenge 7 - Read Steve s Mind
 Nison Chart Challenge 7 - Read Steve s Mind 1) How could we have used NCS after the first hammer to find a good trade set up and decrease time decay? 2) What outright or spread could we have done? 3) When
How I Trade Profitably Every Single Month without Fail
 How I Trade Profitably Every Single Month without Fail First of all, let me take some time to introduce myself to you. I am Koon Hwee (KH Lee) and I am a full time currency trader. I have a passion for
50 Pips A Day Forex Strategy. How To Build A Solid Trading System. By Laurentiu Damir. Copyright 2012 by Laurentiu Damir
 50 Pips A Day Forex Strategy How To Build A Solid Trading System By Laurentiu Damir Copyright 2012 by Laurentiu Damir All rights reserved. No part of this book may be reproduced or transmitted in any form
The Art & Science of Active Trend Trading
 Candlesticks Looking for U-Turns The Art & Science of Active Trend Trading Copywrite ATTS 2007-2015 1 Disclaimer U.S. Government Required Disclaimer Commodity Futures Trading Commission Futures and Options
Martin J. Pring President of Pring.com
 Martin J. Pring President of Pring.com How to Manage Risk Using Technical Analysis The first trading objective is to preserve capital #1 Trading rule Cut losses quickly, let profits run. First trade 50%
Trading Lessons from the Intraday Frame (study)
") 1 Daily "Idealized Trades" Report Trading Lessons from the Intraday Frame (study) 1 2018 TheoTrade LLC. All rights reserved. 2 Trading Lessons from the Intraday Frame (1-mi) 2 2018 TheoTrade LLC. All rights
1 Daily "Idealized Trades" Report Trading Lessons from the Intraday Frame (study) 1 2018 TheoTrade LLC. All rights reserved. 2 Trading Lessons from the Intraday Frame (1-mi) 2 2018 TheoTrade LLC. All rights
CHARTS. Bar Line Candlestick Charts are the basis of technical analysis They are a graphic display of price action. Notes:
 TECHNICAL ANALYSIS CHARTS Bar Line Candlestick Charts are the basis of technical analysis They are a graphic display of price action Candlestick charts have become the industry standard for technical traders.
Chapter 3.3. Price Patterns
 1 Chapter 3.3 Price Patterns 0 TECHNICAL ANALYSIS: PRICE PATTERNS Traders vote with their chequebooks. If they believe a stock or CFD is going to move higher then they will buy the stock or CFD. If they
With that, let s dive into the steps. Step 1 Identify range bound markets on Daily or 4 Hour Charts
 If you have been trading for any length of time, you have probably noticed that the markets are moving sideways A LOT. Consolidation is a huge part of the market s balance and so it makes sense to learn
Technical Analysis for Options Trading. Fidelity Brokerage Services LLC, Member NYSE, SIPC, 900 Salem Street, Smithfield, RI
 Technical Analysis for Options Trading Fidelity Brokerage Services LLC, Member NYSE, SIPC, 900 Salem Street, Smithfield, RI 02917 747561.2.0 Disclosures Options trading entails significant risk and is
Apiary Fund Trading Plan
 Apiary Fund Trading Plan Position Size Always set stop < 2% of account balance. 75% of trades should be between.5% and 1% of account balance. Chart Setup OSMA and SMA Strategy Chart Setup Monitor and focus
Technical Analysis Workshop Series. Session Six 1, 2, 3 Price-Bars Patterns
 Technical Analysis Workshop Series Session Six 1, 2, 3 Price-Bars Patterns DISCLOSURES & DISCLAIMERS This research material has been prepared by NUS Invest. NUS Invest specifically prohibits the redistribution
The Engulfing Trader Copyright 2014
 Www.ForexWinners.Ru Prologue and Introduction This book is for all those that are just fed up with all the hype out there in the market. So called guru s selling expensive strategies and systems guaranteeing
BY JIM PRINCE
 No part of this publication may be reproduced, stored in a retrieval system, or transmitted in any form or by any means electronic, mechanical, photocopying, recording, or otherwise without the prior permission
Tradeciety s Price Action Guide
 Tradeciety s Price Action Guide Welcome... 3 Who am I?... 3 Some impressions from my trading & traveling lifestyle... 4 What Is Price Action?... 6 Candlesticks vs. Chart patterns... 7 Top 3 Candlestick
Technical Stock Market and Stock Analysis UCLA Extension
 Technical Stock Market and Stock Analysis UCLA Extension Date: February 4, 2012 Duration: Instructor: 9:00 AM - 4:00 PM Andrew Lais Investment Executive and General Principal Course Topics and Aim: This
Saudi Market (TADAWUL)... 2 Boursa Kuwait... 3 Abu Dhabi Exchange... 4 Dubai Financial Market... 5 Definitions... 6 Contacts... 7.
... 2 Boursa Kuwait... 3 Abu Dhabi Exchange... 4 Dubai Financial Market... 5 Definitions... 6 Contacts... 7.") QNBFS Technical Technical Spotlight Spotlight Sunday, Monday, January March 05, 14, 2018 Contents Saudi Market (TADAWUL)... 2 Boursa Kuwait... 3 Abu Dhabi Exchange... 4 Dubai Financial Market... 5 Definitions...
QNBFS Technical Technical Spotlight Spotlight Sunday, Monday, January March 05, 14, 2018 Contents Saudi Market (TADAWUL)... 2 Boursa Kuwait... 3 Abu Dhabi Exchange... 4 Dubai Financial Market... 5 Definitions...
BUY SELL PRO. Improve Profitability & Reduce Risk with BUY SELL Pro. Ultimate BUY SELL Indicator for All Time Frames
 BUY SELL PRO Improve Profitability & Reduce Risk with BUY SELL Pro Ultimate BUY SELL Indicator for All Time Frames Risk Disclosure DISCLAIMER: Crypto, futures, stocks and options trading involves substantial
Scalp Trading Strategies
 Scalp Trading Strategies Services Disclaimer (for full disclosure, see Disclaimers section of website) Information Contained within our website and affiliates is not a substitute for professional advice
Bollinger Trading Methods. Play 1 - The Squeeze
 Overview: Play 1 - The Squeeze Play 2 - The Trend Trade Play 3 - Reversals Wrap up Bollinger Trading Methods Play 1 - The Squeeze The Squeeze The most popular strategy Looks to enter a trend early on Anticipates
4 Keys to Trend Trading Tech Analysis. There is no Holy Grail of Trading Only Tools & Rules
 4 Keys to Trend Trading Tech Analysis There is no Holy Grail of Trading Only Tools & Rules Disclaimer U.S. GOVERNMENT REQUIRED DISCLAIMER COMMODITY FUTURES TRADING COMMISSION FUTURES AND OPTIONS TRADING
Orders, Level 2, Price Action COPYRIGHTED MATERIAL: ANDREW AZIZ (C) 1
 1") Orders, Level 2, Price Action ANDREW AZIZ SESSION 3 COPYRIGHTED MATERIAL: ANDREW AZIZ (C) WWW.BEARBULLTRADERS.COM 1 Disclaimer BearBullTraders.com employees, contractors, shareholders and affiliates, are
Orders, Level 2, Price Action ANDREW AZIZ SESSION 3 COPYRIGHTED MATERIAL: ANDREW AZIZ (C) WWW.BEARBULLTRADERS.COM 1 Disclaimer BearBullTraders.com employees, contractors, shareholders and affiliates, are
Chapter 2.3. Technical Analysis: Technical Indicators
 Chapter 2.3 Technical Analysis: Technical Indicators 0 TECHNICAL ANALYSIS: TECHNICAL INDICATORS Charts always have a story to tell. However, from time to time those charts may be speaking a language you
Chapter 3. Price Action
 Chapter 3 Price Action The movement of price in any market is called Price Action. This movement is caused by the beliefs and trading systems of hundreds of thousands of worldwide traders that the market
C y c l e C a n d l e s T r a d i n g W o r k s h o p
 C y c l e C a n d l e s Trading Workshop Risk Disclaimer Trading or investing carries a high level of risk, and is not suitable for all persons. Before deciding to trade or invest you should carefully
PART 3 - CHART PATTERNS & TECHNICAL INDICATORS
 Tyler Chianelli s EASYOPTIONTRADING by OPTION TRADING COACH PART 3 - CHART PATTERNS & TECHNICAL INDICATORS A SIMPLE SYSTEM FOR TRADING OPTIONS WORKS IN UP, DOWN, AND SIDEWAYS MARKETS PART 3.1 - PRIMARY
Convergence and Divergence
 Convergence and Divergence Momentum: The Verge of Success Momentum plays a key role in trend analysis. Trends are composed of a series of price swings. It is a trader s edge to know when a trend is slowing
Trading the Hidden Divergence. Presented by Sunil Mangwani
 Trading the Hidden Divergence Indicators in technical analysis. Indicators along with chart patterns, trend lines, resistance / support levels etc., are an essential part of technical analysis. But there
presented by Thomas Wood MicroQuant SM Divergence Trading Workshop Day One Black Gold
 presented by Thomas Wood MicroQuant SM Divergence Trading Workshop Day One Black Gold Risk Disclaimer Trading or investing carries a high level of risk, and is not suitable for all persons. Before deciding
FOREX TRADING STRATEGIES.
 FOREX TRADING STRATEGIES www.ifcmarkets.com www.ifcmarkets.com 2 One of the most powerful means of winning a trade is the portfolio of Forex trading strategies applied by traders in different situations.
Continuing Divergence How to trade it and how to manage it Vladimir Ribakov s Divergence University
 Continuing Divergence How to trade it and how to manage it What we will learn Confirm the divergence Prepare next entries Set the target Stop Loss Yes or No? Examples + Test Confirmations It s VERY important
Trend Channels: How to Identify Easy Profit-Making Opportunities Using Simple Chart Analysis
 Trend Channels: How to Identify Easy Profit-Making Opportunities Using Simple Chart Analysis Trend channels produce a very powerful trading technique. They are very visible, which makes them easy to utilize
Stay on the Right Side & Finishing the Year Strong! From the Active Trend Trader
 Stay on the Right Side & Finishing the Year Strong! From the Active Trend Trader Disclaimer U.S. GOVERNMENT REQUIRED DISCLAIMER COMMODITY FUTURES TRADING COMMISSION FUTURES AND OPTIONS TRADING HAS LARGE
Forex Sentiment Report Q2 FORECAST WEAK AS LONG AS BELOW April
 Forex Sentiment Report 08 April 2015 www.ads-securities.com Q2 FORECAST WEAK AS LONG AS BELOW 1.1200 Targets on a break of 1.1534/35: 1.1740/50 1.1870/75 1.2230/35 Targets on a break of 1.0580/70: 1.0160
What is the Standard BD Strategy? The Standard BD Strategy for Binary Trading
 What is the Standard BD Strategy? The Standard BD Strategy for Binary Trading The Standard BD Strategy is the foundations of the Binary Destroyer. Jamie first created the Binary Destroyer back in 2015
Introduction. Technicians (also known as quantitative analysts or chartists) usually look at price, volume and psychological indicators over time.
 usually look at price, volume and psychological indicators over time.") Technical Analysis Introduction Technical Analysis is the study of market action, primarily through the use of charts, for the purpose of forecasting future price trends. Technicians (also known as quantitative
Technical Analysis Introduction Technical Analysis is the study of market action, primarily through the use of charts, for the purpose of forecasting future price trends. Technicians (also known as quantitative
MULTI-TIMEFRAME TREND TRADING
 1. SYNOPSIS The system described is a trend-following system on a slow timeframe that uses optimized (that is, contrarian) entries and exits on a fast timeframe at the tops and bottoms of retraces against
Candlestick Forum Boot Camp. High Profit Patterns. Why is it important to know the patterns? Eliminates emotions
 Candlestick Forum Boot Camp High Profit Patterns Why is it important to know the patterns? Eliminates emotions 1 Advanced Candlestick Patterns Fry Pan Bottom Dumpling Top Cradle Pattern Jay-Hook Scoop
Tommy s Revenge 2.0 Module 2 Part 2
 1 Mark Deaton here with your follow-up to Module 2. Going to cover a few things in this video and try to keep it short and sweet. We re going to look at Stock Fetcher and how we can use Stock Fetcher to
Buy Now, Paid Later. Learning LEAP Leverage Strategies. By Markay Latimer
 Buy Now, Paid Later Learning LEAP Leverage Strategies By Markay Latimer Neither Better Trades or any of its personnel are registered broker-dealers or investment advisers. I will mention that I consider
ART OF TRADING. Master the
 Master the ART OF TRADING EXPERT TRAINING FROM TRADING MASTERS AND COACHING PROFESSIONALS From learning the basics to creating a trading plan, our programs will help you increase your knowledge and improve
Level I Learning Objectives by chapter
 Level I Learning Objectives by chapter 1. Introduction to the Evolution of Technical Analysis Describe the development of modern technical analysis Describe the origins of technical analysis 2. A New Age
Knowing When to Buy or Sell a Stock
 Knowing When to Buy or Sell a Stock Overview Review & Market direction Driving forces of market change Support & Resistance Basic Charting Review & Market Direction How many directions can a stock s price
Market Technical Analysis REPORT
 Market Technical Analysis REPORT using Integrated Pitchfork Analysis by Dr Mircea Dologa, MD, CTA MORNING of May 21st 2007 The traders must progressively monitor the conditions of the market movements
Introduction...1 Part I: Getting Familiar with Candlestick Charting and Technical Analysis...7. Part V: The Part of Tens...315
 Contents at a Glance Introduction...1 Part I: Getting Familiar with Candlestick Charting and Technical Analysis...7 Chapter 1: Understanding Charting and Where Candlesticks Fit In...9 Chapter 2: Getting
Saudi Market (TADAWUL)... 2 Boursa Kuwait... 3 Abu Dhabi Exchange... 4 Dubai Financial Market... 5 Definitions... 6 Contacts... 7.
... 2 Boursa Kuwait... 3 Abu Dhabi Exchange... 4 Dubai Financial Market... 5 Definitions... 6 Contacts... 7.") QNBFS Technical Technical Spotlight Spotlight Sunday, February January 14, 11, 2018 2018 Contents Saudi Market (TADAWUL)... 2 Boursa Kuwait... 3 Abu Dhabi Exchange... 4 Dubai Financial Market... 5 Definitions...
QNBFS Technical Technical Spotlight Spotlight Sunday, February January 14, 11, 2018 2018 Contents Saudi Market (TADAWUL)... 2 Boursa Kuwait... 3 Abu Dhabi Exchange... 4 Dubai Financial Market... 5 Definitions...
MY RULES: 5 MINUTE INTRADAY TRADING SYSTEM ADDITIONAL GUIDELINES/ISSUES TO CONSIDER
 MY RULES: 5 MINUTE INTRADAY TRADING SYSTEM ADDITIONAL GUIDELINES/ISSUES TO CONSIDER 7. ADDITIONAL ISSUES TO CONSIDER: Adapted from Original developer Phillip Nel 4ed Oct 2007 7.1 Look for activities on
Market Observations - as of Jun 8, 2018
 Market Observations - as of Jun 8, 2018 By Carl Jorgensen - For Objective Traders - For educational purposes only. Not Financial Advice. Over the past four months we have seen several examples of Consolidation
Date: 10 th Sep 2018 NIFTY
 Date: 10 th Sep 2018 NIFTY Indian market managed to close on positive note after it seen some selling pressure at the start of week on the back of rupee depreciation, higher crude prices and worries over
Class 7: Moving Averages & Indicators. Quick Review
 Today s Class Moving Averages Class 7: Moving Averages & Indicators 3 Key Ways to use Moving Averages Intro To Indicators 2 Indicators Strength of Lines Quick Review Great for establishing point of Support
1 P a g e. Executive Summary
 Executive Summary Based on this week s deduction of observable facts, we continue to favor the major a at SPX 1867, major b at SPX 2021 and major c down to SPX 1830-1850ies around October 9-12. How exactly
Bollinger Bands Forex Trading Strategy With 20 Period Moving Average
 Bollinger Bands Forex Trading Strategy With 20 Period Moving Average The bollinger bands forex trading strategy with 20 period moving average is a very simple forex strategy that works very well for all
Mastering the Markets
 www.mastermindtraders.com Presents Mastering the Markets Your Path to Financial Freedom DISCLAIMER Neither or any of its personnel are registered broker-dealers or investment advisors. We may mention that
The Master Trader Counter-Trend Trade Set-Ups
 The Master Trader Counter-Trend Trade Set-Ups Trading Concepts, Inc. The Master Trader Counter-Trend Trade Set-Ups By Todd Mitchell Copyright 2014 by Trading Concepts, Inc. All Rights Reserved This training
Free signal generator for traders
 Free signal generator for traders Trader s Bulletin Pivot Point Trading Strategy 1. Just download the FREE tool 2. Key in a few numbers 3. And follow the simple techniques by Mark Rose To make money from
Gambit Trading Suite Setup Guide. V2.31 PUBLIC BETA March 2017
 Gambit Trading Suite Setup Guide V2.31 PUBLIC BETA March 2017 Gambit Trading Suite - Intro The Gambit Trading Suite is a set of indicators developed in Pine script to be used on Tradingview.com. The goal
Introduction. About author
 Content Introduction...3 1. Going in the right direction...5 2. Pivot Points...10 3. Camarilla pivot points...27 4. Fibonacci trading...34 Fibonacci trading on higher timeframes...51 5. Pivots and Fibonacci...65