Table of Contents. Risk Disclosure. Things we will be going over. 2 Most Common Chart Layouts Anatomy of a candlestick.
|
|
|
- Benedict Hicks
- 6 years ago
- Views:
Transcription
1
2 Table of Contents Risk Disclosure Things we will be going over 2 Most Common Chart Layouts Anatomy of a candlestick Candlestick chart Anatomy of a BAR PLOT Indicators Trend-Lines Volume MACD RSI The Stochastic Fibonacci Bollinger Bands
3 Risk Disclosure: Past performance is not necessarily indicative of future performance. The risk of loss in trading futures contracts or commodity options can be substantial, and therefore investors should understand the risks involved in taking leveraged positions and must assume responsibility for the risks associated with such investments and for their results. When investing in the purchasing of options, you may lose all of the money you invested. When selling options, you may lose more than the funds you invested.
4 Things we will be going over 2 Most Common Chart Layouts: Trend-Lines I. Resistance II. Support III. Core Principles 4


5 Things we will be going over Volume & Relative Strength Index (RSI) Moving Averages + Oscillator The MACD 5

6 Things we will be going over Fibonacci + Bollinger Bands 6
 On the")


7 Candlestick Bar Plot Here we see the 2 most common chart layouts On the left the candlestick, also known as the OHLC (which stands for Open High Low Close) On the right the bar plot Characteristics of a candlestick: The rectangle body represents the open and close and dictates if it was an up day or down day The 2 wicks of the candle (on the top and bottom) represent the intraday highs and lows of the trading session In electronic trading typically an up day is shown in green and a down day is shown in red 7

8 By looking at an OHLC chart you can see (just to mention a few) Strings of up days and of down days Periods of strength and weakness How sustained moves are and How we got to where we are 8

9 Bar Plot has the same CORE information Open, intraday high and intra day low, with close You are not immediately drawn to up and down days as easily with colors Open dash ALWAYS on the left Close dash ALWAYS on the right 9
10 10
11 Indicators
12 12
13 An upward or downward line on a chart indicating movements of prices over a period of time. Generally occurring after 2 points of resistance or support. 13
14 14 ***IMPORTANT*** You want to see the market close ABOVE or BELOW the trend-line to be considered broken

15 1Once a trend has formed it will remain intact until broken They help distinguish emotion 2From analytical decisions 15

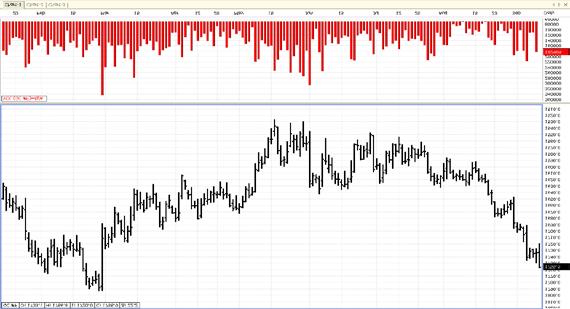
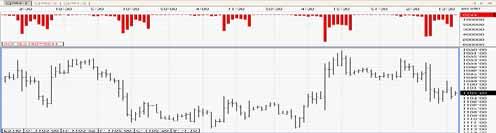
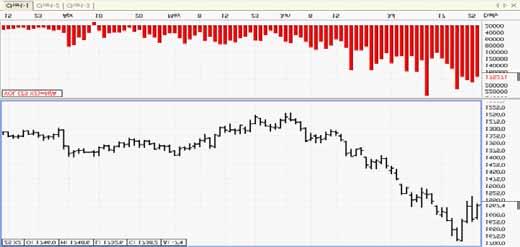
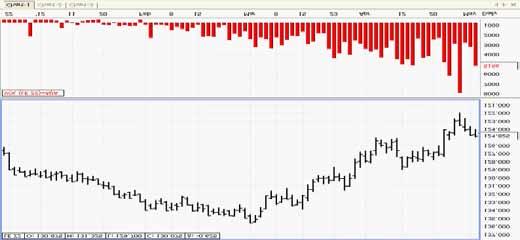
16 Healthy trends should have higher volume to confirm a sustained 3 move may be taking place You want to see that there is continued interest in the market price action so you can be confident that the trend will continue. If the volume begins to diminish you will most likely see the move start to slow down. Higher OR Lower Important to note that you may be SHORT a market you want to see that continuation selling! 16
17 17
18 18

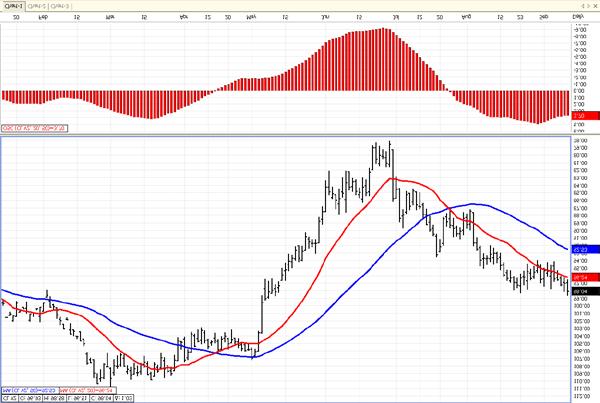
19 MACD is an indicator with 2 moving averages and an oscillator Lets break down what a moving average is and how it is used correctly And then look at the oscillator We will then look back at the MACD with a better understanding of its moving parts Moving Average is constructed by: Adding the last number of specified days and dividing by said number Example: The 5 day MA is the last 5 days added together and divided by 5 19
20 Lets take a look: Day 1: Day 2: Day 3: Day 4: Day 5: 5 day MA: If we add a Day 6: Day 1: Day 2: Day 3: Day 4: Day 5: "Day 6": The FIRST day we started tracking is deleted: Day 1: Day 2: Day 3: Day 4: Day 5: "Day 6": We NOW have a NEW 5 day moving average: Day 1: Day 2: Day 3: Day 4: Day 5: New 5 Day MA:

21 Why I like the 20 day! This is a very popular shorter term average I like to refer to this as the spine of recent market activity It does very well to establish levels to watch (especially when used in conjunction with the 50 day moving average) Why I like it! The 50 day is a bit smoother in its read Very popular with position traders because its not too sensitive Works very well as a compliment to the 20 day MA (we will go over this in greater detail shortly) (there are an average of 200 trading days in the year this would be ¼ of the year) 21
22 A longer term indicator used as a yardstick Well known amongst institutions and fund traders The price action garners a lot of attention when it approaches this moving average to see how it reacts, as it is not too common of an occurrence 22

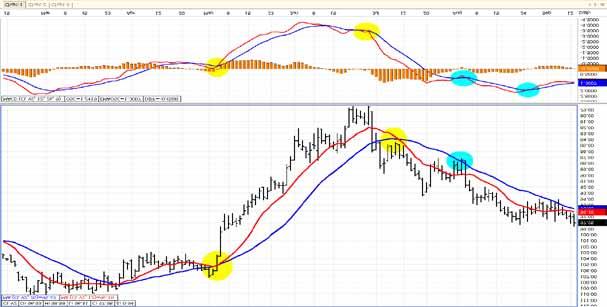
23 Monday morning quarterback You never have all of them on a chart at once but it is nice to look back and see how they interacted with each other after the fact to learn. OK, so you want to trade using the moving averages. Here is what you look for: a BUY SIGNAL is given when prices CLOSE ABOVE the MA a SELL SIGNAL is given when prices CLOSE BELOW the MA 23


24 a SELL SIGNAL is given when shorter term MA cross over longer term to the DOWNSIDE Example: 20 day crosses UNDER 50 day a BUY SIGNAL is given when shorter term MA cross over longer term to the UPSIDE Example: 20 day crosses OVER 50 day 24
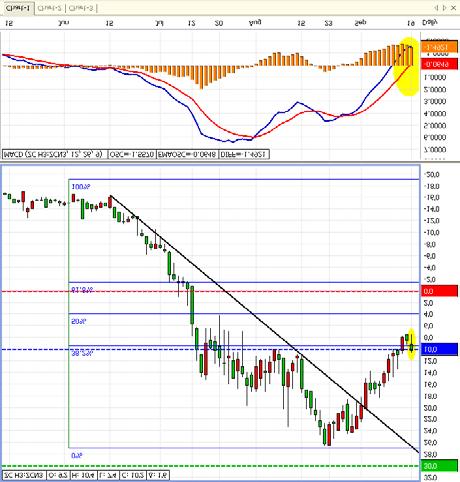
25 An oscillator is the simple difference between two Moving Averages. To calculate the Simple Oscillator, you first compute two Simple Moving Averages, then calculate the arithmetic difference. The oscillator can be used to help identify 2 key occurrences: 1) Divergences in short-term variations from the long-term trend 2) The crossing of two Moving Averages, which occur when the oscillator crosses the zero line. CONVERGENCE A situation where 2 indicators CONFIRM price movement by coming together at a certain price point. DIVERGENCE A situation where 2 indicators DO NOT CONFIRM price movement with each other. ***Divergence usually warns of upcoming price reversal*** 25
26 26

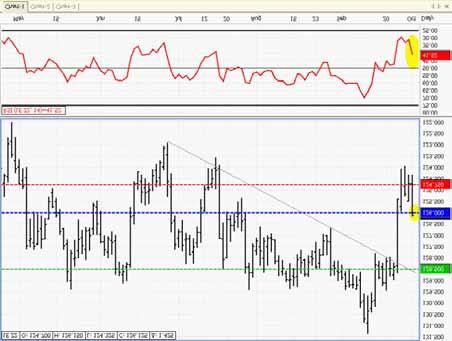
27 RSI is another popular oscillator type indicator It is plotted on a scale from 0 to 100 Values ABOVE 75 are considered OVERBOUGHT Values UNDER 25 are considered OVERSOLD This study is widely used to determine market reversals 27

28 The Stochastic is an oscillator type indicator that is used to help identify changes in momentum while identifying support and resistance levels. The purpose is to identify markets that are in overbought or oversold territories and trending for a reversal. During periods of price decreases, closing prices tend to accumulate near the lows of the trading range. During periods of price increases, closing prices tend to accumulate near the highs of the trading range. 28


29 The Slow Stochastic Indicator is best utilized in a trending market Sideways or range bound markets are not the optimum conditions with which to use this indicator It is plotted on a chart using a range of 0 to 100 When the Stochastic lines are above 80 it is considered overbought When the stochastic lines are below 20 it is considered oversold. The Slow Stochastic is an indication of a trend change It is an alert to bring to your attention a certain market set-up and possible trade. ***While it generally is an early indication, we believe it is of the upmost importance that this indicator be used in conjunction with other indicators, such as the MACD (moving average convergence divergence) and Moving Averages*** 29

30 A term used in technical analysis that refers to the likelihood that a financial asset's price will retrace a large portion of an original move and find support or resistance at the key Fibonacci levels before it continues in the original direction. These levels are created by drawing a trend-line between two extreme points and then dividing the vertical distance by the key Fibonacci ratios of 23.6%, 38.2%, 50%, 61.8% and 100%. 30
31 Fibonacci numbers: 1, 2, 3, 5, 8, 13, 21, 34, 55, 89, 144 Fibonacci is constructed by adding the first 2 numbers to arrive at the 3 rd : The ratio of any number to the next is roughly 62% 5 to 8 = 62.5% 8 to 13 = 61.5% 13 to 21 = 62% 21 to 34 = 61.8% 34 to 55 = 61.8% We identify the top of the range and the bottom of the range If we draw the Fibonacci from these levels we will see where the 38, 50 and 62 % levels are 31

32 You see the tremendous resistance at the 50% level as would be expected. But also important to note how the 38% level was both support and initial resistance throughout this snapshot of the market Looking ahead to a Market To Watch We see the massive rally, but we have begun to roll over here Lets put in the Fibonacci numbers from the low of 495 to the high of 850 as see what it looks like 32

33 50% will be the level You would expect a strong level of support at this price (Notice the gap the chart left at that EXACT level...technically speaking, charts will try to fill any and all gaps left behind) 33

34 The basic interpretation of Bollinger bands is that prices tend to stay within the upper and lower bands. The distinctive characteristic of Bollinger Bands is that the spacing between bands varies based on volatility. They widen during period of high volatility and narrow during stagnant pricing and low volatility. 34
Technical Analysis and Charting Part II Having an education is one thing, being educated is another.
 Chapter 7 Technical Analysis and Charting Part II Having an education is one thing, being educated is another. Technical analysis is a very broad topic in trading. There are many methods, indicators, and
INTERMEDIATE EDUCATION GUIDE
 INTERMEDIATE EDUCATION GUIDE CONTENTS Key Chart Patterns That Every Trader Needs To Know Continution Patterns Reversal Patterns Statistical Indicators Support And Resistance Fibonacci Retracement Moving
Technical Analysis. Dealing Room Peter Leonidou. Peter Leonidou
 Technical Analysis Dealing Room Questions Traders Should Ask What is the trend? What is the pivot point? What is the support levels? What is the resistance levels? Strong or weaker USD? What 1. Trade
PART 3 - CHART PATTERNS & TECHNICAL INDICATORS
 Tyler Chianelli s EASYOPTIONTRADING by OPTION TRADING COACH PART 3 - CHART PATTERNS & TECHNICAL INDICATORS A SIMPLE SYSTEM FOR TRADING OPTIONS WORKS IN UP, DOWN, AND SIDEWAYS MARKETS PART 3.1 - PRIMARY
OSCILLATORS. TradeSmart Education Center
 OSCILLATORS TradeSmart Education Center TABLE OF CONTENTS Oscillators Bollinger Bands... Commodity Channel Index.. Fast Stochastic... KST (Short term, Intermediate term, Long term) MACD... Momentum Relative
Compiled by Timon Rossolimos
 Compiled by Timon Rossolimos - 2 - The Seven Best Forex Indicators -All yours! Dear new Forex trader, Everything we do in life, we do for a reason. Why have you taken time out of your day to read this
Chapter 2.3. Technical Analysis: Technical Indicators
 Chapter 2.3 Technical Analysis: Technical Indicators 0 TECHNICAL ANALYSIS: TECHNICAL INDICATORS Charts always have a story to tell. However, from time to time those charts may be speaking a language you
Chapter 2.3. Technical Indicators
 1 Chapter 2.3 Technical Indicators 0 TECHNICAL ANALYSIS: TECHNICAL INDICATORS Charts always have a story to tell. However, sometimes those charts may be speaking a language you do not understand and you
1. Introduction 2. Chart Basics 3. Trend Lines 4. Indicators 5. Putting It All Together
 Technical Analysis: A Beginners Guide 1. Introduction 2. Chart Basics 3. Trend Lines 4. Indicators 5. Putting It All Together Disclaimer: Neither these presentations, nor anything on Twitter, Cryptoscores.org,
TECHNICAL INDICATORS
 TECHNICAL INDICATORS WHY USE INDICATORS? Technical analysis is concerned only with price Technical analysis is grounded in the use and analysis of graphs/charts Based on several key assumptions: Price
Introduction. Technicians (also known as quantitative analysts or chartists) usually look at price, volume and psychological indicators over time.
 usually look at price, volume and psychological indicators over time.") Technical Analysis Introduction Technical Analysis is the study of market action, primarily through the use of charts, for the purpose of forecasting future price trends. Technicians (also known as quantitative
Technical Analysis Introduction Technical Analysis is the study of market action, primarily through the use of charts, for the purpose of forecasting future price trends. Technicians (also known as quantitative
The six technical indicators for timing entry and exit in a short term trading program
 The six technical indicators for timing entry and exit in a short term trading program Definition Technical analysis includes the study of: Technical analysis the study of a stock s price and trends; volume;
Introduction. Technical analysis is the attempt to forecast stock prices on the basis of market-derived data.
 Technical Analysis Introduction Technical analysis is the attempt to forecast stock prices on the basis of market-derived data. Technicians (also known as quantitative analysts or chartists) usually look
Part 2: ASX charts - more charting tools. OHLC / Bar chart
 Part 2: ASX charts - more charting tools OHLC / Bar chart A bar chart simply takes the information from the day's trading and plots that information on a single vertical 'bar'. A tab on the left side of
Technical analysis & Charting The Foundation of technical analysis is the Chart.
 Technical analysis & Charting The Foundation of technical analysis is the Chart. Charts Mainly there are 2 types of charts 1. Line Chart 2. Candlestick Chart Line charts A chart shown below is the Line
BY JIM PRINCE
 No part of this publication may be reproduced, stored in a retrieval system, or transmitted in any form or by any means electronic, mechanical, photocopying, recording, or otherwise without the prior permission
The Schaff Trend Cycle
 The Schaff Trend Cycle by Brian Twomey This indicator can be used with great reliability to catch moves in the currency markets. Doug Schaff, president and founder of FX Strategy, created the Schaff trend
Williams Percent Range
 Williams Percent Range (Williams %R or %R) By Marcille Grapa www.surefiretradingchallenge.com RISK DISCLOSURE STATEMENT / DISCLAIMER AGREEMENT Trading any financial market involves risk. This report and
Forex Sentiment Report Q2 FORECAST WEAK AS LONG AS BELOW April
 Forex Sentiment Report 08 April 2015 www.ads-securities.com Q2 FORECAST WEAK AS LONG AS BELOW 1.1200 Targets on a break of 1.1534/35: 1.1740/50 1.1870/75 1.2230/35 Targets on a break of 1.0580/70: 1.0160
IVolatility.com E G A R O N E S e r v i c e
 IVolatility.com E G A R O N E S e r v i c e Stock Sentiment Service User Guide The Stock Sentiment service is a tool equally useful for both stock and options traders as it provides you stock trend analysis
Icoachtrader Consulting Service WELCOME TO. Trading Boot Camp. Day 5
 Icoachtrader Consulting Service www.icoachtrader.weebly.com WELCOME TO Trading Boot Camp Day 5 David Ha Ngo Trading Coach Phone: 1.650.899.1088 Email: icoachtrader@gmail.com The information presented is
.. /-!"::- '..- ( \.- - '-/../ '
 ....'-/ -!"::- ' ( \.-../ ' /- Triple Shot Forex Trading System The term "Day Trading" usually refers to the act of buying and selling a financial instrument within the same day. In the Forex market, a
MULTI-TIMEFRAME TREND TRADING
 1. SYNOPSIS The system described is a trend-following system on a slow timeframe that uses optimized (that is, contrarian) entries and exits on a fast timeframe at the tops and bottoms of retraces against
TDP-Academy Trading SetupGuide
 TDP-Academy Trading SetupGuide Version 1.1. March 2017 Author: Boris Nikolajew & Wiktor Majorkiewicz INDEX 1. Foreword 2. Charts 3. Timeframes 4. Indicators 5. Drawings 6. Chartpatterns 7. Analyzing the
FinQuiz Notes
 Reading 13 Technical analysis is a security analysis technique that involves forecasting the future direction of prices by studying past market data, primarily price and volume. Technical Analysis 2. TECHNICAL
The Technical Edge Page 1. The Technical Edge. Part 1. Indicator types: price, volume, and moving averages and momentum
 The Technical Edge Page 1 The Technical Edge INDICATORS Technical analysis relies on the study of a range of indicators. These come in many specific types, based on calculations or price patterns. For
FOREX INDICATORS. THEIR PRIORITY and USE
 FOREX INDICATORS THEIR PRIORITY and USE by G. C. Smith U.S. Government Required Disclaimer Trading foreign exchange markets on margin carries a high level of risk, and may not be suitable for all investors.
Real-time Analytics Methodology
 New High/Low New High/Low alerts are generated once daily when a stock hits a new 13 Week, 26 Week or 52 Week High/Low. Each second of the trading day, the stock price is compared to its previous 13 Week,
Fast Track Stochastic:
 Fast Track Stochastic: For discussion, the nuts and bolts of trading the Stochastic Indicator in any market and any timeframe are presented herein at the request of Beth Shapiro, organizer of the Day Traders
Trend Channels: How to Identify Easy Profit-Making Opportunities Using Simple Chart Analysis
 Trend Channels: How to Identify Easy Profit-Making Opportunities Using Simple Chart Analysis Trend channels produce a very powerful trading technique. They are very visible, which makes them easy to utilize
Technical Analysis Indicators
 Technical Analysis Indicators William s Percent R Rules, Scans, Adding Filters, Breakout, Retest, and Application across MTFs Course Instructor: Price Headley, CFA, CMT BigTrends Coaching Access to BigTrends
Relative Strength Index (RSI) by Ty Young
 by Ty Young") Relative Strength Index (RSI) by www.surefire-trading.com Ty Young Hi, this is Ty Young with Surefire-trading.com and today I will be discussing the Relative Strength Index (RSI). History J. Welles Wilder,
Relative Strength Index (RSI) by www.surefire-trading.com Ty Young Hi, this is Ty Young with Surefire-trading.com and today I will be discussing the Relative Strength Index (RSI). History J. Welles Wilder,
Applying fundamental & technical analysis in stock investing
 Applying fundamental & technical analysis in stock investing 2017 Live demonstration of research and trading tools Develop an Ongoing Strategy with Fidelity Software and mobile apps to enhance your trading
GUIDE TO STOCK trading tools
 P age 1 GUIDE TO STOCK trading tools VI. TECHNICAL INDICATORS AND OSCILLATORS I. Introduction to Indicators and Oscillators Technical indicators, to start, are data points derived from a specific formula.
Technical Analysis Workshop Series. Session 11 Semester 2 Week 5 Oscillators Part 2
 Technical Analysis Workshop Series Session 11 Semester 2 Week 5 Oscillators Part 2 DISCLOSURES & DISCLAIMERS This research material has been prepared by NUS Invest. NUS Invest specifically prohibits the
Test Your Chapter 1 Knowledge
 Self-Test Answers Test Your Chapter 1 Knowledge 1. Which is the preferred chart type in LOCKIT? The preferred chart type in LOCKIT is the candle chart because candle patterns are part of the decision-making
IMV Commodity: Agro Technical Update
 IMV Commodity: Agro Technical Update From Research Desk In July future: Soya bean Rmseed Castor seed Guar seed Jeera Dhaniya Turmeric (Follow-up update) Cotton Seed Oil Cotton IMV Commodity Research Desk
Bollinger Trading Methods. Play 1 - The Squeeze
 Overview: Play 1 - The Squeeze Play 2 - The Trend Trade Play 3 - Reversals Wrap up Bollinger Trading Methods Play 1 - The Squeeze The Squeeze The most popular strategy Looks to enter a trend early on Anticipates
 1 www.candlecharts.com 2 BONUS www. candlecharts.com/special/swing-trading-2/ 3 www. candlecharts.com/special/swing-trading-2/ 4 www. candlecharts.com/special/swing-trading-2/ 5 www. candlecharts.com/special/swing-trading-2/
Go No Go Indicators: Part 2
 Go No Go Indicators: Part 2 March 22, 2017 Dennis W. Wilborn Active Trend Trading Disclaimer U.S. Government Required Disclaimer Commodity Futures Trading Commission Futures and Options trading has large
Moving Average Convergence Divergence (MACD) by
 by") Moving Average Convergence Divergence (MACD) by www.surefire-trading.com Ty Young Hi, this is Ty Young with Surefiretrading.com and today we will be discussing the Moving Average Convergence/Divergence
Moving Average Convergence Divergence (MACD) by www.surefire-trading.com Ty Young Hi, this is Ty Young with Surefiretrading.com and today we will be discussing the Moving Average Convergence/Divergence
TD AMERITRADE Technical Analysis Night School Week 2
 TD AMERITRADE Technical Analysis Night School Week 2 Hosted By Derek Moore Director, National Education For the audio portion of today s webcast, please enable your computer speakers. Past performance
The goal for Part One is to develop a common language that you and I
 PART ONE Basic Training The goal for Part One is to develop a common language that you and I can use. The rest of the book will discuss how the technical indicators highlighted in the first two chapters
Technical Indicators versiunea
 Technical Indicators versiunea 2.0 03.10.2008 Contents 1 Price... 1 2 Charts... 1 2.1 Line, Step, Scatter, Histogram/Mountain charts 1 2.2 Open/High/Low/Close charts (Bar Charts)... 2 2.3 Candle charts...
Trading the Hidden Divergence. Presented by Sunil Mangwani
 Trading the Hidden Divergence Indicators in technical analysis. Indicators along with chart patterns, trend lines, resistance / support levels etc., are an essential part of technical analysis. But there
Schwab Investing Insights Trading Edition Text Close Window Size: November 15, 2007
 Schwab Investing Insights Trading Edition Text Close Window Size: from TheStreet.com November 15, 2007 ON TECHNIQUES Two Indicators Are Better Than One The Relative Strength Index works well but it s better
BONUS. www. candlecharts.com/special/swing-trading-2/
 BONUS www. candlecharts.com/special/swing-trading-2/ 1 www. candlecharts.com/special/swing-trading-2/ www. candlecharts.com/special/swing-trading-2/ www. candlecharts.com/special/swing-trading-2/ 2 www.
charts to also be in the overbought area before taking the trade. If I took the trade right away, you can see on the M1 chart stochastics that the
 When you get the signal, you first want to pull up the chart for that pair and time frame of the signal in the Web Analyzer. First, I check to see if the candles are near the outer edge of the Bollinger
Morning Trading Comments
 Friday, June 15, 2018 1 Morning Trading Comments SUMMARY OF TRADING VIEWS For the first time since a long time, European indices were able to rally without the USA. Very strong day for DAX, CAC and Euro
Technical Analysis Workshop Series. Session Ten Semester 2 Week 4 Oscillators Part 1
 Technical Analysis Workshop Series Session Ten Semester 2 Week 4 Oscillators Part 1 DISCLOSURES & DISCLAIMERS This research material has been prepared by NUS Invest. NUS Invest specifically prohibits the
Forex Range Trading With Price Action Forex Trading System By Laurentiu Damir
 Forex Range Trading With Price Action Forex Trading System By Laurentiu Damir Copyright 2012 by Laurentiu Damir All rights reserved. No part of this book may be reproduced or transmitted in any form or
Technical Indicators
 Taken From: Technical Analysis of the Financial Markets A Comprehensive Guide to Trading Methods & Applications John Murphy, New York Institute of Finance, Published 1999 Technical Indicators Technical
Trade Ideas A.I. Strategy Descriptions Revised : 10/04/2017
 Trade Ideas A.I. Strategy Descriptions Revised : 10/04/2017 The 5 Day Bounce The trigger for this alert has to cross above resistance while also making a 60 minute high on stocks that are trying to bounce
AUTHOR: NG EE HWA, TRAINER, CHARTNEXUS TRADING WITH RSI
 AUTHOR: NG EE HWA, TRAINER, CHARTNEXUS TRADING WITH RSI While the use of Relative Strength Index (RSI) to get technical buy and sell signals in a range-bound market is well understood, the use of this
Charting Glossary. September 2008 Version 1
 Charting Glossary September 2008 Version 1 i Contents 1 Price... 1 2 Charts... 1 2.1 Line, Step, Scatter, Histogram/Mountain charts...1 2.2 Open/High/Low/Close charts (Bar Charts)...1 2.3 Candle charts...2
Introduction to Technical Analysis
 Introduction to Technical Analysis All About Chart Patterns, Candlesticks and Technical Studies rjofutures.rjobrien.com 800-441-1616 A division of R.J. O Brien Important Information About Trading Futures
Stocks & Commodities V. 11:9 ( ): Trading Options With Bollinger Bands And The Dual Cci by D.W. Davies
: Trading Options With Bollinger Bands And The Dual Cci by D.W. Davies") Trading Options With Bollinger Bands And The Dual CCI by D.W. Davies Combining two classic indicators, the commodity channel index (CCI) and Bollinger bands, can be a potent timing tool for options trading.
Trading Options With Bollinger Bands And The Dual CCI by D.W. Davies Combining two classic indicators, the commodity channel index (CCI) and Bollinger bands, can be a potent timing tool for options trading.
Subject: Daily report explanatory notes, page 2 Version: 0.9 Date: Dec 29, 2013 Author: Ken Long
 Subject: Daily report explanatory notes, page 2 Version: 0.9 Date: Dec 29, 2013 Author: Ken Long Description Example from Dec 23, 2013 1. Market Classification: o Shows market condition in one of 9 conditions,
Our aim at S.T.I. is to make Technical Analysis as simple and uncomplicated as possible.
 By MPFX Our aim at S.T.I. is to make Technical Analysis as simple and uncomplicated as possible. We will try to explain the concepts of each indicator in Plain English and include examples where possible.
What is Technical Analysis
 Reg. office: International School of Financial Market, Plot no. 152 - P (LGF), Sec - 38, Medicity Road, Gurgaon - 122002 Contact no. : 0124-2200689,+919540008689, 9654446629 Web : www.isfm.co.in, Email
Advanced Trading Systems Collection MACD DIVERGENCE FOREX TRADING SYSTEM
 MACD DIVERGENCE FOREX TRADING SYSTEM 1 This system will cover the MACD divergence. With this forex trading system you can trade any currency pair (I suggest EUR/USD and GBD/USD when you start), and you
Stay on the Right Side & Finishing the Year Strong! From the Active Trend Trader
 Stay on the Right Side & Finishing the Year Strong! From the Active Trend Trader Disclaimer U.S. GOVERNMENT REQUIRED DISCLAIMER COMMODITY FUTURES TRADING COMMISSION FUTURES AND OPTIONS TRADING HAS LARGE
Technical Analysis for Options Trading. Fidelity Brokerage Services LLC, Member NYSE, SIPC, 900 Salem Street, Smithfield, RI
 Technical Analysis for Options Trading Fidelity Brokerage Services LLC, Member NYSE, SIPC, 900 Salem Street, Smithfield, RI 02917 747561.2.0 Disclosures Options trading entails significant risk and is
Morning Trading Comments
 Wednesday, June 13, 2018 1 Morning Trading Comments SUMMARY OF TRADING VIEWS The S&P 500 index is now close to the 2800 area, a potential important resistance zone. It will be interesting to see how this
Applying fundamental & technical analysis in stock investing
 Applying fundamental & technical analysis in stock investing Today s Agenda Fundamental Analysis Topics include a basic overview, a discussion on ways to use it, and hands on tool demonstrations Trading
IVGraph Live Service Contents
 IVGraph Live Service Contents Introduction... 2 Getting Started... 2 User Interface... 3 Main menu... 3 Toolbar... 4 Application settings... 5 Working with layouts... 5 Working with tabs and viewports...
Notices and Disclaimer
 Part 2 March 14, 2013 Saul Seinberg Notices and Disclaimer } This is a copyrighted presentation. It may not be copied or used in whole or in part for any purpose without prior written consent from the
CHAMELEON INDICATORS. A new way to view the markets. Alex Cole 05/10/17
 CHAMELEON INDICATORS A new way to view the markets. Alex Cole 05/10/17 THE CHAMELEON TREND AND CHAMELEON OSCILLATOR STUDIES One of the most important benefits of visualization is that it allows us visual
Level I Learning Objectives by chapter
 Level I Learning Objectives by chapter 1. Introduction to the Evolution of Technical Analysis Describe the development of modern technical analysis Describe the origins of technical analysis 2. A New Age
With that, let s dive into the steps. Step 1 Identify range bound markets on Daily or 4 Hour Charts
 If you have been trading for any length of time, you have probably noticed that the markets are moving sideways A LOT. Consolidation is a huge part of the market s balance and so it makes sense to learn
Trading With Time Fractals to Reduce Risk and Improve Profit Potential
 June 16, 1998 Trading With Time Fractals to Reduce Risk and Improve Profit Potential A special Report by Walter Bressert Time and price cycles in the futures markets and stocks exhibit patterns in time
Martin Pring s. Weekly InfoMovie Report. April 12, 2012
 Martin Pring s Weekly InfoMovie Report April 12, 2012 Issue 993 Weekly InfoMovie Report 1 Bearish US Equity Market - Last week I pointed out that this up trendline for the diffusion indicator monitoring
S&P 500 Update: Week ending May 11th 2018
 S&P 500 Update: Week ending May 11th 2018 1. Market Recap: The S&P 500 closed higher by 2.2% for week and broke out of some key resistance areas and a short term downtrend. There are 4 topics now setting
Chapter 3. Price Action
 Chapter 3 Price Action The movement of price in any market is called Price Action. This movement is caused by the beliefs and trading systems of hundreds of thousands of worldwide traders that the market
Three Techniques for Spotting Market Twists and Turns. Riding the Roller
 Three Techniques for Spotting Market Twists and Turns Riding the Roller Coaster Learn to Spot the Twists and Turns Whether you re new to forex or you ve been trading a while, you know how the unexpected
The Fish Hook Pattern
 The Fish Hook Pattern GOAL The Fish Hook Pattern is a trade entry method that is mentioned from time to time in Jim s Chartbook and on the Premium Alert Service. The idea behind the Fish Hook is that it
Martin J. Pring President of Pring.com
 Martin J. Pring President of Pring.com How to Manage Risk Using Technical Analysis The first trading objective is to preserve capital #1 Trading rule Cut losses quickly, let profits run. First trade 50%
Technical Indicators that Really Work
 Technical Indicators that Really Work TECHNICAL INDICATORS Technical indicators have become more important than Fundamentals. With the proper use of technical indicators investors are able to determine
Cycle Turn Indicator Direction and Swing Summary. of Select Markets as of the close on. April 10, 2018
 Cycle Turn Indicator Direction and Swing Summary of Select Markets as of the close on April 10, 2018 Market Daily CTI Daily Swing Weekly CTI Weekly Swing Industrial Positive Low Negative High Transports
Using Oscillators & Indicators Properly May 7, Clarify, Simplify & Multiply
 Using Oscillators & Indicators Properly May 7, 2016 Clarify, Simplify & Multiply Disclaimer U.S. Government Required Disclaimer Commodity Futures Trading Commission Futures and Options trading has large
Understanding Oscillators & Indicators March 4, Clarify, Simplify & Multiply
 Understanding Oscillators & Indicators March 4, 2015 Clarify, Simplify & Multiply Disclaimer U.S. Government Required Disclaimer Commodity Futures Trading Commission Futures and Options trading has large
Lecture 14. Trading Systems
 Lecture 14 Trading Systems In the previous lectures we got acquainted with the technique of deal execution and technical analysis methods, and considered the major indexes which fundamental analysis is
Intra-Day Trading Techniques
 Pristine.com Presents Intra-Day Trading Techniques With Greg Capra Co-Founder of Pristine.com, and Co-Author of the best selling book, Tools and Tactics for the Master Day Trader Copyright 2001, Pristine
Learning Objectives CMT Level I
 Learning Objectives CMT Level I - 2018 An Introduction to Technical Analysis Section I: Chart Development and Analysis Chapter 1 The Basic Principle of Technical Analysis - The Trend Define what is meant
THE CYCLE TRADING PATTERN MANUAL
 TIMING IS EVERYTHING And the use of time cycles can greatly improve the accuracy and success of your trading and/or system. THE CYCLE TRADING PATTERN MANUAL By Walter Bressert There is no magic oscillator
Martin Pring s. Weekly InfoMovie Report. December 27, Happy New Year to Our Wonderful Subcriber Family! May 2013 be Prosperous and Productive!
 Martin Pring s Weekly InfoMovie Report December 27, 2012 Issue 1028 Happy New Year to Our Wonderful Subcriber Family! May 2013 be Prosperous and Productive! The Pring Family ~ 2012 Weekly InfoMovie Report
 Types of charts Bar charts Candlestick charts Constant volume charts Line charts Tflow charts, exclusively CQG Bar Charts Vertical line representing the high and low of the sessions Horizontal line on
Introduction. Leading and Lagging Indicators
 1/12/2013 Introduction to Technical Indicators By Stephen, Research Analyst NUS Students Investment Society NATIONAL UNIVERSITY OF SINGAPORE Introduction Technical analysis comprises two main categories:
Walter Bressert, Inc.
 Walter Bressert, Inc. http://www.walterbressert.com mailto:info@walterbressert.com Copyright Walter Bressert, Inc. All rights reserved. 1 PROFITTRADER for METASTOCK END-OF-DAY AND INTRA VERSIONS The EOD
BUY SELL PRO. Improve Profitability & Reduce Risk with BUY SELL Pro. Ultimate BUY SELL Indicator for All Time Frames
 BUY SELL PRO Improve Profitability & Reduce Risk with BUY SELL Pro Ultimate BUY SELL Indicator for All Time Frames Risk Disclosure DISCLAIMER: Crypto, futures, stocks and options trading involves substantial
Morning Trading Comments
 Monday, June 18, 2018 1 Morning Trading Comments SUMMARY OF TRADING VIEWS Technical breakdowns seen on a lot of commodities at the end of last week, combined with further weakness in emerging markets,
Cycle Turn Indicator Direction and Swing Summary. of Select Markets as of the close on. December 21, Daily CTI. Swing
 Cycle Turn Indicator Direction and Swing Summary of Select Markets as of the close on December 21, 2018 Market Daily CTI Daily Swing Weekly CTI Weekly Swing Industrial Negative High Negative High Transports
JOURNAL INTRODUCING THE HPO ROBERT KRAUSZ'S. Volume 2, Issue 2. ear Trader,
 ROBERT KRAUSZ'S JOURNAL INTRODUCING THE HPO TM ear Trader, D First, I would like to introduce myself. My name is Thom Hartle (www.thomhartle.com) and I have put together this latest issue of the FT Journal.
How I Trade Profitably Every Single Month without Fail
 How I Trade Profitably Every Single Month without Fail First of all, let me take some time to introduce myself to you. I am Koon Hwee (KH Lee) and I am a full time currency trader. I have a passion for
CMT LEVEL I CURRICULUM Self-Evaluation
 CMT LEVEL I CURRICULUM Self-Evaluation DEAR CFA CHARTERHOLDER, As a CFA charterholder, the requirement that you sit for the CMT Level I exam is waived. However, the content in the CMT Level I Curriculum
FIND THE SLAM DUNKS: COMBINE VSA WITH TECHNICAL ANALYSIS
 FIND THE SLAM DUNKS: COMBINE VSA WITH TECHNICAL ANALYSIS November 2006 By Todd Krueger In any competitive sports game there must be a specific set of boundaries for the game to make any sense. This actually
Intermediate - Trading Analysis
 Intermediate - Trading Analysis Technical Analysis Technical analysis is the attempt to forecast currencies prices on the basis of market-derived data. Technicians (also known as quantitative analysts
DAILY DAY TRADING PLAN
 DAILY DAY TRADING PLAN Gatherplace will be used to place all of your trades. You will be using the 5 minute chart for the trade setup and the 1 minute chart for your entry, stop and trailing stop.you will
Bulkowski s Trading Quiz
 Bulkowski s Trading Quiz What chart patterns can you find? A hint appears below and answers on the next page. Hint. Look for the following chart patterns (If you find others, great!): Big M, 2 double tops,
EZ Trade FOREX Day Trading System. by Beau Diamond
 EZ Trade FOREX Day Trading System by Beau Diamond The EZ Trade FOREX Day Trading System is mainly used with four different currency pairs; the EUR/USD, USD/CHF, GBP/USD and AUD/USD, but some trades are