Divergence and Momentum Trading
|
|
|
- Avice Cummings
- 6 years ago
- Views:
Transcription


1 presented by Thomas Wood MicroQuant SM Divergence Trading Workshop Day One Divergence and Momentum Trading
2 Risk Disclaimer Trading or investing carries a high level of risk, and is not suitable for all persons. Before deciding to trade or invest you should carefully consider your investment objectives, level of experience, and ability to tolerate risk. This content is subject to change at any time without notice, and is provided for the sole purpose of education and assistance in making independent investment decisions. ValueCharts.com has taken reasonable measures to ensure the accuracy of the information contained herein; however, ValueCharts.com does not guarantee its accuracy and is not liable for any loss or damage which may result directly or indirectly from such content or from an inability to access such information or any delay in or failure of the transmission or the receipt of any instruction or notification in connection therewith. Any past performance results are shown for illustration and example only, are hypothetical and as such have many inherent limitations. No representation is being made that any account will or is likely to achieve profits or losses similar to those shown. Past performance is not necessarily indicative of future results.
3 CFTC Rule 4.41 (Hypothetical Disclaimer) U.S. Government Required Disclaimer - Commodity Futures Trading Commission Futures and Options trading has large potential rewards, but also large potential risk. You must be aware of the risks and be willing to accept them in order to invest in the futures and options markets. Don't trade with money you can't afford to lose. This is neither a solicitation nor an offer to Buy/Sell futures, stocks or options on the same. No representation is being made that any account will or is likely to achieve profits or losses similar to those discussed on this web site. The past performance of any trading system or methodology is not necessarily indicative of future results. CFTC RULE HYPOTHETICAL OR SIMULATED PERFORMANCE RESULTS HAVE CERTAIN LIMITATIONS. UNLIKE AN ACTUAL PERFORMANCE RECORD, SIMULATED RESULTS DO NOT REPRESENT ACTUAL TRADING. ALSO, SINCE THE TRADES HAVE NOT BEEN EXECUTED, THE RESULTS MAY HAVE UNDER-OR- OVER COMPENSATED FOR THE IMPACT, IF ANY, OF CERTAIN MARKET FACTORS, SUCH AS LACK OF LIQUIDITY. SIMULATED TRADING PROGRAMS IN GENERAL ARE ALSO SUBJECT TO THE FACT THAT THEY ARE DESIGNED WITH THE BENEFIT OF HINDSIGHT. NO REPRESENTATION IS BEING MADE THAT ANY ACCOUNT WILL OR IS LIKELY TO ACHIEVE PROFIT OR LOSSES SIMILAR TO THOSE SHOWN. NO REPRESENTATION IS BEING MADE THAT ANY ACCOUNT WILL, OR IS LIKELY TO ACHIEVE PROFITS OR LOSSES SIMILAR TO THOSE DISCUSSED WITHIN THIS SITE, SUPPORT AND TEXTS. OUR COURSE(S), PRODUCTS AND SERVICES SHOULD BE USED AS LEARNING AIDS ONLY AND SHOULD NOT BE USED TO INVEST REAL MONEY. IF YOU DECIDE TO INVEST REAL MONEY, ALL TRADING DECISIONS SHOULD BE YOUR OWN.
4 Workshop Outline Psychology of Trading Getting Your Mind Right Reading Overall Market Momentum Using MQ Momentum and MACD Intro to Divergences The Four Types of Divergences and What Has the Best Probability of Success How to Enter Divergences to Maximize Success Understanding a Trend Reversal vs. Consolidation Momentum Based Trade Setups
5 Psychology of Trading Getting Your Mind Right
6 Psychology of Trading Lack of Trading Awareness Why Are You Losing When Trading? Not Treating Your Trading Account Objectively Risk Averse with Winning Trades, Risk Seeking on Losing Trades Becoming Emotional About Wins and Losses Fear of Losing Becoming Addicted to the Anticipation of Success The Desire/Need to Be Right on Your Trade Lack of Consistency Never Sticking to a System
7 Psychology of Trading Overconfidence leads to too much risk, which leads to loosening up rules, leads to not following plan, leads to greed, which leads to losing money. Greed leads to denial, dismissing losses and a I ll make that back on the next one attitude Denial leads to Revenge/Catch up trading, which leads to a lack of confidence in yourself and your system, which leads to more aggressive trading to make up for losses. EVERY TRADE SHOULD STAND ON IT S OWN!
8 Psychology of Trading Not Treating Your Trading Account Objectively Risk Averse with Winning Trades, Risk Seeking on Losing Trades You take 100% of your losers (Market Hits Stop) but you only take a piece of your winners (Scared it is going to move against you) Know how far you are expecting a market to move. Once you know how far a market should move, you should know when a market is just making noise and when it is potentially reversing. People go from being very successful trading simulated, to losing money live and they cannot figure out why. Emotions, or not trading objectively, is normally the cause.
9 Psychology of Trading Fear of Losing and the Desire to be Right You need to understand that no trading plan is right 100% of the time. Once you accept this as fact, you can move on to treating your strategy as probabilities. We all want to be correct with our analysis, but one of the biggest things that cause failure is traders not admitting when they are wrong. Go back and look at all historical signals you can find for a specific strategy, how did the really good ones work out? Most will have moved immediately.
10 Psychology of Trading Allowing Emotions to Come Into Your Trading Becoming Addicted to Dopamine Studies show that almost winning causes more dopamine to be released than winning does, over time* Are you subconsciously addicted to almost winning? This is why casinos make so much money even though people normally lose. Never worry about I could have made this! Each trade should be taken on its own credibility *
11 Psychology of Trading Lack of Trading Awareness Create a Trading Plan Should include: Markets Traded, Position Sizing, Entry Logic, Exit Logic, Stop Placement Keep a Trade Log: Should have a record of why a trade was placed (what setup), when you entered, where you stop was, time of day you entered and time of day you exited.
12 Psychology of Trading Not Having Discipline and Consistency One thing that causes traders to fail is lack of discipline and not sticking to a system. They create a trading plan, then change it a week later because it did not make money. All trading plans are going to have periods of drawdown. Once you understand that nothing works 100% of the time, it is easier to stick to a strategy for a long period of time.
13 Questions on Psychology of Trading?
14 Reading Market Momentum with MQ Momentum and MACD
15 Reading Market Momentum The MQ Momentum and MACD indicator are designed very similarly, although the algorithms are completely different They both have a fast line and a slow line as well as a histogram The histogram displays the spread between the fast and slow indicator lines When you are reading momentum, you are watching the fast line and the histogram equally The slow line can be used to confirm, but is not always needed
16 Reading Market Momentum When you are looking for overall market direction, watch for the trend of the fast line on the indicator. Then look at the histogram levels and see the strength of the counter trend moves Of you are putting in lower highs lower lows on the indicator line, then momentum is weak If you are putting in higher high higher lows on the indicator line, then momentum is strong
17 Reading Market Momentum If momentum is bullish, watch for the down histogram sections are those lows lower than the previous lows? If not, then momentum is still bullish If momentum is bearish, watch for the up histogram sections are these highs higher than the previous highs? If not, then momentum is still bearish

18 Reading Market Momentum Normally I will look for a previous swing high or swing low to place my stop above/below If the previous swing high on your time based chart is too far away, find one on a shorter timeframe that is closer This previous high/low is a resistance level that the market would have to break through to hit your stop

19 Reading Market Momentum Normally I will look for a previous swing high or swing low to place my stop above/below If the previous swing high on your time based chart is too far away, find one on a shorter timeframe that is closer This previous high/low is a resistance level that the market would have to break through to hit your stop
20 Reading Market Momentum Normally I will look for a previous swing high or swing low to place my stop above/below If the previous swing high on your time based chart is too far away, find one on a shorter timeframe that is closer This previous high/low is a resistance level that the market would have to break through to hit your stop


21 Reading Market Momentum Normally I will look for a previous swing high or swing low to place my stop above/below If the previous swing high on your time based chart is too far away, find one on a shorter timeframe that is closer This previous high/low is a resistance level that the market would have to break through to hit your stop
22 Questions on Reading Market Momentum?
23 Intro to Divergences What is a Divergence?
24 Intro to Divergences Divergences are used for a number of different trading strategies. Used to identify and enter tops or bottoms of markets Used to know when to close an open position Used to know when markets are entering consolidation Used to confirm a breakout trade Confirming tool for double tops/double bottoms
25 Intro to Divergences Divergences occur on all market types (FOREX, Futures, Equities) Divergences can be used on any timeframe
26 Intro to Divergences A Divergence occurs when the price and indicator are no longer correlated (moving with each other) Price continues to equally high/low prices while indicator weakens There can be both bullish and bearish divergences Bullish divergence occurs when prices are equal to, or go lower than, previous price lows while indicator goes higher Bearish divergence occurs when prices are equal to, or go higher than, previous price highs while indicator goes lower
27 Intro to Divergences What is a divergence telling us? Just because you have a divergence, it does not mean that the market is going to reverse trend Divergences show us when a market is trying to push to new highs or lows, without the momentum the original move had When a divergence occurs, we are essentially seeing the last hoorah that a market makes before taking a breather or reversing
28 Intro to Divergences What indicators can you use to see divergences? You can use most momentum oscillators. My favorite are MQ Momentum and MACD. You can use ValueCharts for value divergences You can use stochastics for divergences

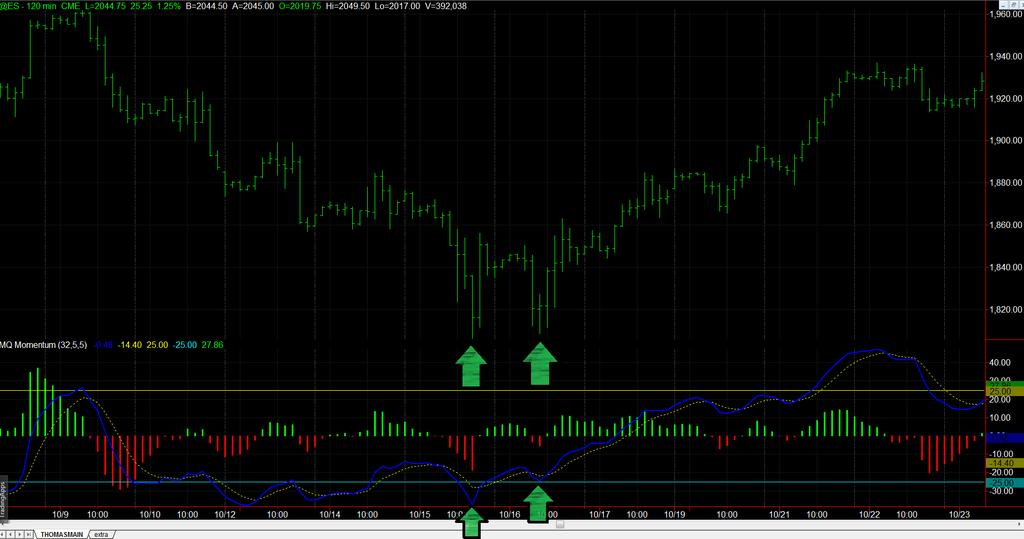
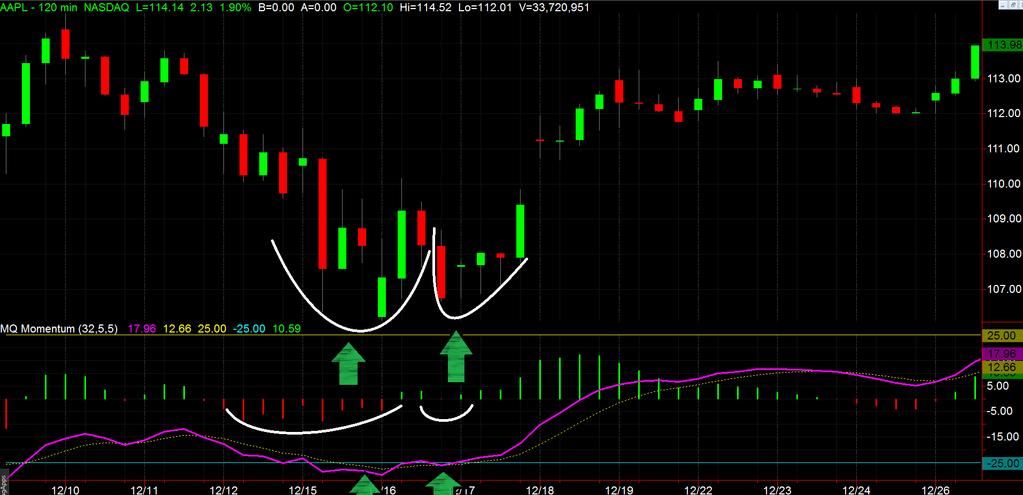
29 Example of a Bullish Divergence
30 Example of a Bearish Divergence

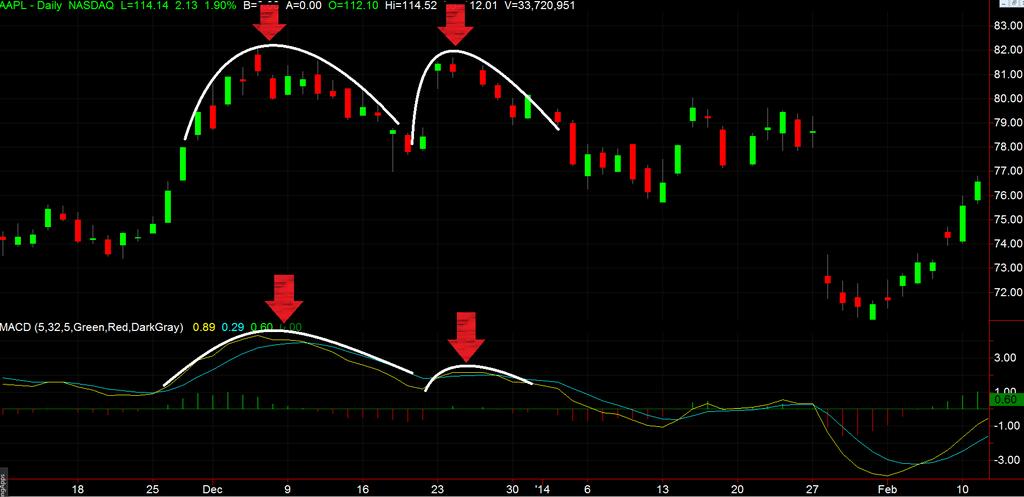
31 Example of a Bearish Divergence
32 Questions on Intro to Divergences?
33 The Four Types of Divergences and What Has the Highest Probability of Success
34 Four Types of Divergences There are four major types of divergences that we trade Each type of divergence has both advantages and disadvantages Some types of divergences give a higher success rate than others
35 Four Types of Divergences Histogram Divergence Connected Divergence Broken Divergence No Return Divergence
36 Four Types of Divergences Histogram Divergence Divergence Where Histogram alone is weaker or stronger A Histogram Divergence has the lowest probability of success, but occurs quite often The indicator line does not agree with the divergence for a histogram divergence Normally does not signify a trend reversal, but a consolidation period

37 Four Types of Divergences A Pennant Pattern is formed when the range of a market becomes narrower and narrower You trade the breakout of a pennant the same way you would a consolidation breakout. The Trender should confirm the move within 2-3 price bars
38 Four Types of Divergences A Pennant Pattern is formed when the range of a market becomes narrower and narrower You trade the breakout of a pennant the same way you would a consolidation breakout. The Trender should confirm the move within 2-3 price bars


39 Four Types of Divergences A Pennant Pattern is formed when the range of a market becomes narrower and narrower You trade the breakout of a pennant the same way you would a consolidation breakout. The Trender should confirm the move within 2-3 price bars
40 Four Types of Divergences A Connected Divergence occurs when you have two waves on your histogram where the second is stronger or weaker than the first. Connected Divergences normally do not signify trend reversal Connected Divergences are better if the indicator line is also in agreement with the histogram The problem with this type of divergence is the market can have several one after the other before actually bouncing

41 Four Types of Divergences A Pennant Pattern is formed when the range of a market becomes narrower and narrower You trade the breakout of a pennant the same way you would a consolidation breakout. The Trender should confirm the move within 2-3 price bars

42 Four Types of Divergences A Pennant Pattern is formed when the range of a market becomes narrower and narrower You trade the breakout of a pennant the same way you would a consolidation breakout. The Trender should confirm the move within 2-3 price bars

43 Four Types of Divergences A Pennant Pattern is formed when the range of a market becomes narrower and narrower You trade the breakout of a pennant the same way you would a consolidation breakout. The Trender should confirm the move within 2-3 price bars
44 Four Types of Divergences A Broken Divergence has the histogram bars going from green red green, or red green red, with the second bounce being weaker/stronger than the first This type of divergence has a fairly high probability of success Many times this will cause a decent retracement against trend, or a trend reversal
45 Four Types of Divergences You want both the indicator line and the histogram to be showing the divergence. This will improve probabilities and make you slightly more selective with your trading Market should only have around 1-5 histogram bars on the second rally, the best ones will only have 1-3

46 Four Types of Divergences A Pennant Pattern is formed when the range of a market becomes narrower and narrower You trade the breakout of a pennant the same way you would a consolidation breakout. The Trender should confirm the move within 2-3 price bars
47 Four Types of Divergences A Pennant Pattern is formed when the range of a market becomes narrower and narrower You trade the breakout of a pennant the same way you would a consolidation breakout. The Trender should confirm the move within 2-3 price bars


48 Four Types of Divergences A Pennant Pattern is formed when the range of a market becomes narrower and narrower You trade the breakout of a pennant the same way you would a consolidation breakout. The Trender should confirm the move within 2-3 price bars
49 Four Types of Divergences A No Return Divergence is one of the highest probability divergences. It shows that the second bounce lost so much momentum, it could not cause the histogram bars to get back into upside/downside momentum It is essentially a broken divergence but instead of going red-green-red, the histogram goes red-green.
50 Four Types of Divergences If you do not have the ValueCharts/ValueBars indicator, you are delayed in knowing when the no return divergence is occurring If a market goes green red overvalued (while still red) then you have a no return bearish divergence If you do not have ValueBars/ValueCharts, watch for the second rally to almost reach previous highs, then break the previous bars low

51 Four Types of Divergences A Pennant Pattern is formed when the range of a market becomes narrower and narrower You trade the breakout of a pennant the same way you would a consolidation breakout. The Trender should confirm the move within 2-3 price bars

52 Four Types of Divergences A Pennant Pattern is formed when the range of a market becomes narrower and narrower You trade the breakout of a pennant the same way you would a consolidation breakout. The Trender should confirm the move within 2-3 price bars

53 Four Types of Divergences A Pennant Pattern is formed when the range of a market becomes narrower and narrower You trade the breakout of a pennant the same way you would a consolidation breakout. The Trender should confirm the move within 2-3 price bars
54 Questions on The Five Types of Divergences?
55 How to Enter Divergences to Maximize Success
56 How to Enter Divergences There are several ways to enter a divergence. Drill down entries are always going to be the best way to enter An example of drilldown is finding a bearish divergence on a daily chart. Then entering the trade based on a 30 minute chart You can use any timeframe to drilldown to, the smaller the timeframe the smaller the risk. However, the lower the timeframe the more false signals you will receive
57 How to Enter Divergences When entering a trade, never trade the wrong side of the mountain. Meaning, wait for it to start moving your direction. Never sell on an up bar or buy on a down bar If you are going short, wait for the break of the previous 1-2 bars lows (on your drilldown timeframe) or, if you are going long, wait for the break of the previous 1-2 bars highs before you enter
58 How to Enter Divergences If you are selling short on the break of the previous bars low (on your drilldown timeframe) then your stop is placed above the drilldown swing high If you are going long on the break of the previous bars high (on your drilldown timeframe) then your stop is placed below the drilldown swing low
59 How to Enter Divergences If you are drilling down to enter the trade, your profit target is still the target from the original timeframe you identified the divergence on The reason you drilldown like this is to increase your reward risk ratio. The better your reward risk ratio is, the better the probabilities of being a profitable trader
60 How to Enter Divergences You do not have to use a divergence for your entry on the drilldown timeframe, you can also use the SS Momentum Trender PRO or the Hedge Fund Trader, or breakout entries, etc. The goal of drilldown entries is to minimize the risk on your trades, not to find the turning points of major moves. Those are found on the higher timeframes
61 How to Enter Divergences We expect a divergence to move 1-3 bars in our direction. So if we find a divergence on a 30 minute chart, we expect a move of 30 minutes 1.5 hours If you want to catch larger moves, increase the timeframe you are looking at for the divergence. If you find one on a daily, then you expect at least 1-3 days of a move in your direction
62 How to Enter Divergences A Blue Squeeze setup occurs when the market suddenly loses a lot of volatility and the trender changes to neutral. You watch for a break above the highest high or the lowest low bar Trender should confirm the breakout by the 2 nd bar and should be in the money very quickly


63 How to Enter Divergences A Blue Squeeze setup occurs when the market suddenly loses a lot of volatility and the trender changes to neutral. You watch for a break above the highest high or the lowest low bar Trender should confirm the breakout by the 2 nd bar and should be in the money very quickly
64 Questions on How to Enter Divergences?
65 Understanding and Trading Trend Reversal vs. Consolidation
66 Trend Reversal vs. Consolidation In order to know if a divergence has caused the trend to reverse, you need to know the definition of a trend Up Trends Higher High and Higher Low Down Trends Lower High and Lower Low You cannot have a trend without one of the two things listed above
67 Trend Reversal vs. Consolidation
68 Trend Reversal vs. Consolidation
69 Trend Reversal vs. Consolidation Treat every divergence as if it is just consolidation. IF we break the previous swing low/swing high, THEN we can assume that the trend has reversed and we can be looking for longer term moves to the downside IF we bounce off of the previous swing low/swing high, THEN we know it is consolidation and we can close trade to enter on trendline break resuming trend

70 Trend Reversal vs. Consolidation
71 Trend Reversal vs. Consolidation
72 Trend Reversal vs. Consolidation If the trend does not reverse, then you are looking for a breakout entry to jump back in on the direction of underlying trend Look to draw a trendline connecting two or more points for the consolidation breakout point Enter on trendline BREAK, not on close above/below said trendline

73 Trend Reversal vs. Consolidation
74 Trend Reversal vs. Consolidation
75 Questions on Trading Trend Reversal vs. Consolidation?
76 Momentum Based Trade Setups
77 Momentum Based Trade Setups There are several great trade setups you can see using the MQ Momentum or MACD indicators, two that have high probability of success are: Momentum Inflections (Using Histogram) One Green/One Red Finger Setups
78 Momentum Based Trade Setups MOMENTUM INFLECTIONS Momentum Inflections are looking at the small retracements in the histogram when a market catches its breath before the next move higher/lower Unlike a bull or a bear flag, you do not have to have a lower high or higher low, just a lower or higher indicator histogram bar
79 Momentum Based Trade Setups If the retracement is more than a few ticks/cents, then you trade it like a bull/bear flag, on the break of the previous bars high/low If it is just a small retracement or even just a consolidation bar, you trade the break of the high/low of the highest or lowest bar
80 Momentum Based Trade Setups Enter trade on break of previous bars high/low after under/overvalued has been reached Trender should confirm move and should resume your direction within the next few bars Only take the first 2-3 over/undervalued bounces once a trend changes
81 Momentum Based Trade Setups Enter trade on break of previous bars high/low after under/overvalued has been reached Trender should confirm move and should resume your direction within the next few bars Only take the first 2-3 over/undervalued bounces once a trend changes
82 Momentum Based Trade Setups One Green/Red Finger Similar to a momentum inflection, a one green/red finger setup is identified by looking at the MQ Momentum or MACD histogram. A one green finger setup is formed when you have red histogram bars broken by a single green histogram bar, this is a bearish setup showing extremely weak momentum on the rally
83 Momentum Based Trade Setups A one red finger setup is the exact opposite of one green finger. It is identified by a series of green histogram bars, broken by one red histogram bar. This is a bullish setup showing extremely weak momentum by the sellers A one green/red finger setup is somewhat of a delayed setup. Meaning, we do not know if it is going to stay with one green/red finger until the bar closes.
84 Momentum Based Trade Setups You enter the trade using drilldown analysis or on the break of the previous bars high/low The market should follow through your direction immediately. Only trade these setups if there is going to be enough volume to actually move the market. If the market is not moving, you can get chopped up with buy/sell signals
85 Momentum Based Trade Setups These types of setups are not necessarily topping or bottoming patterns, many times they offer great entries into a market that is already moving down or up Similar to all the other setups we have discussed, the distance you expect the market to move after the setup occurs, depends on the timeframe you are watching. The longer the timeframe, the larger the move
86 Momentum Based Trade Setups Enter trade on break of previous bars high/low after under/overvalued has been reached Trender should confirm move and should resume your direction within the next few bars Only take the first 2-3 over/undervalued bounces once a trend changes


87 Momentum Based Trade Setups Enter trade on break of previous bars high/low after under/overvalued has been reached Trender should confirm move and should resume your direction within the next few bars Only take the first 2-3 over/undervalued bounces once a trend changes
88 Questions on Momentum Based Trade Setups?
89 Things to Remember! When you enter a trade, long or short, the momentum should agree on direction, no matter what strategy you are using The best trades are going to work out right away, if it is taking too long to move, then it may be worth going ahead and getting out of the trade early Watch for the really well defined setups, then use drilldown entries to increase your reward risk ratio
90 Things to Remember! Be patient waiting for trades, do not go searching for a trade opportunity, you will see the opportunity when it shows up We are not looking for good trades we are looking for excellent trades do not feel as if you HAVE to trade every day, quite simply you do not Learn to have expectations on how a trade should play out, if it is not behaving the way you believe it should, then do not take the trade

91 $147 ValueBars Indicator
presented by Thomas Wood MicroQuant SM Divergence Trading Workshop Day One Naked Trading Part 2
 presented by Thomas Wood MicroQuant SM Divergence Trading Workshop Day One Naked Trading Part 2 Risk Disclaimer Trading or investing carries a high level of risk, and is not suitable for all persons. Before
presented by Thomas Wood MicroQuant SM Divergence Trading Workshop Day One Black Gold
 presented by Thomas Wood MicroQuant SM Divergence Trading Workshop Day One Black Gold Risk Disclaimer Trading or investing carries a high level of risk, and is not suitable for all persons. Before deciding
Naked Trading and Price Action
 presented by Thomas Wood MicroQuant SM Divergence Trading Workshop Day One Naked Trading and Price Action Risk Disclaimer Trading or investing carries a high level of risk, and is not suitable for all
presented by Thomas Wood MicroQuant SM Divergence Trading Workshop Day One Bond Trading Success
 presented by Thomas Wood MicroQuant SM Divergence Trading Workshop Day One Bond Trading Success Risk Disclaimer Trading or investing carries a high level of risk, and is not suitable for all persons. Before
- My 4 Favorite Trades - Essential Trades of a Professional Trader
 presented by Thomas Wood MicroQuant SM Divergence Trading Workshop Day One - My 4 Favorite Trades - Essential Trades of a Professional Trader Risk Disclaimer Trading or investing carries a high level of
C y c l e C a n d l e s T r a d i n g W o r k s h o p
 C y c l e C a n d l e s Trading Workshop Risk Disclaimer Trading or investing carries a high level of risk, and is not suitable for all persons. Before deciding to trade or invest you should carefully
The Launchpad Strategy
 presented by Thomas Wood MicroQuant SM Divergence Trading Workshop Day One The Launchpad Strategy Risk Disclaimer Trading or investing carries a high level of risk, and is not suitable for all persons.
Becoming a Consistent Trader
 presented by Thomas Wood MicroQuant SM Divergence Trading Workshop Day One Becoming a Consistent Trader Risk Disclaimer Trading or investing carries a high level of risk, and is not suitable for all persons.
11-Hour Options 2.0 The Next Evolution of Success
 presented by Thomas Wood MicroQuant SM Identifying Key Support and Resistance Levels 11-Hour Options 2.0 The Next Evolution of Success Risk Disclaimer Trading or investing carries a high level of risk,
Real Life Fibonacci Trading & Dynamic Targeting with MQ Trend
 presented by Thomas Wood MicroQuant SM Divergence Trading Workshop Day One Real Life Fibonacci Trading & Dynamic Targeting with MQ Trend Risk Disclaimer Trading or investing carries a high level of risk,
Trading EveryDay reserves the right to change this privacy statement at any time. Be sure to check this page periodically for updates.
 This content is provided by The Trading EveryDay Group, LLC. This site, including its contents, is provided "as educational content only" without warranty or guarantee of any kind, either expressed or
Forex Renko Charts FX Trading System
 Forex Renko Charts FX Trading System Disclaimer FOREX trading, online foreign exchange trading, foreign currency trading and Forex options trading involves risk of loss and is not appropriate for all investors.
Counter Trend Trades. (Trading Against The Trend) By Russ Horn
 By Russ Horn") Counter Trend Trades (Trading Against The Trend) By Russ Horn 1 RISK DISCLOSURE STATEMENT / DISCLAIMER AGREEMENT Trading any financial market involves risk. This report and all and any of its contents
Counter Trend Trades (Trading Against The Trend) By Russ Horn 1 RISK DISCLOSURE STATEMENT / DISCLAIMER AGREEMENT Trading any financial market involves risk. This report and all and any of its contents
Intra-Day Trading Techniques
 Pristine.com Presents Intra-Day Trading Techniques With Greg Capra Co-Founder of Pristine.com, and Co-Author of the best selling book, Tools and Tactics for the Master Day Trader Copyright 2001, Pristine
Trading the Hidden Divergence. Presented by Sunil Mangwani
 Trading the Hidden Divergence Indicators in technical analysis. Indicators along with chart patterns, trend lines, resistance / support levels etc., are an essential part of technical analysis. But there
Icoachtrader Consulting Service WELCOME TO. Trading Boot Camp. Day 5
 Icoachtrader Consulting Service www.icoachtrader.weebly.com WELCOME TO Trading Boot Camp Day 5 David Ha Ngo Trading Coach Phone: 1.650.899.1088 Email: icoachtrader@gmail.com The information presented is
RISK DISCLOSURE STATEMENT / DISCLAIMER AGREEMENT
 RISK DISCLOSURE STATEMENT / DISCLAIMER AGREEMENT Trading any financial market involves risk. This report and all and any of its contents are neither a solicitation nor an offer to Buy/Sell any financial
INTERMEDIATE EDUCATION GUIDE
 INTERMEDIATE EDUCATION GUIDE CONTENTS Key Chart Patterns That Every Trader Needs To Know Continution Patterns Reversal Patterns Statistical Indicators Support And Resistance Fibonacci Retracement Moving
3 Price Action Signals to Compliment ANY Approach to ANY Market
 3 Price Action Signals to Compliment ANY Approach to ANY Market Introduction: It is important to start this report by being clear that these signals and tactics for using Price Action are meant to compliment
DAILY DAY TRADING PLAN
 DAILY DAY TRADING PLAN Gatherplace will be used to place all of your trades. You will be using the 5 minute chart for the trade setup and the 1 minute chart for your entry, stop and trailing stop.you will
Technical Analysis Basics. Identifying Tops
 Technical Analysis Basics. Identifying Tops June 2011 1 Sign Up Now to Upshots forex trade signals disclaimer The information provided in this report is for educational purposes only. It is not a recommendation
Compiled by Timon Rossolimos
 Compiled by Timon Rossolimos - 2 - The Seven Best Forex Indicators -All yours! Dear new Forex trader, Everything we do in life, we do for a reason. Why have you taken time out of your day to read this
Go No Go Indicators: Part 2
 Go No Go Indicators: Part 2 March 22, 2017 Dennis W. Wilborn Active Trend Trading Disclaimer U.S. Government Required Disclaimer Commodity Futures Trading Commission Futures and Options trading has large
Williams Percent Range
 Williams Percent Range (Williams %R or %R) By Marcille Grapa www.surefiretradingchallenge.com RISK DISCLOSURE STATEMENT / DISCLAIMER AGREEMENT Trading any financial market involves risk. This report and
RISK DISCLOSURE STATEMENT / DISCLAIMER AGREEMENT
 RISK DISCLOSURE STATEMENT / DISCLAIMER AGREEMENT Trading any financial market involves risk. This report and all and any of its contents are neither a solicitation nor an offer to Buy/Sell any financial
The Master Trader Counter-Trend Trade Set-Ups
 The Master Trader Counter-Trend Trade Set-Ups Trading Concepts, Inc. The Master Trader Counter-Trend Trade Set-Ups By Todd Mitchell Copyright 2014 by Trading Concepts, Inc. All Rights Reserved This training
FOREX TRADING STRATEGIES.
 FOREX TRADING STRATEGIES www.ifcmarkets.com www.ifcmarkets.com 2 One of the most powerful means of winning a trade is the portfolio of Forex trading strategies applied by traders in different situations.
Technicals & Time Frame
 Advanced Charting Neither Better Trades or any of its personnel are registered broker-dealers or investment advisers. I will mention that I consider certain securities or positions to be good candidates
When traders make trading decisions based on repeated price patterns that once formed,
 Trading Strategy / Gert.Nurme@iBrokers.ee Price Action Trading Strategy Introduction WHAT IS PRICE ACTION TRADING? When traders make trading decisions based on repeated price patterns that once formed,
Chapter 2.3. Technical Analysis: Technical Indicators
 Chapter 2.3 Technical Analysis: Technical Indicators 0 TECHNICAL ANALYSIS: TECHNICAL INDICATORS Charts always have a story to tell. However, from time to time those charts may be speaking a language you
Understanding Oscillators & Indicators March 4, Clarify, Simplify & Multiply
 Understanding Oscillators & Indicators March 4, 2015 Clarify, Simplify & Multiply Disclaimer U.S. Government Required Disclaimer Commodity Futures Trading Commission Futures and Options trading has large
Scalp Trading Strategies
 Scalp Trading Strategies Services Disclaimer (for full disclosure, see Disclaimers section of website) Information Contained within our website and affiliates is not a substitute for professional advice
Free Forex Midnight Setup Strategy
 Free Forex Midnight Setup Strategy User s Guide Reviewed and recommended by Rita Lasker www.ritalasker.com Read this There are lots of different strategies on the market. We test most of them and want
ValueCharts for Sierra Chart
 ValueCharts for Sierra Chart Contents: What are ValueCharts? What are ValueAlerts SM? What are ValueBars SM? What are ValueLevels SM? What are ValueFlags SM? What are SignalBars SM? What is MQ Cycle Finder?
Figure 3.6 Swing High
 Swing Highs and Lows A swing high is simply any turning point where rising price changes to falling price. I define a swing high (SH) as a price bar high, preceded by two lower highs (LH) and followed
6 TRADE SETUPS YOU CAN START USING RIGHT NOW. includes: Ryan's top charting patterns
 6 TRADE SETUPS YOU CAN START USING RIGHT NOW includes: Ryan's top charting patterns SharePlanner's Top Setups for TRADING LONG & SHORT Far too often we clutter our trading strategy with hundreds of different
 ADDING THE MACD Forex Strategy Master Published by Old Tree Publishing CC Suite 509, Private Bag X503 Northway, 4065, KZN, ZA www.oldtreepublishing.com Copyright 2013 by Old Tree Publishing CC, KZN, ZA
MagicBreakout Forex Trading Strategy
 Tim Trush & Julie Lavrin introduce MagicBreakout Forex Trading Strategy Your guide to financial freedom. Tim Trush, Julie Lavrin, T&J Profit Club, 2007, All rights reserved www.magicbreakout.com Table
No-BS Trading System
 No-BS Trading System Techniques The Professionals Don t Want To Be Revealed DISCLAIMER U.S. Government Required Disclaimer - Commodity Futures Trading Commission Futures and Options trading has large potential
Forex Advantage Blueprint
 Forex Advantage Blueprint Complimentary Report!! www.forexadvantageblueprint.com Copyright Protected www.forexadvantageblueprint.com - 1 - Limits of liability/disclaimer of Warranty The author and publishers
The Strategies Working Best in Today s E-Mini Market
 The Strategies Working Best in Today s E-Mini Market Todd Mitchell Craig Hill Legal Disclaimer No claim is made by Trading Concepts, Inc. that the trading strategies shown here will result in profits and
Multi Indicator Usage Concepts 4/1/2012 Brooky-Indicators.com Brooky
 Multi Indicator Usage Concepts www.brooky-indicator.com 4/1/2012 Brooky-Indicators.com Brooky U.S. Government Required Disclaimer Commodity Futures Trading Commission Futures, Currency and Options trading
For general trading knowledge, please get a beginners guide or simply got to :
 www.forexripper.com About The System For general trading knowledge, please get a beginners guide or simply got to : www.babypips.com For more interactive information about the market, there are hundreds
Everything you need to know about the trade alerts you ve been hearing about.
 11 YEAR Everything you need to know about the trade alerts you ve been hearing about. SCORECARD RESULTS FULL MARKET BREAKDOWN COMPLETE ALERT DETAILS INSTITUTIONAL-GRADE TRADE ALERTS: FUTURES, FOREX & INDICES
TOP 3 INDICATOR BOOT CAMP: PERCENT R
 BIGTRENDS.COM TOP 3 INDICATOR BOOT CAMP: PERCENT R PRICE HEADLEY, CFA, CMT Let s Get Started! Educate Understand the tools you have for trading. Learn what this indicator is and how you can profit from
Chapter 2.3. Technical Indicators
 1 Chapter 2.3 Technical Indicators 0 TECHNICAL ANALYSIS: TECHNICAL INDICATORS Charts always have a story to tell. However, sometimes those charts may be speaking a language you do not understand and you
Top 10 BEST Forex Trading Strategies PDF Report Ebook Author
 Top 10 BEST Forex Trading Strategies PDF Report Ebook Author Top 10 Best Forex Trading Strategies PDF Report If you re in the pursuit of nding the Best Forex trading Strategy and the keys to choosing a
CONNECING THE DOTS Candlesticks & Convergence of Clues. The Art & Science of Active Trend Trading
 CONNECING THE DOTS Candlesticks & Convergence of Clues The Art & Science of Active Trend Trading Disclaimer U.S. Government Required Disclaimer Commodity Futures Trading Commission Futures and Options
50 Pips A Day Forex Strategy. How To Build A Solid Trading System. By Laurentiu Damir. Copyright 2012 by Laurentiu Damir
 50 Pips A Day Forex Strategy How To Build A Solid Trading System By Laurentiu Damir Copyright 2012 by Laurentiu Damir All rights reserved. No part of this book may be reproduced or transmitted in any form
The Synthetic Futures Position. Goal
 The Synthetic Futures Position Goal To try to profit from a trending market using an option strategy that allows entry at a reduced cost while offering the same potential for unlimited profit (and loss)
Using Oscillators & Indicators Properly May 7, Clarify, Simplify & Multiply
 Using Oscillators & Indicators Properly May 7, 2016 Clarify, Simplify & Multiply Disclaimer U.S. Government Required Disclaimer Commodity Futures Trading Commission Futures and Options trading has large
1. Introduction 2. Chart Basics 3. Trend Lines 4. Indicators 5. Putting It All Together
 Technical Analysis: A Beginners Guide 1. Introduction 2. Chart Basics 3. Trend Lines 4. Indicators 5. Putting It All Together Disclaimer: Neither these presentations, nor anything on Twitter, Cryptoscores.org,
Trading Lessons from the Intraday Frame (study)
") 1 Daily "Idealized Trades" Report Trading Lessons from the Intraday Frame (study) 1 2018 TheoTrade LLC. All rights reserved. 2 Trading Lessons from the Intraday Frame (1-mi) Major Companies Reporting Earnings
1 Daily "Idealized Trades" Report Trading Lessons from the Intraday Frame (study) 1 2018 TheoTrade LLC. All rights reserved. 2 Trading Lessons from the Intraday Frame (1-mi) Major Companies Reporting Earnings
 Jack Schwager s Planned Trading Approach 1.Define your trading philosophy or system 2. Choose your markets to be traded 3. Specify your risk parameters A. Minimum risk per trade B. Stop loss strategy C.
Advanced Trading Systems Collection MACD DIVERGENCE FOREX TRADING SYSTEM
 MACD DIVERGENCE FOREX TRADING SYSTEM 1 This system will cover the MACD divergence. With this forex trading system you can trade any currency pair (I suggest EUR/USD and GBD/USD when you start), and you
BY JIM PRINCE
 No part of this publication may be reproduced, stored in a retrieval system, or transmitted in any form or by any means electronic, mechanical, photocopying, recording, or otherwise without the prior permission
WELCOME
 www.facebook.com/fxdd www.twitter.com/fxdd WELCOME Part 1: Building the Forex Traders Foundation Greg Michalowski Email: greg@fxdd.com www.livestream.com/fxdd www.fxddnow.com Twitter: gregmikefx Disclaimer
Resistance to support
 1 2 2.3.3.1 Resistance to support In this example price is clearly consolidated and we can expect a breakout at some time in the future. This breakout could be short or it could be long. 3 2.3.3.1 Resistance
Trading Patterns For Stocks And Commodities
 Trading Patterns For Stocks And Commodities It doesn t matter if you are a long-term investor, short swing trader or day trader, you are always looking for an advantageous spot to enter your position.
TD AMERITRADE Technical Analysis Night School Week 2
 TD AMERITRADE Technical Analysis Night School Week 2 Hosted By Derek Moore Director, National Education For the audio portion of today s webcast, please enable your computer speakers. Past performance
Petri Redelinghuys
 Petri Redelinghuys // @TraderPetri Becoming a better trader The first step is persistence You re still at it, well done! Learning must be the focus 90% of traders lose all their money and fail 10% of traders
Swing Trading Success Debit Spreads
 presented by Thomas Wood MicroQuantSM Identifying Key Support and Resistance Levels Swing Trading Success Debit Spreads Submit All Questions Via GoToWebinar Side Menu Risk Disclaimer Trading or inves-ng
The Art & Science of Active Trend Trading
 CONNECTING THE DOTS Candlesticks & Convergence of Clues The Art & Science of Active Trend Trading Copyright ATTS 2007-2015 1 Dennis W. Wilborn, P.E. Founder, President Active Trend Trading dww@activetrendtrading.com
Different Classes Of Divergence
 Russ Horn Presents Different Classes Of Divergence RISK DISCLOSURE STATEMENT / DISCLAIMER AGREEMENT Trading any financial market involves risk. This report and all and any of its contents are neither a
McDowell s Special Market Report Using the TradersCoach.com Software Tools
 McDowell s Special Market Report Using the TradersCoach.com Software Tools JULY 2018: Welcome to this month s Market Report! This written report is going to forecast the Dow Jones Industrial Average (hereafter
FOREX UNKNOWN SECRET. by Karl Dittmann DISCLAIMER
 FOREX UNKNOWN SECRET by Karl Dittmann DISCLAIMER Please be aware of the loss, risk, personal or otherwise consequences of the use and application of this book s content. The author and the publisher are
FX Trend Radar Manual
 C O D I N G T R A D E R. C O M FX Trend Radar Manual Version 1.00 Table of Contents FX Trend Radar... 1 What is FX Trend Radar?... 1 Installation... 2 Configurations... 9 How to use FX Trend Radar... 11
BUY SELL PRO. Improve Profitability & Reduce Risk with BUY SELL Pro. Ultimate BUY SELL Indicator for All Time Frames
 BUY SELL PRO Improve Profitability & Reduce Risk with BUY SELL Pro Ultimate BUY SELL Indicator for All Time Frames Risk Disclosure DISCLAIMER: Crypto, futures, stocks and options trading involves substantial
Free signal generator for traders
 Free signal generator for traders Trader s Bulletin Pivot Point Trading Strategy 1. Just download the FREE tool 2. Key in a few numbers 3. And follow the simple techniques by Mark Rose To make money from
INSIDE DAYS. The One Trading Secret That Could Make You Rich
 The One Trading Secret That Could Make You Rich INSIDE DAYS What 'Inside Days' Are, How To Identify Them, The Setup, How They Work, Entrance Criteria, Management and Exit Criteria for MAXIMUM PROFITS IMPORTANT
How To Add A Layer Of Discretion To Your Swing Trading By Dave Landry
 How To Add A Layer Of Discretion To Your Swing Trading By Dave Landry www.davelandry.com In my articles and books on trading, I strive to make the rules as specific as possible. However, the market doesn't
The Art & Science of Active Trend Trading
 Candlesticks Looking for U-Turns The Art & Science of Active Trend Trading Copywrite ATTS 2007-2015 1 Disclaimer U.S. Government Required Disclaimer Commodity Futures Trading Commission Futures and Options
NetPicks Keltner Bells
 Page 1 NetPicks Keltner Bells NetPicks, LLC HYPOTHETICAL PERFORMANCE RESULTS HAVE MANY INHERENT LIMITATIONS, SOME OF WHICH ARE DESCRIBED BELOW. NO REPRESENTATION IS BEING MADE THAT ANY TRADING ACCOUNT
The 5 Money Management And Position Sizing Secrets Of The Turtle Traders
 The Turtle traders were a legendary group of traders coached by two successful traders, Richard Dennis and William Eckhardt. They selected 10 people (turtles) with little to no prior trading experience
FX Trender Indicator. Reviewed and recommended by Rita Lasker & Green Forex Group
 FX Trender Indicator Reviewed and recommended by Rita Lasker & Green Forex Group Disclaimer Please be aware of the loss, risk, personal or otherwise consequences of the use and application of this book
Chart Patterns. (High Probability Chart Patterns) By Russ Horn
 By Russ Horn") (High Probability ) By Russ Horn 1 RISK DISCLOSURE STATEMENT / DISCLAIMER AGREEMENT Trading any financial market involves risk. This report and all and any of its contents are neither a solicitation nor
(High Probability ) By Russ Horn 1 RISK DISCLOSURE STATEMENT / DISCLAIMER AGREEMENT Trading any financial market involves risk. This report and all and any of its contents are neither a solicitation nor
Presents. Forex Profit Boost
 Presents Forex Profit Boost Forex Profit Boost Published by Alzaiak Trading CC Nominee Old Tree Publishing CC Suite 509, Private Bag X503 Northway, 4065, KZN, ZA www.oldtreepublishing.com Copyright 2014
Stacking Indicators Getting a GREAT entry! TWEEZERS Tweezer top/bottom at the band The stock is trending up Gap down (against the trend) Any moving
 Any moving") Dean Storholt I am not a registered broker-dealer or investment adviser. I will mention that I consider certain securities or positions to be good candidates for the types of strategies we are discussing
Dean Storholt I am not a registered broker-dealer or investment adviser. I will mention that I consider certain securities or positions to be good candidates for the types of strategies we are discussing
No duplication of transmission of the material included within except with express written permission from the author.
 Copyright Option Genius LLC. All Rights Reserved No duplication of transmission of the material included within except with express written permission from the author. Be advised that all information is
Three skills to help you trade forex
 Three skills to help you trade forex AN INTRODUCTION TO TRADING CURRENCIES A FOREX.com educational guide FOREX.com is a trading name of GAIN Capital UK Limited, FCA No. 113942. Our services include products
EZ Trade FOREX Day Trading System. by Beau Diamond
 EZ Trade FOREX Day Trading System by Beau Diamond The EZ Trade FOREX Day Trading System is mainly used with four different currency pairs; the EUR/USD, USD/CHF, GBP/USD and AUD/USD, but some trades are
Price Action - The Footprint of the Money Judy MacKeigan - Buffy
 Price Action - The Footprint of the Money Judy MacKeigan - Buffy "What is Price Action?" is a frequently asked question by aspiring traders. Traders who ask, feel it is a well kept secret when all they
Trading Tops and Bottoms DAILY T&B REPORT. Let Us Find The Highs And Lows For You. November 7, 2017
 Trading Tops and Bottoms DAILY T&B REPORT Let Us Find The Highs And Lows For You November 7, 2017 DISCLAIMER Videos, newsletters and notifications from Trading Tops and Bottoms are for educational purposes
Risk Disclosure and Liability Disclaimer:
 Risk Disclosure and Liability Disclaimer: The author and the publisher of the information contained herein are not responsible for any actions that you undertake and will not be held accountable for any
90 Days Trading Bonds
 90 Days Trading Bonds with Chip Cole 2015, All Rights Reserved. Order Flow Analytics, Inc. 1 Trading & Training chip@orderflowanalytics.com dbvaello@orderflowanalytics.com 2015, All Rights Reserved. Order
User Guide. PivotBreaker. Brought to you by Equitimax. A trading method for forex. Equitimax
 User Guide PivotBreaker Brought to you by Equitimax A trading method for forex Equitimax Disclaimer The PivotBreaker is provided to you by Equitimax, free of charge. We provide no warranty or promise of
Active Trend Trading Rules Review
 Active Trend Trading Rules Review Active Trend Trader: Dennis W. Wilborn A Trend Should Be Assumed to Continue in Effect Until Such Time as Its Reversal Has Been Definitely Signaled Edwards & Magee Disclaimer
4 Keys to Trend Trading Tech Analysis. There is no Holy Grail of Trading Only Tools & Rules
 4 Keys to Trend Trading Tech Analysis There is no Holy Grail of Trading Only Tools & Rules Disclaimer U.S. GOVERNMENT REQUIRED DISCLAIMER COMMODITY FUTURES TRADING COMMISSION FUTURES AND OPTIONS TRADING
Technical Analysis Workshop Series. Session Six 1, 2, 3 Price-Bars Patterns
 Technical Analysis Workshop Series Session Six 1, 2, 3 Price-Bars Patterns DISCLOSURES & DISCLAIMERS This research material has been prepared by NUS Invest. NUS Invest specifically prohibits the redistribution
Trading Guidelines. Why guidelines and not rules? Because there are no rules.
 Trading Guidelines Why guidelines and not rules? Because there are no rules. 1. Everything that you see is in a gray fog. Nothing is perfectly clear. Close is close enough. If something looks like a reliable
USER GUIDE
 USER GUIDE http://www.winningsignalverifier.com DISCLAIMER Please be aware of the loss, risk, personal or otherwise consequences of the use and application of this book s content. The author and the publisher
WORKBOOK. The FX Trader s EDGE BLUEPRINT ENCORE EVENT. How to Capture Low Hanging Profits in the New Year Using 3 Simple Blueprints
 WORKBOOK The FX Trader s EDGE BLUEPRINT ENCORE EVENT How to Capture Low Hanging Profits in the New Year Using 3 Simple Blueprints Jody Samuels, Juan Maldonado and Neil Bradford Disclaimer This workbook
Trading Lessons from the Intraday Frame (study)
") 1 Daily "Idealized Trades" Report Trading Lessons from the Intraday Frame (study) 1 2018 TheoTrade LLC. All rights reserved. 2 Trading Lessons from the Intraday Frame (1-mi) 2 2018 TheoTrade LLC. All rights
1 Daily "Idealized Trades" Report Trading Lessons from the Intraday Frame (study) 1 2018 TheoTrade LLC. All rights reserved. 2 Trading Lessons from the Intraday Frame (1-mi) 2 2018 TheoTrade LLC. All rights
The Neutral Market Strategy
 The Neutral Market Strategy GOAL To make a profit selling options in a sideways-moving market. SUMMARY Experts estimate that markets typically trend roughly 30% of the time. The remaining 70% of the time
In here, you will learn the trading rules on how to use trade teh 200 exponential moving average with the Awesome Oscillator Indicator.
 Trading Strategy / Gert.Nurme@iBrokers.ee 200 EMA with Awesome Oscillator Introduction The 200 EMA With Awesome Oscillator Forex Trading Strategy is a very simple trend trading system and therefore in
Binary Options Trading Strategies How to Become a Successful Trader?
 Binary Options Trading Strategies or How to Become a Successful Trader? Brought to You by: 1. Successful Binary Options Trading Strategy Successful binary options traders approach the market with three
TRADING ADDICTS. Lesson 3: Timing and Technical Indicators. Timing the Market. Copyright 2010, Trading Addicts, LLC. All Rights Reserved
 Lesson 3: Timing and Technical Indicators In this chapter, we will be focusing on the timing of the trade, from each individual angle. Timing plays a critical role in a Covered Call strategy, as it can
Chart Pattern Secrets
 Chart Pattern Secrets June 14, 2018 Next Alert: 06/19/18 The Trading System: Application of Trading Chart Patterns with Futures and Option Contracts Copyright 1997 All rights reserved. 1 2 3 4 5 5/15/18:
This is the complete: Fibonacci Golden Zone Strategy Guide
 This is the complete: Fibonacci Golden Zone Strategy Guide In this strategy report, we are going to share with you a simple Fibonacci Trading Strategy that uses the golden ratio which is a special mathematical
Naked Trading - Double Top Chart Pattern Strategy
 Naked Trading - Double Top Chart Pattern Strategy If you really want to learn a profitable way to trade then look no further, the Double Top chart pattern strategy uses simple and sound trading principles