An Introduction to Candlesticks for Options Using Nison Candlesticks as the Foundation to your option trading
|
|
|
- Emerald Ami Greene
- 6 years ago
- Views:
Transcription


1 Using Nison Candlesticks as the Foundation to your option trading, CMT President: Candlecharts.com

2 Candlestick Benefits Easy to Understand Early Reversals Safety First East + West All markets All Time Frames 1

3 2
4 ANATOMY OF THE CANDLESTICK LINE high close Shadow Real Body open open low close Real Bodies / Shadows 3

5 4
6 Who s in control? Who s in control? 5

7 6
8 Negative Selection Good buy? 7
9 Nison Candlesticks for Exiting I find that the candlesticks are wonderful for EXITS. I use candlesticks to tell me to get out 8

10 Get into a new trend before other traders see it 9
11 Basic Criteria Market in a downtrend Small real body (either color) at, or near, top of range. Lower shadow at least 2x height real body 10

12 HAMMER AND BULL SHADOWS 11
13 Benefits of Options Leverage Risk Control Trade high price markets Easy to short Portfolio protection Can profit in any market environment Easy to change market stance Generate Income 12


14 13

15 Leverage Buy at Sell at % gain on stock = 4.8% $700 Buy ATM 145 call 14 days 3.25 Sell to close call 11 days later for 6.60 with 151 ½ % gain on options =103% $335 14
16 Candlesticks + Western Indicators Candlestick Charting Strategies Steve Nison s Trading Triad Success System Candlesticks + Trade Management 15
17 Four Basic Trades Buyer (long) CALL Right to buy PUT Right to sell Seller (short) Obligation to sell Obligation to buy Examples XYZ January 70 Call at $3.10: Call buyer can buy XYZ (up to expiration date) for $70. And call seller must sell to him at that price. ABC February 35 Put at $1.20 (Put buyer can sell XYZ (up to expiration date ) for $35. And put seller must buy it from him at that price. 16
 Scenario 2 buy based on MACD Mkt @ $418 : 420 call @ $13.45 Exit at doji (5 days later) mkt @ 447: 420 call @ $31.")
18 Nison Candlestick strategies for long calls Scenario 1 buy at hammer $395: 400 $11.30 Exit at doji ( red arrow 13 days after hammer) 447: 400 $47.50 (320 % return) Scenario 2 buy based on MACD $418 : 420 $13.45 Exit at doji (5 days later) 447: 420 $31.20 (132% return) Result: Nison candlesticks generated over 2x the profit! 17

19 Direction blows away implied volatility Direction is the single most important thing you need to know to make money on any options trade 18
20 Implied Volatility vs. Direction AAPL 1) Hold IV constant at 26% and price +20% over 30 days 300: 60-day 300 call = $ : 30-day 300 call = $ ) Hold Price Constant at $300 and IV +20% over 30 days 300 strike 60-day call: = strike 30-day call: Vol 31.2% = Result: 20% change in price = +$47.40 (374% gain) 20% change in Vol = -$2.00 (15% loss) 19
21 Nison Chart Challenge #1 1) What are two times to consider a long put? 2) For each of these what would be your target? 3) For each of these what would be your protective stop? 4) When would you close out the long puts and why? 20
22 Candlesticks + Western Indicators Candlestick Charting Strategies Steve Nison s Trading Triad Success System Candlesticks + Trade Management 21

 When would you have closed out the trade and why? www.")
23 Nison Chart Challenge #2 1) In the boxed area above when would you consider a long call? 2) What is you protective stop? 3) What is your target? 4) When would you have closed out the trade and why? 22

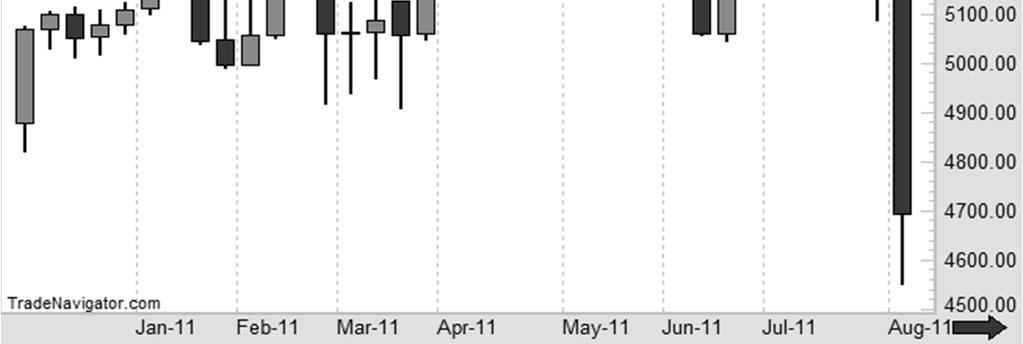
24 S&P VIX 23
25 Bullish Bearish 24

26 Candles as resistance for option trading Scenario1: Long call at hammer Target = bear engulf resistance 1775, close out long call 8 days 8.00 with 1875 Scenario 2: Long put at 2nd bear engulf Target = hammer 1875, close out put 13 days 9.75 with
27 Using the What If Concept target Market holds a support area set with a bullish engulfing pattern. The target is a dark cloud cover at 51 ½ We are looking for a quick rally (within 10 days) Assuming we are doing a long call, should we do a 45 call or a 50 call? Successful test of support 26
28 What...If analysis for 50 call 50 call theoretical goes from 1.40 to 3.50 = 150% 27
29 What...If analysis for 45 call 45 call theoretical goes from 3.40 to 7.00 = 106% 28

30 Remember Implied Volatility! 29

31 30

32 31
33 Use the highest high of those two sessions (top of upper shadow) as resistance 32
34 Candles and Momentum Trading Look at all the reversal signals 33

35 34

36 Nison Candle strategies for portfolio protection Worried about a move to 178 area. 200 Buy a 30 day Close out put at support at 178 with Paper loss on stock of $ $2,200 on 100 shares and made $1,560 on protective put 35
37 How NOT to use candlesticks Oh my goodness! The market rallied after the shooting star! 36


38 Candlesticks + Western Indicators Candlestick Charting Strategies Candlesticks + Trade Management 37


39 EAST & WEST CONFIRMATION Where a candle signal confirms a Western Technical signal 38
40 resistance doji 39


41 Bullish Engulfing Pattern at Support 40
42 Bull Call Spreads Buy lower strike (95) call Sell higher strike (100) call (same expiration) Which of these two strikes will be more worth more? So will be buying the more expensive lower strike call- and selling the cheaper call: Result is net cost to you - hence a debit call spread Concept: less costly way to buy call. But give up profit potential Buy 1 XYZ 30-day Sell 1 XYZ 30-day Net Debit (2.00) At expiration: Maximum Profit = Difference in Strike Prices (5) - Net Debit (2) = 3 Max Risk is net debit = 2 Breakeven = Lower Strike (95) + Net Debit (2) =
43 East + West = Increased Confidence Bull call spread at hammer (assume $1 strikes): Buy with 81 Sell 87 call (resistance Net debit = 1.95 Max profit = 4.05 BE= ) What are these candle signals? 2) What are they confirming? 42
44 Target Snap Buy Crack Stop 43
45 Nison Chart Challenge #3 1) What western signal is at the close of the session with arrow? 2) What is target 3) What is stop 4) What outright option, and strike, would you do and why. Assume $10 strikes 44


46 45


47 What if you knew how solid support or resistance was, and by knowing this be rock solid confident about what outright or spread option strategy to use? 46
48 Your Special Thank You Bonus: $79 value Exclusive: Get Steve s FREE video showing exactly how he determines how strong support or resistance is. 47
49 Alert! This free offer may be withdrawn at anytime without notice 48
Candlestick Secrets for Profiting in Options Seminar Nison Candlesticks to Guide Your Option Trades
 Nison Candlestick Secrets For Profiting in Options Presentedby Steve Nison President: candlecharts.com Quickly finding the best opportunities in the options markets Nison candlesticks for option strategies
Candlestick Secrets for Profiting in Options Seminar Nison Candlesticks to Guide Your Option Trades
 Nison Candlestick Secrets For Profiting in Options Presented by Steve Nison President: candlecharts.com Quickly finding the best opportunities in the options markets Nison candlesticks for option strategies
Candlestick Secrets for Profiting in Options Seminar The Foundation of Options
 Option Spreads 45 Bull Vertical Spreads Bull call (debit) & Bull put (credit) 46 Bull Call Spreads Buy lower strike (95) call Sell higher strike (100) call (same expiration) Which of these two strikes
Candlestick Secrets for Profiting in Options Seminar Nison Candlesticks to Guide Your Option Trades. Nison Chart Challenge 7 - Read Steve s Mind
 Nison Chart Challenge 7 - Read Steve s Mind 1) How could we have used NCS after the first hammer to find a good trade set up and decrease time decay? 2) What outright or spread could we have done? 3) When
Candlestick Secrets for Profiting in Options Seminar Nison Candlesticks to Guide Your Option Trades
 I was long a stock and saw bearish candles so I bought a put to protect my position. Being able to employ some defensive timing measures REALLY reduces my anxiety The candles provide the final piece before
Interactive Practice Questions
 Bonus Handouts Interactive Q and A companion for video workshop Secrets of Becoming a Samurai Trader: Advanced Candlestick Charting Techniques with Steve Nison These extra handouts (which are not part
Candlesticks Discoveries Probability of Success Aug 6, 2016
 Candlesticks Discoveries Probability of Success Aug 6, 2016 The Art & Science of Active Trend Trading Disclaimer U.S. Government Required Disclaimer Commodity Futures Trading Commission Futures and Options
CONNECING THE DOTS Candlesticks & Convergence of Clues. The Art & Science of Active Trend Trading
 CONNECING THE DOTS Candlesticks & Convergence of Clues The Art & Science of Active Trend Trading Disclaimer U.S. Government Required Disclaimer Commodity Futures Trading Commission Futures and Options
Lighting the Way: Using Candlestick Patterns. The Art & Science of Active Trend Trading
 Lighting the Way: Using Candlestick Patterns The Art & Science of Active Trend Trading Disclaimer U.S. Government Required Disclaimer Commodity Futures Trading Commission Futures and Options trading has
Chapter Eight. Japanese Candle Chart
 Chapter Eight Japanese Candle Chart Candle chart (also called candlestick) analysis has been used since the 18 th century by Japanese rice traders to predict the rice price s movement. According to sources,
The Art & Science of Active Trend Trading
 CONNECTING THE DOTS Candlesticks & Convergence of Clues The Art & Science of Active Trend Trading Copyright ATTS 2007-2015 1 Dennis W. Wilborn, P.E. Founder, President Active Trend Trading dww@activetrendtrading.com
The Art & Science of Active Trend Trading
 CONNECTING THE DOTS Candlesticks & Convergence of Clues The Art & Science of Active Trend Trading Copywrite ATTS 2007-2015 1 Dennis W. Wilborn, P.E. Founder, President Active Trend Trading dww@activetrendtrading.com
Reversal Candles. Candlestick Bearish Reversal Patterns. Bearish Confirmation. Existing Downtrend
 Candlestick Bearish Reversal Patterns There are dozens of bearish reversal patterns. We have elected to narrow the field by selecting a few of the most popular patterns for detailed explanations. Below
The Art & Science of Active Trend Trading
 Candlesticks Looking for U-Turns The Art & Science of Active Trend Trading Copywrite ATTS 2007-2015 1 Disclaimer U.S. Government Required Disclaimer Commodity Futures Trading Commission Futures and Options
Candlesticks What They Really Mean! March 3, 2018
 Candlesticks What They Really Mean! March 3, 2018 Active Trend Trading Dennis W. Wilborn Disclaimer U.S. Government Required Disclaimer Commodity Futures Trading Commission Futures and Options trading
Welcome to TONI TURNER S TRADING SCHOOL. Series
 Welcome to TONI TURNER S TRADING SCHOOL Series Disclaimer This seminar, How to Read Charts: Five Easy Steps to Chart Analysis, was prepared for educational purposes only. Its contents do not recommend,
Intraday candlestick secrets for day and swing trades
 Intraday candlestick secrets for day and swing trades www.candlecharts.com 1 Intraday Candle Charts Be more flexible with candle patterns on intraday candle charts than with daily or weekly candles 2 Non
PART 3 - CHART PATTERNS & TECHNICAL INDICATORS
 Tyler Chianelli s EASYOPTIONTRADING by OPTION TRADING COACH PART 3 - CHART PATTERNS & TECHNICAL INDICATORS A SIMPLE SYSTEM FOR TRADING OPTIONS WORKS IN UP, DOWN, AND SIDEWAYS MARKETS PART 3.1 - PRIMARY
Syl Desaulniers Nison Certified Trainer Nison Candle Software Tech Support
 Syl Desaulniers Nison Certified Trainer Nison Candle Software Tech Support Legal Notice: This webcast and recording is Candlecharts.com and may not be copied, retransmitted, nor distributed in any manner
Introduction. Technical analysis is the attempt to forecast stock prices on the basis of market-derived data.
 Technical Analysis Introduction Technical analysis is the attempt to forecast stock prices on the basis of market-derived data. Technicians (also known as quantitative analysts or chartists) usually look
Technical Analysis Workshop Series. Session Six 1, 2, 3 Price-Bars Patterns
 Technical Analysis Workshop Series Session Six 1, 2, 3 Price-Bars Patterns DISCLOSURES & DISCLAIMERS This research material has been prepared by NUS Invest. NUS Invest specifically prohibits the redistribution
Mastering the Markets
 www.mastermindtraders.com Presents Mastering the Markets Your Path to Financial Freedom DISCLAIMER Neither or any of its personnel are registered broker-dealers or investment advisors. We may mention that
Presents. SPY the MARKET. With. Bill Corcoran
 Presents SPY the MARKET With Bill Corcoran I am not a registered broker-dealer or investment adviser. I will mention that I consider certain securities or positions to be good candidates for the types
Introduction. Technicians (also known as quantitative analysts or chartists) usually look at price, volume and psychological indicators over time.
 usually look at price, volume and psychological indicators over time.") Technical Analysis Introduction Technical Analysis is the study of market action, primarily through the use of charts, for the purpose of forecasting future price trends. Technicians (also known as quantitative
Technical Analysis Introduction Technical Analysis is the study of market action, primarily through the use of charts, for the purpose of forecasting future price trends. Technicians (also known as quantitative
 1 www.candlecharts.com 2 BONUS www. candlecharts.com/special/swing-trading-2/ 3 www. candlecharts.com/special/swing-trading-2/ 4 www. candlecharts.com/special/swing-trading-2/ 5 www. candlecharts.com/special/swing-trading-2/
Candlestick Signals and Option Trades (Part 3, advanced) Hour One
 Hour One") Candlestick Signals and Option Trades (Part 3, advanced) Hour One 1. Hedges, long and short A hedge is any strategy designed to reduce or eliminate market risk. This applies to equity positions and the
Candlestick Signals and Option Trades (Part 3, advanced) Hour One 1. Hedges, long and short A hedge is any strategy designed to reduce or eliminate market risk. This applies to equity positions and the
Intra-Day Trading Techniques
 Pristine.com Presents Intra-Day Trading Techniques With Greg Capra Co-Founder of Pristine.com, and Co-Author of the best selling book, Tools and Tactics for the Master Day Trader Copyright 2001, Pristine
How to Spot Candlestick Formations in the Stock Market & What to Do Once You Spot Them
 How to Spot Candlestick Formations in the Stock Market & What to Do Once You Spot Them WHAT IS A CANDLESTICK? ACandlestick measures price fluctuations within a defined period of time. Colors differentiate
TWEEZERS TOPS AND BOTTOMS
 88 The Basics TWEEZERS TOPS AND BOTTOMS Tweezers are two or more candlestick lines with matching highs or lows. They are called tweezers because they are compared to the two prongs of a tweezers. In a
 Disclaimer The candlestick patterns explained in this book are intended to provide information only.. Use these patterns is at your discretion. The use and application of the included patterns can involve
Introduction...1 Part I: Getting Familiar with Candlestick Charting and Technical Analysis...7. Part V: The Part of Tens...315
 Contents at a Glance Introduction...1 Part I: Getting Familiar with Candlestick Charting and Technical Analysis...7 Chapter 1: Understanding Charting and Where Candlesticks Fit In...9 Chapter 2: Getting
CHARTS. Bar Line Candlestick Charts are the basis of technical analysis They are a graphic display of price action. Notes:
 TECHNICAL ANALYSIS CHARTS Bar Line Candlestick Charts are the basis of technical analysis They are a graphic display of price action Candlestick charts have become the industry standard for technical traders.
CMT LEVEL I CURRICULUM Self-Evaluation
 CMT LEVEL I CURRICULUM Self-Evaluation DEAR CFA CHARTERHOLDER, As a CFA charterholder, the requirement that you sit for the CMT Level I exam is waived. However, the content in the CMT Level I Curriculum
Learn To Trade Stock Options
 Learn To Trade Stock Options Written by: Jason Ramus www.daytradingfearless.com Copyright: 2017 Table of contents: WHAT TO EXPECT FROM THIS MANUAL WHAT IS AN OPTION BASICS OF HOW AN OPTION WORKS RECOMMENDED
Technical Analysis. Prepared by: Mr. SOUR Ramo
 Technical Analysis Prepared by: Mr. SOUR Ramo 1 Contain 1. Introduction 2. Candle Chart 3. Trend Analysis 4. Pattern Analysis 2 1.Introduce 1.1 What is Technical Analysis? Technical analysis is a tool
Class 8: Trading Neutral. I. Learning to Trade Neutral. Today s Class
 Today s Class Psychology of Trading Neutral Anatomy of a trade Bracket trading/trading neutral Determining stops Journaling Class 8: Trading Neutral I. Learning to Trade Neutral Learning to Trade Neutral/Psychology
BONUS. www. candlecharts.com/special/swing-trading-2/
 BONUS www. candlecharts.com/special/swing-trading-2/ 1 www. candlecharts.com/special/swing-trading-2/ www. candlecharts.com/special/swing-trading-2/ www. candlecharts.com/special/swing-trading-2/ 2 www.
Credits And Debits. Learning How to Use Credit Spread Strategies
 Credits And Debits Learning How to Use Credit Spread Strategies Neither Better Trades or any of its personnel are registered broker-dealers or investment advisers. I will mention that I consider certain
THE CANDLESTICK TRADING BIBLE
 1 Content Introduction 4 Overview 6 History of Candlesticks 8 What is a Candlestick 11 Candlestick Patterns 14 The Engulfing Bar Candlestick 16 The Doji Candlestick Pattern 20 The Dragon Fly Doji Pattern
Technical analysis & Charting The Foundation of technical analysis is the Chart.
 Technical analysis & Charting The Foundation of technical analysis is the Chart. Charts Mainly there are 2 types of charts 1. Line Chart 2. Candlestick Chart Line charts A chart shown below is the Line
presented by Thomas Wood MicroQuant SM Divergence Trading Workshop Day One Naked Trading Part 2
 presented by Thomas Wood MicroQuant SM Divergence Trading Workshop Day One Naked Trading Part 2 Risk Disclaimer Trading or investing carries a high level of risk, and is not suitable for all persons. Before
Tradeciety s Price Action Guide
 Tradeciety s Price Action Guide Welcome... 3 Who am I?... 3 Some impressions from my trading & traveling lifestyle... 4 What Is Price Action?... 6 Candlesticks vs. Chart patterns... 7 Top 3 Candlestick
The Engulfing Trader Copyright 2014
 Www.ForexWinners.Ru Prologue and Introduction This book is for all those that are just fed up with all the hype out there in the market. So called guru s selling expensive strategies and systems guaranteeing
JAPANESE CANDLESTICKS
 Edited by Kaspirano JAPANESE CANDLESTICKS In the 1600s, the Japanese developed a method of technical analysis to analyze the price of rice contracts. This technique is called candlestick charting. Steven
On Our Technical Watch
 By the Kenanga Research Team l research@kenanga.com.my Figure 1: Daily Charting FBMKLCI Index Basic Data 52-week High 1,729.13 (in Million) 52-week Low 1,600.92 KLCI Vol 199.37 Current Level 1,662.92 Bursa
Knowing When to Buy or Sell a Stock
 Knowing When to Buy or Sell a Stock Overview Review & Market direction Driving forces of market change Support & Resistance Basic Charting Review & Market Direction How many directions can a stock s price
I prefer to use the CCI indicator to trade divergences and it has worked well for me over the past 10 years.
 Make 100 pips Trading Divergences. There are several ways to trade divergences and several indicators that can help you identify the divergence between price and the indicator itself. I prefer to use the
1. Introduction 2. Chart Basics 3. Trend Lines 4. Indicators 5. Putting It All Together
 Technical Analysis: A Beginners Guide 1. Introduction 2. Chart Basics 3. Trend Lines 4. Indicators 5. Putting It All Together Disclaimer: Neither these presentations, nor anything on Twitter, Cryptoscores.org,
Orders, Level 2, Price Action
 Orders, Level 2, Price Action ANDREW AZIZ SESSION 3 Disclaimer BearBullTraders.com employees, contractors, shareholders and affiliates, are NOT an investment advisory service, a registered investment advisor
S&P Cash Long Term: Uptrend Intact. Monthly Log Chart
 Andy Dodd MSTA - +44 020 7031 4651 adodd@louiscapital.com Twitter : @louiscaptech S&P Cash Long Term: Uptrend Intact Despite an initial slowdown in momentum following the break above 2120 in July, which
Effectiveness of Candlestick. Chart Patterns in today s. commodity market
 Effectiveness of Candlestick Chart Patterns in today s commodity market Dissertation submitted in part fulfilment of the requirements for the degree of MBA Finance Sameer Bindlish 10302271 Dublin Business
MAGIC FOREX DIVERGENCE Trading Guide
 Tim Trush & Julie Lavrin Introducing MAGIC FOREX DIVERGENCE Trading Guide Your guide to financial freedom. Tim Trush, Julie Lavrin, T&J Profit Club, 2017, All rights reserved www.forexmystery.com Table
Data-Driven Trading. Market Adaptation. Stocks & Commodities V. 29:12 (34-39): Data-Driven Trading by Steve Palmquist
: Data-Driven Trading by Steve Palmquist") be up by the end of the year, and about a quarter thought the market would be down. The second question was, How many of you do not care whether the market is up or down by the end of the year? In the
be up by the end of the year, and about a quarter thought the market would be down. The second question was, How many of you do not care whether the market is up or down by the end of the year? In the
On Our Technical Watch
 By the Kenanga Research Team l research@kenanga.com.my Figure 1: Daily Charting FBMKLCI Basic Data 52-week High 1,759.76 (in Million) 52-week Low 1,611.88 KLCI Vol 112.14 Current Level 1,735.84 Bursa Vol
Forex Sentiment Report Q2 FORECAST WEAK AS LONG AS BELOW April
 Forex Sentiment Report 08 April 2015 www.ads-securities.com Q2 FORECAST WEAK AS LONG AS BELOW 1.1200 Targets on a break of 1.1534/35: 1.1740/50 1.1870/75 1.2230/35 Targets on a break of 1.0580/70: 1.0160
Candlestick Forum Boot Camp. High Profit Patterns. Why is it important to know the patterns? Eliminates emotions
 Candlestick Forum Boot Camp High Profit Patterns Why is it important to know the patterns? Eliminates emotions 1 Advanced Candlestick Patterns Fry Pan Bottom Dumpling Top Cradle Pattern Jay-Hook Scoop
THE USE OF CHARTS FOR THE TECHNICAL ANALYSIS OF THE SHARES QUOTED ON THE STOCK EXCHANGE
 THE USE OF CHARTS FOR THE TECHNICAL ANALYSIS OF THE SHARES QUOTED ON THE STOCK EXCHANGE Siminic Marian University of Craiova, Faculty of Economics and Business Administration, Craiova, 13 A.I. Cuza st,
The 4 Step Process for FOREX Trading Mastery
 The 4 Step Process for FOREX Trading Mastery The 4 Step Process for FOREX Trading Mastery 1. Identifying Market Condition 2. Identifying a Trade Set-Up Steps 1 & 2 were discussed in the 2 nd Video 3. Determining
Orders, Level 2, Price Action COPYRIGHTED MATERIAL: ANDREW AZIZ (C) 1
 1") Orders, Level 2, Price Action ANDREW AZIZ SESSION 3 COPYRIGHTED MATERIAL: ANDREW AZIZ (C) WWW.BEARBULLTRADERS.COM 1 Disclaimer BearBullTraders.com employees, contractors, shareholders and affiliates, are
Orders, Level 2, Price Action ANDREW AZIZ SESSION 3 COPYRIGHTED MATERIAL: ANDREW AZIZ (C) WWW.BEARBULLTRADERS.COM 1 Disclaimer BearBullTraders.com employees, contractors, shareholders and affiliates, are
DAILY DAY TRADING PLAN
 DAILY DAY TRADING PLAN Gatherplace will be used to place all of your trades. You will be using the 5 minute chart for the trade setup and the 1 minute chart for your entry, stop and trailing stop.you will
10-Year Treasury Notes ($UST Price)
") 1 Weekly Inter-market Technical Report 10-Year Treasury Notes ($UST Price) Monthly The 10-Year Note has developed a clear rising parallel trend channel that reaches now to the $128 level with confluence
1 Weekly Inter-market Technical Report 10-Year Treasury Notes ($UST Price) Monthly The 10-Year Note has developed a clear rising parallel trend channel that reaches now to the $128 level with confluence
S&P 500 Update: Week ending May 11th 2018
 S&P 500 Update: Week ending May 11th 2018 1. Market Recap: The S&P 500 closed higher by 2.2% for week and broke out of some key resistance areas and a short term downtrend. There are 4 topics now setting
Resistance remains in the SPX S/R zone, with a break out targeting 2170s.
 Executive Summary With a flat week, it appears a one pager would be sufficient to summarize what has happened. However, we believe that would get us off too easy and we still would like to provide a full
WORKBOOK. The FX Trader s EDGE BLUEPRINT ENCORE EVENT. How to Capture Low Hanging Profits in the New Year Using 3 Simple Blueprints
 WORKBOOK The FX Trader s EDGE BLUEPRINT ENCORE EVENT How to Capture Low Hanging Profits in the New Year Using 3 Simple Blueprints Jody Samuels, Juan Maldonado and Neil Bradford Disclaimer This workbook
Agenda. Who is Recognia. Event Driven Technical Analysis. Types of Technical Events. Finding and Validating Ideas using Recognia Q & A
 Disclaimer The information presented here is for educational and informational purposes only. The inclusion of any specific securities detailed is for illustrative purposes only. No information contained
On Our Technical Watch
 By the Kenanga Research Team l research@kenanga.com.my Figure 1: Daily Charting FBMKLCI Basic Data 52-week High 1,757.99 (in Million) 52-week Low 1,611.88 KLCI Vol 174.33 Current Level 1,748.30 Bursa Vol
On Our Technical Watch
 By the Kenanga Research Team l research@kenanga.com.my Figure 1: Daily Charting FBMKLCI Index Basic Data 52-week High 1,729.13 (in Million) 52-week Low 1,600.92 KLCI Vol 85.75 Current Level 1,665.32 Bursa
Monster Market Movers
 Monster Market Movers Prerequisite Manual Better Trades Coach Robert Roy Neither Mastermind Traders or any of its personnel are registered broker-dealers or investment advisers. I will mention that I consider
On Our Technical Watch
 By the Kenanga Research Team l research@kenanga.com.my Figure 1: Daily Charting FBMKLCI Basic Data 52-week High 1,759.76 (in Million) 52-week Low 1,611.88 KLCI Vol 129.13 Current Level 1,740.60 Bursa Vol
Price Action - The Footprint of the Money Judy MacKeigan - Buffy
 Price Action - The Footprint of the Money Judy MacKeigan - Buffy "What is Price Action?" is a frequently asked question by aspiring traders. Traders who ask, feel it is a well kept secret when all they
Covert Code. (previously known as Currency Messenger System 1)
") Covert Code (previously known as Currency Messenger System 1) COVERT CODE INDICATORS Covert Code uses 5 different indicators Mes Signal 1 Indicator which gives you buy and sell arrow signal on the screen.
Covert Code (previously known as Currency Messenger System 1) COVERT CODE INDICATORS Covert Code uses 5 different indicators Mes Signal 1 Indicator which gives you buy and sell arrow signal on the screen.
On Our Technical Watch
 By the Kenanga Research Team l research@kenanga.com.my Figure 1: Daily Charting FBMKLCI Basic Data Technical Ratings 52-week High 1,729.13 (in Million) 52-week Low 1,600.92 KLCI Vol 99.25 Current Level
SXXP and SX5E nearing their downtrends. Gold remains a short in line with the trend. Dollar index at key support. EURUSD bearish candle
 Andy Dodd MSTA - +44 020 7031 4651 adodd@louiscapital.com Twitter : @louiscaptech SXXP and SX5E nearing their downtrends. Gold remains a short in line with the trend Dollar index at key support EURUSD
On Our Technical Watch
 By the Kenanga Research Team l research@kenanga.com.my Figure 1: Daily Charting FBMKLCI Basic Data 52-week High 1,729.13 (in Million) 52-week Low 1,611.88 KLCI Vol 166.34 Current Level 1,708.08 Bursa Vol
BUY SELL PRO. Improve Profitability & Reduce Risk with BUY SELL Pro. Ultimate BUY SELL Indicator for All Time Frames
 BUY SELL PRO Improve Profitability & Reduce Risk with BUY SELL Pro Ultimate BUY SELL Indicator for All Time Frames Risk Disclosure DISCLAIMER: Crypto, futures, stocks and options trading involves substantial
On Our Technical Watch
 By Lawrence Yeo Eng Chien l lawrenceyeo@kenanga.com.my Figure 1: Daily Charting FBMKLCI Basic Data 52-week High 1,795.00 (in Million) 52-week Low 1,611.88 KLCI Vol 136.57 Current Level 1,791.01 Bursa Vol
Copyright 2015 by IntraDay Capital Management Ltd. (IDC)
") Copyright 2015 by IntraDay Capital Management Ltd. (IDC) All content included in this book, such as text, graphics, logos, images, data compilation etc. are the property of IDC. This book or any part thereof
Copyright 2015 by IntraDay Capital Management Ltd. (IDC) All content included in this book, such as text, graphics, logos, images, data compilation etc. are the property of IDC. This book or any part thereof
On Our Technical Watch
 By the Kenanga Research Team l research@kenanga.com.my Figure 1: Daily Charting FBMKLCI Basic Data 52-week High 1,757.99 (in Million) 52-week Low 1,611.88 KLCI Vol 137.65 Current Level 1,754.42 Bursa Vol
DAY TRADING GUIDE TRADE ON EVERY MOVE CATCH ME IF YOU CAN.
 DAY TRADING GUIDE TRADE ON EVERY MOVE CATCH ME IF YOU CAN. RISK WARNING PAST PERFORMANCE DOES NOT INDICATE FUTURE RESULTS. TRADE WITH STRICT MINIMAL MONEY MANAGEMENT TO AVOID PSYCHOLOGICAL EMOTION WHILE
Introduction to Options Part I of III: The Basics
 Webinar Presentation Introduction to Options Part I of III: The Basics Presented by: Trading Strategy Desk 1 Fidelity Brokerage Services, Member NYSE, SIPC, 900 Salem Street, Smithfield, RI 02917. 2016
How to Day Trade for a Living
 How to Day Trade for a Living A Beginner s Guide to Tools and Tactics, Money Management, Discipline and Trading Psychology Andrew Aziz, Ph.D. Founder and Head Trader at Bear Bull Traders DISCLAIMER: The
S&P Cash Long Term: Uptrend Intact. Monthly Log Chart
 Andy Dodd MSTA - +44 020 7031 4651 adodd@louiscapital.com Twitter : @louiscaptech S&P Cash Long Term: Uptrend Intact Despite an initial slowdown in momentum following the break above 2120 in July, which
On Our Technical Watch
 By Lawrence Yeo Eng Chien / lawrenceyeo@kenanga.com.my ; Steven Chan / steven.chan@kenanga.com.my; Muhammad Afif Zulkaplly / muhammad.afif@kenanga.com.my Figure 1: Daily Charting FBMKLCI Basic Data 52-week
On Our Technical Watch
 By the Kenanga Research Team l research@kenanga.com.my Figure 1: Daily Charting FBMKLCI Basic Data Technical Ratings 52-week High 1,729.13 (in Million) 52-week Low 1,600.92 KLCI Vol 93.61 Current Level
Chapter 3. Price Action
 Chapter 3 Price Action The movement of price in any market is called Price Action. This movement is caused by the beliefs and trading systems of hundreds of thousands of worldwide traders that the market
Swing TradING CHAPTER 2. OPTIONS TR ADING STR ATEGIES
 Swing TradING CHAPTER 2. OPTIONS TR ADING STR ATEGIES When do we want to use options? There are MANY reasons to learn options trading and MANY scenarios in which you might trade them When we want leverage
Access to this webinar is for educational and informational purposes only. Consult a licensed broker or registered investment advisor before placing
 Access to this webinar is for educational and informational purposes only. Consult a licensed broker or registered investment advisor before placing any trade. All securities and orders discussed are tracked
Day Trading Strategies. Day Strategies. and Examples. & Risk Management COPYRIGHTED MATERIAL: ANDREW AZIZ (C)
") Day Trading Strategies Day Strategies and Examples & Risk Management ANDREW AZIZ SESSION 4 Disclaimer BearBullTraders.com employees, contractors, shareholders and affiliates, are NOT an investment advisory
Day Trading Strategies Day Strategies and Examples & Risk Management ANDREW AZIZ SESSION 4 Disclaimer BearBullTraders.com employees, contractors, shareholders and affiliates, are NOT an investment advisory
Day Trading with Steve Title goes Lucas here
 Forex System Development Workshop Day Trading with Steve Title goes Lucas here www.fxrenew.com FX Renew Disclaimer The information on this site is not directed at residents in any country or jurisdiction
Part 2: ASX charts - more charting tools. OHLC / Bar chart
 Part 2: ASX charts - more charting tools OHLC / Bar chart A bar chart simply takes the information from the day's trading and plots that information on a single vertical 'bar'. A tab on the left side of
The Bull Call Spread. - Debit Spread - Defined Risk - Defined Reward - Mildly Bullish
 The Bull Call Spread - Debit Spread - Defined Risk - Defined Reward - Mildly Bullish 1. Bull Call Spread 1.1 General Nature & Characteristics The bull call spread is a long vertical spread made up entirely
The truth behind commonly used indicators
 Presents The truth behind commonly used indicators Pipkey Report Published by Alaziac Trading CC Suite 509, Private Bag X503 Northway, 4065, KZN, ZA www.tradeology.com Copyright 2014 by Alaziac Trading
Contents. Related Links. QNBFS Home Page QNBFS Trading Portal QNBFS Research Page
 QNBFS Technical Technical Spotlight Spotlight Wednesday, Sunday, January July 14, 04, 2018 Contents Saudi Market (TADAWUL)... 2 Boursa Kuwait... 3 Abu Dhabi Exchange... 4 Dubai Financial Market... 5 Definitions...
Index. Chaikin Money Flow (CMF), 59 chartists, 32 33, 44 confirmation, 31, contrarian trading, 4, 29
, 59 chartists, 32 33, 44 confirmation, 31, contrarian trading, 4, 29") Notes Introduction 1. High-Frequency Trading, New York Times, October 10, 2011. 2. Securities and Exchange Commission (SEC) at www.sec.gov/answers/ pumpdump.htm. 1 Options: Trading Basics 1. In future
Notes Introduction 1. High-Frequency Trading, New York Times, October 10, 2011. 2. Securities and Exchange Commission (SEC) at www.sec.gov/answers/ pumpdump.htm. 1 Options: Trading Basics 1. In future
How to Trade Options Using VantagePoint and Trade Management
 How to Trade Options Using VantagePoint and Trade Management Course 3.2 + 3.3 Copyright 2016 Market Technologies, LLC. 1 Option Basics Part I Agenda Option Basics and Lingo Call and Put Attributes Profit
Investing Using Call Debit Spreads
 Investing Using Call Debit Spreads Strategies for the equities investor and directional trader I use options to take long positions in equities that I believe will sell for more in the future than today.
On Our Technical Watch
 By the Kenanga Research Team l research@kenanga.com.my Figure 1: Daily Charting FBMKLCI Basic Data 52-week High 1,759.76 (in Million) 52-week Low 1,611.88 KLCI Vol 140.99 Current Level 1,738.18 Bursa Vol
Market Observations as of Mar 2, 2018
 Market Observations as of Mar 2, 2018 By Carl Jorgensen - For Objective Traders - For educational purposes only. Not Financial Advice. The markets were mixed this week as volatility raised its head back