(c) Copyright
|
|
|
- Jordan Wilcox
- 5 years ago
- Views:
Transcription
1 PDFaid.Com #1 Pdf Solutions How to Use Yahoo Chart? Based on swing High/Low This strategy is for those who take several positions everyday and their trading style is scalping type, in high quantity is traded for the small move in nifty. This method of trading uses the pre-fed orders in the direction of the stochastic. Long trade entry and exitrules: Buy rule : place buy order at recent swing high+5 points (when rsi & stochastic are moving up.) Sell rule : Place sell order at buy price + one step* of chart {* one step: This is one of the great feature of the yahoo chart that it automatically expands when the volatility increases and the distance between two horizontal lines in the grid is refered as the one step).. Note: Add or substract the difference betweent the spot and future prices in order prices, the chart shows the spot nifty prices These trades are illustrated below.

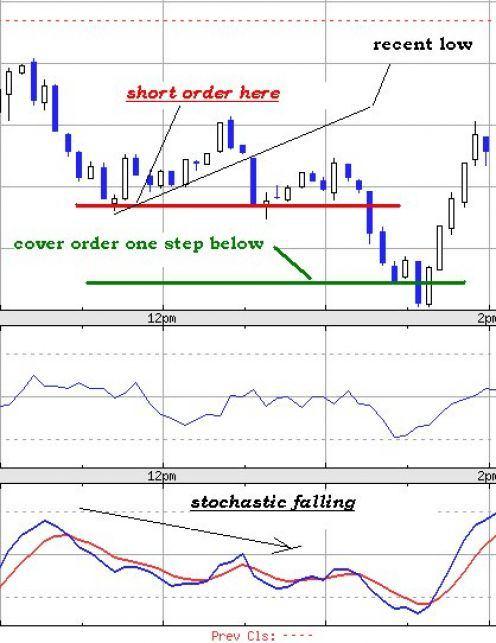
2 Short trade entry and exitrules: short rule : place short order at recent swing low-5points when rsi & stochastic are moving down. cover rule : Place cover order atshort price - one step* of chart {* one step: This is one of the great feature of the yahoo chart that it automatically expands when the volatility increases and the distance between two horizontal lines in the grid is refered as the one step).. Note: Add or substract the difference betweent the spot and future prices in order prices, the chart shows the spot nifty prices These trades are illustrated below
3
Stoploss: As soon as you get the position ( buy/short order executed) apply a stoploss of one step below/above the entry price.")
4 Some key tips to follow this system: 1)Always trade in the direction of main trend, you can trade the reactions also but the chances of hit and miss are more if you are trading in the direction opposite to the main trend. 2)Stoploss: As soon as you get the position ( buy/short order executed) apply a stoploss of one step below/above the entry price. 3)Avoid the choppy days, you can identify the choppy day when the size on one step is 5 points only 4)Never think that I will enter when the high/low is crossed, you will never get the price, because the break of that price cause the jerk move in the nifty. 5)Feed also sell/cover order at the same time. Don t decide to exit manually, this will include the emotional interference in the trading. 6)Use higher quantities so as to make good profit. 7)Avoid trader after 2:30 pm, more chance of hit and miss case. AVOID TRADING THE CHOPPY DAY (MORE CHANCE OF HIT AND MISS)

5 Based on Rsi and Stochastic This strategy is for those who take few positions everyday and their trading style is swing type. This method (c) of Copyright trading uses the principle of entry based on the stochastic crossing and exit based on the rsi. In order to cover all the market situations the rules are further classified into two different trading days. One is normal day in which there is buying as well as selling surges, such day is identified by the move below 1.5% on positive or negative side. Other is the abnormal day in which the market moves in one direction under high buying or selling pressure, these days i call abnormal days and can be identified when the market riser or falls above 1.5% on either side. There are two set of rules to trade these two different scenerios. A)RULES FOR NORMAL DAYS (move less than 1.5%) Long trade entry and exitrules: Buy rule : Buy nifty future when the stochastic crosses (blue line above red line) and crossing is below 20 ( Ignore crossing above 20) Sell rule : sell nifty future when the rsi touches the80 line. Trading using this rule is illustrated using chart below.
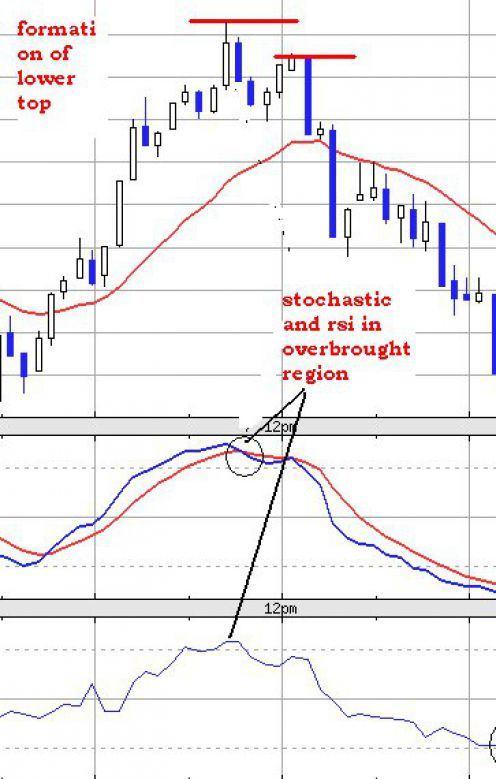
6 SHORT trade entry and exitrules: Short rule : Short nifty future when the stochastic crosses (red line above blue line) and crossing is above 80 ( Ignore crossing above 800) Sell rule : sell nifty future when the rsi starts diverging down.
 For such days the normal rules cannot be applied because buying or selling pressure is so high that stochastic and rsi may not reach the overbouth/oversold levels, hence these rules are a bit")
7 B) RULES FOR TRADING ABNORMAL DAYS ( BIG MOVES above ±1.5%) For such days the normal rules cannot be applied because buying or selling pressure is so high that stochastic and rsi may not reach the overbouth/oversold levels, hence these rules are a bit modified for such days. Generally in days of such moves we see big gap up or gap down in the market, so no problem in identifying these days. Only one modification in the rule stated above that the crossing in-between 20 and 80 is also considered and exit is based on rsi divergence Long position rules Buy rule : Buy nifty future when the stochastic crosses (blue line above red line) And stochastic below 50. Sell rule : sell nifty future when the rsi starts diverging up. SHORT position rules SHORT rule : Short nifty future when the stochastic crosses (red line above blue line) And stochastic above 50. cover rule : cover nifty future when the rsi starts diverging down.

8 few such trades are shown below Based on Wave Pattern After having years trading the nifty intraday, i have spotted certain behavioural patterns of nifty, and days after days the same history is repeated for the reversals. This is a bit safe strategy and to play only when the reversal occurs from the overbought or oversold state. As a thumb rule i have observed that generally the reversals in nifty takes place on TUESDAY and THURSDAY, and on other days generally the previous trend is followed. I say generally means this is not rule but just analysis from several intraday charts i collected over years. Well whenever the reversal may take place i am going to elaborate you how to spot the reversal and get benefited from it. A) Bullish reversal in Nifty : During intraday when the market crashes and the stochastic and rsi are both in the bottom region, when you spot a long candle it shows the exhausting of the bearish trend and it is the first indication that reversal may occur. But we can not take the chance, so in order to confirm the reversal we watch the pattern. The wave 1-2 is a sharp surge wave and then the market makes the higher bottom, This is the exact entry point. According to Elliott, the reactive wave of the first wave is about 38%,50% or

9 max 61% of the first wave. And if you spot that the reactive wave of first wave is not falling below 61%, then you should enter long at that poing. The point is graphically illustrated in chart below, Now when you spotted the exact situation here is how to enter, place stoploss and the target prices...
 There is formation of higher bottom 3) The reactive wave is not less than 60% of the first")
10 TO Sum-Up we will go long when, 1) we see long candle when the stochastic and rsi are below 20, 2) There is formation of higher bottom 3) The reactive wave is not less than 60% of the first wave.
11 Then we will go long and then, 1) Place stoploss at previous swing low ( start of wave 1) 2) Place target order at 1.60 * height of first wave/ go on moving the trailing stoploss up and up. a) Bearish reversal in Nifty : During intraday when the market rises and the stochastic and rsi are both in the top region, when you spot a long candle it shows the exhausting of the bullish trend and it is the first indication that reversal may occur. But we can not take the chance, so in order to confirm the reversal we watch the pattern. The wave 1-2 is a sharp down wave and then the market makes the lower high, This is the exact entry point. According to Elliott, the reactive wave of the first wave is about 38%,50% or max 61% of the first wave. And if you spot that the reactive wave of first wave is not falling below 61%, then you should enter short position at that point. The point is graphically illustrated in chart below,
12
13 Other rules remain the same about stoploss and the target but just in reverse direction. I wish to make it clear that such conditions may not occur daily and to spot them you will need patience and experience. This is the most reliable strategy in respet to risk to reward ratio as compared to other two.
Icoachtrader Consulting Service WELCOME TO. Trading Boot Camp. Day 5
 Icoachtrader Consulting Service www.icoachtrader.weebly.com WELCOME TO Trading Boot Camp Day 5 David Ha Ngo Trading Coach Phone: 1.650.899.1088 Email: icoachtrader@gmail.com The information presented is
Williams Percent Range
 Williams Percent Range (Williams %R or %R) By Marcille Grapa www.surefiretradingchallenge.com RISK DISCLOSURE STATEMENT / DISCLAIMER AGREEMENT Trading any financial market involves risk. This report and
Fast Track Stochastic:
 Fast Track Stochastic: For discussion, the nuts and bolts of trading the Stochastic Indicator in any market and any timeframe are presented herein at the request of Beth Shapiro, organizer of the Day Traders
MAGIC FOREX DIVERGENCE Trading Guide
 Tim Trush & Julie Lavrin Introducing MAGIC FOREX DIVERGENCE Trading Guide Your guide to financial freedom. Tim Trush, Julie Lavrin, T&J Profit Club, 2017, All rights reserved www.forexmystery.com Table
INTERMEDIATE EDUCATION GUIDE
 INTERMEDIATE EDUCATION GUIDE CONTENTS Key Chart Patterns That Every Trader Needs To Know Continution Patterns Reversal Patterns Statistical Indicators Support And Resistance Fibonacci Retracement Moving
Technicals & Time Frame
 Advanced Charting Neither Better Trades or any of its personnel are registered broker-dealers or investment advisers. I will mention that I consider certain securities or positions to be good candidates
Bollinger Bands Forex Trading Strategy With 20 Period Moving Average
 Bollinger Bands Forex Trading Strategy With 20 Period Moving Average The bollinger bands forex trading strategy with 20 period moving average is a very simple forex strategy that works very well for all
Trade Setups, Rules & Trading Strategies
 Trade Setups, Rules & Trading Strategies dba of FreeTradingVideos.com, Inc. v.1411 Using Technical Analysis to Enter, Manage and Exit Trades Quote of the Day At Grok Trade, we do not trade Trading Patterns.
Test Your Chapter 1 Knowledge
 Self-Test Answers Test Your Chapter 1 Knowledge 1. Which is the preferred chart type in LOCKIT? The preferred chart type in LOCKIT is the candle chart because candle patterns are part of the decision-making
Swing Trading Strategies that Work
 Swing Trading Strategies that Work Jesse Livermore, one of the greatest traders who ever lived once said that the big money is made in the big swings of the market. In this regard, Livermore successfully
presented by Thomas Wood MicroQuant SM Divergence Trading Workshop Day One Black Gold
 presented by Thomas Wood MicroQuant SM Divergence Trading Workshop Day One Black Gold Risk Disclaimer Trading or investing carries a high level of risk, and is not suitable for all persons. Before deciding
- My 4 Favorite Trades - Essential Trades of a Professional Trader
 presented by Thomas Wood MicroQuant SM Divergence Trading Workshop Day One - My 4 Favorite Trades - Essential Trades of a Professional Trader Risk Disclaimer Trading or investing carries a high level of
NEWSLETTER SWING TRADING. 28 Feb Intelligent Analysis to point your decisions in the right direction
 NEWSLETTER 28 Feb 2018 Intelligent Analysis to point your decisions in the right direction SWING TRADING Newsletter contains index, stocks and sector recommendations along with market outlook. It also
How To Limit Losses & Let Profits Run. Presented by: Darrell Martin Updated
 How To Limit Losses & Let Profits Run Updated 5-28-2013 Presented by: Darrell Martin www.apexinvesting.com www.apexinvesting.com 2012 2012 Apex Apex Investing Institute LLC LLC All All Right Right Reserved
Trading the Hidden Divergence. Presented by Sunil Mangwani
 Trading the Hidden Divergence Indicators in technical analysis. Indicators along with chart patterns, trend lines, resistance / support levels etc., are an essential part of technical analysis. But there
Instruction (Manual) Document
 Document") Instruction (Manual) Document This part should be filled by author before your submission. 1. Information about Author Your Surname Your First Name Your Country Your Email Address Your ID on our website
Instruction (Manual) Document This part should be filled by author before your submission. 1. Information about Author Your Surname Your First Name Your Country Your Email Address Your ID on our website
Technical Analysis. Used alone won't make you rich. Here is why
 Technical Analysis. Used alone won't make you rich. Here is why Roman sadowski The lesson to take away from this part is: Don t rely too much on your technical indicators Keep it simple and move beyond
Best Strategies for Trading Binary Options
 Best Strategies for Trading Binary Options Binary Options Trading Overview 5 Most Successful Strategies Course Info Free Strategy Binary Options Trading Basics: - Basically, binary options trading involves
Multi Indicator Usage Concepts 4/1/2012 Brooky-Indicators.com Brooky
 Multi Indicator Usage Concepts www.brooky-indicator.com 4/1/2012 Brooky-Indicators.com Brooky U.S. Government Required Disclaimer Commodity Futures Trading Commission Futures, Currency and Options trading
Compiled by Timon Rossolimos
 Compiled by Timon Rossolimos - 2 - The Seven Best Forex Indicators -All yours! Dear new Forex trader, Everything we do in life, we do for a reason. Why have you taken time out of your day to read this
 1 www.candlecharts.com 2 BONUS www. candlecharts.com/special/swing-trading-2/ 3 www. candlecharts.com/special/swing-trading-2/ 4 www. candlecharts.com/special/swing-trading-2/ 5 www. candlecharts.com/special/swing-trading-2/
Gambit Trading Suite Setup Guide. V2.31 PUBLIC BETA March 2017
 Gambit Trading Suite Setup Guide V2.31 PUBLIC BETA March 2017 Gambit Trading Suite - Intro The Gambit Trading Suite is a set of indicators developed in Pine script to be used on Tradingview.com. The goal
Bollinger Trading Methods. Play 1 - The Squeeze
 Overview: Play 1 - The Squeeze Play 2 - The Trend Trade Play 3 - Reversals Wrap up Bollinger Trading Methods Play 1 - The Squeeze The Squeeze The most popular strategy Looks to enter a trend early on Anticipates
Naked Trading and Price Action
 presented by Thomas Wood MicroQuant SM Divergence Trading Workshop Day One Naked Trading and Price Action Risk Disclaimer Trading or investing carries a high level of risk, and is not suitable for all
Adding longs in the SPX zone will be well-rewarded longer term we believe.
 Executive Summary Last week we found, based on our analyses of the charts: Our SPX2146-2069 target zone remains and can now be narrowed down to SPX2117-2069, as the S&P500 closed at SPX2128 yesterday,
Implications of the peaking dollar on US Stock & Bonds
 August 29, 2014 Implications of the peaking dollar on US Stock & Bonds Dollar plunges against every major currency The US Dollar is peaking intermediate-term, the implications of its subsequent dramatic
Three Techniques for Spotting Market Twists and Turns. Riding the Roller
 Three Techniques for Spotting Market Twists and Turns Riding the Roller Coaster Learn to Spot the Twists and Turns Whether you re new to forex or you ve been trading a while, you know how the unexpected
Advance Certificate in Trading : A PROGRAM FOR SELF-INVESTORS
 Advance Certificate in Trading : A PROGRAM FOR SELF-INVESTORS [Stock Commodity-Forex] Duration: 4 Months Fee: 33,000 + Service Tax Training: Weekends / Weekdays Certifications: Certified Trader Certificate
Real-time Analytics Methodology
 New High/Low New High/Low alerts are generated once daily when a stock hits a new 13 Week, 26 Week or 52 Week High/Low. Each second of the trading day, the stock price is compared to its previous 13 Week,
charts to also be in the overbought area before taking the trade. If I took the trade right away, you can see on the M1 chart stochastics that the
 When you get the signal, you first want to pull up the chart for that pair and time frame of the signal in the Web Analyzer. First, I check to see if the candles are near the outer edge of the Bollinger
BONUS. www. candlecharts.com/special/swing-trading-2/
 BONUS www. candlecharts.com/special/swing-trading-2/ 1 www. candlecharts.com/special/swing-trading-2/ www. candlecharts.com/special/swing-trading-2/ www. candlecharts.com/special/swing-trading-2/ 2 www.
BUY SELL PRO. Improve Profitability & Reduce Risk with BUY SELL Pro. Ultimate BUY SELL Indicator for All Time Frames
 BUY SELL PRO Improve Profitability & Reduce Risk with BUY SELL Pro Ultimate BUY SELL Indicator for All Time Frames Risk Disclosure DISCLAIMER: Crypto, futures, stocks and options trading involves substantial
Explanation of the 5 / 15-Minute Trading Rules
 5 / 15-Minute Trading Rules 1 Explanation of the 5 / 15-Minute Trading Rules Trading during the first ½ hour of the day can be very tricky and if one were able to gather all of the statistics for retail
RISK DISCLOSURE STATEMENT / DISCLAIMER AGREEMENT
 RISK DISCLOSURE STATEMENT / DISCLAIMER AGREEMENT Trading any financial market involves risk. This report and all and any of its contents are neither a solicitation nor an offer to Buy/Sell any financial
MULTI-TIMEFRAME TREND TRADING
 1. SYNOPSIS The system described is a trend-following system on a slow timeframe that uses optimized (that is, contrarian) entries and exits on a fast timeframe at the tops and bottoms of retraces against
1. Introduction 2. Chart Basics 3. Trend Lines 4. Indicators 5. Putting It All Together
 Technical Analysis: A Beginners Guide 1. Introduction 2. Chart Basics 3. Trend Lines 4. Indicators 5. Putting It All Together Disclaimer: Neither these presentations, nor anything on Twitter, Cryptoscores.org,
Technical Analysis. Used alone won't make you rich. Here is why
 Technical Analysis. Used alone won't make you rich. Here is why Roman Sadowski The lesson to take away from this part is: Don t rely too much on your technical indicators Keep it simple and move beyond
The Art & Science of Active Trend Trading
 Candlesticks Looking for U-Turns The Art & Science of Active Trend Trading Copywrite ATTS 2007-2015 1 Disclaimer U.S. Government Required Disclaimer Commodity Futures Trading Commission Futures and Options
Table of Contents. Risk Disclosure. Things we will be going over. 2 Most Common Chart Layouts Anatomy of a candlestick.
 Table of Contents Risk Disclosure Things we will be going over 2 Most Common Chart Layouts Anatomy of a candlestick Candlestick chart Anatomy of a BAR PLOT Indicators Trend-Lines Volume MACD RSI The Stochastic
Candlesticks Discoveries Probability of Success Aug 6, 2016
 Candlesticks Discoveries Probability of Success Aug 6, 2016 The Art & Science of Active Trend Trading Disclaimer U.S. Government Required Disclaimer Commodity Futures Trading Commission Futures and Options
Intra-Day Trading Techniques
 Pristine.com Presents Intra-Day Trading Techniques With Greg Capra Co-Founder of Pristine.com, and Co-Author of the best selling book, Tools and Tactics for the Master Day Trader Copyright 2001, Pristine
presented by Thomas Wood MicroQuant SM Divergence Trading Workshop Day One Naked Trading Part 2
 presented by Thomas Wood MicroQuant SM Divergence Trading Workshop Day One Naked Trading Part 2 Risk Disclaimer Trading or investing carries a high level of risk, and is not suitable for all persons. Before
RISK DISCLOSURE STATEMENT / DISCLAIMER AGREEMENT
 RISK DISCLOSURE STATEMENT / DISCLAIMER AGREEMENT Trading any financial market involves risk. This report and all and any of its contents are neither a solicitation nor an offer to Buy/Sell any financial
TDP-Academy Trading SetupGuide
 TDP-Academy Trading SetupGuide Version 1.1. March 2017 Author: Boris Nikolajew & Wiktor Majorkiewicz INDEX 1. Foreword 2. Charts 3. Timeframes 4. Indicators 5. Drawings 6. Chartpatterns 7. Analyzing the
 www.forexschoolonline.com CHECKLIST 7 Rules to a High Probability A+ Trade - CHECKLIST The checklist is below; Below the checklist is a detailed explanation of each point. You can also download the checklist
How I Trade Profitably Every Single Month without Fail
 How I Trade Profitably Every Single Month without Fail First of all, let me take some time to introduce myself to you. I am Koon Hwee (KH Lee) and I am a full time currency trader. I have a passion for
Technical Analysis Indicators
 Technical Analysis Indicators William s Percent R Rules, Scans, Adding Filters, Breakout, Retest, and Application across MTFs Course Instructor: Price Headley, CFA, CMT BigTrends Coaching Access to BigTrends
Market Mastery Protégé Program Method 1 Part 1
 Method 1 Part 1 Slide 2: Welcome back to the Market Mastery Protégé Program. This is Method 1. Slide 3: Method 1: understand how to trade Method 1 including identifying set up conditions, when to enter
Day Trade Warrior. Chapter 5. Intraday Chart Patterns
 Day Trade Warrior Chapter 5. Intraday Chart Patterns What do we know? We have learned about Managing Risk (2:1 profit loss ratio 50% success target) We have learned how to find the Right Stocks (high relative
13 April US Equity Indices: the land of the bearish rising wedge. Walter Zimmermann United ICAP. US Equity Indices 13 Apr
 - 1-13 April 2015 : the land of the bearish rising wedge Walter Zimmermann United ICAP The market commentary contained in this document represents the opinions of the author. Such opinions are subject
NEWSLETTER SWING TRADING. 12 Apr Intelligent Analysis to point your decisions in the right direction
 NEWSLETTER 12 Apr 2018 Intelligent Analysis to point your decisions in the right direction SWING TRADING Newsletter contains index, stocks and sector recommendations along with market outlook. It also
Fundamental Analysis is the study of Financial Statements and Ratios which help evaluate a company s overall Value and Growth potential.
 Trading vs. Investing Investing is defined as taking a stake in a company in hopes of benefiting from their prosperity through price appreciation and dividend payouts. Fundamental Analysis is the study
STATISTICAL INDICATOR
 STATISTICAL INDICATOR FOREX LIBRA CODE This short manual aims to explain how to use and apply the Statistical indicator which is part of the Forex Libra Code software. The Statistical indicator is available
CONNECING THE DOTS Candlesticks & Convergence of Clues. The Art & Science of Active Trend Trading
 CONNECING THE DOTS Candlesticks & Convergence of Clues The Art & Science of Active Trend Trading Disclaimer U.S. Government Required Disclaimer Commodity Futures Trading Commission Futures and Options
WORKBOOK. The FX Trader s EDGE BLUEPRINT ENCORE EVENT. How to Capture Low Hanging Profits in the New Year Using 3 Simple Blueprints
 WORKBOOK The FX Trader s EDGE BLUEPRINT ENCORE EVENT How to Capture Low Hanging Profits in the New Year Using 3 Simple Blueprints Jody Samuels, Juan Maldonado and Neil Bradford Disclaimer This workbook
Forex Advantage Blueprint
 Forex Advantage Blueprint Complimentary Report!! www.forexadvantageblueprint.com Copyright Protected www.forexadvantageblueprint.com - 1 - Limits of liability/disclaimer of Warranty The author and publishers
Chapter 2.3. Technical Indicators
 1 Chapter 2.3 Technical Indicators 0 TECHNICAL ANALYSIS: TECHNICAL INDICATORS Charts always have a story to tell. However, sometimes those charts may be speaking a language you do not understand and you
Chapter 2.3. Technical Analysis: Technical Indicators
 Chapter 2.3 Technical Analysis: Technical Indicators 0 TECHNICAL ANALYSIS: TECHNICAL INDICATORS Charts always have a story to tell. However, from time to time those charts may be speaking a language you
The Art & Science of Active Trend Trading
 CONNECTING THE DOTS Candlesticks & Convergence of Clues The Art & Science of Active Trend Trading Copyright ATTS 2007-2015 1 Dennis W. Wilborn, P.E. Founder, President Active Trend Trading dww@activetrendtrading.com
DAILY DAY TRADING PLAN
 DAILY DAY TRADING PLAN Gatherplace will be used to place all of your trades. You will be using the 5 minute chart for the trade setup and the 1 minute chart for your entry, stop and trailing stop.you will
TRADE LIKE A HEDGE FUND. Layman s Guide to Pair Trading
 TRADE LIKE A HEDGE FUND Layman s Guide to Pair Trading Table of Contents 1. Introduction to Pair Trading... 3 2. History and Growth of Pair Trading... 4 3. The Basics of Pair Trading... 5 4. The Application
Technical Analysis and Charting Part II Having an education is one thing, being educated is another.
 Chapter 7 Technical Analysis and Charting Part II Having an education is one thing, being educated is another. Technical analysis is a very broad topic in trading. There are many methods, indicators, and
FOREX TRADING STRATEGIES.
 FOREX TRADING STRATEGIES www.ifcmarkets.com www.ifcmarkets.com 2 One of the most powerful means of winning a trade is the portfolio of Forex trading strategies applied by traders in different situations.
Profiting. with Indicators. By Jeff Drake with Ed Downs
 Profiting with Indicators By Jeff Drake with Ed Downs Profiting with Indicators By Jeff Drake with Ed Downs Copyright 2018 Nirvana Systems Inc. All Rights Reserved The charts and indicators used in this
NetPicks Keltner Bells
 Page 1 NetPicks Keltner Bells NetPicks, LLC HYPOTHETICAL PERFORMANCE RESULTS HAVE MANY INHERENT LIMITATIONS, SOME OF WHICH ARE DESCRIBED BELOW. NO REPRESENTATION IS BEING MADE THAT ANY TRADING ACCOUNT
Gold, Mining Stocks on the Verge of a Major Bull Market
 Gold, Mining Stocks on the Verge of a Major Bull Market By Robert McHugh, Ph.D. In looking at the charts for Gold, Silver and Mining Stocks, it is clear that patterns and wave mappings suggest a bottom
Active Trend Trading Rules Review
 Active Trend Trading Rules Review Active Trend Trader: Dennis W. Wilborn A Trend Should Be Assumed to Continue in Effect Until Such Time as Its Reversal Has Been Definitely Signaled Edwards & Magee Disclaimer
For general trading knowledge, please get a beginners guide or simply got to :
 www.forexripper.com About The System For general trading knowledge, please get a beginners guide or simply got to : www.babypips.com For more interactive information about the market, there are hundreds
Trend Channels: How to Identify Easy Profit-Making Opportunities Using Simple Chart Analysis
 Trend Channels: How to Identify Easy Profit-Making Opportunities Using Simple Chart Analysis Trend channels produce a very powerful trading technique. They are very visible, which makes them easy to utilize
Introduction 3. Charts: line, bar and candle 4. Critical price levels 6
 Contents page Introduction 3 Charts: line, bar and candle 4 Critical price levels 6 Resistance, support and pivot points 6 Definitions 6 Reasoning 7 Pivot points 8 Fibonacci retracements 9 Relative Strength
Weekly outlook for Aug. 27 Aug. 31, 2018
 Weekly outlook for Aug. 27 Aug. 31, 2018 Summary The S&P500 index is expected to have a monthly adjustment move this week, the volatility expected to be high, and price could have a big swing move. Oil
50 Pips A Day Forex Strategy. How To Build A Solid Trading System. By Laurentiu Damir. Copyright 2012 by Laurentiu Damir
 50 Pips A Day Forex Strategy How To Build A Solid Trading System By Laurentiu Damir Copyright 2012 by Laurentiu Damir All rights reserved. No part of this book may be reproduced or transmitted in any form
The first trades, leading up to the Friday that has rapidly become infamous in the trading world, were published on FXStreet.
 The UK s Brexit Referendum Trades in Review By Kaye Lee, Head Trader Consultant, www.straighttalktrading.com Cycle Trades Before and During the Big Bang As the week after the British referendum on Brexit
The Art & Science of Active Trend Trading
 CONNECTING THE DOTS Candlesticks & Convergence of Clues The Art & Science of Active Trend Trading Copywrite ATTS 2007-2015 1 Dennis W. Wilborn, P.E. Founder, President Active Trend Trading dww@activetrendtrading.com
PRESENTS. COG Master Strategy. Trading Forex Using the Center Of Gravity Master Strategy. Wesley Govender
 PRESENTS COG Master Strategy Trading Forex Using the Center Of Gravity Master Strategy Copyright 2013 by Old Tree Publishing CC, KZN, ZA Wesley Govender Reproduction or translation of any part of this
CHARTS. Bar Line Candlestick Charts are the basis of technical analysis They are a graphic display of price action. Notes:
 TECHNICAL ANALYSIS CHARTS Bar Line Candlestick Charts are the basis of technical analysis They are a graphic display of price action Candlestick charts have become the industry standard for technical traders.
Technical analysis & Charting The Foundation of technical analysis is the Chart.
 Technical analysis & Charting The Foundation of technical analysis is the Chart. Charts Mainly there are 2 types of charts 1. Line Chart 2. Candlestick Chart Line charts A chart shown below is the Line
I prefer to use the CCI indicator to trade divergences and it has worked well for me over the past 10 years.
 Make 100 pips Trading Divergences. There are several ways to trade divergences and several indicators that can help you identify the divergence between price and the indicator itself. I prefer to use the
Our aim at S.T.I. is to make Technical Analysis as simple and uncomplicated as possible.
 By MPFX Our aim at S.T.I. is to make Technical Analysis as simple and uncomplicated as possible. We will try to explain the concepts of each indicator in Plain English and include examples where possible.
Trade Ideas A.I. Strategy Descriptions Revised : 10/04/2017
 Trade Ideas A.I. Strategy Descriptions Revised : 10/04/2017 The 5 Day Bounce The trigger for this alert has to cross above resistance while also making a 60 minute high on stocks that are trying to bounce
When traders make trading decisions based on repeated price patterns that once formed,
 Trading Strategy / Gert.Nurme@iBrokers.ee Price Action Trading Strategy Introduction WHAT IS PRICE ACTION TRADING? When traders make trading decisions based on repeated price patterns that once formed,
MR. MUHAMMAD AZEEM - PAKISTAN
 HTTP://WWW.READYFOREX.COM MR. MUHAMMAD AZEEM - PAKISTAN How to become a successful trader? How to win in forex trading? What are the main steps and right way to follow in trading? What are the rules to
TRADING DOWN GAPS By Daryl Guppy
 TRADING DOWN GAPS By Daryl Guppy This reprinted article uses a Marketcast screen. This is now easily obtained via any of the CFD providers with live feeds. The trading method remains valid and is now easier
Inverse ETFs & shorts are set to FLY!
 Friday, Nov 6, 2015 Inverse ETFs & shorts are set to FLY! In the Big Picture Bear Market, you will note that bearish legs A & C since 2000, have initiated with this echoing Diag II, the same structure
NEWSLETTER SWING TRADING. 26 Feb Intelligent Analysis to point your decisions in the right direction
 NEWSLETTER 26 Feb 2018 Intelligent Analysis to point your decisions in the right direction SWING TRADING Newsletter contains index, stocks and sector recommendations along with market outlook. It also
Additional Reading Material on Technical Analysis
 Additional Reading Material on Relevant for 1. Module 7 (Financial Statement Analysis and Asset Valuation) 2. Module 18 (Securities and Derivatives Trading [Products and Analysis]) Copyright 2017 Securities
Saudi Market (TADAWUL)... 2 Boursa Kuwait... 3 Abu Dhabi Exchange... 4 Dubai Financial Market... 5 Definitions... 6 Contacts... 7.
... 2 Boursa Kuwait... 3 Abu Dhabi Exchange... 4 Dubai Financial Market... 5 Definitions... 6 Contacts... 7.") QNBFS Technical Technical Spotlight Spotlight Thursday, Sunday, January January 14, 10, 2018 2019 Contents Saudi Market (TADAWUL)... 2 Boursa Kuwait... 3 Abu Dhabi Exchange... 4 Dubai Financial Market...
QNBFS Technical Technical Spotlight Spotlight Thursday, Sunday, January January 14, 10, 2018 2019 Contents Saudi Market (TADAWUL)... 2 Boursa Kuwait... 3 Abu Dhabi Exchange... 4 Dubai Financial Market...
EJ_4H Method Part III
 EJ_4H Method Part III Trailing price: Protecting your hard-earned money against reversals or even flurries is one of the most important parts of money management. Most of platforms have such feature that
Lighting the Way: Using Candlestick Patterns. The Art & Science of Active Trend Trading
 Lighting the Way: Using Candlestick Patterns The Art & Science of Active Trend Trading Disclaimer U.S. Government Required Disclaimer Commodity Futures Trading Commission Futures and Options trading has
RISK DISCLOSURE STATEMENT / DISCLAIMER AGREEMENT
 RISK DISCLOSURE STATEMENT / DISCLAIMER AGREEMENT Trading any financial market involves risk. This report and all and any of its contents are neither a solicitation nor an offer to Buy/Sell any financial
Page 1 of 96 Order your Copy Now Understanding Chart Patterns
 Page 1 of 96 Page 2 of 96 Preface... 5 Who should Read this book... 6 Acknowledgement... 7 Chapter 1. Introduction... 8 Chapter 2. Understanding Charts Convention used in the book. 11 Chapter 3. Moving
Intelligent Investing, LLC Major Indices Daily Update 02/26/ 19
 Elliot Wave Updates Yesterday I found a move below last Friday s high (SPX2794.20) will be a first sign of lower prices as then the decline can t be a 4 th wave because 4 th and 1 st waves can t overlap
EZ Trade FOREX Day Trading System. by Beau Diamond
 EZ Trade FOREX Day Trading System by Beau Diamond The EZ Trade FOREX Day Trading System is mainly used with four different currency pairs; the EUR/USD, USD/CHF, GBP/USD and AUD/USD, but some trades are
TOP 3 INDICATOR BOOT CAMP: PERCENT R
 BIGTRENDS.COM TOP 3 INDICATOR BOOT CAMP: PERCENT R PRICE HEADLEY, CFA, CMT Let s Get Started! Educate Understand the tools you have for trading. Learn what this indicator is and how you can profit from
Leveraged Cryptocurrency Trading Course Novice & Intermediate Level
 Leveraged Cryptocurrency Trading Course Novice & Intermediate Level Page 2 Table of Content Introduction...4 Chapter 1 - Introducing the MT4 and the Cryptocurrency Trading Dashboard...5 Chapter 2 - What
Market Observations - as of Aug 17, 2018
 Market Observations - as of Aug 17, 2018 By Carl Jorgensen - For Objective Traders - For educational purposes only. Not Financial Advice. This week we saw a reversal of roles from the prior week. This
Chapter 3.3. Price Patterns
 1 Chapter 3.3 Price Patterns 0 TECHNICAL ANALYSIS: PRICE PATTERNS Traders vote with their chequebooks. If they believe a stock or CFD is going to move higher then they will buy the stock or CFD. If they