The six technical indicators for timing entry and exit in a short term trading program
|
|
|
- Constance Dawson
- 5 years ago
- Views:
Transcription
1 The six technical indicators for timing entry and exit in a short term trading program

2 Definition Technical analysis includes the study of: Technical analysis the study of a stock s price and trends; volume; and momentum. price; price trends; and direction of movement. volume; and how volume interacts with a price trend. momentum, or the speed of change in a stock s price.
3 The six indicators An investor may use any number of technical indicators, but six are essential for anyone trading short term. These are: 1. trading range borders 2. momentum oscillators 3. volume 4. double tops and bottoms 5. gapping price movement 6. head and shoulders


4 1. trading range borders
5 The trading range is Definition Resistance is the highest price where trading has been occurring, representing the highest price that sellers are willing to buy. Support is the lowest price where trading has been occurring, representing the lowest price at which buyers are willing to sell. the area between resistance and support. The range determines how volatile a stock is, and also whether or not trading will begin moving above or below the previous level.
6 Trading range The trading range may take several shapes: level, with resistance and support unchanging over time. rising, with both resistance and support increasing and remaining at the same breadth, or narrowing or widening. falling, with both resistance and support decreasing and remaining at the same breadth, narrowing or widening.
7
8

9 2. momentum oscillators
10 Momentum oscillators A momentum oscillator measures the speed of movement in the price. The oscillator may serve as a leading indicator or as a lagging indicator, compared to price. One popular oscillator is Relative Strength Index (RSI)
11 Momentum oscillators Relative Strength Index (RSI) is a calculated index from zero to 100. When the index moves above 70, it reveals that the stock may be overbought and is likely to reverse and turn downward. When the index is below 30, it reveals that the stock may be oversold and is likely to reverse and turn upward.
12
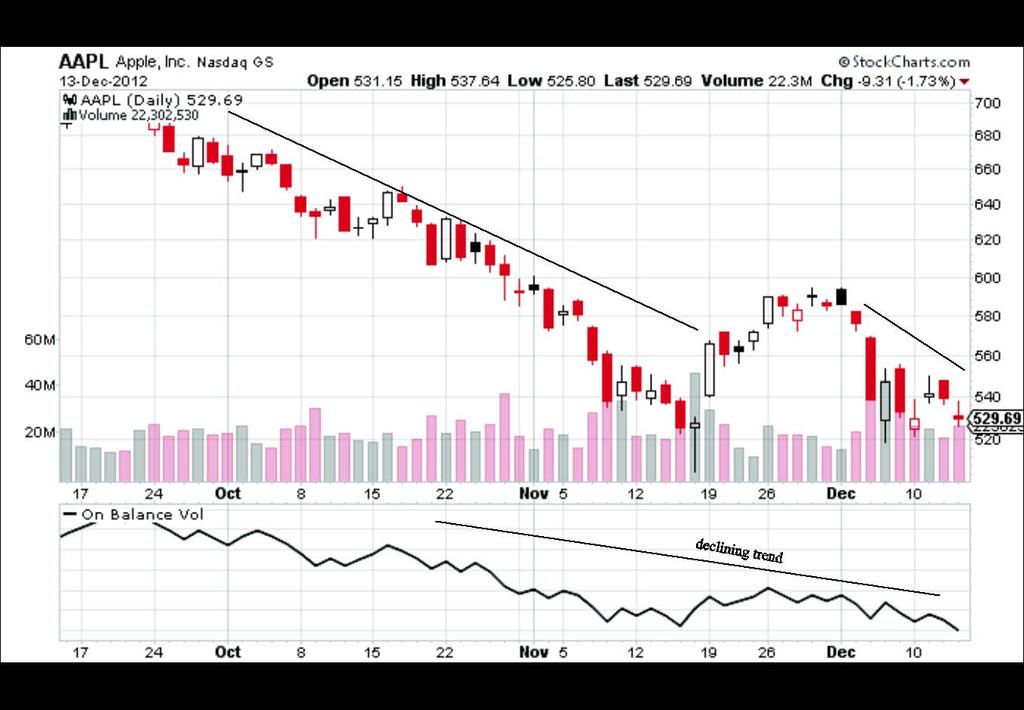
13 3. volume
14 Volume The volume of trading the number of shares bought and sold per day can be very revealing. Many volume indicators are used in technical analysis. These include on balance volume, among others. Traders also look for volume spikes as a signal of possible trend reversal.
15
16

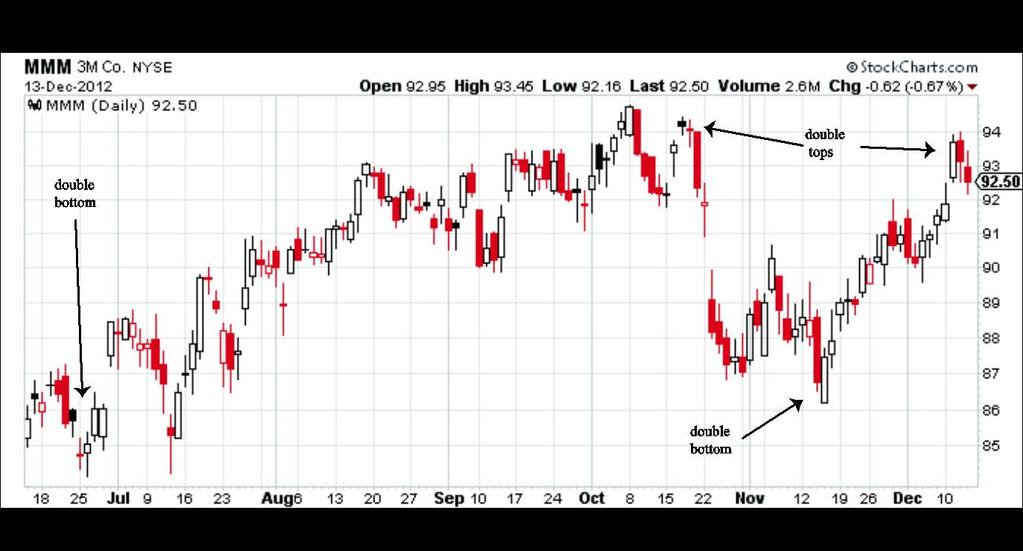
17 4. double tops and bottoms
18 Definition Double tops A price formation with two upward spikes in price that test resistance, fail, and then retreat. Double tops often precede price movement to the downside. Double bottoms A price formation with two downward spikes that test support, fail, and then retreat. Double bottoms often precede price movement to the upside. Double tops and bottoms The formation of distinctive tests of resistance (tops) or support (bottoms). These double signals preceded price movement in the opposite direction and are considered strong technical reversal signals. The failed attempt to breakout above resistance or below support is a sign of lost momentum.
19

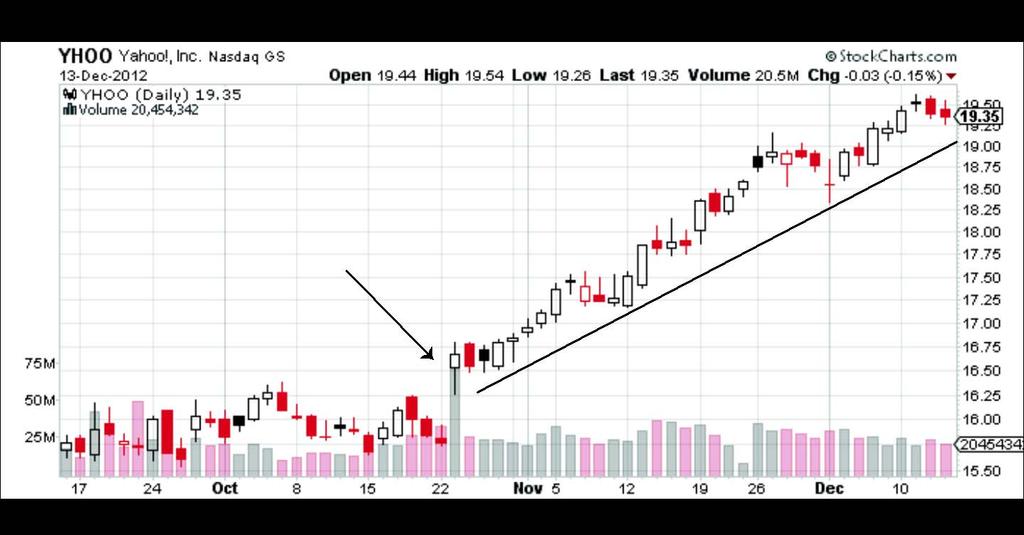
20 5. gapping price movement
21 Gaps A gap is an space between closing prices of one day and opening prices of another. Gaps are important signals of growing volatility and trend acceleration.
22


23 6. head and shoulders

24 Head and shoulders This price formation tests resistance and is followed by a reversal and price decline. It consists of three spikes, two shoulders and a higher head in between. The same pattern can be seen in the inverse, with prices then moving upward and away from support. Definition Head and shoulders a price pattern with three parts, two shoulders on left and right and a middle, higher price representing the head. The formation precedes an opposite trend moving downward. The inverse head and shoulders has the same attributes, but appears at the bottom of the trend and precedes a price movement upward.
25
26 Conclusion Technical indicators are not assurances that promise specific outcomes. They predict the likely next move. Dozens of possible indicators may be used to time entry and exit. Combined with fundamental tests, the technical indicators based on price, volume and momentum add valuable analytical aspects to the selection and timing of trades.
INTERMEDIATE EDUCATION GUIDE
 INTERMEDIATE EDUCATION GUIDE CONTENTS Key Chart Patterns That Every Trader Needs To Know Continution Patterns Reversal Patterns Statistical Indicators Support And Resistance Fibonacci Retracement Moving
Technical analysis & Charting The Foundation of technical analysis is the Chart.
 Technical analysis & Charting The Foundation of technical analysis is the Chart. Charts Mainly there are 2 types of charts 1. Line Chart 2. Candlestick Chart Line charts A chart shown below is the Line
The Technical Edge Page 1. The Technical Edge. Part 1. Indicator types: price, volume, and moving averages and momentum
 The Technical Edge Page 1 The Technical Edge INDICATORS Technical analysis relies on the study of a range of indicators. These come in many specific types, based on calculations or price patterns. For
Chapter 2.3. Technical Analysis: Technical Indicators
 Chapter 2.3 Technical Analysis: Technical Indicators 0 TECHNICAL ANALYSIS: TECHNICAL INDICATORS Charts always have a story to tell. However, from time to time those charts may be speaking a language you
Chapter 2.3. Technical Indicators
 1 Chapter 2.3 Technical Indicators 0 TECHNICAL ANALYSIS: TECHNICAL INDICATORS Charts always have a story to tell. However, sometimes those charts may be speaking a language you do not understand and you
Table of Contents. Risk Disclosure. Things we will be going over. 2 Most Common Chart Layouts Anatomy of a candlestick.
 Table of Contents Risk Disclosure Things we will be going over 2 Most Common Chart Layouts Anatomy of a candlestick Candlestick chart Anatomy of a BAR PLOT Indicators Trend-Lines Volume MACD RSI The Stochastic
Candlestick Signals and Option Trades (Part 3, advanced) Hour One
 Hour One") Candlestick Signals and Option Trades (Part 3, advanced) Hour One 1. Hedges, long and short A hedge is any strategy designed to reduce or eliminate market risk. This applies to equity positions and the
Candlestick Signals and Option Trades (Part 3, advanced) Hour One 1. Hedges, long and short A hedge is any strategy designed to reduce or eliminate market risk. This applies to equity positions and the
Profitable Patterns. Do you believe there are profits to be made in stocks? With the right tools, anyone can make consistent money in stocks.
 Profitable Patterns Do you believe there are profits to be made in stocks? With the right tools, anyone can make consistent money in stocks. Level of RESISTANCE Price per share has NOT been able to "Break
OSCILLATORS. TradeSmart Education Center
 OSCILLATORS TradeSmart Education Center TABLE OF CONTENTS Oscillators Bollinger Bands... Commodity Channel Index.. Fast Stochastic... KST (Short term, Intermediate term, Long term) MACD... Momentum Relative
1. Introduction 2. Chart Basics 3. Trend Lines 4. Indicators 5. Putting It All Together
 Technical Analysis: A Beginners Guide 1. Introduction 2. Chart Basics 3. Trend Lines 4. Indicators 5. Putting It All Together Disclaimer: Neither these presentations, nor anything on Twitter, Cryptoscores.org,
The Most Important Price Action Patterns for Babon Traders
 The Most Important Price Action Patterns for Babon Traders There are dozens of different Price Action formations and Japanese candles' formations, as a matter of fact almost any so called "expert" and
Williams Percent Range
 Williams Percent Range (Williams %R or %R) By Marcille Grapa www.surefiretradingchallenge.com RISK DISCLOSURE STATEMENT / DISCLAIMER AGREEMENT Trading any financial market involves risk. This report and
Additional Reading Material on Technical Analysis
 Additional Reading Material on Relevant for 1. Module 7 (Financial Statement Analysis and Asset Valuation) 2. Module 18 (Securities and Derivatives Trading [Products and Analysis]) Copyright 2017 Securities
Compiled by Timon Rossolimos
 Compiled by Timon Rossolimos - 2 - The Seven Best Forex Indicators -All yours! Dear new Forex trader, Everything we do in life, we do for a reason. Why have you taken time out of your day to read this
Saudi Market (TADAWUL)... 2 Boursa Kuwait... 3 Abu Dhabi Exchange... 4 Dubai Financial Market... 5 Definitions... 6 Contacts... 7.
... 2 Boursa Kuwait... 3 Abu Dhabi Exchange... 4 Dubai Financial Market... 5 Definitions... 6 Contacts... 7.") QNBFS Technical Technical Spotlight Spotlight Sunday, Monday, January March 05, 14, 2018 Contents Saudi Market (TADAWUL)... 2 Boursa Kuwait... 3 Abu Dhabi Exchange... 4 Dubai Financial Market... 5 Definitions...
QNBFS Technical Technical Spotlight Spotlight Sunday, Monday, January March 05, 14, 2018 Contents Saudi Market (TADAWUL)... 2 Boursa Kuwait... 3 Abu Dhabi Exchange... 4 Dubai Financial Market... 5 Definitions...
Test Your Chapter 1 Knowledge
 Self-Test Answers Test Your Chapter 1 Knowledge 1. Which is the preferred chart type in LOCKIT? The preferred chart type in LOCKIT is the candle chart because candle patterns are part of the decision-making
Technical Indicators
 Taken From: Technical Analysis of the Financial Markets A Comprehensive Guide to Trading Methods & Applications John Murphy, New York Institute of Finance, Published 1999 Technical Indicators Technical
Technical Analysis Workshop Series. Session Three
 Technical Analysis Workshop Series Session Three DISCLOSURES & DISCLAIMERS This research material has been prepared by NUS Invest. NUS Invest specifically prohibits the redistribution of this material
Forex Sentiment Report Q2 FORECAST WEAK AS LONG AS BELOW April
 Forex Sentiment Report 08 April 2015 www.ads-securities.com Q2 FORECAST WEAK AS LONG AS BELOW 1.1200 Targets on a break of 1.1534/35: 1.1740/50 1.1870/75 1.2230/35 Targets on a break of 1.0580/70: 1.0160
Homework Assignment #1 - Based on the MTAEF Glossary of Technical Terms
 Homework Assignment #1 - Based on the MTAEF Glossary of Technical Terms Each block of 3 question is preceded by 5 technical terms. Fill in the blank and make the statement complete. There is only one correct
 1 www.candlecharts.com 2 BONUS www. candlecharts.com/special/swing-trading-2/ 3 www. candlecharts.com/special/swing-trading-2/ 4 www. candlecharts.com/special/swing-trading-2/ 5 www. candlecharts.com/special/swing-trading-2/
Technical Analysis and Charting Part II Having an education is one thing, being educated is another.
 Chapter 7 Technical Analysis and Charting Part II Having an education is one thing, being educated is another. Technical analysis is a very broad topic in trading. There are many methods, indicators, and
Trend Channels: How to Identify Easy Profit-Making Opportunities Using Simple Chart Analysis
 Trend Channels: How to Identify Easy Profit-Making Opportunities Using Simple Chart Analysis Trend channels produce a very powerful trading technique. They are very visible, which makes them easy to utilize
CMT LEVEL I CURRICULUM Self-Evaluation
 CMT LEVEL I CURRICULUM Self-Evaluation DEAR CFA CHARTERHOLDER, As a CFA charterholder, the requirement that you sit for the CMT Level I exam is waived. However, the content in the CMT Level I Curriculum
Technical Analysis. Dealing Room Peter Leonidou. Peter Leonidou
 Technical Analysis Dealing Room Questions Traders Should Ask What is the trend? What is the pivot point? What is the support levels? What is the resistance levels? Strong or weaker USD? What 1. Trade
Stock Market Report Review
 January 7, 25 Stock Market Report - 24 Review Market Analysis for Period Ending Friday, December 31, 24 This document presents technical and fundamental analysis commonly used by investment professionals
Saudi Market (TADAWUL)... 2 Boursa Kuwait... 3 Abu Dhabi Exchange... 4 Dubai Financial Market... 5 Definitions... 6 Contacts... 7.
... 2 Boursa Kuwait... 3 Abu Dhabi Exchange... 4 Dubai Financial Market... 5 Definitions... 6 Contacts... 7.") QNBFS Technical Technical Spotlight Spotlight Thursday, Sunday, January January 14, 10, 2018 2019 Contents Saudi Market (TADAWUL)... 2 Boursa Kuwait... 3 Abu Dhabi Exchange... 4 Dubai Financial Market...
QNBFS Technical Technical Spotlight Spotlight Thursday, Sunday, January January 14, 10, 2018 2019 Contents Saudi Market (TADAWUL)... 2 Boursa Kuwait... 3 Abu Dhabi Exchange... 4 Dubai Financial Market...
Part 2: ASX charts - more charting tools. OHLC / Bar chart
 Part 2: ASX charts - more charting tools OHLC / Bar chart A bar chart simply takes the information from the day's trading and plots that information on a single vertical 'bar'. A tab on the left side of
Agenda. Who is Recognia. Event Driven Technical Analysis. Types of Technical Events. Finding and Validating Ideas using Recognia Q & A
 Disclaimer The information presented here is for educational and informational purposes only. The inclusion of any specific securities detailed is for illustrative purposes only. No information contained
MAGIC FOREX DIVERGENCE Trading Guide
 Tim Trush & Julie Lavrin Introducing MAGIC FOREX DIVERGENCE Trading Guide Your guide to financial freedom. Tim Trush, Julie Lavrin, T&J Profit Club, 2017, All rights reserved www.forexmystery.com Table
Schwab Investing Insights Trading Edition Text Close Window Size: November 15, 2007
 Schwab Investing Insights Trading Edition Text Close Window Size: from TheStreet.com November 15, 2007 ON TECHNIQUES Two Indicators Are Better Than One The Relative Strength Index works well but it s better
NIFTY. Momentum oscillator, RSI (14) is in bullish crossover which suggests index momentum to remain on the positive side.
 is in bullish crossover which suggests index momentum to remain on the positive side.") Date: 16 th July 2018 NIFTY The Nifty, which reversed its downwards trend in the previous week has continued rallying during the last week. Moreover, the Index has given a trend-line breakout on the weekly
Date: 16 th July 2018 NIFTY The Nifty, which reversed its downwards trend in the previous week has continued rallying during the last week. Moreover, the Index has given a trend-line breakout on the weekly
Learning Objectives CMT Level I
 Learning Objectives CMT Level I - 2018 An Introduction to Technical Analysis Section I: Chart Development and Analysis Chapter 1 The Basic Principle of Technical Analysis - The Trend Define what is meant
Reversal Candles. Candlestick Bearish Reversal Patterns. Bearish Confirmation. Existing Downtrend
 Candlestick Bearish Reversal Patterns There are dozens of bearish reversal patterns. We have elected to narrow the field by selecting a few of the most popular patterns for detailed explanations. Below
The very first calculations for average gain and average loss are simple 14- period averages.
 Introduction Developed by J. Welles Wilder, the Relative Strength Index (RSI) is a momentum oscillator that measures the speed and change of price movements. RSI oscillates between zero and 100. Traditionally,
Level I Learning Objectives by chapter (2017)
") Level I Learning Objectives by chapter (2017) 1. The Basic Principle of Technical Analysis: The Trend Define what is meant by a trend in Technical Analysis Explain why determining the trend is important
Level I Learning Objectives by chapter (2017) 1. The Basic Principle of Technical Analysis: The Trend Define what is meant by a trend in Technical Analysis Explain why determining the trend is important
Introductory Fundamental and Technical Analysis
 Introductory Fundamental and Technical Analysis Tan Junda junda@uobkayhian.com (65) 6590 6616 Jeffrey Tan jeffreytan@uobkayhian.com (65) 6590 6629 Our Focus Today What kind of investor are you? Technical
Subject: Daily report explanatory notes, page 2 Version: 0.9 Date: Dec 29, 2013 Author: Ken Long
 Subject: Daily report explanatory notes, page 2 Version: 0.9 Date: Dec 29, 2013 Author: Ken Long Description Example from Dec 23, 2013 1. Market Classification: o Shows market condition in one of 9 conditions,
Stock Market Report. August 2, 2006
 August 2, 26 Stock Market Report Market Analysis for Period Ending Friday, July 28, 26 This document presents technical and fundamental analysis commonly used by investment professionals to interpret direction
Saudi Market (TADAWUL)... 2 Boursa Kuwait... 3 Abu Dhabi Exchange... 4 Dubai Financial Market... 5 Definitions... 6 Contacts... 7.
... 2 Boursa Kuwait... 3 Abu Dhabi Exchange... 4 Dubai Financial Market... 5 Definitions... 6 Contacts... 7.") QNBFS Technical Technical Spotlight Spotlight Sunday, February January 14, 11, 2018 2018 Contents Saudi Market (TADAWUL)... 2 Boursa Kuwait... 3 Abu Dhabi Exchange... 4 Dubai Financial Market... 5 Definitions...
QNBFS Technical Technical Spotlight Spotlight Sunday, February January 14, 11, 2018 2018 Contents Saudi Market (TADAWUL)... 2 Boursa Kuwait... 3 Abu Dhabi Exchange... 4 Dubai Financial Market... 5 Definitions...
Saudi Market (TADAWUL)... 2 Boursa Kuwait... 3 Abu Dhabi Exchange... 4 Dubai Financial Market... 5 Definitions... 6 Contacts... 7.
... 2 Boursa Kuwait... 3 Abu Dhabi Exchange... 4 Dubai Financial Market... 5 Definitions... 6 Contacts... 7.") QNBFS Technical Technical Spotlight Spotlight Monday, Sunday, February January 14, 05, 2018 2018 Contents Saudi Market (TADAWUL)... 2 Boursa Kuwait... 3 Abu Dhabi Exchange... 4 Dubai Financial Market...
QNBFS Technical Technical Spotlight Spotlight Monday, Sunday, February January 14, 05, 2018 2018 Contents Saudi Market (TADAWUL)... 2 Boursa Kuwait... 3 Abu Dhabi Exchange... 4 Dubai Financial Market...
Monthly Stock Market Report
 May 1, 22 Monthly Stock Market Report This document is for internal use only. The document or any of its contents should not be distributed outside of the Federal Reserve System without permission. Market
PART 3 - CHART PATTERNS & TECHNICAL INDICATORS
 Tyler Chianelli s EASYOPTIONTRADING by OPTION TRADING COACH PART 3 - CHART PATTERNS & TECHNICAL INDICATORS A SIMPLE SYSTEM FOR TRADING OPTIONS WORKS IN UP, DOWN, AND SIDEWAYS MARKETS PART 3.1 - PRIMARY
Technical Analysis explained: The Gap theory applied on unsustainable movements in EUR/USD
 Technical Analysis explained: The Gap theory applied on unsustainable movements in EUR/USD In late 1980s John J. Murphy published his book titled Technical Analysis of the Futures Markets, a comprehensive
Saudi Market (TADAWUL)... 2 Boursa Kuwait... 3 Abu Dhabi Exchange... 4 Dubai Financial Market... 5 Definitions... 6 Contacts... 7.
... 2 Boursa Kuwait... 3 Abu Dhabi Exchange... 4 Dubai Financial Market... 5 Definitions... 6 Contacts... 7.") QNBFS Technical Technical Spotlight Spotlight Sunday, Monday, January April 16, 14, 2018 2018 Contents Saudi Market (TADAWUL)... 2 Boursa Kuwait... 3 Abu Dhabi Exchange... 4 Dubai Financial Market... 5
QNBFS Technical Technical Spotlight Spotlight Sunday, Monday, January April 16, 14, 2018 2018 Contents Saudi Market (TADAWUL)... 2 Boursa Kuwait... 3 Abu Dhabi Exchange... 4 Dubai Financial Market... 5
Trade Ideas A.I. Strategy Descriptions Revised : 10/04/2017
 Trade Ideas A.I. Strategy Descriptions Revised : 10/04/2017 The 5 Day Bounce The trigger for this alert has to cross above resistance while also making a 60 minute high on stocks that are trying to bounce
Introduction. Leading and Lagging Indicators
 1/12/2013 Introduction to Technical Indicators By Stephen, Research Analyst NUS Students Investment Society NATIONAL UNIVERSITY OF SINGAPORE Introduction Technical analysis comprises two main categories:
Understanding Oscillators & Indicators March 4, Clarify, Simplify & Multiply
 Understanding Oscillators & Indicators March 4, 2015 Clarify, Simplify & Multiply Disclaimer U.S. Government Required Disclaimer Commodity Futures Trading Commission Futures and Options trading has large
Stock Market Basics Series
 Stock Market Basics Series HOW DO I TRADE STOCKS.COM Copyright 2012 Stock Market Basics Series THE STOCHASTIC OSCILLATOR A Little Background The Stochastic Oscillator was developed by the late George Lane
Introduction. Technicians (also known as quantitative analysts or chartists) usually look at price, volume and psychological indicators over time.
 usually look at price, volume and psychological indicators over time.") Technical Analysis Introduction Technical Analysis is the study of market action, primarily through the use of charts, for the purpose of forecasting future price trends. Technicians (also known as quantitative
Technical Analysis Introduction Technical Analysis is the study of market action, primarily through the use of charts, for the purpose of forecasting future price trends. Technicians (also known as quantitative
20.2 Charting the Market
 NPTEL Course Course Title: Security Analysis and Portfolio Management Course Coordinator: Dr. Jitendra Mahakud Module-10 Session-20 Technical Analysis-II 20.1. Other Instruments of Technical Analysis Several
Contents. Related Links. QNBFS Home Page QNBFS Trading Portal QNBFS Research Page
 QNBFS Technical Technical Spotlight Spotlight Wednesday, Sunday, January July 14, 04, 2018 Contents Saudi Market (TADAWUL)... 2 Boursa Kuwait... 3 Abu Dhabi Exchange... 4 Dubai Financial Market... 5 Definitions...
Level I Learning Objectives by chapter
 Level I Learning Objectives by chapter 1. Introduction to the Evolution of Technical Analysis Describe the development of modern technical analysis Describe the origins of technical analysis 2. A New Age
Contents. Related Links. QNBFS Home Page QNBFS Trading Portal QNBFS Research Page
 QNBFS Technical Technical Spotlight Spotlight Wednesday, Sunday, January September 14, 2018 05, 2018 Contents Saudi Market (TADAWUL)... 2 Boursa Kuwait... 3 Abu Dhabi Exchange... 4 Dubai Financial Market...
Daily Technical Trader Qatar
 Daily Technical Trader Qatar Monday, 20 November 2017 Today s Coverage Ticker Price Target BRES 28.50 29.45 QSE Index Level % Ch. Vol. (mn) Last 7,827.50 0.02 1.6 QSE Index (Daily) QSE Summary Market Indicators
Forexsignal30 Extreme ver. 2 Tutorials
 Forexsignal30 Extreme ver. 2 Tutorials Forexsignal30.com is a manual trading system that is composed of several indicators that mutually cooperate with each other. Very difficult to find indicators that
Using Acceleration Bands, CCI & Williams %R
 Price Headley s Simple Trading System for Stock, ETF & Option Traders Using Acceleration Bands, CCI & Williams %R How Technical Indicators Can Help You Find the Big Trends For any type of trader, correctly
Bollinger Trading Methods. Play 1 - The Squeeze
 Overview: Play 1 - The Squeeze Play 2 - The Trend Trade Play 3 - Reversals Wrap up Bollinger Trading Methods Play 1 - The Squeeze The Squeeze The most popular strategy Looks to enter a trend early on Anticipates
Technical Analysis Workshop Series. Session Ten Semester 2 Week 4 Oscillators Part 1
 Technical Analysis Workshop Series Session Ten Semester 2 Week 4 Oscillators Part 1 DISCLOSURES & DISCLAIMERS This research material has been prepared by NUS Invest. NUS Invest specifically prohibits the
Technical Indicators that Really Work
 Technical Indicators that Really Work TECHNICAL INDICATORS Technical indicators have become more important than Fundamentals. With the proper use of technical indicators investors are able to determine
Stock Market Report. December 08, 2004
 December 8, 24 Stock Market Report Market Analysis for Period Ending Friday, December 3, 24 This document presents technical and fundamental analysis commonly used by investment professionals to interpret
Knowing When to Buy or Sell a Stock
 Knowing When to Buy or Sell a Stock Overview Review & Market direction Driving forces of market change Support & Resistance Basic Charting Review & Market Direction How many directions can a stock s price
Using Oscillators & Indicators Properly May 7, Clarify, Simplify & Multiply
 Using Oscillators & Indicators Properly May 7, 2016 Clarify, Simplify & Multiply Disclaimer U.S. Government Required Disclaimer Commodity Futures Trading Commission Futures and Options trading has large
TECHNICAL INDICATORS
 TECHNICAL INDICATORS WHY USE INDICATORS? Technical analysis is concerned only with price Technical analysis is grounded in the use and analysis of graphs/charts Based on several key assumptions: Price
Monthly Stock Market Report
 January 22, 22 Monthly Stock Market Report This document is for internal use only. The document or any of its contents should not be distributed outside of the Federal Reserve System without permission.
CMS Prime DAILY MARKET REPORT
 CMS Prime DAILY MARKET REPORT May 09, 2018 EURUSD BEARISH BIAS short position at 1.1855 with SL : 1.1900 and with targets at 1.1835 and 1.1800 long position at 1.1900 with SL : 1.1835 and with targets
Using Acceleration Bands and Williams %R
 Price Headley s Simple Trading System for Stock, ETF & Option Traders Using Acceleration Bands and Williams %R How Technical Indicators Can Help You Find the Big Trends For option traders, correctly forecasting
Saudi Market (TADAWUL)... 2 Boursa Kuwait... 3 Abu Dhabi Exchange... 4 Dubai Financial Market... 5 Definitions... 6 Contacts... 7.
... 2 Boursa Kuwait... 3 Abu Dhabi Exchange... 4 Dubai Financial Market... 5 Definitions... 6 Contacts... 7.") QNBFS Technical Technical Spotlight Spotlight Sunday, Thursday, January May 31, 14, 2018 2018 Contents Saudi Market (TADAWUL)... 2 Boursa Kuwait... 3 Abu Dhabi Exchange... 4 Dubai Financial Market... 5
QNBFS Technical Technical Spotlight Spotlight Sunday, Thursday, January May 31, 14, 2018 2018 Contents Saudi Market (TADAWUL)... 2 Boursa Kuwait... 3 Abu Dhabi Exchange... 4 Dubai Financial Market... 5
FinQuiz Notes
 Reading 13 Technical analysis is a security analysis technique that involves forecasting the future direction of prices by studying past market data, primarily price and volume. Technical Analysis 2. TECHNICAL
Key Takeaways. Global Investment Strategy Technical Strategy Briefing. U.S. Dollar Index. S&P 500 Index. Chart of the Week. Crude Oil.
 Global Investment Strategy Technical Strategy Briefing May 8, 2017 Sameer Samana, CFA Global Quantitative and Technical Strategist Key Takeaways S&P 500 Index The S&P 500 Index is continuing to consolidate
Contents. Related Links. QNBFS Home Page QNBFS Trading Portal QNBFS Research Page
 QNBFS Technical Technical Spotlight Spotlight Sunday, Sunday, September January 14, 16, 2018 2018 Contents Saudi Market (TADAWUL)... 2 Boursa Kuwait... 3 Abu Dhabi Exchange... 4 Dubai Financial Market...
Weekly outlook for May 28/9 - June 1, 2018
 Weekly outlook for May 28/9 - June 1, 2018 Summary The S&P500 index is expected to be dull due to the short week, barring major news. A minor pullback maybe seen, but it should be a very short-lived. It
Chapter 3.3. Price Patterns
 1 Chapter 3.3 Price Patterns 0 TECHNICAL ANALYSIS: PRICE PATTERNS Traders vote with their chequebooks. If they believe a stock or CFD is going to move higher then they will buy the stock or CFD. If they
Stock Market Report. January 21, 2004
 January 21, 24 Stock Market Report Market Analysis for Period Ending Friday, January 16, 24 This document presents technical and fundamental analysis commonly used by investment professionals to interpret
AUTHOR: NG EE HWA, TRAINER, CHARTNEXUS TRADING WITH RSI
 AUTHOR: NG EE HWA, TRAINER, CHARTNEXUS TRADING WITH RSI While the use of Relative Strength Index (RSI) to get technical buy and sell signals in a range-bound market is well understood, the use of this
Introduction. Technical analysis is the attempt to forecast stock prices on the basis of market-derived data.
 Technical Analysis Introduction Technical analysis is the attempt to forecast stock prices on the basis of market-derived data. Technicians (also known as quantitative analysts or chartists) usually look
Technical Analysis. Used alone won't make you rich. Here is why
 Technical Analysis. Used alone won't make you rich. Here is why Roman sadowski The lesson to take away from this part is: Don t rely too much on your technical indicators Keep it simple and move beyond
IJMSS Vol.03 Issue-06, (June, 2015) ISSN: International Journal in Management and Social Science (Impact Factor )
 ISSN: International Journal in Management and Social Science (Impact Factor )") (Impact Factor- 4.358) A Comparative Study on Technical Analysis by Bollinger Band and RSI. Shah Nisarg Pinakin [1], Patel Taral Manubhai [2] B.V.Patel Institute of BMC & IT, Bardoli, Gujarat. ABSTRACT:
(Impact Factor- 4.358) A Comparative Study on Technical Analysis by Bollinger Band and RSI. Shah Nisarg Pinakin [1], Patel Taral Manubhai [2] B.V.Patel Institute of BMC & IT, Bardoli, Gujarat. ABSTRACT:
Level II Learning Objectives by chapter
 Level II Learning Objectives by chapter 1. Charting Explain the six basic tenets of Dow Theory Interpret a chart data using various chart types (line, bar, candle, etc) Classify a given trend as primary,
Last Gasp in the Dollar. Market Update May 18, Seattle Technical Advisors
 SeattleTA provides investment managers with technical analysis of the equity, fixed-income, commodity, and currency markets. While equities are expected to take a hit this week, the big news is expected
Daily Technical Trader Qatar
 Daily Technical Trader Qatar Tuesday, 25 July 2017 Today s Coverage Ticker Price Target QEWS 197.90 208.00 QSE Index Level % Ch. Vol. (mn) Last 9,579.16 0.84 8.2 QSE Index (Daily) QSE Summary Market Indicators
Technical Analysis for Options Trading. Fidelity Brokerage Services LLC, Member NYSE, SIPC, 900 Salem Street, Smithfield, RI
 Technical Analysis for Options Trading Fidelity Brokerage Services LLC, Member NYSE, SIPC, 900 Salem Street, Smithfield, RI 02917 747561.2.0 Disclosures Options trading entails significant risk and is
Module 12. Momentum Indicators & Oscillators
 Module 12 Momentum Indicators & Oscillators Oscillators or Indicators Now we will talk about momentum indicators The term momentum refers to the velocity of a price trend. This indicator measures whether
Daily Technical Trader Dubai
 Daily Technical Trader Dubai Sunday, 01 October 2017 Today s Coverage Ticker Price (AED) 1 st Target UPP 0.845 0.88 DFM General Index Level % Ch. Vol. (mn) Last 3,563.99 0.06 93.7 Resistance/Support Levels
USING THE STOCHASTIC OSCILLATOR 12th February 2015
 TAFX USING THE STOCHASTIC OSCILLATOR 12th February 2015 Disclaimer is in no way affiliated or representative of any other company, organisation, club or society, and the views presented are solely our
Balance Of Market Power. Who s The Boss? Stocks & Commodities V. 19:8 (18-32): Balance Of Power by Igor Livshin INDICATORS
: Balance Of Power by Igor Livshin INDICATORS") INDICATORS Who s The Boss? MIKE YAPPS Balance Of Market Power Who s in charge, bulls or bears? It doesn t take higher-order math to get a good reading. T by Igor Livshin he balance of market power (BMP)
INDICATORS Who s The Boss? MIKE YAPPS Balance Of Market Power Who s in charge, bulls or bears? It doesn t take higher-order math to get a good reading. T by Igor Livshin he balance of market power (BMP)
BONUS. www. candlecharts.com/special/swing-trading-2/
 BONUS www. candlecharts.com/special/swing-trading-2/ 1 www. candlecharts.com/special/swing-trading-2/ www. candlecharts.com/special/swing-trading-2/ www. candlecharts.com/special/swing-trading-2/ 2 www.
Monthly Stock Market Report
 October 23, 23 Monthly Stock Market Report This document is for internal use only. The document or any of its contents should not be distributed outside of the Federal Reserve System without permission.
Martin Pring s. Weekly InfoMovie Report. December 27, Happy New Year to Our Wonderful Subcriber Family! May 2013 be Prosperous and Productive!
 Martin Pring s Weekly InfoMovie Report December 27, 2012 Issue 1028 Happy New Year to Our Wonderful Subcriber Family! May 2013 be Prosperous and Productive! The Pring Family ~ 2012 Weekly InfoMovie Report
Technical Analysis. Used alone won't make you rich. Here is why
 Technical Analysis. Used alone won't make you rich. Here is why Roman Sadowski The lesson to take away from this part is: Don t rely too much on your technical indicators Keep it simple and move beyond
Exit Strategies for Stocks and Futures
 Exit Strategies for Stocks and Futures Presented by Charles LeBeau E-mail clebeau2@cox.net or visit the LeBeau web site at www.traderclub.com Disclaimer Each speaker at the TradeStationWorld Conference
Martin J. Pring President of Pring.com
 Martin J. Pring President of Pring.com How to Manage Risk Using Technical Analysis The first trading objective is to preserve capital #1 Trading rule Cut losses quickly, let profits run. First trade 50%
Applying fundamental & technical analysis in stock investing
 Applying fundamental & technical analysis in stock investing 2017 Live demonstration of research and trading tools Develop an Ongoing Strategy with Fidelity Software and mobile apps to enhance your trading
Learning Objectives CMT Level II
 Theory and Analysis Learning Objectives CMT Level II - 2018 Section I: Chart Development and Analysis Chapter 1 Charting Explain the six basic tenets of Dow Theory Interpret chart data using various chart
Contents. Related Links. QNBFS Home Page QNBFS Trading Portal QNBFS Research Page
 QNBFS Technical Technical Spotlight Spotlight Wednesday, Sunday, January October 14, 31, 2018 2018 Contents Saudi Market (TADAWUL)... 2 Boursa Kuwait... 3 Abu Dhabi Exchange... 4 Dubai Financial Market...
Daily Technical Trader Qatar
 Daily Technical Trader Qatar Wednesday, 03 January 2018 Today s Coverage Ticker Price Target ORDS 91.80 96.30 QSE Index Level % Ch. Vol. (mn) Last 8,620.26 1.14 6.1 QSE Index (Daily) QSE Summary Market
Raising Investment Standards TRADING SEMINAR
 Raising Investment Standards TRADING SEMINAR Raising Investment Standards DISCLAIMER Leveraged foreign exchange and options trading carries a significant level of risk, and may not be suitable for all
Daily Technical Trader Abu Dhabi
 Daily Technical Trader Abu Dhabi Sunday, 19 November 2017 Today s Coverage Ticker Price (AED) 1 st Target RAKBANK 4.75 5.45 ADX General Index Level % Ch. Vol. (mn) Last 4,327.58-0.22 30.1 Resistance/Support
Real-time Analytics Methodology
 New High/Low New High/Low alerts are generated once daily when a stock hits a new 13 Week, 26 Week or 52 Week High/Low. Each second of the trading day, the stock price is compared to its previous 13 Week,
Stock Market Report. January 26, 2005
 January 26, 25 Stock Market Report Market Analysis for Period Ending Friday, January 21, 25 This document presents technical and fundamental analysis commonly used by investment professionals to interpret