Introductory Fundamental and Technical Analysis
|
|
|
- Buddy Bryant
- 5 years ago
- Views:
Transcription
 6590 6616 Jeffrey Tan jeffreytan@uobkayhian.")
1 Introductory Fundamental and Technical Analysis Tan Junda (65) Jeffrey Tan (65)


2 Our Focus Today What kind of investor are you? Technical Fundamental 1
3 Our Focus Today Top-Down Fundamental Analysis of Stocks 2

4 Our Focus Today Reading market direction based on economic data Basic analysis of financial statements Stock valuation using price multiples 3

5 Economic Indicators Economic and business cycles drive stock markets Stock market moves 6-12 months ahead of economy Indicators give clues to the state of economy Three main types of indicators: leading, lagging, coincident Leading indicators tend to better predict market direction 4
6 Economic Indicators 5
7 Economic Indicators Reading market direction using leading economic indicators Singapore purchasing managers index (PMI) Compiled from factual survey of purchasing managers Very good forward indicator of manufacturing activity Reading above 50 signals expansion, and vice versa Gives indication of acceleration/deceleration in activity eg reading of 59 coming after 51 last month signals acceleration 6
8 Economic Indicators Reading market direction using leading economic indicators Composite Leading Index Used to anticipate economic turning points Comprises 9 components including US PMI, stock prices, new companies formed, stock of finished goods, liquidity Track quarter-on-quarter index % change 7


9 Economic Indicators Decline in mid-11 Market bottom in
10 Economic Indicators Some other useful leading indicators Yield curves Money supply 9

11 Financial Analysis 3 key statements to focus on: Income statement how much earned and spent over a period Balance sheet how much the company owns and owes Cash flow statement inflow and outflow of cash 10
12 Financial Analysis Income Statement Income statement (S$m) 1H11 1H10 yoy % chg Revenue Cost of sales (11.6) (10.7) 9.0 Gross profit Other income (33.6) Selling & Admin (15.7) (14.3) 10.4 Finance/ other costs (0.4) (0.6) (33.8) Income tax (0.4) (0.2) 98.3 Profit EPS, S cent Gross margin, % Source: Old Chang Kee Revenue growth a function of store openings and sales per store Gross/net margin measure of cost control (gross/net profit revenue) Earnings per share (EPS) Profit attributable to each share 11


13 Financial Analysis Introduction to the Balance Sheet Asset Assets = Liability + Equity Liability Shareholders Equity/ Book Value 12

14 Financial Analysis Balance Sheet Balance Sheet, S$m 1H11 Assets Plant & equipment 11.9 Cash 13.1 Other assets 4.9 Total Assets 29.9 Liabilities Payables 4.9 Other liabilities 3.8 Equity 21.2 Total Liabilities and Equity 29.9 Source: Old Chang Kee 13 Debt to Equity ratio (gearing) - measure of financial health (total borrowings total equity) Return on Equity (ROE) measure of returns on shareholders investment (net profit total equity) Book value per share Equity attributed to each share (equity no. shares)
15 Valuation Valuation multiples are commonly used due to simplicity Examples are price-to-earnings, price-to-sales, price-tobook Multiples are usually used in comparison to peers 14
16 Valuation Price-to-earnings (PE) ratio is one of the most commonly used PE = Share price EPS Measures number of years the company will earn back your investment Lower PE value indicates undervaluation 15

17 Valuation Should you buy stocks with low PEs and sell stocks with high PEs? Not necessarily Google was trading at a seemingly high ~100x PE in 2004 EPS grew by more than six-fold Six-fold increase in share price in 4 years 16
18 Valuation Why do stocks trade at a high or low PE? Growth expectations are the largest drivers of PE Pick stocks with low PE and higher expected growth Use PEG (Price-earnings-growth) multiple as a guide PEG = PE ratio EPS Growth (%) eg EPS of 8.0x EPS growth of 10.0% = 0.8x PEG Visit for EPS estimates 17
19 Valuation Valuation using the price-to-book (P/B) ratio Book value per share reflects the amount belonging to shareholders P/B ratio reflects book value growth Net profit after dividend payouts will add to book value ROE measures the rate of growth of book value Pick stocks with low P/B and high ROE 18
20 In Conclusion 19
21 What Is Technical Analysis? Based on supply and demand History tends to repeat itself and prices move in trends Market discounts everything Prices are the result of investors /traders actions Filter out news and fundamental valuations for an unbiased technical view Technical analysis is an art
22 What Is Technical Analysis? Typically does not work for: Sparsely traded stocks in terms of price and trading volume Companies that are no longer a going concern, eg companies going bust Companies affected by one-off events such as the 1Q11 earthquake in Japan

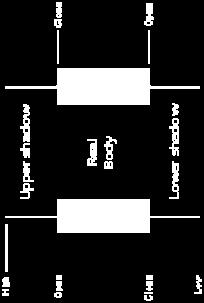
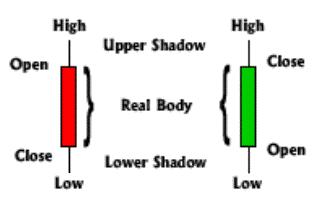
23 Types Of Charts Candlestick Line (eg only 1 price) Bar

24 Stages In Market Action 1. Accumulation - At the bottom of the chart 2. Rally - Breaks out with high volume 3. Consolidation - Sideway movement - Well-defined continuation patterns 4. Distribution - At the top of the chart - Downward movement is likely to be faster than upward movement - More volatile (vs consolidation) 5. Decline - Breaks support level(s)
25 Support And Resistance Why are we learning this? A way to identify peaks and troughs - potential profits and risks Where supply meets demand A support level is where prices are unlikely to retreat further A resistance level is where prices are unlikely to move up further Construction: Draw a line through each significant peak into the future
26 Support And Resistance Use as many points as possible to draw a support or resistance line (or trend lines) Not necessarily horizontal Anything steeper than 66 degrees may not be an indicative trend
27 Support And Resistance A resistance level can turn into a support level Resistance-turnedsupport line (in purple) appears when prices break resistance and refuse to move down from the original resistance line The reverse applies for support-turnedresistance (in blue)

28 Support And Resistance Can you identify the significant support lines in this chart?

29 Support And Resistance Suggested solutions:
30 Moving Averages Simple Moving Average (SMA) and Exponential Moving Average (EMA) SMA: Derived by computing the average price of a stock over a specific period EMA: Reduce the lag by applying more weight to recent prices MAs work well for trend trading Golden and dead cross for reversals MAs do NOT work during consolidation phases Traders would be whipsawed No magic numbers in MA and no one-size-fits-all Popular day intervals: 10, 20, 50, 100, 200 (eg SMA200 on 6-month chart - not suitable for short-term trades)
31 Moving Averages MA acting as resistance Action item: SELL at resistance Dead Cross - Watch out for potential trend reversal MA acting as support Action item: BUY at support Golden Cross - Watch out for potential trend reversal

32 When to use SMA or EMA: No hard and fast rules Select the most suitable for individual charts Moving Averages

33 Example of identifying a downtrend counter using MA Note that the stock did not break the 200-day EMA until recently in Feb 12 Several instances whereby each EMA of 20, 50 and 100 days was acting as a resistance during the downtrend Moving Averages

34 Example of identifying a uptrend counter using MA (on a weekly chart): Note that the stock fell below 20- and 50- week EMA in 4Q08 and 1Q09 Stays above the said MA most of the time Moving Averages

35 Moving Averages Example of counter trend trading with MA: Golden Cross 20-day EMA crossing above the 50-day EMA The stock is well supported above its 20- day EMA Golden cross typically refers to a shorter-term MA crossing above a longer-term MA
/ lower low (bearish) of the flag pole Action")
36 Chart Patterns - Flags Continuation patterns Typically the formation should not exceed three months In an uptrend, they form declining and narrowing ranges. Breakouts are usually sharp, typically with comparatively higher trading volume Confirmation : Use the higher high (bullish flag)/ lower low (bearish) of the flag pole Action item: BUY upon breakout
37 Technical Indicators Stochastics Why are we learning this? A way to identify turning points - Potential profits and risks Stochastics is a momentum oscillator (a concept promoted by George Lane since 1954). It follows the speed or the momentum of price Typically, %K has a setting of 14 periods Fast %D is typically a three-day simple MA of %K (signal line) Slow %D: Smoothed %D or a MA of the MA of %K %K cross over %D in the Overbought or Oversold regions indicates that the turning point is near Rough gauge: Oversold - <20; Overbought - >80 Calculation:


38 Technical Indicators Stochastics Application: Signal line crossovers are the most common Stochastics indications A higher probability of this occurs in the overbought or oversold region for sell and buy set-up A chart that uses Stochastics-signal line crossovers could imply that the trend is reversing


39 Retail Market Monitor Introduce the technical sections in our Retail Market Monitor: Charts found in Money Talk section Use Fundamental Analysis for stock picks, use Technical Analysis for entry and exit


40 Retail Market Monitor Introduce the technical sections in our Retail Market Monitor: FSSTI and other Asian indices readings Readings and possible direction of FSSTI


41 Retail Market Monitor Introduce the technical sections in our Retail Market Monitor: Traders Corner Individual stocks & TA


42 Retail Market Monitor Introduce the technical sections in our Retail Market Monitor: Special Focus Combining Fundamental Analysis with Technical Analysis (PE, P/B, Dividend Yield ratios)

 Discussion of S&R of 20")
43 Retail Market Monitor Introduce the technical sections in our Retail Market Monitor: Weekly Support and Resistance Watch (SaRW) Discussion of S&R of 20 Stocks
44 THANK YOU 43
45 Disclaimer We have based this document on information obtained from sources we believe to be reliable, but we do not make any representation or warranty nor accept any responsibility or liability as to its accuracy, completeness or correctness. Expressions of opinion contained herein are those of UOB Kay Hian Research Pte Ltd only and are subject to change without notice. Any recommendation contained in this document does not have regard to the specific investment objectives, financial situation and the particular needs of any specific addressee. This document is for the information of the addressee only and is not to be taken as substitution for the exercise of judgement by the addressee. This document is not and should not be construed as an offer or a solicitation of an offer to purchase or subscribe or sell any securities. UOB Kay Hian and its affiliates, their Directors, officers and/or employees may own or have positions in any securities mentioned herein or any securities related thereto and may from time to time add to or dispose of any such securities. UOB Kay Hian and its affiliates may act as market maker or have assumed an underwriting position in the securities of companies discussed herein (or investments related thereto) and may sell them to or buy them from customers on a principal basis and may also perform or seek to perform investment banking or underwriting services for or relating to those companies. UOB Kay Hian (U.K.) Limited, a UOB Kay Hian subsidiary which distributes UOB Kay Hian research for only institutional clients, is an authorised person in the meaning of the Financial Services and Markets Act 2000 and is regulated by Financial Services Authority (FSA). In the United States of America, this research report is being distributed by UOB Kay Hian (U.S.) Inc ( UOBKHUS ) which accepts responsibility for the contents. UOBKHUS is a broker-dealer registered with the U.S. Securities and Exchange Commission and is an affiliate company of UOBKH. Any U.S. person receiving this report who wishes to effect transactions in any securities referred to herein should contact UOBKHUS, not its affiliate. The information herein has been obtained from, and any opinions herein are based upon sources believed reliable, but we do not represent that it is accurate or complete and it should not be relied upon as such. All opinions and estimates herein reflect our judgement on the date of this report and are subject to change without notice. This report is not intended to be an offer, or the solicitation of any offer, to buy or sell the securities referred to herein. From time to time, the firm preparing this report or its affiliates or the principals or employees of such firm or its affiliates may have a position in the securities referred to herein or hold options, warrants or rights with respect thereto or other securities of such issuers and may make a market or otherwise act as principal In transactions in any of these securities. Any such non-u.s. persons may have purchased securities referred to herein for their own account in advance of release of this report. Further information on the securities referred to herein may be obtained from UOBKHUS upon request. MICA (P) 048/03/2011 RCB Regn. No E 2
Singapore STOCK. Tan Jun Da (65)
") Singapore STOCK PICKS Tan Jun Da junda@uobkayhian.com (65) 6590 6616 Disclaimer We have based this document on information obtained from sources we believe to be reliable, but we do not make any representation
Singapore STOCK PICKS Tan Jun Da junda@uobkayhian.com (65) 6590 6616 Disclaimer We have based this document on information obtained from sources we believe to be reliable, but we do not make any representation
GUIDE TO STOCK trading tools
 P age 1 GUIDE TO STOCK trading tools VI. TECHNICAL INDICATORS AND OSCILLATORS I. Introduction to Indicators and Oscillators Technical indicators, to start, are data points derived from a specific formula.
Class 7: Moving Averages & Indicators. Quick Review
 Today s Class Moving Averages Class 7: Moving Averages & Indicators 3 Key Ways to use Moving Averages Intro To Indicators 2 Indicators Strength of Lines Quick Review Great for establishing point of Support
Retail Market Monitor (Hong Kong)
") Retail Market Monitor (Hong Kong) Market Commentary Look out for investment opportunities The market in general expected HSI to break through the 21,000 level and test this year s high but sentiment turned
Retail Market Monitor (Hong Kong) Market Commentary Look out for investment opportunities The market in general expected HSI to break through the 21,000 level and test this year s high but sentiment turned
Technical Analysis Workshop Series. Session 11 Semester 2 Week 5 Oscillators Part 2
 Technical Analysis Workshop Series Session 11 Semester 2 Week 5 Oscillators Part 2 DISCLOSURES & DISCLAIMERS This research material has been prepared by NUS Invest. NUS Invest specifically prohibits the
Stock Market Basics Series
 Stock Market Basics Series HOW DO I TRADE STOCKS.COM Copyright 2012 Stock Market Basics Series THE STOCHASTIC OSCILLATOR A Little Background The Stochastic Oscillator was developed by the late George Lane
Introduction. Leading and Lagging Indicators
 1/12/2013 Introduction to Technical Indicators By Stephen, Research Analyst NUS Students Investment Society NATIONAL UNIVERSITY OF SINGAPORE Introduction Technical analysis comprises two main categories:
Maybank IB. Understanding technical analysis. by Lee Cheng Hooi. 24 September Slide 1 of Maybank-IB
 Maybank IB Understanding technical analysis 24 September 2011 by Lee Cheng Hooi Slide 1 of 40 Why technical analysis? 1) Market action discounts everything 2) Prices move in trends 3) History repeats itself
BUY SELL PRO. Improve Profitability & Reduce Risk with BUY SELL Pro. Ultimate BUY SELL Indicator for All Time Frames
 BUY SELL PRO Improve Profitability & Reduce Risk with BUY SELL Pro Ultimate BUY SELL Indicator for All Time Frames Risk Disclosure DISCLAIMER: Crypto, futures, stocks and options trading involves substantial
INTERMEDIATE EDUCATION GUIDE
 INTERMEDIATE EDUCATION GUIDE CONTENTS Key Chart Patterns That Every Trader Needs To Know Continution Patterns Reversal Patterns Statistical Indicators Support And Resistance Fibonacci Retracement Moving
Singapore Strategy 2H12
 Singapore Strategy 2H12 Running In Circles Andrew Chow, CFA andrewchow@uobkayhian.com (65) 6590 6633 Key Highlights No resolution in sight for external uncertainties. Global GDP drifting towards slower
Understanding Oscillators & Indicators March 4, Clarify, Simplify & Multiply
 Understanding Oscillators & Indicators March 4, 2015 Clarify, Simplify & Multiply Disclaimer U.S. Government Required Disclaimer Commodity Futures Trading Commission Futures and Options trading has large
OSCILLATORS. TradeSmart Education Center
 OSCILLATORS TradeSmart Education Center TABLE OF CONTENTS Oscillators Bollinger Bands... Commodity Channel Index.. Fast Stochastic... KST (Short term, Intermediate term, Long term) MACD... Momentum Relative
Technical Analysis Workshop Series. Session Ten Semester 2 Week 4 Oscillators Part 1
 Technical Analysis Workshop Series Session Ten Semester 2 Week 4 Oscillators Part 1 DISCLOSURES & DISCLAIMERS This research material has been prepared by NUS Invest. NUS Invest specifically prohibits the
Technical Analysis Workshop Series. Session Eight Commodity Channel Index
 Technical Analysis Workshop Series Session Eight DISCLOSURES & DISCLAIMERS This research material has been prepared by NUS Invest. NUS Invest specifically prohibits the redistribution of this material
Using Oscillators & Indicators Properly May 7, Clarify, Simplify & Multiply
 Using Oscillators & Indicators Properly May 7, 2016 Clarify, Simplify & Multiply Disclaimer U.S. Government Required Disclaimer Commodity Futures Trading Commission Futures and Options trading has large
Introduction. Technicians (also known as quantitative analysts or chartists) usually look at price, volume and psychological indicators over time.
 usually look at price, volume and psychological indicators over time.") Technical Analysis Introduction Technical Analysis is the study of market action, primarily through the use of charts, for the purpose of forecasting future price trends. Technicians (also known as quantitative
Technical Analysis Introduction Technical Analysis is the study of market action, primarily through the use of charts, for the purpose of forecasting future price trends. Technicians (also known as quantitative
China Steel Sector. Supply and Demand Outlook. Helen Lau. Senior Analyst (Metals and Mining) UOB Kay Hian (Hong Kong)
 UOB Kay Hian (Hong Kong)") China Steel Sector Supply and Demand Outlook Helen Lau Senior Analyst (Metals and Mining) UOB Kay Hian (Hong Kong) Tel.: (852) 2236 6749 helen.lau@uobkayhian.com.hk November 2012 1 Steel Price Recovery
China Steel Sector Supply and Demand Outlook Helen Lau Senior Analyst (Metals and Mining) UOB Kay Hian (Hong Kong) Tel.: (852) 2236 6749 helen.lau@uobkayhian.com.hk November 2012 1 Steel Price Recovery
Technical Analysis Workshop Series. Session Three
 Technical Analysis Workshop Series Session Three DISCLOSURES & DISCLAIMERS This research material has been prepared by NUS Invest. NUS Invest specifically prohibits the redistribution of this material
Williams Percent Range
 Williams Percent Range (Williams %R or %R) By Marcille Grapa www.surefiretradingchallenge.com RISK DISCLOSURE STATEMENT / DISCLAIMER AGREEMENT Trading any financial market involves risk. This report and
By Tri, Senior Analyst
 1/1/2014 Trend Following By Tri, Senior Analyst NUS Students Investment Society NATIONAL UNIVERSITY OF SINGAPORE Introduction Trend following was introduced by Richard Dennis when he taught trading strategies
Technical Analysis and Charting Part II Having an education is one thing, being educated is another.
 Chapter 7 Technical Analysis and Charting Part II Having an education is one thing, being educated is another. Technical analysis is a very broad topic in trading. There are many methods, indicators, and
The Art & Science of Active Trend Trading
 CONNECTING THE DOTS Candlesticks & Convergence of Clues The Art & Science of Active Trend Trading Copyright ATTS 2007-2015 1 Dennis W. Wilborn, P.E. Founder, President Active Trend Trading dww@activetrendtrading.com
Chapter 2.3. Technical Indicators
 1 Chapter 2.3 Technical Indicators 0 TECHNICAL ANALYSIS: TECHNICAL INDICATORS Charts always have a story to tell. However, sometimes those charts may be speaking a language you do not understand and you
Stay on the Right Side & Finishing the Year Strong! From the Active Trend Trader
 Stay on the Right Side & Finishing the Year Strong! From the Active Trend Trader Disclaimer U.S. GOVERNMENT REQUIRED DISCLAIMER COMMODITY FUTURES TRADING COMMISSION FUTURES AND OPTIONS TRADING HAS LARGE
The six technical indicators for timing entry and exit in a short term trading program
 The six technical indicators for timing entry and exit in a short term trading program Definition Technical analysis includes the study of: Technical analysis the study of a stock s price and trends; volume;
HOLD. Hold on tightly to this gem. 22 February Stock Picks FJ Benjamin Holdings
 www.uobkayhian.com.sg 22 February 2011 Stock Picks FJ Benjamin Holdings Hold on tightly to this gem Company Overview FJ Benjamin (FJB) has four business segments: a) Retailing and distribution (R&D) Operates
The Art & Science of Active Trend Trading
 CONNECTING THE DOTS Candlesticks & Convergence of Clues The Art & Science of Active Trend Trading Copywrite ATTS 2007-2015 1 Dennis W. Wilborn, P.E. Founder, President Active Trend Trading dww@activetrendtrading.com
Schwab Investing Insights Trading Edition Text Close Window Size: November 15, 2007
 Schwab Investing Insights Trading Edition Text Close Window Size: from TheStreet.com November 15, 2007 ON TECHNIQUES Two Indicators Are Better Than One The Relative Strength Index works well but it s better
TD AMERITRADE Technical Analysis Night School Week 2
 TD AMERITRADE Technical Analysis Night School Week 2 Hosted By Derek Moore Director, National Education For the audio portion of today s webcast, please enable your computer speakers. Past performance
Technical Analysis for Options Trading. Fidelity Brokerage Services LLC, Member NYSE, SIPC, 900 Salem Street, Smithfield, RI
 Technical Analysis for Options Trading Fidelity Brokerage Services LLC, Member NYSE, SIPC, 900 Salem Street, Smithfield, RI 02917 747561.2.0 Disclosures Options trading entails significant risk and is
Forex Sentiment Report Q2 FORECAST WEAK AS LONG AS BELOW April
 Forex Sentiment Report 08 April 2015 www.ads-securities.com Q2 FORECAST WEAK AS LONG AS BELOW 1.1200 Targets on a break of 1.1534/35: 1.1740/50 1.1870/75 1.2230/35 Targets on a break of 1.0580/70: 1.0160
CONNECING THE DOTS Candlesticks & Convergence of Clues. The Art & Science of Active Trend Trading
 CONNECING THE DOTS Candlesticks & Convergence of Clues The Art & Science of Active Trend Trading Disclaimer U.S. Government Required Disclaimer Commodity Futures Trading Commission Futures and Options
The Art & Science of Active Trend Trading
 Candlesticks Looking for U-Turns The Art & Science of Active Trend Trading Copywrite ATTS 2007-2015 1 Disclaimer U.S. Government Required Disclaimer Commodity Futures Trading Commission Futures and Options
Technical Indicators
 Taken From: Technical Analysis of the Financial Markets A Comprehensive Guide to Trading Methods & Applications John Murphy, New York Institute of Finance, Published 1999 Technical Indicators Technical
Chapter 2.3. Technical Analysis: Technical Indicators
 Chapter 2.3 Technical Analysis: Technical Indicators 0 TECHNICAL ANALYSIS: TECHNICAL INDICATORS Charts always have a story to tell. However, from time to time those charts may be speaking a language you
TECHNICAL INDICATORS
 TECHNICAL INDICATORS WHY USE INDICATORS? Technical analysis is concerned only with price Technical analysis is grounded in the use and analysis of graphs/charts Based on several key assumptions: Price
Compiled by Timon Rossolimos
 Compiled by Timon Rossolimos - 2 - The Seven Best Forex Indicators -All yours! Dear new Forex trader, Everything we do in life, we do for a reason. Why have you taken time out of your day to read this
AUTHOR: NG EE HWA, TRAINER, CHARTNEXUS TRADING WITH RSI
 AUTHOR: NG EE HWA, TRAINER, CHARTNEXUS TRADING WITH RSI While the use of Relative Strength Index (RSI) to get technical buy and sell signals in a range-bound market is well understood, the use of this
Lighting the Way: Using Candlestick Patterns. The Art & Science of Active Trend Trading
 Lighting the Way: Using Candlestick Patterns The Art & Science of Active Trend Trading Disclaimer U.S. Government Required Disclaimer Commodity Futures Trading Commission Futures and Options trading has
IndiaNivesh Weekly Pulse
 23rd Feb 2018 IndiaNivesh Weekly Pulse RETAIL TECHNICAL RESEARCH The closing of Feb 2018 might decide the fate of the markets! Close 10491 Chart 1 : Nifty Daily & Hourly R1 / R2 10630/ 10700 S1 / S2 10276/
Fast Track Stochastic:
 Fast Track Stochastic: For discussion, the nuts and bolts of trading the Stochastic Indicator in any market and any timeframe are presented herein at the request of Beth Shapiro, organizer of the Day Traders
The Schaff Trend Cycle
 The Schaff Trend Cycle by Brian Twomey This indicator can be used with great reliability to catch moves in the currency markets. Doug Schaff, president and founder of FX Strategy, created the Schaff trend
4 Keys to Trend Trading Tech Analysis. There is no Holy Grail of Trading Only Tools & Rules
 4 Keys to Trend Trading Tech Analysis There is no Holy Grail of Trading Only Tools & Rules Disclaimer U.S. GOVERNMENT REQUIRED DISCLAIMER COMMODITY FUTURES TRADING COMMISSION FUTURES AND OPTIONS TRADING
FinQuiz Notes
 Reading 13 Technical analysis is a security analysis technique that involves forecasting the future direction of prices by studying past market data, primarily price and volume. Technical Analysis 2. TECHNICAL
Table Of Contents. Introduction. When You Should Not Use This Strategy. Setting Your Metatrader Charts. Free Template 15_Min_Trading.tpl.
 Table Of Contents Introduction When You Should Not Use This Strategy Setting Your Metatrader Charts Free Template 15_Min_Trading.tpl How To Trade 15 Min. Trading Strategy For Long Trades 15 Min. Trading
The goal for Part One is to develop a common language that you and I
 PART ONE Basic Training The goal for Part One is to develop a common language that you and I can use. The rest of the book will discuss how the technical indicators highlighted in the first two chapters
RISK DISCLOSURE STATEMENT / DISCLAIMER AGREEMENT
 RISK DISCLOSURE STATEMENT / DISCLAIMER AGREEMENT Trading any financial market involves risk. This report and all and any of its contents are neither a solicitation nor an offer to Buy/Sell any financial
Introduction. Technical analysis is the attempt to forecast stock prices on the basis of market-derived data.
 Technical Analysis Introduction Technical analysis is the attempt to forecast stock prices on the basis of market-derived data. Technicians (also known as quantitative analysts or chartists) usually look
S&P Cash Long Term: Uptrend Intact. Monthly Log Chart
 Andy Dodd MSTA - +44 020 7031 4651 adodd@louiscapital.com Twitter : @louiscaptech S&P Cash Long Term: Uptrend Intact Despite an initial slowdown in momentum following the break above 2120 in July, which
FOREX INDICATORS. THEIR PRIORITY and USE
 FOREX INDICATORS THEIR PRIORITY and USE by G. C. Smith U.S. Government Required Disclaimer Trading foreign exchange markets on margin carries a high level of risk, and may not be suitable for all investors.
EUR-USD USD-JPY AUD-USD. We turn bullish on AUD-USD (from neutral earlier). A decisive break above has reversed the earlier downtrend.
. A decisive break above has reversed the earlier downtrend.") FX STRATEGY 3 September 03 This commentary reflects the views of the Wealth Management Group The views expressed in this publication are made on the basis of a -4 week outlook and may differ from our longer
FX STRATEGY 3 September 03 This commentary reflects the views of the Wealth Management Group The views expressed in this publication are made on the basis of a -4 week outlook and may differ from our longer
Weekly outlook for June 19 June
 Weekly outlook for June 19 June 23 2017 TREND DIRECTION Short Term Trend Intermediate-Term Trend Long Term Trend S&P 500 Oil Gold sideway Up Up down and oversold down down down and oversold soon Sideway
THE CYCLE TRADING PATTERN MANUAL
 TIMING IS EVERYTHING And the use of time cycles can greatly improve the accuracy and success of your trading and/or system. THE CYCLE TRADING PATTERN MANUAL By Walter Bressert There is no magic oscillator
Additional Reading Material on Technical Analysis
 Additional Reading Material on Relevant for 1. Module 7 (Financial Statement Analysis and Asset Valuation) 2. Module 18 (Securities and Derivatives Trading [Products and Analysis]) Copyright 2017 Securities
IndiaNivesh Weekly Pulse
 24th v 2017 IndiaNivesh Weekly Pulse RETAIL TECHNICAL RESEARCH 10300 10400 to decide the next course of markets! Close 10390 Chart 1 : Nifty - Daily R1 / R2 10405 / 10500 S1 / S2 10300 / 10200 50 EMA 10170
The Technical Edge Page 1. The Technical Edge. Part 1. Indicator types: price, volume, and moving averages and momentum
 The Technical Edge Page 1 The Technical Edge INDICATORS Technical analysis relies on the study of a range of indicators. These come in many specific types, based on calculations or price patterns. For
SXXP and SX5E nearing their downtrends. Gold remains a short in line with the trend. Dollar index at key support. EURUSD bearish candle
 Andy Dodd MSTA - +44 020 7031 4651 adodd@louiscapital.com Twitter : @louiscaptech SXXP and SX5E nearing their downtrends. Gold remains a short in line with the trend Dollar index at key support EURUSD
RISK DISCLOSURE STATEMENT / DISCLAIMER AGREEMENT
 RISK DISCLOSURE STATEMENT / DISCLAIMER AGREEMENT Trading any financial market involves risk. This report and all and any of its contents are neither a solicitation nor an offer to Buy/Sell any financial
S&P Cash Long Term: Uptrend Intact. Monthly Log Chart
 Andy Dodd MSTA - +44 020 7031 4651 adodd@louiscapital.com Twitter : @louiscaptech S&P Cash Long Term: Uptrend Intact Despite an initial slowdown in momentum following the break above 2120 in July, which
Notices and Disclaimer
 Part 2 March 14, 2013 Saul Seinberg Notices and Disclaimer } This is a copyrighted presentation. It may not be copied or used in whole or in part for any purpose without prior written consent from the
Scalp Trading Strategies
 Scalp Trading Strategies Services Disclaimer (for full disclosure, see Disclaimers section of website) Information Contained within our website and affiliates is not a substitute for professional advice
The very first calculations for average gain and average loss are simple 14- period averages.
 Introduction Developed by J. Welles Wilder, the Relative Strength Index (RSI) is a momentum oscillator that measures the speed and change of price movements. RSI oscillates between zero and 100. Traditionally,
Class 6: Trading the Lanes (In-depth Line Drawing and Charting) Review of Class So Far
 Review of Class So Far") Today s Class Class 6: Trading the Lanes (In-depth Line Drawing and Charting) Review of class so far Where we are going from here More in-depth technical analysis Trading with brackets (neutral trading)
Today s Class Class 6: Trading the Lanes (In-depth Line Drawing and Charting) Review of class so far Where we are going from here More in-depth technical analysis Trading with brackets (neutral trading)
Moving Averages, CrossOvers and the MACD
 Moving Averages, CrossOvers and the MACD October 14, 2017 Introduction: Moving averages are the most widely used indicators in technical analysis, and help smoothing out short-term fluctuations (or volatility)
Welcome to TONI TURNER S TRADING SCHOOL. Series
 Welcome to TONI TURNER S TRADING SCHOOL Series Disclaimer This seminar, How to Read Charts: Five Easy Steps to Chart Analysis, was prepared for educational purposes only. Its contents do not recommend,
CHARTS. Bar Line Candlestick Charts are the basis of technical analysis They are a graphic display of price action. Notes:
 TECHNICAL ANALYSIS CHARTS Bar Line Candlestick Charts are the basis of technical analysis They are a graphic display of price action Candlestick charts have become the industry standard for technical traders.
Charting Glossary. September 2008 Version 1
 Charting Glossary September 2008 Version 1 i Contents 1 Price... 1 2 Charts... 1 2.1 Line, Step, Scatter, Histogram/Mountain charts...1 2.2 Open/High/Low/Close charts (Bar Charts)...1 2.3 Candle charts...2
EUR-USD USD-JPY AUD-USD USD-SGD GBP-USD XAU-USD. Spot (2 4 weeks) Support Support
 Support Support") FX STRATEGY 25 November 2013 This commentary reflects the views of the Wealth Management Group The views expressed in this publication are made on the basis of a 2-4 week outlook and may differ from our
FX STRATEGY 25 November 2013 This commentary reflects the views of the Wealth Management Group The views expressed in this publication are made on the basis of a 2-4 week outlook and may differ from our
Intelligent Stock Monitor
 Intelligent Stock Monitor (by SHK Financial Data Ltd.) - 1 - Content 1. Technical Analysis 4 1.1 Chart 1.1.1 Line Chart 1.1.2 Bar Chart 1.1.3 Candlestick Chart 1.2 Technical Drawing Skills 1.2.1 Golden
FOREX. analysing made easy. UNDERSTANDING TECHNICAL ANALYSIS An educational tool by Blackwell Global
 FOREX analysing made easy UNDERSTANDING TECHNICAL ANALYSIS An educational tool by Blackwell Global Risk Warning: Forex and CFDs are leveraged products and you may lose your initial deposit as well as substantial
Figure 3.6 Swing High
 Swing Highs and Lows A swing high is simply any turning point where rising price changes to falling price. I define a swing high (SH) as a price bar high, preceded by two lower highs (LH) and followed
FOREX PROFITABILITY CODE
 FOREX PROFITABILITY CODE Forex Secret Protocol Published by Old Tree Publishing CC Suite 509, Private Bag X503 Northway, 4065, KZN, ZA www.oldtreepublishing.com Copyright 2013 by Old Tree Publishing CC,
Profiting. with Indicators. By Jeff Drake with Ed Downs
 Profiting with Indicators By Jeff Drake with Ed Downs Profiting with Indicators By Jeff Drake with Ed Downs Copyright 2018 Nirvana Systems Inc. All Rights Reserved The charts and indicators used in this
Technical Analysis Workshop Series. Session Two
 Technical Analysis Workshop eries ession Two DICLOURE & DICLAIMER This research material has been prepared by NU Invest. NU Invest specifically prohibits the redistribution of this material in whole or
R e t a i l M a r k e t M o n i t o r Friday, 18 December 2015
 MARKET NEWS PRICE CHART The FSSTI rallied 0.7% to close at 2,861.18 as the first US interest-rate increase in almost a decade was welcomed across Asian markets. IPC Corp gained 7.69% to close at S$2.03
Stock selection for traders Charles Schwab & Co., Inc. ( Schwab ). All rights reserved. Member SIPC. [ Y)
. All rights reserved. Member SIPC. [ Y)") Stock selection for traders 2018 Charles Schwab & Co., Inc. ( Schwab ). All rights reserved. Member SIPC. [0617-718Y) We believe in the power of investing to transform peoples lives. We look at the world
Stock selection for traders 2018 Charles Schwab & Co., Inc. ( Schwab ). All rights reserved. Member SIPC. [0617-718Y) We believe in the power of investing to transform peoples lives. We look at the world
Chapter 24 DIVERGENCE DECISIONS
 Chapter 24 DIVERGENCE DECISIONS The subject of divergence is one that we will approach with the utmost caution. We hope we have made ourselves clear in the other volumes of this course that we have little
A Slowdown is in the Bag, but What About a Recession?
 A Slowdown is in the Bag, but What About a Recession? January 11, 2019 by Martin Pring of Pring Turner Capital Group There is little doubt that the US economy is in a state of slowdown. That s actually
Table of Contents. Risk Disclosure. Things we will be going over. 2 Most Common Chart Layouts Anatomy of a candlestick.
 Table of Contents Risk Disclosure Things we will be going over 2 Most Common Chart Layouts Anatomy of a candlestick Candlestick chart Anatomy of a BAR PLOT Indicators Trend-Lines Volume MACD RSI The Stochastic
 1 www.candlecharts.com 2 BONUS www. candlecharts.com/special/swing-trading-2/ 3 www. candlecharts.com/special/swing-trading-2/ 4 www. candlecharts.com/special/swing-trading-2/ 5 www. candlecharts.com/special/swing-trading-2/
MAGIC FOREX DIVERGENCE Trading Guide
 Tim Trush & Julie Lavrin Introducing MAGIC FOREX DIVERGENCE Trading Guide Your guide to financial freedom. Tim Trush, Julie Lavrin, T&J Profit Club, 2017, All rights reserved www.forexmystery.com Table
Technical Indicators versiunea
 Technical Indicators versiunea 2.0 03.10.2008 Contents 1 Price... 1 2 Charts... 1 2.1 Line, Step, Scatter, Histogram/Mountain charts 1 2.2 Open/High/Low/Close charts (Bar Charts)... 2 2.3 Candle charts...
Candlesticks Discoveries Probability of Success Aug 6, 2016
 Candlesticks Discoveries Probability of Success Aug 6, 2016 The Art & Science of Active Trend Trading Disclaimer U.S. Government Required Disclaimer Commodity Futures Trading Commission Futures and Options
Applying fundamental & technical analysis in stock investing
 Applying fundamental & technical analysis in stock investing 2017 Live demonstration of research and trading tools Develop an Ongoing Strategy with Fidelity Software and mobile apps to enhance your trading
EUR-USD USD-JPY AUD-USD USD-SGD. Spot Support
 FX STRATEGY 4 May 0 The comments represented in this publication are made on the basis of a 4 week outlook Contents EUR USD Pg USD JPY Pg AUD USD Pg 4 USD SGD Pg 5 GBP USD Pg 6 Interest rate differentials
Technical Analysis Workshop Series. Session Six 1, 2, 3 Price-Bars Patterns
 Technical Analysis Workshop Series Session Six 1, 2, 3 Price-Bars Patterns DISCLOSURES & DISCLAIMERS This research material has been prepared by NUS Invest. NUS Invest specifically prohibits the redistribution
Power Ranger Strategy
 Power Ranger Strategy Power Ranger Strategy Strategy Concept Using the common oscillator, the Stochastic to identify entry for early range trading. Time-frame H1 and above. Currency Pairs All currency
Active Trend Trading Rules Review
 Active Trend Trading Rules Review Active Trend Trader: Dennis W. Wilborn A Trend Should Be Assumed to Continue in Effect Until Such Time as Its Reversal Has Been Definitely Signaled Edwards & Magee Disclaimer
PART 3 - CHART PATTERNS & TECHNICAL INDICATORS
 Tyler Chianelli s EASYOPTIONTRADING by OPTION TRADING COACH PART 3 - CHART PATTERNS & TECHNICAL INDICATORS A SIMPLE SYSTEM FOR TRADING OPTIONS WORKS IN UP, DOWN, AND SIDEWAYS MARKETS PART 3.1 - PRIMARY
presented by Thomas Wood MicroQuant SM Divergence Trading Workshop Day One Naked Trading Part 2
 presented by Thomas Wood MicroQuant SM Divergence Trading Workshop Day One Naked Trading Part 2 Risk Disclaimer Trading or investing carries a high level of risk, and is not suitable for all persons. Before
FOREX TRADING STRATEGIES.
 FOREX TRADING STRATEGIES www.ifcmarkets.com www.ifcmarkets.com 2 One of the most powerful means of winning a trade is the portfolio of Forex trading strategies applied by traders in different situations.
Stock Market Seminar
 Stock Market Seminar Nik Ihsan Raja Abdullah, MSTA, CFTe President, Malaysian Association of Technical Analysts (MATA) Chartist, Retail Research, Maybank Investment Bank Berhad Full Members of United Kingdom
20.2 Charting the Market
 NPTEL Course Course Title: Security Analysis and Portfolio Management Course Coordinator: Dr. Jitendra Mahakud Module-10 Session-20 Technical Analysis-II 20.1. Other Instruments of Technical Analysis Several
BUY (Maintained) Tunas Baru Lampung (TBLA IJ) COMPANY UPDATE. New Raw Sugar Import Quota To Ensure Steady Performance In 2018
 Tunas Baru Lampung (TBLA IJ) COMPANY UPDATE. New Raw Sugar Import Quota To Ensure Steady Performance In 2018") COMPANY UPDATE Tunas Baru Lampung (TBLA IJ) New Raw Sugar Import Quota To Ensure Steady Performance In 2018 TBLA was just allotted a 75,000-tonne raw sugar import quota. This should ensure steady inventory
COMPANY UPDATE Tunas Baru Lampung (TBLA IJ) New Raw Sugar Import Quota To Ensure Steady Performance In 2018 TBLA was just allotted a 75,000-tonne raw sugar import quota. This should ensure steady inventory
EU50 Future (VG1) Futures: Short Term View / Levels. Andy Dodd - MSTA adodd 25th April 2018.
 Futures: Short Term View / Levels. Andy Dodd - MSTA adodd 25th April 2018.") Andy Dodd - MSTA +44 20 7031 4651 Twitter @louiscaptech adodd 2018 EU50 Future (VG1) Daily Chart Position Supports Resistances Position Size Short 3391 3354 3336 3319 3282 3418 3441 3481 3502 100% 3286
Andy Dodd - MSTA +44 20 7031 4651 Twitter @louiscaptech adodd 2018 EU50 Future (VG1) Daily Chart Position Supports Resistances Position Size Short 3391 3354 3336 3319 3282 3418 3441 3481 3502 100% 3286
Global Bear Market at our Doorstep?
 6 June 2012 Global Bear Market at our Doorstep? by William Cai, Vice President, Personal Financial Services This article was featured in the Jun 2012 issue of The Business Times. Below is the original
Instructions for completing Share Appraisal Form (SAF)
") ASX online courses - Instructions Instructions for completing Share Appraisal Form (SAF) The information you need to complete the SAF is available from a variety of sources, including: Financial section
ASX online courses - Instructions Instructions for completing Share Appraisal Form (SAF) The information you need to complete the SAF is available from a variety of sources, including: Financial section
What is Technical Analysis
 Reg. office: International School of Financial Market, Plot no. 152 - P (LGF), Sec - 38, Medicity Road, Gurgaon - 122002 Contact no. : 0124-2200689,+919540008689, 9654446629 Web : www.isfm.co.in, Email
Weekly outlook for April 30 May
 Weekly outlook for April 30 May 4 2018 Summary The S&P500 index is having trouble deciding if it will rally or decline. This indecision makes trading less profitable. Wait for a break-out direction to