Technical Analysis Workshop Series. Session Eight Commodity Channel Index
|
|
|
- Lindsey Chase
- 5 years ago
- Views:
Transcription
1 Technical Analysis Workshop Series Session Eight
2 DISCLOSURES & DISCLAIMERS This research material has been prepared by NUS Invest. NUS Invest specifically prohibits the redistribution of this material in whole or in part without the written permission of NUS Invest. The research officer(s) primarily responsible for the content of this research material, in whole or in part, certifies that their views are accurately expressed and they will not receive direct or indirect compensation in exchange for expressing specific recommendations or views in this research material.
3 DISCLOSURES & DISCLAIMERS Nothing in this research material constitutes a representation that any investment strategy or recommendation contained herein is suitable or appropriate to a recipient s individual circumstances or otherwise constitutes a personal recommendation. It is published solely for information purposes, it does not constitute an advertisement and is not to be construed as a solicitation or an offer to buy or sell any securities or related financial instruments. No representation or warranty, either expressed or implied, is provided in relation to the accuracy, completeness or reliability of the information contained herein. The research material should not be regarded by recipients as a substitute for the exercise of their own judgement. Any opinions expressed in this research material are subject to change without notice.
4 Agenda Introduction To commodity channel index Q&A
5 Introduction to channel index PIVOT POINTS S
6 Introduction Originally created to identify cycles in Commodities Creator Donald Lambert Can also be used for stocks and the forexmarket
7 Reason behind the creation Lambert believed that every commodity or stock moves in cycles High and low points are established within a fixed period One cycle ( Time from high to low)
8 Definition An oscillator used in technical analysis to help determine when an investment vehicle has been overbought and oversold. The, first developed by Donald Lambert, quantifies the relationship between the asset's price, a moving average (MA) of the asset's price, and normal deviations (D) from that average.
9 Calculation CCI = (Typical Price - 20-period SMA of TP) / (.015 x Mean Deviation) Typical Price (TP) = (High + Low + Close)/3 Constant =.015
10 Calculation 0.15? Scaling constant, to ensure approx 70%-80% of CCI values fall between 100 and -100 % also depends on periods Longer period more stable (More values falling within the band of 100 and -100) Shorter periods more volatile Averaging/smoothing
11 Calculation Mean Deviation Ssubtractthe most recent 20-period average of the typical price from each period's typical price. Take the absolute values of these numbers. Sum the absolute values. Divide by the total number of periods (20).
12 Excel
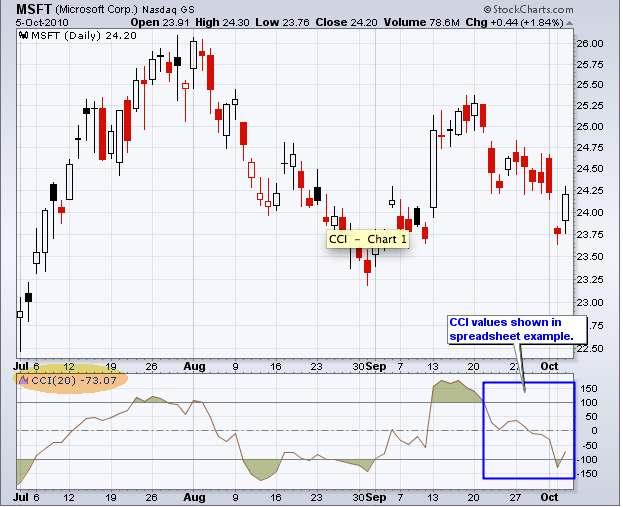
13
14 Timing trades
15 Determining time interval Time interval plays crucial role in enhancing accuracy of the CCI Prediction of cycle through moving averages Thus, more attuned MA amount is to cycle, the more accurate the average Default timing 20 More accurate interval will reduce occurrence of false signals
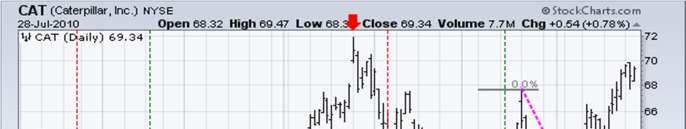
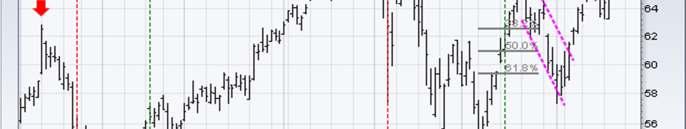
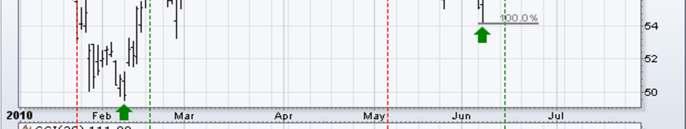
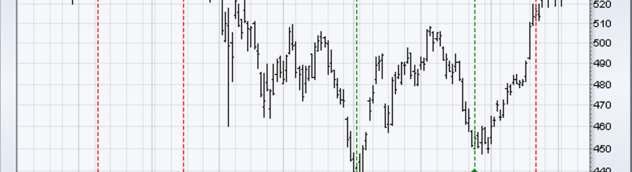
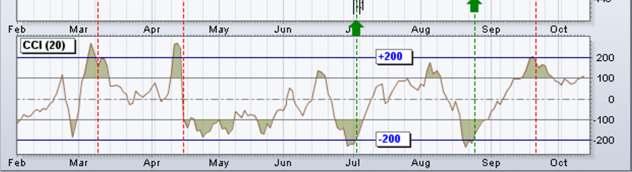
16 Determining time interval Steps: Open up the stock's yearly chart. Locate two highs or two lows on the chart. Take note of the time interval between these two highs or lows (cycle length). Divide that time interval by three to get the optimal time interval to use in the calculation (1/3 of the cycle).read more:


17 Oct 6-Aug 9, approx 225 days, 1/3= 75
18 Application Lambert recommends 1/3 cycle time 30 day cycle, use 10 day for the CCI calculation
19 CCI measures the difference between a security's price change and its average price change. High positive readings indicate that prices are well above their average, which is a show of strength. Low negative readings indicate that prices are well below their average, which is a show of weakness.
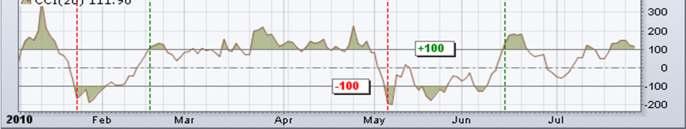
20 The (CCI) can be used as either a coincident or leading indicator. As a coincident indicator, surges above +100 reflect strong price action that can signal the start of an uptrend. Plunges below -100 reflect weak price action that can signal the start of a downtrend.
21 As a leading indicator, chartists can look for overbought or oversold conditions that may foreshadow a mean reversion. Similarly, bullish and bearish divergences can be use to detect early momentum shifts and anticipate trend reversals.
22 Leading indicator Leading indicators are designed to lead price movements. Most represent a form of price momentum over a fixed lookback period, which is the number of periods used to calculate the indicato
23 Leading indicator Many leading indicators come in the form of momentum oscillators. Generally speaking, momentum measures the rate-of-change of a security's price. As the price of a security rises, price momentum increases. The faster the security rises (the greater the period-over-period price change), the larger the increase in momentum. Once this rise begins to slow, momentum will also slow. As a security begins to trade flat, momentum starts to actually decline from previous high levels
24 Application Movement across +100 & -100 Out of Normal price action Over+ 100, signal strong uptrend Below-100, Signal strong downtrend Bearish/Bullish Filters CCI favoursbulls when postiveand Bears when negative Risky to use simple line cross over: whipsaws Wait for more obvious signals, above +100 Lagged entry, reduced whipsaws
25 Whipsaw A condition where a security'sprice heads in one direction, but thenis followed quicklyby a movement in the opposite
26
27 Overbought/oversold
28 Overbought/oversold +100 overbought, -100 oversold Identify sideways market-look at MA, relatively flat, price oscillating around MA Identify Overbought CCI with divergence Look for cross down through + 100, moving towards typical price
29
30 Overbought/oversold Identifying overbought and oversold levels can be tricky with the (CCI). Theoretically, there are no upside or downside limits. This makes an overbought or oversold assessment subjective securities can continue moving higher after an indicator becomes overbought. Likewise, securities can continue moving lower after an indicator becomes oversold.
31 Overbought/oversold The definition of overbought or oversold varies for the (CCI). ±100 may work in a trading range, but more extreme levels are needed for other situations. ±200 is a much harder level to reach and more representative of a true extreme. Selection of overbought/oversold levels also depends on the volatility of the underlying security. The CCI range for an index ETF, such as SPY, will be usually be smaller than for a most stocks, such as Google.
32
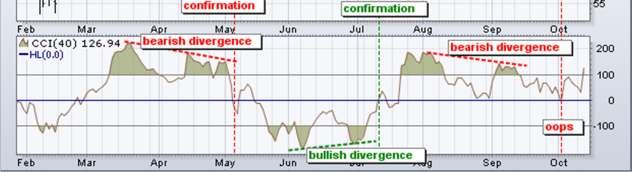
33 Bullish/bearish divergences
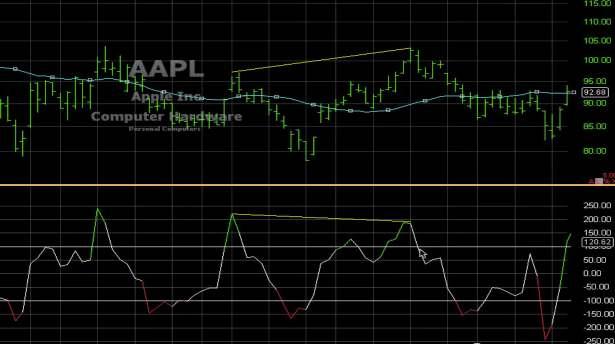
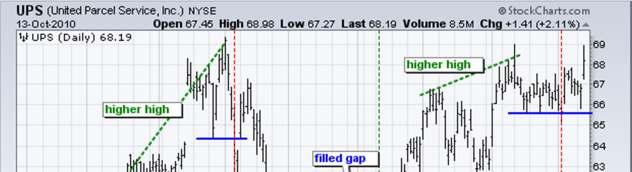
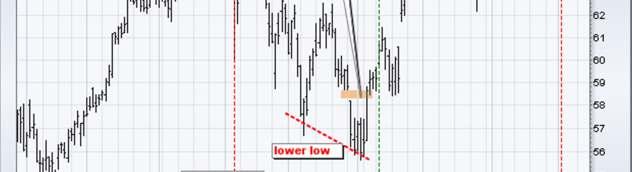
34 Bullish/bearish divergences Divergences signal a potential reversal point because directional momentum does not confirm price. A bullish divergence occurs when the underlying security makes a lower low and CCI forms a higher low, which shows less downside momentum A bearish divergence forms when the security records a higher high and CCI forms a lower high, which shows less upside momentum
35 Bullish/bearish divergences Be careful of strong trends Divergence can be misleading A strong uptrend can show numerous bearish divergences before a top actually materializes. Conversely, bullish divergences often after appear in extended downtrends.
36 DMI Directional movement can be used on its own or as a filter 2 lines are generated for DMI study +DI -DI Measures positive (upward) movement Measures negative (downward) movement
37
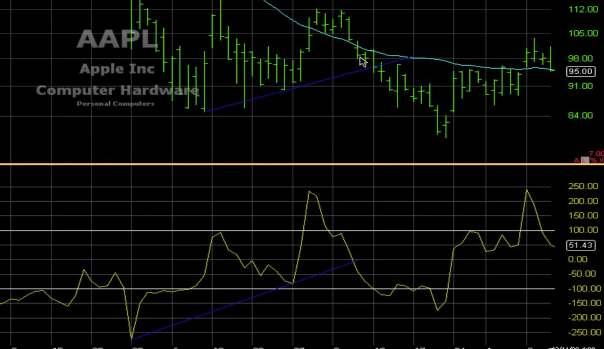
38 Trendlinebreak
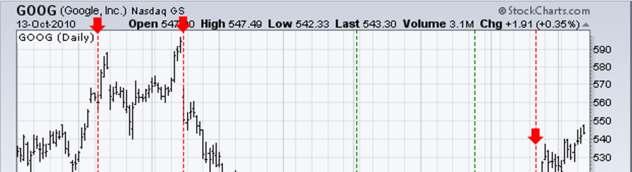
39 Trendline break Identify trend-ma, e.gma slope down, only take trendline breaks on the downside Draw trendlineon CCI, connects lows on CCI Enter at break of CCI trendline CCI Trendlinebreak earlier allows earlier entry than break on price, with confirmation Lead to higher profits
40
41 Additional Add in filters like a MA line to figure out the general direction of the trend, helping you choose between long and short plays
42 Conclusion CCI is a versatile momentum oscillator that can be used to identify overbought/oversold levels or trend reversals. The indicator becomes overbought or oversold when it reaches a relative extreme. That extreme depends on the characteristics of the underlying security and the historical range for CCI.
43 Conclusion Volatile securities are likely to require greater extremes than docile securities. Trend changes can be identified when CCI crosses a specific threshold between zero and 100. use CCI in conjunction with other indicators or price analysis. Another momentum oscillator would be redundant, but On Balance Volume (OBV) or the Accumulation Distribution Line can add value to CCI signals.
44
45 THANK YOU! TECHNICAL FM & BC MODEL ANALYSIS DOW THEORY Q & Q A & A
Technical Analysis Workshop Series. Session Three
 Technical Analysis Workshop Series Session Three DISCLOSURES & DISCLAIMERS This research material has been prepared by NUS Invest. NUS Invest specifically prohibits the redistribution of this material
Technical Analysis Workshop Series. Session 11 Semester 2 Week 5 Oscillators Part 2
 Technical Analysis Workshop Series Session 11 Semester 2 Week 5 Oscillators Part 2 DISCLOSURES & DISCLAIMERS This research material has been prepared by NUS Invest. NUS Invest specifically prohibits the
Technical Analysis Workshop Series. Session Ten Semester 2 Week 4 Oscillators Part 1
 Technical Analysis Workshop Series Session Ten Semester 2 Week 4 Oscillators Part 1 DISCLOSURES & DISCLAIMERS This research material has been prepared by NUS Invest. NUS Invest specifically prohibits the
Technical Analysis Workshop Series. Session Six 1, 2, 3 Price-Bars Patterns
 Technical Analysis Workshop Series Session Six 1, 2, 3 Price-Bars Patterns DISCLOSURES & DISCLAIMERS This research material has been prepared by NUS Invest. NUS Invest specifically prohibits the redistribution
Introduction. Leading and Lagging Indicators
 1/12/2013 Introduction to Technical Indicators By Stephen, Research Analyst NUS Students Investment Society NATIONAL UNIVERSITY OF SINGAPORE Introduction Technical analysis comprises two main categories:
OSCILLATORS. TradeSmart Education Center
 OSCILLATORS TradeSmart Education Center TABLE OF CONTENTS Oscillators Bollinger Bands... Commodity Channel Index.. Fast Stochastic... KST (Short term, Intermediate term, Long term) MACD... Momentum Relative
Class 7: Moving Averages & Indicators. Quick Review
 Today s Class Moving Averages Class 7: Moving Averages & Indicators 3 Key Ways to use Moving Averages Intro To Indicators 2 Indicators Strength of Lines Quick Review Great for establishing point of Support
Technical Analysis Workshop Series. Session Two
 Technical Analysis Workshop eries ession Two DICLOURE & DICLAIMER This research material has been prepared by NU Invest. NU Invest specifically prohibits the redistribution of this material in whole or
Chapter 2.3. Technical Analysis: Technical Indicators
 Chapter 2.3 Technical Analysis: Technical Indicators 0 TECHNICAL ANALYSIS: TECHNICAL INDICATORS Charts always have a story to tell. However, from time to time those charts may be speaking a language you
By Tri, Senior Analyst
 1/1/2014 Trend Following By Tri, Senior Analyst NUS Students Investment Society NATIONAL UNIVERSITY OF SINGAPORE Introduction Trend following was introduced by Richard Dennis when he taught trading strategies
Chapter 2.3. Technical Indicators
 1 Chapter 2.3 Technical Indicators 0 TECHNICAL ANALYSIS: TECHNICAL INDICATORS Charts always have a story to tell. However, sometimes those charts may be speaking a language you do not understand and you
The very first calculations for average gain and average loss are simple 14- period averages.
 Introduction Developed by J. Welles Wilder, the Relative Strength Index (RSI) is a momentum oscillator that measures the speed and change of price movements. RSI oscillates between zero and 100. Traditionally,
Stock Market Basics Series
 Stock Market Basics Series HOW DO I TRADE STOCKS.COM Copyright 2012 Stock Market Basics Series THE STOCHASTIC OSCILLATOR A Little Background The Stochastic Oscillator was developed by the late George Lane
Maybank IB. Understanding technical analysis. by Lee Cheng Hooi. 24 September Slide 1 of Maybank-IB
 Maybank IB Understanding technical analysis 24 September 2011 by Lee Cheng Hooi Slide 1 of 40 Why technical analysis? 1) Market action discounts everything 2) Prices move in trends 3) History repeats itself
Real-time Analytics Methodology
 New High/Low New High/Low alerts are generated once daily when a stock hits a new 13 Week, 26 Week or 52 Week High/Low. Each second of the trading day, the stock price is compared to its previous 13 Week,
DAILY TECHNICAL REPORT
 RESEARCH TEAM DAILY TECHNICAL REPORT DISCLAIMER & DISCLOSURES Please read the disclaimer and the disclosures which can be found at the end of this report EUR / USD Declining sharply. EUR/USD has broken
Introductory Fundamental and Technical Analysis
 Introductory Fundamental and Technical Analysis Tan Junda junda@uobkayhian.com (65) 6590 6616 Jeffrey Tan jeffreytan@uobkayhian.com (65) 6590 6629 Our Focus Today What kind of investor are you? Technical
USING THE STOCHASTIC OSCILLATOR 12th February 2015
 TAFX USING THE STOCHASTIC OSCILLATOR 12th February 2015 Disclaimer is in no way affiliated or representative of any other company, organisation, club or society, and the views presented are solely our
Using Acceleration Bands, CCI & Williams %R
 Price Headley s Simple Trading System for Stock, ETF & Option Traders Using Acceleration Bands, CCI & Williams %R How Technical Indicators Can Help You Find the Big Trends For any type of trader, correctly
The Technical Edge Page 1. The Technical Edge. Part 1. Indicator types: price, volume, and moving averages and momentum
 The Technical Edge Page 1 The Technical Edge INDICATORS Technical analysis relies on the study of a range of indicators. These come in many specific types, based on calculations or price patterns. For
DAILY TECHNICAL REPORT
 RESEARCH TEAM DAILY TECHNICAL REPORT DISCLAIMER & DISCLOSURES Please read the disclaimer and the disclosures which can be found at the end of this report EUR / USD Bouncing further. EUR/USD has broken
Forex Sentiment Report Q2 FORECAST WEAK AS LONG AS BELOW April
 Forex Sentiment Report 08 April 2015 www.ads-securities.com Q2 FORECAST WEAK AS LONG AS BELOW 1.1200 Targets on a break of 1.1534/35: 1.1740/50 1.1870/75 1.2230/35 Targets on a break of 1.0580/70: 1.0160
TECHNICAL REPORT DAILY RESEARCH TEAM. 04 October 2016 DISCLAIMER & DISCLOSURES
 DAILY TECHNICAL REPORT RESEARCH TEAM DISCLAIMER & DISCLOSURES Please read the disclaimer and the disclosures which can be found at the end of this report EUR / USD Monitor the support at 1.1160. EUR/USD
Technical Analysis. Dealing Room Peter Leonidou. Peter Leonidou
 Technical Analysis Dealing Room Questions Traders Should Ask What is the trend? What is the pivot point? What is the support levels? What is the resistance levels? Strong or weaker USD? What 1. Trade
Introduction. Technicians (also known as quantitative analysts or chartists) usually look at price, volume and psychological indicators over time.
 usually look at price, volume and psychological indicators over time.") Technical Analysis Introduction Technical Analysis is the study of market action, primarily through the use of charts, for the purpose of forecasting future price trends. Technicians (also known as quantitative
Technical Analysis Introduction Technical Analysis is the study of market action, primarily through the use of charts, for the purpose of forecasting future price trends. Technicians (also known as quantitative
The Schaff Trend Cycle
 The Schaff Trend Cycle by Brian Twomey This indicator can be used with great reliability to catch moves in the currency markets. Doug Schaff, president and founder of FX Strategy, created the Schaff trend
DAILY TECHNICAL REPORT
 RESEARCH TEAM DAILY TECHNICAL REPORT DISCLAIMER & DISCLOSURES Please read the disclaimer and the disclosures which can be found at the end of this report EUR / USD Continued selling pressures. EUR/USD
DAILY TECHNICAL REPORT
 RESEARCH TEAM DAILY TECHNICAL REPORT DISCLAIMER & DISCLOSURES Please read the disclaimer and the disclosures which can be found at the end of this report EUR / USD Trying to bounce. EUR/USD is bouncing
What is Technical Analysis
 Reg. office: International School of Financial Market, Plot no. 152 - P (LGF), Sec - 38, Medicity Road, Gurgaon - 122002 Contact no. : 0124-2200689,+919540008689, 9654446629 Web : www.isfm.co.in, Email
Introduction. Technical analysis is the attempt to forecast stock prices on the basis of market-derived data.
 Technical Analysis Introduction Technical analysis is the attempt to forecast stock prices on the basis of market-derived data. Technicians (also known as quantitative analysts or chartists) usually look
Martin Pring s. Weekly InfoMovie Report. April 8, 2014
 Martin Pring s Weekly InfoMovie Report April 8, 2014 Issue 1093 Weekly InfoMovie Report 1 Key level remains $184 on the SPY. US Equity Market - Last time I pointed out that the $184 level on the S&P ETF
GUIDE TO STOCK trading tools
 P age 1 GUIDE TO STOCK trading tools VI. TECHNICAL INDICATORS AND OSCILLATORS I. Introduction to Indicators and Oscillators Technical indicators, to start, are data points derived from a specific formula.
TD AMERITRADE Technical Analysis Night School Week 2
 TD AMERITRADE Technical Analysis Night School Week 2 Hosted By Derek Moore Director, National Education For the audio portion of today s webcast, please enable your computer speakers. Past performance
Table of Contents. Risk Disclosure. Things we will be going over. 2 Most Common Chart Layouts Anatomy of a candlestick.
 Table of Contents Risk Disclosure Things we will be going over 2 Most Common Chart Layouts Anatomy of a candlestick Candlestick chart Anatomy of a BAR PLOT Indicators Trend-Lines Volume MACD RSI The Stochastic
DAILY TECHNICAL REPORT
 RESEARCH TEAM DAILY TECHNICAL REPORT DISCLAIMER & DISCLOSURES Please read the disclaimer and the disclosures which can be found at the end of this report EUR / USD Decreasing. EUR/USD is decreasing following
How I Trade Profitably Every Single Month without Fail
 How I Trade Profitably Every Single Month without Fail First of all, let me take some time to introduce myself to you. I am Koon Hwee (KH Lee) and I am a full time currency trader. I have a passion for
DAILY TECHNICAL REPORT
 RESEARCH TEAM DAILY TECHNICAL REPORT DISCLAIMER & DISCLOSURES Please read the disclaimer and the disclosures which can be found at the end of this report EUR / USD Further sideways trading. EUR/USD sideways
DAILY TECHNICAL REPORT
 RESEARCH TEAM DAILY TECHNICAL REPORT DISCLAIMER & DISCLOSURES Please read the disclaimer and the disclosures which can be found at the end of this report EUR / USD Grinding higher. EUR/USD continues its
SXXP and SX5E nearing their downtrends. Gold remains a short in line with the trend. Dollar index at key support. EURUSD bearish candle
 Andy Dodd MSTA - +44 020 7031 4651 adodd@louiscapital.com Twitter : @louiscaptech SXXP and SX5E nearing their downtrends. Gold remains a short in line with the trend Dollar index at key support EURUSD
Technical Analysis Indicators
 Technical Analysis Indicators William s Percent R Rules, Scans, Adding Filters, Breakout, Retest, and Application across MTFs Course Instructor: Price Headley, CFA, CMT BigTrends Coaching Access to BigTrends
Profiting. with Indicators. By Jeff Drake with Ed Downs
 Profiting with Indicators By Jeff Drake with Ed Downs Profiting with Indicators By Jeff Drake with Ed Downs Copyright 2018 Nirvana Systems Inc. All Rights Reserved The charts and indicators used in this
DAILY TECHNICAL REPORT
 RESEARCH TEAM DAILY TECHNICAL REPORT DISCLAIMER & DISCLOSURES Please read the disclaimer and the disclosures which can be found at the end of this report EUR / USD Decreasing. EUR/USD is declining, approaching
Aluminium US Mid West Trans Premium Swap
 Trading Aluminium The technical footprint within the Aluminium US Mid West Premium swap. Agenda Disclaimer This document is made available for general information purposes only and does not constitute
INTERMEDIATE EDUCATION GUIDE
 INTERMEDIATE EDUCATION GUIDE CONTENTS Key Chart Patterns That Every Trader Needs To Know Continution Patterns Reversal Patterns Statistical Indicators Support And Resistance Fibonacci Retracement Moving
Williams Percent Range
 Williams Percent Range (Williams %R or %R) By Marcille Grapa www.surefiretradingchallenge.com RISK DISCLOSURE STATEMENT / DISCLAIMER AGREEMENT Trading any financial market involves risk. This report and
Technical Analysis and Charting Part II Having an education is one thing, being educated is another.
 Chapter 7 Technical Analysis and Charting Part II Having an education is one thing, being educated is another. Technical analysis is a very broad topic in trading. There are many methods, indicators, and
Weekly outlook for Jan 16 Jan
 Weekly outlook for Jan 16 Jan 20 2017 TREND DIRECTION S&P 500 Oil Gold Short Term Intermediate-Term Long Term weak strong strong weak Strong Less strong strong weak strong Conclusion: S&P500 indicator
DAILY TECHNICAL REPORT
 RESEARCH TEAM DAILY TECHNICAL REPORT DISCLAIMER & DISCLOSURES Please read the disclaimer and the disclosures which can be found at the end of this report EUR / USD Increasing. EUR/USD is bouncing back
Technical Analysis for Options Trading. Fidelity Brokerage Services LLC, Member NYSE, SIPC, 900 Salem Street, Smithfield, RI
 Technical Analysis for Options Trading Fidelity Brokerage Services LLC, Member NYSE, SIPC, 900 Salem Street, Smithfield, RI 02917 747561.2.0 Disclosures Options trading entails significant risk and is
PRESENTS CHARTING MADE EASY ALL TRADING INFORMATION REVEALED
 PRESENTS CHARTING MADE EASY ALL TRADING INFORMATION REVEALED 1 INTRODUCTION Over the years, investors have developed literally, hundred thousand of different technical market indicators in their efforts
Figure 3.6 Swing High
 Swing Highs and Lows A swing high is simply any turning point where rising price changes to falling price. I define a swing high (SH) as a price bar high, preceded by two lower highs (LH) and followed
PART 3 - CHART PATTERNS & TECHNICAL INDICATORS
 Tyler Chianelli s EASYOPTIONTRADING by OPTION TRADING COACH PART 3 - CHART PATTERNS & TECHNICAL INDICATORS A SIMPLE SYSTEM FOR TRADING OPTIONS WORKS IN UP, DOWN, AND SIDEWAYS MARKETS PART 3.1 - PRIMARY
EZ Trade FOREX Day Trading System. by Beau Diamond
 EZ Trade FOREX Day Trading System by Beau Diamond The EZ Trade FOREX Day Trading System is mainly used with four different currency pairs; the EUR/USD, USD/CHF, GBP/USD and AUD/USD, but some trades are
S&P Cash Long Term: Uptrend Intact. Monthly Log Chart
 Andy Dodd MSTA - +44 020 7031 4651 adodd@louiscapital.com Twitter : @louiscaptech S&P Cash Long Term: Uptrend Intact Despite an initial slowdown in momentum following the break above 2120 in July, which
Perry Kaufman. Stock Arbitrage: 3 Strategies
 Perry Kaufman Stock Arbitrage: 3 Strategies Disclaimer 2 This document has been prepared for information purposes only. It shall not be construed as, and does not form part of an offer, nor invitation
Continued on Next Page
 An Overview of Super DMI : A New & Improved DMI Indicator Page 3 A Comparison of the Super DMI vs. Regular DMI: Old vs. New Page 4 - An Overview of Super DMI Features Page 4 Smoothing Price Data to Improve
Martin Pring s. Weekly InfoMovie Report. December 27, Happy New Year to Our Wonderful Subcriber Family! May 2013 be Prosperous and Productive!
 Martin Pring s Weekly InfoMovie Report December 27, 2012 Issue 1028 Happy New Year to Our Wonderful Subcriber Family! May 2013 be Prosperous and Productive! The Pring Family ~ 2012 Weekly InfoMovie Report
Schwab Investing Insights Trading Edition Text Close Window Size: November 15, 2007
 Schwab Investing Insights Trading Edition Text Close Window Size: from TheStreet.com November 15, 2007 ON TECHNIQUES Two Indicators Are Better Than One The Relative Strength Index works well but it s better
S&P Cash Long Term: Uptrend Intact. Monthly Log Chart
 Andy Dodd MSTA - +44 020 7031 4651 adodd@louiscapital.com Twitter : @louiscaptech S&P Cash Long Term: Uptrend Intact Despite an initial slowdown in momentum following the break above 2120 in July, which
Charting Glossary. September 2008 Version 1
 Charting Glossary September 2008 Version 1 i Contents 1 Price... 1 2 Charts... 1 2.1 Line, Step, Scatter, Histogram/Mountain charts...1 2.2 Open/High/Low/Close charts (Bar Charts)...1 2.3 Candle charts...2
Homework Assignment #1 - Based on the MTAEF Glossary of Technical Terms
 Homework Assignment #1 - Based on the MTAEF Glossary of Technical Terms Each block of 3 question is preceded by 5 technical terms. Fill in the blank and make the statement complete. There is only one correct
Constellation Brands
 1/7 TRADING ALERT Constellation Brands huteauth@trendandtiming,com Phone: 33 (0) 6 11 88 36 11 5-Jan-18 INDEX COMPANY RIC NAME ABSOLUTE TREND Close INDEX S&P 500 INDEX/d COMPANY CONSTELLATION /d d-1 Volat
Technical Indicators versiunea
 Technical Indicators versiunea 2.0 03.10.2008 Contents 1 Price... 1 2 Charts... 1 2.1 Line, Step, Scatter, Histogram/Mountain charts 1 2.2 Open/High/Low/Close charts (Bar Charts)... 2 2.3 Candle charts...
TMT Deep Dive 2/20/2017
 60 Deep Dive 2/20/2017 Technology continues its surge as absolute and relative prices reach new highs on a cap, equal weight, and global basis. Tech remains our top ranked sector however, our sector rankings
Date: 21 September Contents (ctrl+click to follow link): SP 500
: SP 500") Date: 21 September 2015 Contents (ctrl+click to follow link): SP 500 ; Top 40 Chart ; Currency ; Charts of Interest ; Relative Rotation Graph ; Scatter Graph ; Sector Analysis ; Weekly Perfomances SP 500
Date: 21 September 2015 Contents (ctrl+click to follow link): SP 500 ; Top 40 Chart ; Currency ; Charts of Interest ; Relative Rotation Graph ; Scatter Graph ; Sector Analysis ; Weekly Perfomances SP 500
BUY SELL PRO. Improve Profitability & Reduce Risk with BUY SELL Pro. Ultimate BUY SELL Indicator for All Time Frames
 BUY SELL PRO Improve Profitability & Reduce Risk with BUY SELL Pro Ultimate BUY SELL Indicator for All Time Frames Risk Disclosure DISCLAIMER: Crypto, futures, stocks and options trading involves substantial
Stocks & Commodities V. 11:9 ( ): Trading Options With Bollinger Bands And The Dual Cci by D.W. Davies
: Trading Options With Bollinger Bands And The Dual Cci by D.W. Davies") Trading Options With Bollinger Bands And The Dual CCI by D.W. Davies Combining two classic indicators, the commodity channel index (CCI) and Bollinger bands, can be a potent timing tool for options trading.
Trading Options With Bollinger Bands And The Dual CCI by D.W. Davies Combining two classic indicators, the commodity channel index (CCI) and Bollinger bands, can be a potent timing tool for options trading.
Monthly Dairy Technical Commentary August 19, 2015
 Monthly Dairy Technical Commentary August 19, 2015 CME Class III Milk Futures Range contraction continues for Class III Milk as it continues to correct the September 2014 through January 2015 downdraft.
IronFX. technical indicators
 IronFX technical indicators Average Directional Index (ADX) The Average Directional Index (ADX) helps traders see if a trend is developing in the charts and whether the trend is strengthening or weakening.
PROFITABILITY OF TECHNICAL ANALYSIS INDICATORS TO EARN ABNORMAL RETURNS IN INTERNATIONAL EXCHANGE MARKETS
 Doi: 10.15863/TAS International Scientific Journal Theoretical & Applied Science p-issn: 2308-4944 (print) Year: 2014 Issue: 11 Volume: 19 Published: 30.11.2014 e-issn: 2409-0085 (online) http://www.t-science.org
Subject: Daily report explanatory notes, page 2 Version: 0.9 Date: Dec 29, 2013 Author: Ken Long
 Subject: Daily report explanatory notes, page 2 Version: 0.9 Date: Dec 29, 2013 Author: Ken Long Description Example from Dec 23, 2013 1. Market Classification: o Shows market condition in one of 9 conditions,
Equities: Weekly Technical Overview 2nd October 2016
 Andy Dodd MSTA - +44 020 7031 4651 adodd@louiscapital.com Twitter : @louiscaptech Equities: Weekly Technical Overview 2nd October 2016 Equity Index Technical Dashboard The table below is intended as an
CHAPTER V TIME SERIES IN DATA MINING
 CHAPTER V TIME SERIES IN DATA MINING 5.1 INTRODUCTION The Time series data mining (TSDM) framework is fundamental contribution to the fields of time series analysis and data mining in the recent past.
Understanding Oscillators & Indicators March 4, Clarify, Simplify & Multiply
 Understanding Oscillators & Indicators March 4, 2015 Clarify, Simplify & Multiply Disclaimer U.S. Government Required Disclaimer Commodity Futures Trading Commission Futures and Options trading has large
Different Classes Of Divergence
 Russ Horn Presents Different Classes Of Divergence RISK DISCLOSURE STATEMENT / DISCLAIMER AGREEMENT Trading any financial market involves risk. This report and all and any of its contents are neither a
Using Oscillators & Indicators Properly May 7, Clarify, Simplify & Multiply
 Using Oscillators & Indicators Properly May 7, 2016 Clarify, Simplify & Multiply Disclaimer U.S. Government Required Disclaimer Commodity Futures Trading Commission Futures and Options trading has large
Stock Market Report. December 08, 2004
 December 8, 24 Stock Market Report Market Analysis for Period Ending Friday, December 3, 24 This document presents technical and fundamental analysis commonly used by investment professionals to interpret
The goal for Part One is to develop a common language that you and I
 PART ONE Basic Training The goal for Part One is to develop a common language that you and I can use. The rest of the book will discuss how the technical indicators highlighted in the first two chapters
MONTHLY TECHNICAL REPORT
 The purpose of producing this report is to present a general view on the market, equities and commodities subject under research, and not to recommend a buy/sell/hold for any security or any other assets.
Flash Report Silver. follow me October 29 th, Quantitative approach for asymmetric results. Silver: investors on a verge of a nerve crisis
 Flash Report Silver follow me October 29 th, 2014 Francesco Maggioni francesco.maggioni@gmail.com IT +39 393 70 40 234 UK +44 757 681 62 43 Quantitative approach for asymmetric results Silver: investors
Market Update April 20, 2015
 SeattleTA provides investment managers with technical analysis of the equity, fixed-income, commodity, and The forecast for a high on April 15 was spot-on (there s no kill switch on awesome!). The monthly
SXXP *351.51* Key Resistance
 Andy Dodd MSTA - +44 020 7031 4651 adodd@louiscapital.com Twitter : @louiscaptech Equity Index Technical Dashboard The table below is intended as an easy to read reference of key levels and trends. For
TRADING ADDICTS. Lesson 3: Timing and Technical Indicators. Timing the Market. Copyright 2010, Trading Addicts, LLC. All Rights Reserved
 Lesson 3: Timing and Technical Indicators In this chapter, we will be focusing on the timing of the trade, from each individual angle. Timing plays a critical role in a Covered Call strategy, as it can
Big Picture report April 17 th 2012
 Big Picture report April 17 th 2012 Francesco Maggioni francesco.maggioni@gmail.com +39 393 70 40 234 Quantitative approach for asymmetric results Bouncing back and maybe going beyond recent highs.. and
END OF DAY DATA CORPORATION. Scanning the Market. using Stock Filter. Randal Harisch 2/27/2011
 END OF DAY DATA CORPORATION Scanning the Market using Stock Filter Randal Harisch 2/27/2011 EOD's Stock Filter tool quickly searches your database, identifying stocks meeting your criteria. The results
Stock Market Report. January 26, 2005
 January 26, 25 Stock Market Report Market Analysis for Period Ending Friday, January 21, 25 This document presents technical and fundamental analysis commonly used by investment professionals to interpret
IndiaNivesh Weekly Pulse
 23rd Feb 2018 IndiaNivesh Weekly Pulse RETAIL TECHNICAL RESEARCH The closing of Feb 2018 might decide the fate of the markets! Close 10491 Chart 1 : Nifty Daily & Hourly R1 / R2 10630/ 10700 S1 / S2 10276/
RISK DISCLOSURE STATEMENT / DISCLAIMER AGREEMENT
 RISK DISCLOSURE STATEMENT / DISCLAIMER AGREEMENT Trading any financial market involves risk. This report and all and any of its contents are neither a solicitation nor an offer to Buy/Sell any financial
Contents: Top 40 Chart ; Currency ; Charts of Interest ; Scatter Graph ; Relative Rotation Graph ; Stats. Top 40 Chart
 Contents: Top 40 Chart ; Currency ; Charts of Interest ; Scatter Graph ; Relative Rotation Graph ; Stats Top 40 Chart 1 Last week we saw the Top 40 approaching some moving average resistances, we have
AUTHOR: NG EE HWA, TRAINER, CHARTNEXUS TRADING WITH RSI
 AUTHOR: NG EE HWA, TRAINER, CHARTNEXUS TRADING WITH RSI While the use of Relative Strength Index (RSI) to get technical buy and sell signals in a range-bound market is well understood, the use of this
20.2 Charting the Market
 NPTEL Course Course Title: Security Analysis and Portfolio Management Course Coordinator: Dr. Jitendra Mahakud Module-10 Session-20 Technical Analysis-II 20.1. Other Instruments of Technical Analysis Several
A Fuzzy Logic Stock Trading System Based On Technical Analysis
 Regis University epublications at Regis University All Regis University Theses Summer 2011 A Fuzzy Logic Stock Trading System Based On Technical Analysis Sammy Zeigenbein Regis University Follow this and
FOREX TRADING STRATEGIES.
 FOREX TRADING STRATEGIES www.ifcmarkets.com www.ifcmarkets.com 2 One of the most powerful means of winning a trade is the portfolio of Forex trading strategies applied by traders in different situations.
Power Ranger Strategy
 Power Ranger Strategy Power Ranger Strategy Strategy Concept Using the common oscillator, the Stochastic to identify entry for early range trading. Time-frame H1 and above. Currency Pairs All currency
Expert Trend Locator. The Need for XTL. The Theory Behind XTL
 Chapter 20 C H A P T E R 20 The Need for XTL esignal does an excellent job in identifying Elliott Wave counts. When combined with studies such as the Profit Taking Index, Wave Four Channels, Trend Channels
Market Maps. Bob Dickey, Technical Strategist, Portfolio Advisory Group. December RBC Capital Markets, LLC / Portfolio Advisory Group
 Market Maps Bob Dickey, Technical Strategist, Portfolio Advisory Group RBC Capital Markets, LLC / Portfolio Advisory Group All values in U.S. dollars and priced as of market close, December 1, 2017, unless
Understanding of Price-Volume -Open Interest in futures market
 Understanding of Price-Volume -Open Interest in futures market Introduction Price, Volume and Open interest are the most important market determinants in futures market. Among these, price is more important.
CHAMELEON INDICATORS. A new way to view the markets. Alex Cole 05/10/17
 CHAMELEON INDICATORS A new way to view the markets. Alex Cole 05/10/17 THE CHAMELEON TREND AND CHAMELEON OSCILLATOR STUDIES One of the most important benefits of visualization is that it allows us visual
Stock Market Report Review
 January 7, 25 Stock Market Report - 24 Review Market Analysis for Period Ending Friday, December 31, 24 This document presents technical and fundamental analysis commonly used by investment professionals
 ADDING THE MACD Forex Strategy Master Published by Old Tree Publishing CC Suite 509, Private Bag X503 Northway, 4065, KZN, ZA www.oldtreepublishing.com Copyright 2013 by Old Tree Publishing CC, KZN, ZA