BONUS.
|
|
|
- Winfred Doyle
- 6 years ago
- Views:
Transcription


1 1


2 BONUS 2
3 3
4 4
5 5

6 6

7 7
8 8
9 SWING TRADING USING CANDLESTICKS From A to Z 9
10 INTRODUCTION This webinar on swing trading is about making money in ANY market when the market is bullish, or bearish, or just going sideways. It's not just about theory. Our goal is not to teach you how to invest for the long term but rather the teach you highly effective short -term trading strategies. 10
11 THE ESSENCE OF TECHNICAL ANALYSIS Without a doubt, the profitable use of technical analysis is dependent upon the following: Rules must be 100% objective Because technical analysis gives you buy, hold, and/or sell signals, these indicators of must be specific and not subject to any interpretation. All situations are either white or black. Either you are a buyer or a seller. If you are not a buyer or a seller, then you have no position. 11
12 TECHNICAL ANALYSIS The method must not only tell you when to buy or sell, but must also give you a specific place to exit your trade if you are wrong. No method or technical technique in any market or, for that matter, in any form of investing, is 100% correct. The method should give you an idea of how much money you can make. Although this information is not vital, it is helpful. The method should also tell you which chart or charts to buy or sell. There are thousands of instruments. Because you cannot investing all of them, you must be selective. Picking and choosing randomly or on the basis of gut feelings will not work for you. You need a specific and consistent approach. 12
13 TECHNICAL ANALYSIS You need to be consistent in your application of the rules. You need to do your homework by studying charts at regular intervals as prescribed by the system or method you are using. You need to practice solid risk management principles in order to maximize profits and minimize losses Indeed, there are more rules and procedures, but they are the most important ones to follow. You must always think of investing and trading as a business. If you follow the rules and do your job with patience, persistence, inconsistency, you will have consistent success. If, however, you apply the methods taught here without consistency, you will become a statistic as you join the ranks of losers. 13
14 ENTER SWING TRADING Natural ebbs and flows of markets occur over time. Markets often thrust, rest and thrust again. Many times these thrust can be substantial but, unfortunately, are short-lived. In fact, based on research conducted by hedge fund manager Mark Boucher, 70% of a markets moves occur in 20% of the time. The rest of the time, markets consolidate by trading back and forth to digest their gains. The intermediate term trader is willing to sit through these periods for weeks to months. On the other hand, the nimble swing trader carefully picks his spots and is able to capture the crux of a markets move without the excessive risks of a longer term market exposure. 14
15 SWING TRADING What does "swing trading" really describe in our modern markets? For decades, this expression referred to a futures market strategy that held positions from one to three days in order to capitalize on cyclical swings in buying and selling behavior. This classic concept now describes any execution method that avoids the hyperactivity of day trading. But this generic definition narrows the utility of this powerful art. 15
16 SWING TRADING In reality, swing trading characterizes a time frame independent strategy that execute single, direct price movement. In this era of massive market liquidity, the swing trader may find excellent opportunities on both five minutes and weekly charts. 16
17 HOLDING PERIOD AND CHART CORRELATION Trade Type Holding Period 3D Chart Combination Scalpers Seconds to minutes 1-minute 5-minute 15-minute Day Traders Minutes to hours 1-minute 5-minute 60-minute Position traders Hours to days 60-minute daily weekly Investors Days to weeks Daily weekly monthly Institutions Weeks to years Weekly monthly yearly 17
18 SWING TRADING Swing trading allows you to accumulate small gains weekly, ultimately making money through a disciplined, low -risk trading approach. 18
19 WHY DOES SWING TRADING WORK? Because you are trading in the direction of the trend. You wait for a pullback before entering the trade, and you enter only if the chart shows a sign that it s price will continue in the direction of the trend. The main objective of a swing trader is to profit from swings in price movement over the course of several candles (weeks/days/hours, etc). While we might trade every day, we are not day traders. As swing traders, we have the patience to wait until our profit goals have been reached. Fortunately, the wait is not too long. A typical trade is only in play from a few candles (hours to days to a few weeks). When a trade is closed, the funds go into the next trade. 19
20 WHAT WILL THIS COURSE WILL TEACH YOU? The rational behind swing trading How to identify charts to swing trade When to enter a trade When to exit a trade How to maximize profits and minimize risk What tools are available to help you select charts and monitor your progress What resources to access to learn more about swing trading 20
21 SWING TRADING The best part of my swing trading method is that you do not have to watch your positions during the day. Simply enter an order to buy or sell short, give your discount broker the buy order and two sell orders and go back to your daily life. 21
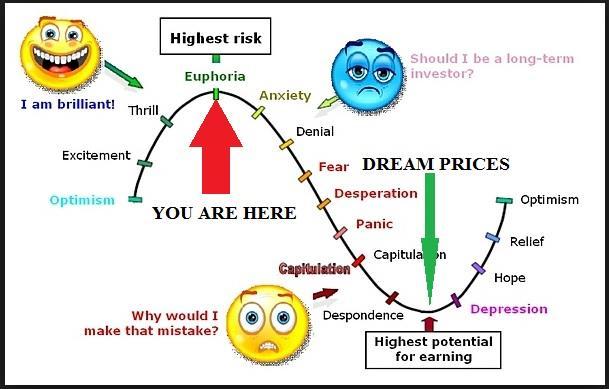
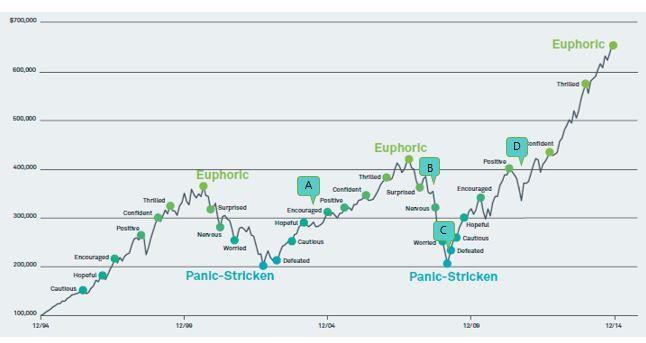
22 SWING TRADERS Prices rise and fall, with rising prices being stimulated by greed and falling prices by the awakening of fear. This emotional war between greed and fear generates a swinging price movement that provides a perfect opportunity for swing trading. Swing Traders capitalize on the emotions of others while they carefully control their own emotions and systematically enter and exit trades. Swing Traders recognize the levels of support and resistance. They understand the concepts of momentum and volatility and can identify a trading range or channel. 22
23 SWING TRADERS Swing Traders seek to exploit direct price thrusts as they enter positions at support and resistance. By examining chart pattern characteristics they make money in both trending and range bound markets. Swing Trading is a classic strategy that involves holding charts for a short period of time (relatively speaking). Unlike day trading, Swing Trading is independent of time nevertheless, some Swing Traders will exit a slow -moving position and move onto the next opportunity. Swing Trading is very popular among short-term and mediumterm traders. It offers many virtues compared to the hyperactivity of day trading. 23
24 WHAT IS SWING TRADING? Everyone is familiar with waves. A wave alternates from positive to negative, then to positive and negative, and so on. Waves are found in nature you see waves when you throw a rock into a lake. Sound is transmitted in waves. And when prices change, they follow a wave-like pattern. The wave is rarely as orderly a sine wave, but they are waves nevertheless, and we use these waves in Swing Trading. 24
25 THE NATURE OF CYCLES Planetary Cycles Astronomical cycles Climate and weather cycles Geological cycles Organic Cycles Agricultural cycles Biological and medical cycles Brain wave cycles Electromagnetic Sound waves Economic cycles Music and rhythm cycles ETC. 25
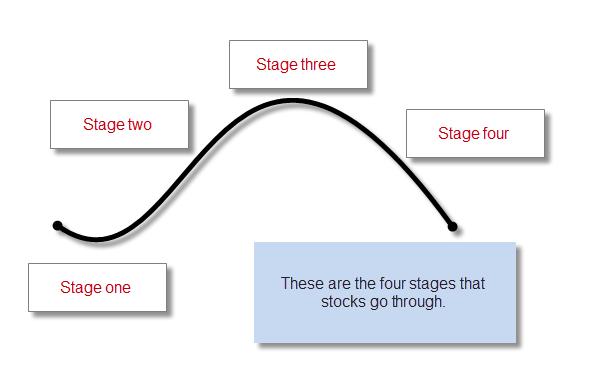
26 MARKET PHASES 26
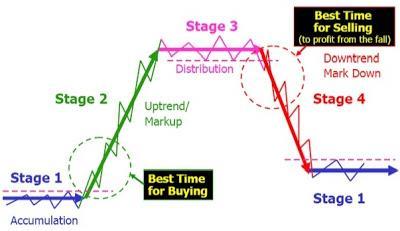
27 SECURITY CYCLE OF LIFE 1. Waiting game: accumulation 2. Big bang: expansion 3. Aftermath: distribution 4. Downfall: contraction 27
28 STAGE 1: CONSOLIDATION & ACCUMULATION This is also called base building stage or a depression stage. Basically, It is the most bottom point of the market cycle where majority of investors have lost confidence at this stage and are reluctant to invest their money in a market. Smart investors at his point are waiting to use their reserved cash to start investing when it starts moving to Stage 2 the Waiting Game. 28
29 STAGE 2: UPTREND & MARK-UP This is also called the expansion stage or mark-up stage, ie. Big Bang. At this stage, the chart has been stable for a while and starts to climb up. Novice or inexperienced investors are still hesitant to get in because they are still haven t recovered from the stage 1. Smart investor will start investing at the early of stage 2 as shown in the graph. 29
30 STAGE 3: DISTRIBUTION & PEAK This is the stage where you can hear all the good news and the economy seems like it has never been better. At this stage, most novice or inexperienced investors jump into a market because they think the prices will go even higher. Smart traders at this stage are getting ready to exit.in the Aftermath. 30
31 STAGE 4: DOWNTREND & MARK-DOWN This is a declining stage but nobody believes the downtrend especially at the early stage. They believe the downtrend is just a correction and it will go up pretty soon. On the other hand, smart investors have mostly taken profits and sold all their shares causing the share prices to drop.hence the Downfall. Novice investors will either take losses or turn to long-term hold if they reluctant to sell. 31
32 32
33 4 STAGES Note: These 4 stages of chart cycles are always correct because it is based law of nature. What is the law of nature? The law of nature is: what goes up must come down, what goes down must come up. So no matter what, the 4 stages are always correct! 33
34 34
35 35
36 36
37 37
38 38
39 LEARN HOW TO READ CHARTS Reading charts is an art form that can take years to fully master. Why do we read charts? Because, by reading charts, we can determine what the "big money" is doing! You have to be able to analyze a chart and come to a conclusion about whether or not to risk your hard earned money on a trade. That is really the bottom line. 39
40 LEARN HOW TO READ CHARTS And this is what separates the novice trader from the professional. There are several factors on a chart that make it worthy of trading. By analyzing these factors, we can determine with high probability which direction a chart will move. There several questions that you want to ask yourself when you look at a chart. Here they are... 40
41 LEARN HOW TO READ CHARTS What stage is this chart in? Is this chart in an uptrend or a downtrend? Is the chart at the beginning, middle, or end of the trend? How strong is the trend? Where are the trend lines? What wave is this chart in? What do the moving averages tell me? Was there a breakout recently? Is the chart "smooth" or "sloppy"? Are there any chart patterns? Are there wide range candles in the direction of the trend? Are there any gaps in the direction of the trend? Are professionals selling strength or buying weakness? Where are the support and resistance areas? Is this chart at a Fibonacci level? What does volume tell me? 41
42 READING CHARTS It seems like a lot of information to try and keep track of but all of the above questions are essential to chart reading mastery! Copy and print out that list of questions and keep it handy next to your computer. Make several copies if necessary) so that you can check off and make notes as you analyze your next chart. 42
43 STAGES, TRENDS AND WAVES Let's look at example charts
44 Which Stage is this chart? 44
45 45

46 46
47 LET S LOOK AT AN UP TREND Price moving up Series of higher highs and higher lows Takes a rest/pulls back A series of successive rallies and pullbacks going higher Looks like the zig-zag of a saw blade Buy long on pullback Capitalizing on predictability of the pattern 47
48 LET S LOOK AT AN DOWN TREND Price moving down Series of lower highs and lower lows Takes a rest/pulls up A series of successive sell-offs and pull ups going lower Sell short on pullback Capitalizing on predictability of the pattern 48
49 THE STEPS IN SWING TRADING STEP 1 Identify a chart that is in an uptrend or a downtrend. STEP 2 For charts in an uptrend, identify those that are experiencing a pull-back. For those in a downtrend, identify those that are experiencing a pull-up. STEP 3 Once an appropriate candidate is identified, place a limit order to buy (uptrend) or sell short (downtrend ). STEP 4 Once the candidate has been traded (a position opened), place a stop-loss order to limit downside risk and place a limit order to identify the price at which you will take profits. (Ideally, these two orders are placed together as an OCO (One Cancels Other) order; this is sometimes called an OCA (One Cancels All) order. STEP 5 At the end of each candle, adjust the stop loss prices based on your Plan. 49
50 WHAT CAN YOU EXPECT? First only a portion of your trades will be executed. The plan is to only trade candidates that initially move in the anticipated direction. If the price moves in the opposite direction (continues pulling back or pulling up), the trade is not placed. Second you will be holding positions for a limited amount of time. While swing trading is not day trading, you are only holding positions until targets are met. Third some of your trades will result in losses, however losses are minimized as your plan raises the stops as the price rises; this is known as trailing stops. Being disciplined, and following your plan will insure that profits exceed losses which means you will make money. 50
51 BUYING THE PULLBACK Buying the pullback makes good sense after a strong rally, but it's a great way to lose money if you jump in too early or too late. How can you find perfect timing when it comes to this classic play? The key lies in reading the clues of the charting landscape. It's natural for markets to correct after big rallies. This countertrend move lowers the emotional fires and sets up the ideal conditions for a swing back to higher prices. 51
52 BUYING THE PULLBACK But any pullback can turn into a reversal and trap your position in a downward spiral. So let's look at the types of pullbacks we want to buy and those that should be avoided at all costs. Volume presents important evidence about a chart's intentions when it starts to pull back. Look for selling to contract when bars test lower prices. The most bullish volume shows a steady downslope in the histograms under the price bars. This suggests shareholders are hanging tough because they believe in higher prices. Alternatively, big red volume spikes show fear and may signal important tops. 52
53 THE SWING TRADER S SWEET SPOT What is it? 53
54 THE SWEET SPOT The Sweet Spot is a buy and sell zone on a chart that swing traders can use to identify possible reversals. First of all, let's take a look at all of the different types of traders involved in the market when looking at a chart. Then, we will look at where they buy. We'll focus on the long side only. 54
55 POSITION TRADER This type of trader is looking to hold for long periods of time. They buy charts that are first breaking out of basing patterns into a stage two uptrend. This is likely where you will see institutions buying. This buying pressure is what starts the uptrend. They are hoping that the next two groups of buyers will push prices higher. 55
56 MOMENTUM TRADER This type of trader buys charts that are, well, showing momentum! They buy right after a major move and hold for a short period of time. They are hopping on a board a fast moving chart looking to capture short term gains quickly. 56
57 SWING TRADER This is where you come in! You are trading the swings within the trend. Here is a chart that may help you to better see how everything unfolds... 57
58 2. Momentum Traders Take Over 3. Swing Traders Enter 1. Position Traders Buy Breakout 58
59 You can see the Sweet Spot is the area in between the 10 SMA and 30 EMA. This is where you, as a swing trader look for reversals back to the upside when going long and reversals to the downside when shorting. 59
60 SWEET SPOT Now you can see where you fit into the big picture! It doesn't matter whether you use SMA's or EMA's. There is little difference between the two so don't get caught up in the variations. These moving averages create a zone to find our entries for long and short positions. **We'll cover the entries (and exits) in a separate section of this course. 60
61 WHAT IS SO SPECIAL ABOUT THIS SPOT? For swing trading, a lot of reversals happen in this area. In order to better focus on your trading strategy, it is helpful to narrow down your potential setups to one area on a chart. This zone provides a plethora of setups on a daily basis. We are not really concerned with the moving averages themselves. When price pulls back into this zone, look to the left to identify support and resistance, trend lines, candlestick patterns, etc. You are looking for multiple signals all pointing in the same direction. 61
62 WILL THIS STRATEGY MAKE ME A PROFITABLE TRADER? The answer is no. Surprised?? There isn't ANY trading strategy that will make you a consistently profitable trader. The only thing that will enable you to consistently pull money out of the markets is YOU. YOU must have discipline. YOU must be able to take losses. YOU must be able to take your profits. YOU must eliminate fear. Put simply, you must be able to control the emotional and psychological problems that prevent success.that will be your biggest challenge in learning how to trade with any strategy. 62
63 HOW TO TRADE PULLBACKS 63
64 PULLBACKS AND PULLUPS Buying weakness and selling strength is the art of buying pullbacks. Charts that are in up trends will pull back offering a low risk buying opportunity and charts that are in down trends will rally offering a low risk shorting opportunity. As a swing trader, you have to WAIT for these opportunities to happen because... Doesn't it make more sense to buy after a wave of selling has occurred rather than getting caught in a sell-off? Doesn't it make more sense to short after a wave of buying has occurred rather than getting caught in a rally? 64
65 PULLBACKS AND PULLUPS Absolutely! If you are buying, then you want as many sellers out before you get in. On the other hand, if you are shorting, then you want as many buyers in before you get in. This gives you a low risk entry that you can manage effectively. 65
66 BUYING PULLBACKS AND SHORTING RALLIES Where do you buy a pullback and where do you short a rally? You buy them and short them in the SWEET ZONE. 66
67 See how you are buying in strong up trends after a wave of selling has occurred? 67
68 68
69 69
70 Now see how you are shorting after a wave of buying has occurred. 70
71 71
72 TIMING THE SWEET SPOT When going long, wait for the decline into the SWEET SPOT and when going short wait for the rally up into the SWEET SPOT. Are all of them created equal? Nope. You have just a standard pullback like in the previous examples and then you have... 72
73 THE FIRST PULLBACK These are exactly what the name implies. It is the first one after a change in trend. How do you identify a change in trend - when the 10 SMA crosses the 30 EMA. After that happens, you look for an entry when the candles get into the SWEET SPOT. 73
74 Arrows represent the first pullback after a moving average crossover. 74
75 THE FIRST PULLBACK This is the most reliable type of entry and this is the likely area where institutional money is going to come into the market. If you only trade one pattern, this should be it! You can get into a trade at the beginning of a trend, at a point of low risk, and you can take partial profits and ride the trend to completion! What more could you ask for? Oh yeah, speaking of getting in on the beginning of a trend. This next setup fits neatly into a Wave pattern 75
76 FIRST PULLBACK AFTER A BREAKOUT There is one other type of pullback worth mentioning and that is the first pullback after a breakout. If you are looking at a chart that is trading sideways or forming a basing pattern, and it suddenly breaks out of the pattern, you can look to buy the first pullback after the breakout. This also gives you a low risk entry into a trade that will likely continue the current trend. 76
77 Breakout Breakout 77
78 FIRST PULLBACK AFTER A BREAKOUT Most traders are going to buy breakouts. The word breakouts sounds so exciting doesn't it? The problem with buying breakouts is that it is hardly every low risk. Think about it. If you are buying when everybody else is, then who is left to buy after you get in? Also consider this: The majority of breakouts fail and return (pullback) to the breakout point! Forget buying breakouts. Step away from the crowd. Wait for the breakout buyers to get scared and sell. This sets up the pullback that you can get into with much lower risk and higher odds of having a successful trade. 78
79 SUPPORT AND RESISTANCE LEVELS 79
80 HOW TO IDENTIFY SUPPORT AND RESISTANCE LEVEL Support and resistance identify areas of supply and demand. What exactly is supply and demand? 80
81 SUPPLY Supply is an area on a chart where sellers are likely going to overwhelm buyers causing price to go down. On a chart, we call this resistance. 81
82 DEMAND Demand is an area on a chart where buyers are likely going to overwhelm sellers causing price to go up. On a chart, we call this support. 82
83 SUPPLY AND DEMAND Knowing this, it only makes sense to buy at support and sell at resistance! 83
84 SUPPLY AND DEMAND Price runs into resistance (supply) because those traders that bought too late and saw the price go down now want to get out at break even so they sell. Price finds support (demand) because those traders that missed the move up now have a second chance to get in so they buy. Ok, you probably already knew all that but here is something that most traders do not know. There are varying degrees of support and resistance. 84
85 DEGREES OF SUPPORT & RESISTANCE On the long side: When price falls down to a prior low it is more significant than when price falls down to a prior high. On the short side: When price rises up to a prior high it is more significant that when price rises up to a prior low. 85
86 Resistance Support 86
87 TIP: The more times price hits a support or resistance area the weaker it becomes (and the possibility of a breakout increases). Resistance Support 87
88 This chart broke through resistance after hitting $26.50 several times. When it pulled back, it found support at the prior high. This chart shows how resistance, once broken, can become support. Think POLARITY. 88
89 POLARITY 89
90 Prior RESISTANCE. Now becomes SUPPORT 90
91 The highlights in green are where you would buy. 91

92 Now becomes RESISTANCE Prior SUPPORT. 92
93 The highlighted area in red is where you would short this. 93
94 A LITTLE KNOWN SECRET There are other forms of support and resistance that are not so common. For example, look for charts that pull back and find support halfway into a prior wide range candle. 94
95 Wide range candle Pull back 95
96 SUPPORT LEVELS 96
97 TREND LINES The simplest entry comes from a pullback into a strong support level. Trend lines, old highs and Bollinger Bands ease selling pressure, and allow buyers to carry the market back in the other direction. The biggest problem with these falling - knife entries is usually psychological. The trader loses confidence while watching the intensity of the selloff and fails to act when it's time to pull the trigger. 97
98 98
99 MOVING AVERAGES A trip down to the 50-day moving average offers an excellent opportunity for dip buyers who want to hold positions for a few days or a few weeks. This price zone usually marks strong support after a rally. A market pulling back here also suggests early dip buyers got beat up on the ride down. Pullbacks tend to feed on traders who buy too early. In other words, they buy and the market drops, stopping them out and forcing prices even lower. This downward spiral continues until prices reach a large pool of buying interest. This fresh demand often sits right at the 50-day moving average. 99
100 100
101 FIBONACCI RETRACEMENTS Many traders use Fibonacci retracements to uncover hidden support on a pullback. But this is a lot harder than it looks. Prices commonly drop to three different retracement levels, and you can lose a lot of money when you pick the wrong one. Fortunately there are ways to focus in and locate the most likely support level. Put the odds squarely in your favor by standing aside until price reaches a deep retracement that corresponds with other types of support. This means the safest strategy is to focus on the 62% retracement and look for intermediate averages or old highs at the same prices. This process is called cross- verification. It works because it's self - fulfilling. Different traders look for different types of support in various pullback scenarios. Finding convergence of multiple support types at narrow price levels taps into this broad set of buying signals. 101
102 102
103 FLAGS The intraday chart holds the key to pullback profits. Often, it's hard to make sense of a market pulling back on a daily chart. Fortunately trends evolve in all time frames, and traders can use the intraday chart to uncover hidden support and resistance levels. Focus on the 60-minute chart because this gives you many days of intraday price bars to work with. Pull one up when you see a correction in progress, and start searching for common patterns, such as bull flags or double bottoms. These inflection points reveal low-risk entry prices for positions taken in much longer time frames. 103
104 104
105 ESSENTIALS OF TECHNICAL ANALYSIS 105
106 SHOULD YOU USE TECHNICAL INDICATORS? Are technical indicators worth using? Which ones should I use? Is there one indicator that is better than another? MACD? Stochastics? RSI? 106
107 STOP THE MADNESS! The only thing you need is an understanding of price action. If you are new to trading you will do yourself a great disservice by trying to use technical indicators to trade. You are far better off by first learning to trade based on price action alone. So put away your OBV, CCI, and PPO for now and just focus on the chart. 107
108 LEADING AND LAGGING INDICATORS Technical indicators are generally classified into two categories: 1. Leading Indicators Leading indicators like stochastics are supposed to lead the price action. 2. Lagging Indicators. Lagging indicators like moving averages follow price action 108
109 LEADING AND LAGGING INDICATORS In reality all technical indicators are lagging indicators because they cannot draw on a chart until after the price action has already been established. Remember that all technical indicators are generated by using the high, low, open, close, or volume. It gets this information from the price action first, then it shows up on your chart as RSI, MACD, etc. Therefore, these indicators can never tell you anything more than what the chart is already saying! 109
110 LEARN HOW TO INTERPRET PRICE FIRST Ok, now that you know the truth about technical indicators, you can finally relax. You can stop looking for the perfect indicators to solve all your trading problems. So what should you look for on a chart? Good question! The main thing that you are trying to figure out on a chart is the psychology of other traders. 110
111 LEARN HOW TO INTERPRET PRICE FIRST You are trying to figure out where they are going to buy and where they are going to sell. You are trying to get into their heads! You want to know if they are excited, nervous, scared, or uninterested. 111
112 LEARN HOW TO INTERPRET PRICE FIRST Every chart, in every time frame, alternates between these four emotional extremes. Price breaks out of a consolidation (excited) Momentum slows down (nervous) Traders begin to sell (scared) The selling finishes and there is indecision (uninterested) This cycle repeats over and over again. 112
113 LEARN HOW TO INTERPRET PRICE FIRST As a trader you look at price to find the point at which one emotional state is about to evolve into another. Candlestick patterns are useful to determine these turning points. They will give you these signals far in advance of any technical indicator! 113
114 USING TECHNICAL INDICATORS THE RIGHT WAY You still want to use indicators in your trading? That's fine, just use them the right way - to indicate! If you like using RSI then use it to tell you that a turning point may be coming. Then just forget about it and focus solely on the price action. Too often we see traders buying just because an indicator is overbought or oversold. A chart can become overbought or oversold for a very long time. In the meantime you have a position that is losing money! 114
115 USING TECHNICAL INDICATORS THE RIGHT WAY Look for divergences. If there is one thing that technical indicators can be useful for is the ability to identify those times when price is at odds with the indicator. This can signal that a turning point may be coming. As always look at the candles (price) for validation. Use the right indicator for the job. For analyzing trends use trend following indicators like moving averages. For trading ranges, use oscillators like RSI. 115
116 USING TECHNICAL INDICATORS THE RIGHT WAY Remember that you do not need any kind of indicator to trade and you certainly should not be using them until you have a full understanding of how to interpret the price action. Even then you may opt to never use them in your trading. 116
117 PRACTICE MAKES PERFECT Print out 20 random charts. Do not put one technical indicator on the chart! Don't even put moving averages or volume on it. Now find a quite spot in your favorite chair and just look at the candles. Look for support and resistance, trend lines, and emotional extremes. Take a piece of paper and cover up the right edge and try to get into the heads of these traders. Can you feel what they are feeling? More importantly, can you anticipate what will come next? 117
118 THE ESSENTIALS OF TECHNICAL ANALYSIS The following Technical Analysis (TA) tools are part of the daily charting arsenal: Japanese Candlesticks Volume Volume provides clues as to the intensity of a given price move. Volume can help determine the strength of an existing trend Moving Averages shows the average value of a security's price over a period of time. 118
119 AVAILABLE TECHNICAL INDICATORS Overlays Bollinger Bands Keltner Bands Linear Regression Moving Average On Balance Volume (OBV) Parabolic SAR 119
120 AVAILABLE TECHNICAL INDICATORS Average True Range Breadth Advance/Decline Commodity Channel Index (CCI) Directional Moving Index (DMI) Force Index MACD McClellan Oscillator Indicators Momentum Money Flow Relative Strength Index (RSI) Stochastics Ultimate Oscillator Volatility Volume and Volume Average William %R 120
121 MOVING AVERAGES 121
122 THE TWO MOVING AVERAGES Most Swing Traders use two moving averages: the 10 period simple moving average (SMA) and the 30 period exponential moving average (EMA). Why? Because when the faster one (10) crosses over the slower one (30), it will often signal a trend change. 122
123 You can see in the chart how these lines can help you define trends. the 10 SMA crosses back up through the 30 EMA in September and the trend is up again - and it stays up for several months thereafter. 10 Above 30 = Trend UP 123
124 THE TWO MOVING AVERAGES RULES Focus on long positions only when the 10 SMA is above the 30 EMA. Focus on short positions only when the 10 SMA is below the 30 EMA. It doesn't get any simpler than that and it will ALWAYS keep you on the right side of the trend! 124
125 THE TWO MOVING AVERAGES RULES Note that moving averages only work well when a chart is trending - not when they are in a trading range. When a chart (or the market itself) becomes "sloppy" then you can ignore moving averages - they won't work! 125
126 THE IMPORTANT THINGS TO REMEMBER The 10 SMA must be above the 30 EMA. For Long positions (reverse for Short positions) There must be plenty of space in between the moving averages. Both moving averages must be sloping upward. 126
127 CANDLESTICKS PATTERNS 1O PATTERNS FOR SWING TRADING 127
128 CANDLESTICK PATTERNS There are many candlestick patterns that you can use for trading. Following are only a few candlestick patterns worth knowing. As a SWING TRADER, it is also important to know what kind of forces are at work to make these patterns form and know these candlestick patterns listed. 128
129 BULLISH PATTERNS If you see a bullish candlestick pattern in a level of support, fibs or pivots, then these can provide a powerful reversal! 129
130 BEARISH PATTERNS If you see a bearish candlestick pattern in a level of resistancet, fibs or pivots, then these can provide a powerful reversal! 130
131 WHY YOU NEED REVERSAL CANDLESTICK PATTERNS First, when you use reversal candlestick patterns, you are now using price action to make your trade decisions. Price action is much better than using a lagging indicator to get into a trade. Reversal Candlesticks, when they form around areas of support and resistance, etc. give you are good trade entry confirmation. You can use this reversal candlestick patterns and apply them in any swing trading strategy as part of its trade entry rules. These reversal candlestick patterns can be used in any timeframe with accuracy. 131
132 ENTRY STRATEGY 132
133 SWING TRADING ENTRY STRATEGY Your swing trading entry strategy is the most important part of the trade. This is the one time when all of your trading capital is at risk. Once the chart goes in your favor you can then relax, manage your stops, and await a graceful exit. This section explains the basic price pattern that is used to enter. Once you become familiar with it, you can try out more advanced strategies based on the specific pattern that you are trading. More on chart patterns later. With your entry strategy, the first thing that you want be able to do is identify swing points. What's a swing point you ask? This is a pattern that consists of three candles. For entries on long positions, you look for a swing point low. For entries on short positions you look for a swing point high. 133
134 IDENTIFYING REVERSALS USING SWING POINTS For a swing point low: The first candle makes a low. The second candle makes a lower low. The third candle makes a higher low. This third candle tells us that the sellers have gotten weak and price will likely reverse. For a swing point high: The first candle makes a high. The second candle makes a higher high. The third candle makes a lower high. This third candle tells us that the buyers have gotten weak and price will likely reverse. For our long entr y strategy, we are tr ying to find char ts that have pulled back and made a swing point low. 134
135 See how the pattern consists of a low (1), lower low (2), then a higher low (3)? This is a classic swing point low. Our entry strategy would be to enter this on the day of the third candle Swing Point Lows 135
136 See how the pattern consists of a high (1), higher high (2), then a lower high (3)? We would look for an entry on the third candle Swing Point Highs
137 SWING POINTS It is worth noting that NOT ALL swing points will result in a powerful reversal. However, a reversal will not happen without a swing point developing. Take the time to go though a few charts and look at the reversals that happened in the past so that you are able to quickly identify this crucial price pattern. 137
138 CONSECUTIVE PRICE PATTERNS Ideally, we want to trade charts that have consecutive down days prior to the swing point low developing. This is the best case scenario. 138
139 Here is an example on the long side Consecutive Down Days 139
140 CONSECUTIVE PRICE PATTERNS This is reversed on the short side. In this case, you want to look for consecutive up days prior to the swing point high developing. When you are looking for swing points to develop, you always want to look to the left of the chart to see if a support or resistance area has been reached on the chart. That will improve the reliability of this entry strategy. 140
141 SWING POINT RECAP Swing Point High Swing Point Low 141
142 Can you find additional Swing Points? Swing Point High Swing Point Low 142
143 ALTERNATE ENTRY STRATEGY FOR SWING TRADERS Sometimes you may want to be more aggressive with your entry
144 THE AGGRESSIVE ENTRY An aggressive entry is an entry in which you buy or short before it makes a swing point low or a swing point high. You are buying (or shorting) in anticipation of a swing point low or a swing point high developing. 144
145 3 1 2 Swing Point Low 145
146
147 WHICH ENTRY STRATEGY IS BETTER? One isn't really better than the other. It just boils down to risk versus reward. A standard entry is less risky because price has moved in your desired direction. But, often times, waiting for swing point to develop messes up your risk to reward because your stop is further away. An aggressive entry is usually riskier because price hasn't reversed yet. But, your risk to reward is better because your stop is usually closer. Consider opting for the aggressive entry if you can find a pattern suggesting a reversal on the hourly or 15 minute chart. 147
148 WHY ARE IDENTIFYING SWING POINTS IMPORTANT? They are important because they tell you when the balance of power has shifted when you are shorting rallies or buying pull backs. Think about it... Day One: Price makes a high Day Two: It makes a higher high Day Three: It makes a higher high Day Four: It makes a higher high Day Five: It makes a lower high [Note: It doesn't have to be exactly 5 days.] 148
149 WHY ARE IDENTIFYING SWING POINTS IMPORTANT? What happened on the fifth day? The bulls were able to push price to new highs on day one through four but on the fifth day they failed to do this. This means that the buyers are getting weak and the balance of power is shifting (from buyers to sellers). 149
150 WHY ARE IDENTIFYING SWING POINTS IMPORTANT? The previous scenario formed a swing point high. The same thing happens when a chart forms a swing point low. Day One: Price makes a low Day Two: It makes a lower low Day Three: It makes a lower low Day Four: It makes a lower low Day Five: It makes a higher low 150
151 WHY ARE IDENTIFYING SWING POINTS IMPORTANT? What happened on day five? The bears were able to push price to new lows on day one through four but on the fifth day they failed to do this. The balance of power has shifted from sellers to buyers and a swing point low has developed. I hope all of this isn't too confusing.. 151
152 WHY ARE IDENTIFYING SWING POINTS IMPORTANT? Just remember this: swing trading is a game - nothing more, nothing less. Your opponents are other swing traders! Everyone is trying to get into a trade before the other traders do. Get in too early and you will lose. Get in too late and you will lose. It's challenging but this is what makes the game so fun to play! 152
153 EXIT STRATEGY 153
154 SWING TRADING EXIT STRATEGY Your exit strategy consists of two parts: 1. Where will you get out of the trade if it does not go in your favor? 2. Where will you take profits if it does go in your favor? These are the two questions that make up your exit strategy. You have to be able to answer these questions in order to consistently make money in any market. 154
155 1. SETTING YOUR INITIAL STOP LOSS ORDER When you first buy (or short), you must set an initial stop loss point. This protects your capital if the trade goes against you. There are two types: A physical stop loss is an order to sell (or buy if you are short) that you place with your broker. A mental stop is YOU clicking the sell (buy) button to get out of the trade. From a technical perspective, it does not matter which type you use. 155
156 THE PLAN Before you get into a trade you will need a plan that will determine when to get out of the trade if it does not go in your favor. You are a disciplined trader that always follows your plan (right?). Whether you use a mental stop or a physical stop, you will always want to exit the trade when you predetermined plan tells you to. 156
157 THE PLAN Where is your initial stop going to be? You need a stop that makes sense and you need it to be out of the "noise" of the current activity in the chart. Look at the average range of the instrument over the past 10 days. If the average range of the price action is, say, $1.10, then your stop needs to be at least that far away from your entry price. It doesn't make any sense to have your stop.25 cents away from your entry price when the range is $1.10. You will surely get stopped out prematurely! THINK ATR (Average True Range) 157
158 For long positions, your initial stop should go under a support area and a swing point low. Like this: 158
159 Want a real easy way to set your initial stop? Put you stop loss order under the 30 period EMA. A strong chart should not fall very far below that moving average. If it does then you want to be out of it anyway
160 WHY YOU SHOULD USE A TIME STOP When you buy or short a chart, you are expecting it to go in your favor within a few days. What happens if it doesn't? Do you continue to wait for it to move in your desired direction? No. You will want to sell (or cover) your shares and move on to something else. You don't want to tie up your trading capital on something that is just trading sideways. Treat a trade like an employee. If it doesn't do what you want it to do - fire it! 160
161 2. PROFIT TAKING STRATEGIES Now you know how to get out of a trade if it does not go in your favor. Now we will talk about several exit strategies that you can use to take profits (this is the fun part!). 161
162 HOW TO USE TRAILING STOPS Using trailing stops is an easy and unemotional way of exiting a trade. If this trade is going to be a typical swing trade with a holding time of 2-5 days, then you can trail your stops 10 or 15 cents under the previous days low or the current days low - whichever is lower. 162
163 163
164 If you are able to find a chart at the beginning of a trend then you may want to hold this for a longer time frame. Having some big winners every now and then will fatten up your trading account! In this case you can trail your stops under the swing lows (or highs for shorts) until stopped out
165 SELLING AT RESISTANCE When you buy a pullback, look to the left on the chart at the previous swing point high. That is the first resistance area that price will encounter. Of course, you hope that price will power through that area. If it doesn't, sell it. Here is an example: 165
166 If you bought this on the pullback (arrow), then you would sell it at the previous swing point high (red highlighted)
167 WHY YOU SHOULD SELL INTO STRENGTH There are times when you may want to take some profits and sell into a powerful rally. 167
168 You should take profits here. A chart is prone to a sell-off once it gets extended above the 10 period moving average. In this example you can see how after you bought the pullback (arrow), this exploded through the previous swing point high
169 If you would have waited to get stopped out, you may have lost a big portion of your gains. So it makes sense to at least take a portion of your profits off the table (and put a little money in your pocket!)
170 THERE IS NO PERFECT STRATEGY I've tried just about every exit strategy out there. None are perfect. Sometimes you sell too soon. Sometimes you sell too late. That's the bad news. The good news? You do not need a perfect exit strategy to be successful. You just need to be able to protect your money when you are wrong - and take profits when you are right. 170
171 TRAILING STOPS: DAY BY DAY Your stop loss order needs to be placed after the market has closed. Memorize the following sentence... "My trailing stop loss order needs to go under the current days low or the previous days low -whichever is lower." The following is an example of how to trail your stops on a day-by-day basis
172 Trailing stop loss order: day 1 The green highlighted candle is the current day and the day that you bought this. After the market closes, you tell yourself that, "My trailing stop loss order needs to go under the current days low or the previous days low, whichever is lower. (Red line) 172
173 Trailing stop loss order: day 2 The green highlighted candle is now the current day. After the market closes, you tell yourself that, "My trailing stop loss order needs to go under the current days low or the previous days low, whichever is lower." Since the previous day is lower then your stop loss order needs to go under that day (the day of entry). You will see that your stop loss order has moved up. You always move your stop loss order up with a long position - never down
174 Trailing stop loss order: day 3 Once again, the green highlighted candle is now the current day and the market has closed. You stop loss order will go under the previous days low (red line) because it is lower. Note that at this point your stop loss order is going to be close to your entry price. Just move your stop loss order to break even. Now, you have a "free trade" and you can relax! 174
175 Trailing stop loss order: day 4 Now, your stop loss order has moved up significantly and you have a decent profit in this. If you get stopped out now, it will be a good trade! 175
176 Trailing stop loss order: day 5 So far this has been a great trade. But, now this is approaching the previous swing point high which may be a resistance area. Avoid the temptation to sell because you think that price will begin to fall. Just continue trailing your stops
177 Trailing stop loss order: day 6 Once again, your trailing stop loss order will go under the previous days low because it is lower
178 Trailing stop loss order: day 7 On this day, your stop loss order is triggered and you get stopped out of this swing trade with a nice profit. Nice trade! Remember the sentence, "My trailing stop loss order needs to go under the current days low or the previous days low - whichever is lower."? Well in this example trade we never put our stop loss order under the current days low because the previous days low was always lower
179 Here is an example of when you would put your stop loss order under the current days low. Imagine that the highlighted candle is the current day and the market has closed. Since the current days low is lower than previous day, then you need to put your stop loss order under today's low. This will make for a very tight stop loss order and the majority of the time you will get stopped out. But, as you can see from this example, sometimes you won't get stopped out and price will continue to move in your favor
180 TRAILING STOPS Trailing your stops in this manner is a great way to remove the emotion from a trade. There is no guesswork involved. You just move your stop loss order up in the manner described above and you can eliminate the "emotional selling" that seems to plague so many traders. 180
181 SOME THINGS TO CONSIDER Consider abandoning this trailing stop strategy if price suddenly moves significantly in your favor. You do not want to give up huge gains by trailing your stop loss order under a wide range candle! When price moves up to test the next resistance point, consider selling half your shares and trailing your stop loss order on the remaining shares. You do not want to get stopped out prematurely if you are at the beginning of a trend. Keep your stop loss order further away so that you can ride the trend to completion. 181
182 SOME THINGS TO CONSIDER There are no hard and fast rules for every single trade because every trade will be different. Just remember the #1 rule of trading: Keep your losses small and let your winners run. 182
183 THE 2 FOR 1 MONEY MANAGEMENT STRATEGY FOR SWING TRADERS The 2 for 1 money management strategy is a conservative way of trading, however, if you are new to trading then this will help you to stay alive while on the learning curve. This money management strategy will help maximize your profits while minimizing your losses! The basic premise of this strategy is take profits on half of your position once the instrument moves equal to your original positions stop loss. 183
184 MONEY MANAGEMENT EXAMPLE Let's suppose that you buy 500 shares at $ You determine that your stop is going to be at $ You are risking.75/share. Now if price goes in your favor you will take ½ of your profits at $35.75 and leave your stop on the remaining shares at $ What does this accomplish? Well, you took a partial profit on half your shares once the price moved equal to your positions original stop loss. Now, if you get stopped out on the remaining shares you will have lost nothing! By taking half your shares off the table, you have given yourself a "free trade" (minus commissions). Assuming that price doesn't gap down overnight, you can let the price run! 184
185 You can see that this has pulled back nicely and formed a Bullish Engulfing candle. You decide to buy 400 shares near the end of the day at $ Further, you decide that your stop loss is going to go under the low of that engulfing candle. You put in your order for your stop at $ Your risk is $.98 a share. Now you pull out your 2 for 1 money management strategy! You have already determined that your risk on this trade is $.98, so you add that to your buy price. This equals $ That is the price at which you will sell half your shares (200)
186 The next day it moves in your favor and you sell half of your shares at You have made $.98/share on 200 shares. Nice profit! Now you can relax. If you get stopped out on the remaining shares you will have lost nothing! The 2 for 1 money management strategy is a great way to protect your capital. This is a defensive way of trading. If you are nervous about a position or the market itself, then this method of money and trade management may come in handy! 186
187 4 PROFITABLE CHART PATTERNS For Swing Traders 187
188 4 PROFITABLE CHART PATTERNS Here are four profitable chart patterns that you can use the next time you are looking for entries. Ok, Hold on!! Wait! There is no holy grail.. These patterns can and will fail. You must manage your money correctly! 188
189 THE FOUR CHART PATTERNS 1. Shadow Low Vol High Vol (Squeeze) 3. Swing Shakeout 4. Squeeze Shakeout 189
190 1. SHADOW-30 If you are new to trading, then start with this pattern! It is easy to identify, easy to learn, and easy to trade. What more could you ask for? 190
191 HOW TO TRADE THE SHADOW-30 CHART PATTERN This pattern can be an "everyday" pattern, because of its reliability. It is easy to spot on a chart and simple to trade. 191
192 THE SETUP The name Shadow-30 refers to a shadow" that slices down through the "30" period exponential moving average. This looks like a hammer candlestick pattern on the chart but it doesn't have to be a perfect hammer to be considered a Shadow- 30. The color of the real body is not important. This shadow on the chart flushes other traders out of their position. Note: There is nothing special about the 30 period moving average. It is just a reference. Look to the left on the chart to determine support and resistance. 192
193 THE SETUP When you are trading any kind of long lower shadow or hammer pattern, always look for volume to be higher than the previous day. This suggests that many traders were shaken out and demand is picking up. This is important! *There a multiple ways to trade this setup depending on your desired risk/reward 193
194 194
195 THE ENTRY If you are able to trade during the day then buy on the day of the hammer (shadow) near the end of the day. You not need any kind of "confirmation" or anything else. You only need to see that price is at a support level and that demand is coming (volume). That is all the confirmation that you need. If you cannot trade during the day, then place your buy stop above the high of this hammer day. The next day you will have to check to see if you get filled and then place your stop loss order. You could also use a bracket order. 195
196 THE STOP LOSS ORDER There are two options for the placement of your stop loss order. Each has advantages and disadvantages. You decide what is right for you 196
197 THE STOP LOSS ORDER Option 1: Put your stop under the low of the hammer. The advantage to this is that your stop is far away from your entry price and you will not likely get stopped out prematurely. The disadvantage to this is that because your stop is so far away, you will have to buy fewer shares in order to comply with your money management rules. Option 2: Move down to the 60 minute chart and put your stop under a support area closer near the real body of the candle. The advantage to this is that you get to buy more shares because your stop is closer to your buy price. The disadvantage to this is that because your stop is so close, you may get stopped out more often, before a big move happens. 197
198 TAKING PROFITS When you are trading wide range days like hammers, you will find out that many times, the chart will trade sideways for a day or two. That is fine. You are already in the trade just waiting for other traders to enter. Also, the days that follow a hammer are typically low volatility, narrow range days like stars or doji. Be patient! Do not get anxious to move your stop up. Wait for price to actually move in your favor before you begin trailing your stop. Once price moves in your favor, then you safely begin to trail your stop using your favorite exit strategy to lock in profits. 198
199 TRADING TIPS Focus on those charts where the real body of the candle is close to the 30 EMA. You want as many traders as possible shaken out of this before you get in. This setup is reversed for short positions except now you are looking for charts with a Shooting Star pattern through a declining 30 EMA. Give more weight to setups with multiple shadows over several days. Give more weight to setups where price gaps away from the previous candle to end the day in hammer. Always look to the left on the chart to make sure price is at a significant support or resistance area. 199
200 WHEN GOOD CHART PATTERNS GO BAD Yes, you will have losing trades with this pattern. There is no pattern that will guarantee all winning trades! But with proper money, trade, and self management, you can do very well with this setup. 200
201 2. LOW VOL HIGH VOL (SQUEEZE) Some potentially explosive moves can result from trading this pattern. The best thing about this pattern is that you can usually get a low risk entry. 201
202 THE LOW VOL-HIGH VOL CHART PATTERN What happens when traders ignore an instrument? You get narrow range candles and low volume. When you see this developing on a chart, it will remind you of a squeeze. Get ready, it s about to explode. 202
203 THE SETUP The name Squeeze" refers to a low volatility setup. And what follows low volatility? High volatility! This repeats over and over again on every chart - in every time frame. With this chart pattern, you will see pullbacks into the SWEET SPOT that end in narrow range candles. These candles are also known as High Wave or Doji. Combine these price patterns with low volume and you have a winning trade in the making! 203
204 See how this pulls back into the SWEET SPOT, there are narrow range candles (Doji), and low volume? Now look at what happens at the next swing point high ($44.50). See the narrow range candles again? Volume drops off for a couple of days, momentum has slowed, and it pulls back again. This is where professional traders come in
205 205
206 HOW TO TRADE THIS PATTERN This can be tricky. When you have a potentially explosive situation, the price can be prone to whipsaws. Here is how to avoid them. 206
207 THE ENTRY With this pattern, you want to avoid just putting your buy stop above the previous high. You will get likely get filled prematurely! Method 1: Put your buy stop above the high of the highest narrow range candle. In the first example (long), there were several candles highlighted. Find the one with the highest high. Put your buy stop in above that. This is reversed for short positions. 207
208 208
209 THE ENTRY Method 2: Wait for another pattern to develop before you enter. Did you notice the Shadow-30(s)?. Method 3: Move down a time frame to the 60 minute chart and wait for it to breakout. Many times the 60 minute chart will give you an early warning sign that the chart is about to break (in one direction or another). The most difficult part of this pattern is the entry. Many times the price will move up and then sell off. Or, it will move down, and then rally. This can cause whipsaws. The advantage to this pattern is that your stop can be very close to your buy price, so your risk is small. If you get stopped out, consider another entry. The move that follows is usually worth it! 209
210 TAKING PROFITS There isn't anything special here. Just trail your stops using your favorite exit strategy. However, when the market offers you a gift, take it! If the chart explodes, and goes up 15% in a couple of days, at least take partial profits and trail your stops on the rest. 210
211 TRADING TIPS Low volatility leads to high volatility. High volatility leads to low volatility. Narrow range candles mean that momentum is slowing. The buyers or sellers are losing strength. Always look to the left on the chart to make sure that price is at a significant support or resistance area. 211
212 TRADING TIPS It's amazing what happens on a chart Right when everyone loses interest, it takes off. Go figure! Think of the Low Vol-High Vol pattern this way: When you see a pullback into the SWEET SPOT and narrow range candles develop, the price action that preceded it, is coming to an end A reversal is coming! 212
213 3. SWING SHAKEOUT What happens when swing traders and momentum traders get trapped in a chart and have to take a loss? The price rallies! You will see this chart pattern ALL the time. Learn it. It is one of the most reliable patterns I know of. You'll see why in a second. 213
214 THE SETUP Like the name implies, this chart pattern "traps" swing traders (and momentum traders) right in the middle of a move. This is a cyclical wave pattern - just on a smaller scale. 214
215 The circled area is what we are interested in. It is very easy to identify this pattern. You'll recognize it in a second! 215
216 This rallies hard to $ It then pulls back real nicely into the SWEET SPOT. This would have been a nice pullback to trade. But look at what happens next. It rallies up a little bit, but then it fails and goes right back down. This traps the swing traders who are long this. They put their stop loss orders under the first rally attempt. But, when it fell, it took out their stop loss orders
217 Now that the majority of sellers are out of the trade, it can rally. And that's exactly what it did
218 HOW TO TRADE THIS PATTERN The key with this chart pattern is to look for the "shakeout". The final swing MUST go below the low of the first swing. Many times, this final swing will end in a hammer. This hammer will take out all of the stop loss orders and you are ready to go! 218
219 THE ENTRY Wait for a candlestick pattern to develop on the final swing (in this case, it was a hammer). Then you can buy on the day of the pattern, or wait, put in a buy stop above the high of the candlestick pattern. It's up to you how you want to enter. 219
220 THE STOP LOSS ORDER Nothing special here. Just put your stop where it makes the most sense. Usually this will be under the low of the day of entry, but look to the left on the chart to identify support and resistance levels. 220
221 TAKING PROFITS The Exit Strategy section provides several options for trailing your stops. 221
222 TRADING TIPS The secret to this pattern is for the final swing to go below the low of the first swing. This is crucial. You will find this exact pattern on the short side also. The pattern is just reversed. This pattern is not limited to the daily chart. You will see it in all time frames. You re going to love trading this chart pattern. It represents a short term extreme in the market that gets a lot of potential sellers out before you get in! 222
223 4. SQUEEZE SHAKEOUT This chart pattern occurs when price trades side ways, breaks down, and then reverses. This chart pattern is a good example of why the majority of traders lose money. They get caught (shaken out) on the wrong side of a move. This results in some potentially explosive moves in price. 223
224 THE SETUP We have talked about the Swing Shakeout pattern. This pattern is similar in that it catches traders on the wrong side of a move. 224
225 First, look at the highlighted area in the following chart: What are your thoughts about this? 225
226 You, like most traders, are probably thinking that this is trading sideways (consolidating) but since it is in an uptrend, it may breakout soon. And you would be right in thinking this. There are some traders that are buying this inside of the consolidation in anticipation of a breakout. But really, there is nothing to do with this except wait for a breakout
227 Remember that there are thousands of traders looking at this chart. And they are thinking the same thing that you are. Now look at what happens on the next day 227
228 Now, what are your thoughts about this? Price broke down through the consolidation. And, it closed with a very bearish candle that closed near the bottom of the intra day range. There are some traders that got stopped out (they put their stop under the lows of the consolidation) and there are some traders that have aggressively shorted this
229 So no matter how you look at it - at this point this looks bearish. Plain and simple. Now, look at what happens on the following day 229
230 Whoa! What just happened? There was no follow through to the down side. This means that there are no sellers left to move this lower. So, with all sellers flushed out, this can now move higher
231 Also keep in mind that those traders that shorted this on the day of the breakdown probably put their stop loss orders above the consolidation. When price moved above that area, their stop loss orders were taken out - causing the gap up. Consolidation Breakdown Reversal 231
232 HOW TO TRADE THE SQUEEZE SHAKEOUT PATTERN There are three components to trading this chart pattern: consolidation breakdown reversal You need a sideways consolidation, then a breakdown causing the chart to look bearish, and finally a reversal pattern. This is why this pattern is called a "squeeze shakeout. Price trades squeezes sideways and then shakes out traders who shorted the breakdown. 232
233 Here is another example Consolidation Breakdown Reversal 233
234 An example where the consolidation doesn't last very long. Consolidation Breakdown Reversal 234
235 Another example Consolidation Breakdown Reversal 235
236 THE ENTRY You want to establish a position with this on the day of the reversal candle. But, you do not want to trade just any reversal candle. You want the candle to be strong one. Make sure it closes at least halfway into the range of the breakdown candle. This will show up as a Piercing Candle or a Bullish Engulfing candlestick pattern. 236
237 TAKING PROFITS Nothing special here. Just trail your stops using your favorite exit strategy. However, when the market offers you a gift - take it! If the price explodes, and goes up 15% in a couple of days, at least take partial profits and trail your stops on the rest. Keep in mind that you are wanting to see this move above that sideways trading pattern (consolidation). That is where the explosiveness will kick in. 237
238 TRADING TIPS The longer the consolidation the more potential for an explosive move. The reversal candle must be a powerful one. Volume is not important but you may see high volume on the breakdown candle. If the overall market (S&P 500) has a big down day, the odds of this pattern showing up increases. 238
239 TRADING TIPS There are two things that you should love about this chart pattern. First, you are establishing a position after a wave of selling has occurred. And second, you are trading opposite the crowd. These are the two components of successful swing trading. 239
240 FINDING SWING TRADING PATTERNS NCS 240
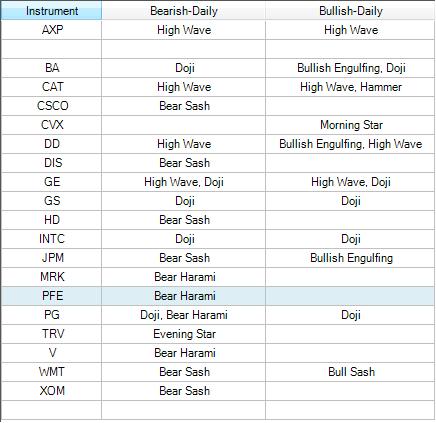
241 SCANNING FOR PATTERNS Nison Candle Scanner (NCS) Scan for major patterns on desired time frame Coincide candle pattern with chart pattern for potential Swing Trade entry Scan Example: - Dow 30 components for major patterns - Daily charts 241
242 com 242
243 243
244 244
245 245
246 246
247 SWING TRADING ADVICE 247
248 INVEST IN YOUR EDUCATION To be successful, you'll need to study up on the various techniques and strategies involved in swing trading. Money management skills are essential, as is the ability to budget business expenses appropriately and understand relevant tax consequences. Additionally, it's important to realize that your education will be ongoing, so you'll need to stay curious, vigilant, and up-to-date. 248
249 ACCEPT YOUR LOSSES AND MOVE ON If you've ever learned to ice skate, you know that one of the first lessons is accepting that falling is part of the game. Too great a fear of falling could prevent you from ever skating well. Similarly, if you want to be successful with your investments, you need to view swing trading as a business and accept that losses will happen. Don't be afraid to take a few hits. Stay calm and control any emotion-based urges you have in favor of rational, reasonable decisions. 249
250 USE PAPER TRADING Paper trading refers to a practice method in which aspiring investors only pretend that they're making real investments. They track their proposed trades on paper, noting all their losses and wins, and then analyze their success after a set period of time. Paper trading is a great way to practice your skills, and until you're confident in your abilities and have a proven track record of profits, paper trading is recommended. It will help you hone your technique while protecting your trading capital. 250
251 BE PATIENT Success will take time. If you expect immediate wins, you will be disappointed; the market simply doesn't work that way. Most importantly, don't hinge your financial well -being on your new found interest in swing trading, even if your goal is to become a full-time swing trader. Patience is key. 251
252 FIND WHAT WORKS FOR YOU The Internet is teeming with swing trading strategies, tips, and techniques. To be successful, you need to find the strategy that works for you, which is why education is so crucial. Explore the possibilities, but remember that sometimes the best strategy is to KISS (keep it super simple)! 252

253 253

254 ANY QUESTIONS? 254

255 255

256 NCS Special: mycc Member site Special: Recording: IMPORTANT You must log into your account to access the recording Registration for Markets of your Choice bonus session: Notification by 256

257 257
 1 www.candlecharts.com 2 BONUS www. candlecharts.com/special/swing-trading-2/ 3 www. candlecharts.com/special/swing-trading-2/ 4 www. candlecharts.com/special/swing-trading-2/ 5 www. candlecharts.com/special/swing-trading-2/
BONUS. www. candlecharts.com/special/swing-trading-2/
 BONUS www. candlecharts.com/special/swing-trading-2/ 1 www. candlecharts.com/special/swing-trading-2/ www. candlecharts.com/special/swing-trading-2/ www. candlecharts.com/special/swing-trading-2/ 2 www.
How To Read Charts Like A Pro Your guide to reading stock charts!
 How To Read Charts Like A Pro Your guide to reading stock charts! Courtesy of Swing-Trade-Stocks.com You may distribute this book FREELY or use it as part of a commercial package as long as this page and
3 Price Action Signals to Compliment ANY Approach to ANY Market
 3 Price Action Signals to Compliment ANY Approach to ANY Market Introduction: It is important to start this report by being clear that these signals and tactics for using Price Action are meant to compliment
1. Introduction 2. Chart Basics 3. Trend Lines 4. Indicators 5. Putting It All Together
 Technical Analysis: A Beginners Guide 1. Introduction 2. Chart Basics 3. Trend Lines 4. Indicators 5. Putting It All Together Disclaimer: Neither these presentations, nor anything on Twitter, Cryptoscores.org,
INTERMEDIATE EDUCATION GUIDE
 INTERMEDIATE EDUCATION GUIDE CONTENTS Key Chart Patterns That Every Trader Needs To Know Continution Patterns Reversal Patterns Statistical Indicators Support And Resistance Fibonacci Retracement Moving
Divergence and Momentum Trading
 presented by Thomas Wood MicroQuant SM Divergence Trading Workshop Day One Divergence and Momentum Trading Risk Disclaimer Trading or investing carries a high level of risk, and is not suitable for all
presented by Thomas Wood MicroQuant SM Divergence Trading Workshop Day One Naked Trading Part 2
 presented by Thomas Wood MicroQuant SM Divergence Trading Workshop Day One Naked Trading Part 2 Risk Disclaimer Trading or investing carries a high level of risk, and is not suitable for all persons. Before
How I Trade Profitably Every Single Month without Fail
 How I Trade Profitably Every Single Month without Fail First of all, let me take some time to introduce myself to you. I am Koon Hwee (KH Lee) and I am a full time currency trader. I have a passion for
With that, let s dive into the steps. Step 1 Identify range bound markets on Daily or 4 Hour Charts
 If you have been trading for any length of time, you have probably noticed that the markets are moving sideways A LOT. Consolidation is a huge part of the market s balance and so it makes sense to learn
Compiled by Timon Rossolimos
 Compiled by Timon Rossolimos - 2 - The Seven Best Forex Indicators -All yours! Dear new Forex trader, Everything we do in life, we do for a reason. Why have you taken time out of your day to read this
Trading the Hidden Divergence. Presented by Sunil Mangwani
 Trading the Hidden Divergence Indicators in technical analysis. Indicators along with chart patterns, trend lines, resistance / support levels etc., are an essential part of technical analysis. But there
Binary Options Trading Strategies How to Become a Successful Trader?
 Binary Options Trading Strategies or How to Become a Successful Trader? Brought to You by: 1. Successful Binary Options Trading Strategy Successful binary options traders approach the market with three
THE TREND RIDING STRATEGY
 THE TREND RIDING STRATEGY IMPORTANT : As an added bonus for downloading this report, you also received additional free training videos. To access your bonuses, go to: http://www.sublimeforexchampions.com/
Icoachtrader Consulting Service WELCOME TO. Trading Boot Camp. Day 5
 Icoachtrader Consulting Service www.icoachtrader.weebly.com WELCOME TO Trading Boot Camp Day 5 David Ha Ngo Trading Coach Phone: 1.650.899.1088 Email: icoachtrader@gmail.com The information presented is
Introduction to the Gann Analysis Techniques
 Introduction to the Gann Analysis Techniques A Member of the Investment Data Services group of companies Bank House Chambers 44 Stockport Road Romiley Stockport SK6 3AG Telephone: 0161 285 4488 Fax: 0161
2.0. Learning to Profit from Futures Trading with an Unfair Advantage! Income Generating Strategies Essential Trading Tips & Market Insights
 2.0 Learning to Profit from Futures Trading with an Unfair Advantage! Income Generating Strategies Essential Trading Tips & Market Insights Income Generating Strategies Essential Trading Tips & Market
I Always Come Back To This One Method
 I Always Come Back To This One Method I can attribute my largest and most consistent gains to this very method of trading, It always work and never fails although I ve been known to still screw it up once
OSCILLATORS. TradeSmart Education Center
 OSCILLATORS TradeSmart Education Center TABLE OF CONTENTS Oscillators Bollinger Bands... Commodity Channel Index.. Fast Stochastic... KST (Short term, Intermediate term, Long term) MACD... Momentum Relative
Chapter 2.3. Technical Indicators
 1 Chapter 2.3 Technical Indicators 0 TECHNICAL ANALYSIS: TECHNICAL INDICATORS Charts always have a story to tell. However, sometimes those charts may be speaking a language you do not understand and you
Advanced Trading Systems Collection MACD DIVERGENCE FOREX TRADING SYSTEM
 MACD DIVERGENCE FOREX TRADING SYSTEM 1 This system will cover the MACD divergence. With this forex trading system you can trade any currency pair (I suggest EUR/USD and GBD/USD when you start), and you
4.25 ¾ 4.19 FG March 2018 Wheat ¾ Pivotal new Contract Low 4.02 ½ 5 day chart. Down from last week same day Daily chart... Down Weekly
 s 9:50 pm Chicago time 12/11/17 December 12, 2017 March 2018 Corn 3.56 3.52 ¾ FG --------------3.48 ¼ Pivotal new Contract Low 3.43 ¾ 5 day chart. Down from last week same day Daily chart. Down Weekly
Chapter 2.3. Technical Analysis: Technical Indicators
 Chapter 2.3 Technical Analysis: Technical Indicators 0 TECHNICAL ANALYSIS: TECHNICAL INDICATORS Charts always have a story to tell. However, from time to time those charts may be speaking a language you
MagicBreakout Forex Trading Strategy
 Tim Trush & Julie Lavrin introduce MagicBreakout Forex Trading Strategy Your guide to financial freedom. Tim Trush, Julie Lavrin, T&J Profit Club, 2007, All rights reserved www.magicbreakout.com Table
When traders make trading decisions based on repeated price patterns that once formed,
 Trading Strategy / Gert.Nurme@iBrokers.ee Price Action Trading Strategy Introduction WHAT IS PRICE ACTION TRADING? When traders make trading decisions based on repeated price patterns that once formed,
50 Pips A Day Forex Strategy. How To Build A Solid Trading System. By Laurentiu Damir. Copyright 2012 by Laurentiu Damir
 50 Pips A Day Forex Strategy How To Build A Solid Trading System By Laurentiu Damir Copyright 2012 by Laurentiu Damir All rights reserved. No part of this book may be reproduced or transmitted in any form
Technical Analysis Basics. Identifying Tops
 Technical Analysis Basics. Identifying Tops June 2011 1 Sign Up Now to Upshots forex trade signals disclaimer The information provided in this report is for educational purposes only. It is not a recommendation
Resistance to support
 1 2 2.3.3.1 Resistance to support In this example price is clearly consolidated and we can expect a breakout at some time in the future. This breakout could be short or it could be long. 3 2.3.3.1 Resistance
Scalp Trading Strategies
 Scalp Trading Strategies Services Disclaimer (for full disclosure, see Disclaimers section of website) Information Contained within our website and affiliates is not a substitute for professional advice
Core CFD trading skills
 chapter 7 Core CFD trading skills In this chapter we examine the core skills that you need to develop to trade successfully. Mastering these core competencies is essential to mastering CFD trading. It
Before we get to all the details, we are going to look at a couple of trades in the first
 CHAPTER 1 Let s Get Started Before we get to all the details, we are going to look at a couple of trades in the first two chapters. From them you will get a good idea where we are heading, and how we are
Page 1 of 96 Order your Copy Now Understanding Chart Patterns
 Page 1 of 96 Page 2 of 96 Preface... 5 Who should Read this book... 6 Acknowledgement... 7 Chapter 1. Introduction... 8 Chapter 2. Understanding Charts Convention used in the book. 11 Chapter 3. Moving
Top 10 BEST Forex Trading Strategies PDF Report Ebook Author
 Top 10 BEST Forex Trading Strategies PDF Report Ebook Author Top 10 Best Forex Trading Strategies PDF Report If you re in the pursuit of nding the Best Forex trading Strategy and the keys to choosing a
10-Year Treasury Notes ($UST Price)
") 1 Weekly Inter-market Technical Report 10-Year Treasury Notes ($UST Price) Monthly Continuing from last week's report, bonds (notes) appear to be on a strong buy signal on the monthly chart, as price is
1 Weekly Inter-market Technical Report 10-Year Treasury Notes ($UST Price) Monthly Continuing from last week's report, bonds (notes) appear to be on a strong buy signal on the monthly chart, as price is
Market Mastery Protégé Program Method 1 Part 1
 Method 1 Part 1 Slide 2: Welcome back to the Market Mastery Protégé Program. This is Method 1. Slide 3: Method 1: understand how to trade Method 1 including identifying set up conditions, when to enter
Naked Trading - Double Top Chart Pattern Strategy
 Naked Trading - Double Top Chart Pattern Strategy If you really want to learn a profitable way to trade then look no further, the Double Top chart pattern strategy uses simple and sound trading principles
Technicals & Time Frame
 Advanced Charting Neither Better Trades or any of its personnel are registered broker-dealers or investment advisers. I will mention that I consider certain securities or positions to be good candidates
The Strategies Working Best in Today s E-Mini Market
 The Strategies Working Best in Today s E-Mini Market Todd Mitchell Craig Hill Legal Disclaimer No claim is made by Trading Concepts, Inc. that the trading strategies shown here will result in profits and
Penny Stock Guide. Copyright 2017 StocksUnder1.org, All Rights Reserved.
 Penny Stock Guide Disclaimer The information provided is not to be considered as a recommendation to buy certain stocks and is provided solely as an information resource to help traders make their own
Multi Indicator Usage Concepts 4/1/2012 Brooky-Indicators.com Brooky
 Multi Indicator Usage Concepts www.brooky-indicator.com 4/1/2012 Brooky-Indicators.com Brooky U.S. Government Required Disclaimer Commodity Futures Trading Commission Futures, Currency and Options trading
Convergence and Divergence
 Convergence and Divergence Momentum: The Verge of Success Momentum plays a key role in trend analysis. Trends are composed of a series of price swings. It is a trader s edge to know when a trend is slowing
What Came First... Fundamentals or the Technicals? By Jared Martinez
 What Came First... Fundamentals or the Technicals? By Jared Martinez I am honored to share my thoughts on our methodologies, focusing on the current technical movements and conditions of the FOREX Markets,
Trading Guidelines. Why guidelines and not rules? Because there are no rules.
 Trading Guidelines Why guidelines and not rules? Because there are no rules. 1. Everything that you see is in a gray fog. Nothing is perfectly clear. Close is close enough. If something looks like a reliable
Tommy s Revenge 2.0 Module 2 Part 2
 1 Mark Deaton here with your follow-up to Module 2. Going to cover a few things in this video and try to keep it short and sweet. We re going to look at Stock Fetcher and how we can use Stock Fetcher to
S&P 500 Update: Week ending May 11th 2018
 S&P 500 Update: Week ending May 11th 2018 1. Market Recap: The S&P 500 closed higher by 2.2% for week and broke out of some key resistance areas and a short term downtrend. There are 4 topics now setting
The Schaff Trend Cycle
 The Schaff Trend Cycle by Brian Twomey This indicator can be used with great reliability to catch moves in the currency markets. Doug Schaff, president and founder of FX Strategy, created the Schaff trend
Becoming a Consistent Trader
 presented by Thomas Wood MicroQuant SM Divergence Trading Workshop Day One Becoming a Consistent Trader Risk Disclaimer Trading or investing carries a high level of risk, and is not suitable for all persons.
 Disclaimer The candlestick patterns explained in this book are intended to provide information only.. Use these patterns is at your discretion. The use and application of the included patterns can involve
The goal for Part One is to develop a common language that you and I
 PART ONE Basic Training The goal for Part One is to develop a common language that you and I can use. The rest of the book will discuss how the technical indicators highlighted in the first two chapters
FOREX TRADING STRATEGIES.
 FOREX TRADING STRATEGIES www.ifcmarkets.com www.ifcmarkets.com 2 One of the most powerful means of winning a trade is the portfolio of Forex trading strategies applied by traders in different situations.
Stock Market Basics Series
 Stock Market Basics Series HOW DO I TRADE STOCKS.COM Copyright 2012 Stock Market Basics Series THE STOCHASTIC OSCILLATOR A Little Background The Stochastic Oscillator was developed by the late George Lane
The Trifecta Guide to Technical Analysis 1
 The Trifecta Guide to Technical Analysis 1 No trading system is bullet-proof. The list of factors that can impact a stock s share price is long and growing from investor sentiment to economic growth to
PROFITING WITH FOREX: BONUS REPORT
 PROFITING WITH FOREX: BONUS REPORT PROFITING WITH FOREX: The Most Effective Tools and Techniques for Trading Currencies BIG PROFITS COME FROM LETTING YOUR WINNERS RUN S. Wade Hansen Two axioms pervade
Swing Trading Strategies that Work
 Swing Trading Strategies that Work Jesse Livermore, one of the greatest traders who ever lived once said that the big money is made in the big swings of the market. In this regard, Livermore successfully
Petri Redelinghuys
 Petri Redelinghuys // @TraderPetri Becoming a better trader The first step is persistence You re still at it, well done! Learning must be the focus 90% of traders lose all their money and fail 10% of traders
BUY SELL PRO. Improve Profitability & Reduce Risk with BUY SELL Pro. Ultimate BUY SELL Indicator for All Time Frames
 BUY SELL PRO Improve Profitability & Reduce Risk with BUY SELL Pro Ultimate BUY SELL Indicator for All Time Frames Risk Disclosure DISCLAIMER: Crypto, futures, stocks and options trading involves substantial
Tips for Traders 6/1/ :13:00 AM How to Catch a Trade in a Vertically-Trending Market
 Tips for Traders 6/1/2009 10:13:00 AM How to Catch a Trade in a Vertically-Trending Market One of the most exhilarating rides we can take as traders is when a profitable position we have on goes vertical.
Introduction. 1.A solid trading plan, 2.The discipline to follow it, and 3.The ability to stop trading altogether if
 Day Trading Strategies Introduction Day Trading Strategies Vol. II will show you some of the basic techniques that Professional Traders use every day to make money. As with any discipline, the more experience
Test Your Chapter 1 Knowledge
 Self-Test Answers Test Your Chapter 1 Knowledge 1. Which is the preferred chart type in LOCKIT? The preferred chart type in LOCKIT is the candle chart because candle patterns are part of the decision-making
How Much Profits You Should Expect from Trading Forex
 How Much Profits You Should Expect from Trading Roman Sadowski Trading forex is full of misconceptions indeed. Many novice s come into trading forex through very smart marketing techniques. These techniques
Relative Strength Index (RSI) by Ty Young
 by Ty Young") Relative Strength Index (RSI) by www.surefire-trading.com Ty Young Hi, this is Ty Young with Surefire-trading.com and today I will be discussing the Relative Strength Index (RSI). History J. Welles Wilder,
Relative Strength Index (RSI) by www.surefire-trading.com Ty Young Hi, this is Ty Young with Surefire-trading.com and today I will be discussing the Relative Strength Index (RSI). History J. Welles Wilder,
INSIDE DAYS. The One Trading Secret That Could Make You Rich
 The One Trading Secret That Could Make You Rich INSIDE DAYS What 'Inside Days' Are, How To Identify Them, The Setup, How They Work, Entrance Criteria, Management and Exit Criteria for MAXIMUM PROFITS IMPORTANT
THE CYCLE TRADING PATTERN MANUAL
 TIMING IS EVERYTHING And the use of time cycles can greatly improve the accuracy and success of your trading and/or system. THE CYCLE TRADING PATTERN MANUAL By Walter Bressert There is no magic oscillator
Coaching Session FIVE
 Coaching Session FIVE Coaching Session FIVE Counter-Trend Trade Set-Ups Program Summary Trading Plan Execution The Master Trader Powerful Price Pattern Trades Trade Management Initial Trend Entry Trading
An Introduction to Long and Short Entry Gap Trading. Leroy Rushing
 An Introduction to Long and Short Entry Gap Trading Leroy Rushing Key Points: The stock market is volatile; be prepared to lose trades As a beginning day trader, start with very low risk tolerance and
The Master Trader Counter-Trend Trade Set-Ups
 The Master Trader Counter-Trend Trade Set-Ups Trading Concepts, Inc. The Master Trader Counter-Trend Trade Set-Ups By Todd Mitchell Copyright 2014 by Trading Concepts, Inc. All Rights Reserved This training
Buy rules: Sell rules: Strategy #2. Martingale hedging with exponential lot increase... 6
 Contents Introduction... 2 Data... 2 Short instructions on how to use Forex Tester.... 2 Sum up... 3 STRATEGIES... 3 Martingale strategies... 3 Strategy #1. Martingale Grid & Hedging... 4 Buy rules:...
EZ Trade FOREX Day Trading System. by Beau Diamond
 EZ Trade FOREX Day Trading System by Beau Diamond The EZ Trade FOREX Day Trading System is mainly used with four different currency pairs; the EUR/USD, USD/CHF, GBP/USD and AUD/USD, but some trades are
Williams Percent Range
 Williams Percent Range (Williams %R or %R) By Marcille Grapa www.surefiretradingchallenge.com RISK DISCLOSURE STATEMENT / DISCLAIMER AGREEMENT Trading any financial market involves risk. This report and
The Technical Edge Page 1. The Technical Edge. Part 1. Indicator types: price, volume, and moving averages and momentum
 The Technical Edge Page 1 The Technical Edge INDICATORS Technical analysis relies on the study of a range of indicators. These come in many specific types, based on calculations or price patterns. For
Attributes that will make me a better trader.
 Attributes that will make me a better trader. To always be prepared and be patient and thoughtful in review. Ability to operate in all conditions according to a plan. Acknowledge my emotions and not let
Top Down Analysis Success Demands Singleness of Purpose
 Chapter 9 Top Down Analysis Success Demands Singleness of Purpose Armed with a little knowledge about the stock and options market as well as a desire to trade, many new traders are faced with the daunting
Presents. SPY the MARKET. With. Bill Corcoran
 Presents SPY the MARKET With Bill Corcoran I am not a registered broker-dealer or investment adviser. I will mention that I consider certain securities or positions to be good candidates for the types
Table of Contents. Risk Disclosure. Things we will be going over. 2 Most Common Chart Layouts Anatomy of a candlestick.
 Table of Contents Risk Disclosure Things we will be going over 2 Most Common Chart Layouts Anatomy of a candlestick Candlestick chart Anatomy of a BAR PLOT Indicators Trend-Lines Volume MACD RSI The Stochastic
Explanation of the 5 / 15-Minute Trading Rules
 5 / 15-Minute Trading Rules 1 Explanation of the 5 / 15-Minute Trading Rules Trading during the first ½ hour of the day can be very tricky and if one were able to gather all of the statistics for retail
Understanding Oscillators & Indicators March 4, Clarify, Simplify & Multiply
 Understanding Oscillators & Indicators March 4, 2015 Clarify, Simplify & Multiply Disclaimer U.S. Government Required Disclaimer Commodity Futures Trading Commission Futures and Options trading has large
Introduction. Technicians (also known as quantitative analysts or chartists) usually look at price, volume and psychological indicators over time.
 usually look at price, volume and psychological indicators over time.") Technical Analysis Introduction Technical Analysis is the study of market action, primarily through the use of charts, for the purpose of forecasting future price trends. Technicians (also known as quantitative
Technical Analysis Introduction Technical Analysis is the study of market action, primarily through the use of charts, for the purpose of forecasting future price trends. Technicians (also known as quantitative
Technical Analysis. Used alone won't make you rich. Here is why
 Technical Analysis. Used alone won't make you rich. Here is why Roman sadowski The lesson to take away from this part is: Don t rely too much on your technical indicators Keep it simple and move beyond
Forex Range Trading With Price Action Forex Trading System By Laurentiu Damir
 Forex Range Trading With Price Action Forex Trading System By Laurentiu Damir Copyright 2012 by Laurentiu Damir All rights reserved. No part of this book may be reproduced or transmitted in any form or
The Benefits of a Rule Based Trading System
 The Benefits of a Rule Based Trading System Contents Introduction Understanding The Truth The Ugly Truth About The System Sellers Plan Your Trades, Then Trade your Plan Finally 3 4 6 7 9 2 1 Introduction
Tradeciety s Price Action Guide
 Tradeciety s Price Action Guide Welcome... 3 Who am I?... 3 Some impressions from my trading & traveling lifestyle... 4 What Is Price Action?... 6 Candlesticks vs. Chart patterns... 7 Top 3 Candlestick
Forex Trading Strategy 10 pips by Rob Booker
 Forex Trading Strategy 10 pips by Rob Booker Contributed by Rob Booker Sun, 09 Dec 2007 04:58:53 MST Currency trading can be like running away from the bear. Trading forex offers more opportunity for fast
Technical Analysis. Used alone won't make you rich. Here is why
 Technical Analysis. Used alone won't make you rich. Here is why Roman Sadowski The lesson to take away from this part is: Don t rely too much on your technical indicators Keep it simple and move beyond
4 Keys to Trend Trading Tech Analysis. There is no Holy Grail of Trading Only Tools & Rules
 4 Keys to Trend Trading Tech Analysis There is no Holy Grail of Trading Only Tools & Rules Disclaimer U.S. GOVERNMENT REQUIRED DISCLAIMER COMMODITY FUTURES TRADING COMMISSION FUTURES AND OPTIONS TRADING
EJ_4H Method Part III
 EJ_4H Method Part III Trailing price: Protecting your hard-earned money against reversals or even flurries is one of the most important parts of money management. Most of platforms have such feature that
The Stackable Carry Trade
 The Stackable Carry Trade Introduction: The Carry Trade is a relatively popular strategy among Forex traders. The concept is to pair high yielding interest currencies against low interest currencies in
FOREX INDICATORS. THEIR PRIORITY and USE
 FOREX INDICATORS THEIR PRIORITY and USE by G. C. Smith U.S. Government Required Disclaimer Trading foreign exchange markets on margin carries a high level of risk, and may not be suitable for all investors.
Introduction 3. Charts: line, bar and candle 4. Critical price levels 6
 Contents page Introduction 3 Charts: line, bar and candle 4 Critical price levels 6 Resistance, support and pivot points 6 Definitions 6 Reasoning 7 Pivot points 8 Fibonacci retracements 9 Relative Strength
Forexsignal30 Extreme ver. 2 Tutorials
 Forexsignal30 Extreme ver. 2 Tutorials Forexsignal30.com is a manual trading system that is composed of several indicators that mutually cooperate with each other. Very difficult to find indicators that
Stay on the Right Side & Finishing the Year Strong! From the Active Trend Trader
 Stay on the Right Side & Finishing the Year Strong! From the Active Trend Trader Disclaimer U.S. GOVERNMENT REQUIRED DISCLAIMER COMMODITY FUTURES TRADING COMMISSION FUTURES AND OPTIONS TRADING HAS LARGE
Using Acceleration Bands, CCI & Williams %R
 Price Headley s Simple Trading System for Stock, ETF & Option Traders Using Acceleration Bands, CCI & Williams %R How Technical Indicators Can Help You Find the Big Trends For any type of trader, correctly
Forex Illusions - 6 Illusions You Need to See Through to Win
 Forex Illusions - 6 Illusions You Need to See Through to Win See the Reality & Forex Trading Success can Be Yours! The myth of Forex trading is one which the public believes and they lose and its a whopping
Free signal generator for traders
 Free signal generator for traders Trader s Bulletin Pivot Point Trading Strategy 1. Just download the FREE tool 2. Key in a few numbers 3. And follow the simple techniques by Mark Rose To make money from
BY JIM PRINCE
 No part of this publication may be reproduced, stored in a retrieval system, or transmitted in any form or by any means electronic, mechanical, photocopying, recording, or otherwise without the prior permission
No duplication of transmission of the material included within except with express written permission from the author.
 Copyright Option Genius LLC. All Rights Reserved No duplication of transmission of the material included within except with express written permission from the author. Be advised that all information is
Forex Trader Job Description
 Main Objective; Forex Trader Job Description The primary goal of being a successful Forex Trader is to achieve positive cash flow in to the Companies accounts. This in itself sounds like a over simplified