THE RELATIVE STRENGTH CONCEPT APPLIED TO SECTOR INDICES
|
|
|
- Sharon Elinor Carroll
- 6 years ago
- Views:
Transcription
1 THE RELATIVE STRENGTH CONCEPT APPLIED TO SECTOR INDICES An Illustration with the DJ Stoxx 600 Index Yann CORDIER, CFTe, MFTA AXA Investment Managers London, 10/03/2015
2 OUTLINE The concept and power of Relative strength Comparing a sector vs. the market: An overlooked approach Relative charting of sectors: Advantages and limits How to use technical indicators on relative charts A relative analysis of DJ Stoxx sectors with top down portfolio construction 10/03/2015 Society of Technical Analysts 2
3 1. THE CONCEPT AND POWER OF RELATIVE STRENGTH 10/03/2015 Society of Technical Analysts 3
4 The Relative Strength concept A relative strength chart simply reflects the ratio between two securities in a homogenized unit (currency) It enlightens the strength of an asset vs. another asset / market, giving precious additional information vs. an absolute chart alone Technical analysis can and should add value to relative charts Examples of relative charts: Inter market analysis (corporate debt vs. equities risk premium concept) A sector vs. the overall stock market A stock vs. its sector / the overall market Two stocks (for pair trading purposes) 10/03/2015 Society of Technical Analysts 4
 Daily chart, 2008-2009 10/03/2015 Society of")
5 Relative charting: The famous example of DJ Transport vs. DJ Industrials (1) Daily chart, /03/2015 Society of Technical Analysts 5
 Weekly chart, RSI (14), 2010-2015 Weekly RSI of the ratio")

6 Relative charting: The famous example of DJ Transport vs. DJ Industrials (2) Weekly chart, RSI (14), Weekly RSI of the ratio crossed 50 from above watch out for possible bearish breakout of the trendline Could be a forerunner of impending weakness for the overall US stock market 10/03/2015 Society of Technical Analysts 6
 and Fibonacci retracements After years of outperformance, 2014 was poised to be a year of underperformance for small")
7 Small caps vs. Blue chips in Europe Weekly chart, RSI (14) and Fibonacci retracements After years of outperformance, 2014 was poised to be a year of underperformance for small caps vs. blue chips Resistance from the 138.2% level of previous bullish cycle RSI leaving its overbought area 10/03/2015 Society of Technical Analysts 7
8 Relative Strength: Buy the strongest of two assets Mostly, the best pick is the asset that performs most (Don t fight the trend!) Especially useful when comparing emerging currencies vs. $, or, or sectors vs. the equity market Example of US Healthcare and Consumer Staples vs. the S&P /03/2015 Society of Technical Analysts 8
 vs.")
 (1) Absolute")
 Quite the")

9 Relative Strength: US Pharma (left) vs. US Consumer Staples (right) (1) Absolute daily charts , ADX/DMI (14) Quite the same picture, isnt it? 10/03/2015 Society of Technical Analysts 9
 Relative daily chart 2013-2015 The relative chart clearly enlightens consistent outperformance from")
10 Relative Strength: US Pharma vs. US Consumer Staples (2) Relative daily chart The relative chart clearly enlightens consistent outperformance from Healthcare with no warning of reversal give preference to Pharmas! 10/03/2015 Society of Technical Analysts 10


11 Pair trading GSK vs. AstraZeneca Daily chart, Ichimoku, The technique traditionally used in L/S Equity portfolios Going long an equity / short another, preferably: When they re comparable When they tend to experience cycles of out/underperformance 10/03/2015 Society of Technical Analysts 11
12 2. COMPARING A SECTOR VERSUS THE MARKET: AN OVERLOOKED APPROACH 10/03/2015 Society of Technical Analysts 12
13 The interest of analysing a sector vs. the overall stock market Most equity portfolios are guided by hunt for alpha Bottom up approach (stockpicking) Overall portfolio construction is rarely an ex ante priority, hence the value of Top down approaches The stock market is a succession of cycles of frenzy or disinterest vis à vis sectors, countries and/or styles (value, growth, yield ) Relative strength approach is the least risky way to implement contrarian opinion principles 10/03/2015 Society of Technical Analysts 13
14 Top-down vs. Bottom-up approaches Description Method Top down Bottom up Portfolio allocation based on asset class, geography, industry sector Stock / bond selection based on a company s fundamentals Underlying philosophy Markets don t behave independently Intermarket analysis, Relative strength Focus on "micro" knowledge (earnings releases, meetings with managements) Portfolio construction Ex ante Ex post Relative strength analysis can make bottom up approach much more efficient by helping know when to put the cursor on the names you want to bet on 10/03/2015 Society of Technical Analysts 14
15 3. RELATIVE CHARTING OF SECTORS: ADVANTAGES AND LIMITS 10/03/2015 Society of Technical Analysts 15
16 Chartist analysis of Relative strength General principles Relative charts have nothing particular except they re pictured as line graphs (candlesticks are meaningless here) Thus, they evolve in trends, reversals and experience congestion phases Usual chart patterns are at least as significant as with absolute charts as breakouts are not "played" by traders Double Tops/Bottoms, Head & Shoulders following strong trends are particularly meaningful Trendline breakouts are serious i.e. less false signals 10/03/2015 Society of Technical Analysts 16


17 Chartist analysis of Relative strength Example of breakout with the US Energy index (1) Absolute daily chart, RSI (14), /03/2015 Society of Technical Analysts 17
 Relative daily chart vs.")

18 Chartist analysis of Relative strength Example of breakout with the US Energy index (2) Relative daily chart vs. the S&P 500 index, RSI (14), No big absolute gain in cutting exposure 20 days earlier (0.6%) BUT far more reactivity from portfolio managers using a relative approach 10/03/2015 Society of Technical Analysts 18


19 Chartist analysis of Relative strength Example of Ichimoku graph on US Banks (1) Absolute weekly chart, /03/2015 Society of Technical Analysts 19

20 Chartist analysis of Relative strength Example of Ichimoku graph on US Banks (2) Relative weekly chart vs. the S&P 500 index, It is hard to remain complacently bullish on US Banks if you look at their relative strength!! 10/03/2015 Society of Technical Analysts 20
21 Chartist analyst of Relative strength The importance of multi-timeframe approach As usual, it is important to make sure that a trade does not go in a way that is opposite to its primary trend As regards sector indices, cycles are generally rather long (i.e. several months) The most rewarding trades are made when LT, MT and ST display comparable patterns Ideal situation #1: When a ST/MT trend resumes after a pullback while the LT trend was not impacted Ideal situation #2: When a ST/MT trend starts to develop but the LT trend is not impacted yet (but with clues it could happen soon) 10/03/2015 Society of Technical Analysts 21
22 4. HOW TO USE TECHNICAL INDICATORS ON RELATIVE CHARTS 10/03/2015 Society of Technical Analysts 22
23 Technical indicators, the RS s best friends Cycles on sectors vs. market tend to be long (longer than on pair trading with frequent reversions to the mean) Trend indicators are well suited to take full benefit of this phenomenon (cf. Ichimoku charts) Importance of catching turning points and not simply following trends Divergences on momentum oscillators are particularly powerful Bollinger bands provide extremely reliable signals Oscillators very often make significant patterns by themselves 10/03/2015 Society of Technical Analysts 23

24 Divergence on Stochastics US Materials vs. the S&P 500 Daily chart, slow stochastics, MACD (12,26,9), June Dec The sell signal given by Stochastics coincided with a long divergence made by MACD2 vs. MACD 10/03/2015 Society of Technical Analysts 24
 Weekly")

25 Bollinger signals European Retail vs. the DJ Stoxx (SXXP) Weekly chart, Bollinger bands, /03/2015 Society of Technical Analysts 25

, 2004-2013 10/03/2015")
26 Head & Shoulders pattern on RSI Nokia vs. Euro Stoxx 50 Weekly chart, RSI (14), /03/2015 Society of Technical Analysts 26

27 Ideal situation #1 A MT trend resumes after a pullback without impact on the LT trend (1) European Utilities vs. SXXP, Weekly chart, RSI (14), /03/2015 Society of Technical Analysts 27
 European Utilities vs.")

28 Ideal situation #1 A MT trend resumes after a pullback without impact on the LT trend (2) European Utilities vs. SXXP, Daily chart, ADX/DMI (14), Trend following indicators showed the MT trend was not seriously jeopardized 10/03/2015 Society of Technical Analysts 28
, 2011-2013 10/03/2015 Society of")
29 Ideal situation #2 MT reversal with good probability to carry the LT picture along (1) Iberdrola vs. European utilities, Daily chart, Bollinger bands, slow stochastics and MACD (12,26,9), /03/2015 Society of Technical Analysts 29
 Iberdrola vs.")

30 Ideal situation #2 MT reversal with good probability to carry the LT picture along (2) Iberdrola vs. European utilities, Weekly chart with MACD (12,26,9), In this case, bullish divergences occured simultaneously on weekly and daily charts! 10/03/2015 Society of Technical Analysts 30
31 Is there an optimal combination of technical indicators on relative charts? RSI is generally more reliable on relative charts than on absolute ones, and is powerful on LT charts MACD brings enormous value added: Peak & trough divergences made by MACD2 Crossing the Signal 0 acting as a Support or Resistance Bollinger bands are perhaps more helpful for pair traders, but Bollinger signals made by sectors vs. the market are very powerful and reliable 10/03/2015 Society of Technical Analysts 31
32 5. A RELATIVE ANALYSIS OF DJ STOXX SECTORS AND PORTFOLIO CONSTRUCTION 10/03/2015 Society of Technical Analysts 32
33 Analysing the Stoxx index subsectors today 3 parameters should be taken into account: 1. Synchrony between different timeframes 2. Recent signals 3. Sector weightings in portfolios today Portfolio construction is then based on technical analysis with a contrarian bias 10/03/2015 Society of Technical Analysts 33


")

34 Food & Beverages Weekly Daily Bullish mood may be shifting soon (end of trend, big resistances) 10/03/2015 Society of Technical Analysts 34


35 Healthcare Weekly Daily Bearish MT outlook might trigger off reversal of the LT trend 10/03/2015 Society of Technical Analysts 35


36 Mining Weekly Daily Bullish inflexion is likely provided USD doesn t appreciate too much 10/03/2015 Society of Technical Analysts 36


37 Telcos Weekly Daily Bounce off meaningful support levels look for confirmation on the LT trend 10/03/2015 Society of Technical Analysts 37

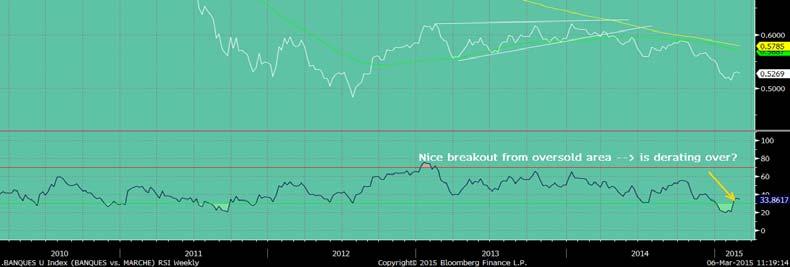


38 Banks Weekly Daily Clear outperformance expected 10/03/2015 Society of Technical Analysts 38


39 Insurance Weekly Daily LT bullish trend not impacted yet, but cautious on MT sell on probable ST strength 10/03/2015 Society of Technical Analysts 39
40 How are investors positioned on European sectors today? (1) As most equity fund managers are bottom up, they tend to stick to their highest convictions Inertia in their sector positioning is an interesting consequence of it (Portfolio shifts may take several months, cf. 3 year UW on Banks) Polls among the biggest managers give a key clue to risks to the up or downside for sectors (extreme complacency or mistrust) Recent examples: Media ("overcomplacency" end 2013 with 450 Bp OW overall; strong, repeated bearish divergences from RSI) Utilities Healthcare Telcos 10/03/2015 Society of Technical Analysts 40
41 How are investors positioned on European sectors today? (2) 10/03/2015 Society of Technical Analysts 41
42 How would we be positioned in terms of sectors today? Summary table Automotive Banks Basic Materials Capital Goods Energy * Food & Beverages Healthcare Insurance Media Retail Telcos * Utilities Weekly chart + (a correction wouldn't jeopardize uptrend) + (RSI left oversold area, wonderful Bollinger signal) + (inverted H&S pattern, bullish RSI divergence) (inflexion but resistance from Cloud and SMAs) + (inverted H&S, RSI using 30 as a support level) = (trend has been fading) (RSI crossed 50 from above) = (but could rapidly worsen) (caution: risk of Rising Wedge, high bandwidth) ++ (broke to the upside from a bullish flag) + = (bouce off trendline and middle band) (broke key support) Daily chart + (Buy on weakness) ++ (broke resistance, bullish consolidation) + (++ if Cloud is broken to the upside) + (as far as the support line holds) = (contradictory signals) = unless Cloud is broken to the upside (but thick!) (support line broken, then tested as a resistance) = (broke support, sell on probable ST strength) = (near a key resistance) + (bullish ascending triangle) ++ (bullish Bollinger signal) (too early to go back) NB: Rating scale goes from to +++ Underlined sector means that recommendations on both time horizons coincide An asterisk signals a change of recommendation 10/03/2015 Society of Technical Analysts 42
43 Portfolio construction A mix of relative analysis and contrarian opinion Strongly positive on Banks: Still underweighted in portfolios and at historical average 500 Bp OW Positive on Telcos, but not the strongest Overweight as the sector is at the high end of its historical range of holding 200 Bp OW Slightly positive on Capital Goods: ST technicals are decent and holding levels are at historical lows 150 Bp OW Slightly negative on Food & Beverage: Not "overloved" yet but chart analysis commands caution 150 Bp UW Negative on Insurance: Holdings at historical highs, technicals could rapidly deteriorate 250 Bp UW Negative on Healthcare: Technicals get ugly, the sector is far from "overhate" 300 Bp UW Strongly negative on Utilities due to chart patterns and the fact they are decently owned on a historical basis in portfolios 200 Bp UW 10/03/2015 Society of Technical Analysts 43
44 Conclusion Relative strength charts add valuable information A Top down approach based on relative momentum makes sense to build an equity portfolio Big sector rotations are a rather inert process Nevertheless, identifying reversals is made easier with relative analysis Combining chart analysis, oscillators and multiple timeframes may lead to nice, consistent results (ca. 80% win rate when LT and MT signals coincide) 10/03/2015 Society of Technical Analysts 44
Introduction. Technicians (also known as quantitative analysts or chartists) usually look at price, volume and psychological indicators over time.
 usually look at price, volume and psychological indicators over time.") Technical Analysis Introduction Technical Analysis is the study of market action, primarily through the use of charts, for the purpose of forecasting future price trends. Technicians (also known as quantitative
Technical Analysis Introduction Technical Analysis is the study of market action, primarily through the use of charts, for the purpose of forecasting future price trends. Technicians (also known as quantitative
INTERMEDIATE EDUCATION GUIDE
 INTERMEDIATE EDUCATION GUIDE CONTENTS Key Chart Patterns That Every Trader Needs To Know Continution Patterns Reversal Patterns Statistical Indicators Support And Resistance Fibonacci Retracement Moving
Monthly Investment Compass Charting The Course Of The Markets
 Monthly Investment Compass Charting The Course Of The Markets November 11 th, 2017 Monthly Investment Compass 1) Executive Summary: November 11 th, 2017 U.S. Stock Market: Unmet upside targets in several
Introduction. Technical analysis is the attempt to forecast stock prices on the basis of market-derived data.
 Technical Analysis Introduction Technical analysis is the attempt to forecast stock prices on the basis of market-derived data. Technicians (also known as quantitative analysts or chartists) usually look
FOREX TRADING STRATEGIES.
 FOREX TRADING STRATEGIES www.ifcmarkets.com www.ifcmarkets.com 2 One of the most powerful means of winning a trade is the portfolio of Forex trading strategies applied by traders in different situations.
Last Gasp in the Dollar. Market Update May 18, Seattle Technical Advisors
 SeattleTA provides investment managers with technical analysis of the equity, fixed-income, commodity, and currency markets. While equities are expected to take a hit this week, the big news is expected
The very first calculations for average gain and average loss are simple 14- period averages.
 Introduction Developed by J. Welles Wilder, the Relative Strength Index (RSI) is a momentum oscillator that measures the speed and change of price movements. RSI oscillates between zero and 100. Traditionally,
Methodology. Our team of analysts uses technical and chartist analysis to draw an opinion and make decisions. The preferred chartist elements are:
 Methodology Technical analysis is at the heart of TRADING CENTRAL's expertise. Our methodology is proven. Our chartist and quantitative approach allows us to intervene on different investment horizons.
Bollinger Trading Methods. Play 1 - The Squeeze
 Overview: Play 1 - The Squeeze Play 2 - The Trend Trade Play 3 - Reversals Wrap up Bollinger Trading Methods Play 1 - The Squeeze The Squeeze The most popular strategy Looks to enter a trend early on Anticipates
1. Introduction 2. Chart Basics 3. Trend Lines 4. Indicators 5. Putting It All Together
 Technical Analysis: A Beginners Guide 1. Introduction 2. Chart Basics 3. Trend Lines 4. Indicators 5. Putting It All Together Disclaimer: Neither these presentations, nor anything on Twitter, Cryptoscores.org,
Forex Sentiment Report Q2 FORECAST WEAK AS LONG AS BELOW April
 Forex Sentiment Report 08 April 2015 www.ads-securities.com Q2 FORECAST WEAK AS LONG AS BELOW 1.1200 Targets on a break of 1.1534/35: 1.1740/50 1.1870/75 1.2230/35 Targets on a break of 1.0580/70: 1.0160
Intelligent Investing, LLC Major Indices Daily Update 02/28/ 19
 Elliot Wave Updates Today the S&P500 was stuck in a less than 6p range. So there s really not much we can learn. All parameters remain the same a step 2: A move below SPX2764.55 (last Thursday s low) will
US Financial Market Update for March Prepared for the Market Technicians Association
 US Financial Market Update for March 2016 Prepared for the Market Technicians Association March 16 th, 2016 About Asbury Research Research, Methodology & Clientele Our Research: Asbury Research, established
Compiled by Timon Rossolimos
 Compiled by Timon Rossolimos - 2 - The Seven Best Forex Indicators -All yours! Dear new Forex trader, Everything we do in life, we do for a reason. Why have you taken time out of your day to read this
TECHNICAL INDICATORS
 TECHNICAL INDICATORS WHY USE INDICATORS? Technical analysis is concerned only with price Technical analysis is grounded in the use and analysis of graphs/charts Based on several key assumptions: Price
Intermediate - Trading Analysis
 Intermediate - Trading Analysis Technical Analysis Technical analysis is the attempt to forecast currencies prices on the basis of market-derived data. Technicians (also known as quantitative analysts
1 P a g e. Executive Summary
 Executive Summary Price finally reached our expect SPX2112-2120 and the negative divergences that started to creep in on the daily TIs finally also took their toll over the past 2 days. The weekly charts
Canadian Technical Comment
 October 15 2017 TSX: Shift to defense underway as near-term pullback looms Summary Recommendation: For long-term investment managers with cash on hand, we would wait for a short-term (2-4 week) corrective
Weekly outlook for May 1 May
 Weekly outlook for May 1 May. 5 2017 TREND DIRECTION S&P 500 Oil Gold Short Term Intermediate-Term Long Term strong weak strong strong neutral Strong weak weak weak Summary The S&P500 index is expected
OSCILLATORS. TradeSmart Education Center
 OSCILLATORS TradeSmart Education Center TABLE OF CONTENTS Oscillators Bollinger Bands... Commodity Channel Index.. Fast Stochastic... KST (Short term, Intermediate term, Long term) MACD... Momentum Relative
Market Update March 9, 2015
 SeattleTA provides investment managers with technical analysis of the equity, fixed-income, Stocks dropped and interest rates popped on Fridays payroll report as traders priced in a likely Fed rate hike
Adding longs in the SPX zone will be well-rewarded longer term we believe.
 Executive Summary Last week we found, based on our analyses of the charts: Our SPX2146-2069 target zone remains and can now be narrowed down to SPX2117-2069, as the S&P500 closed at SPX2128 yesterday,
1 P a g e. Executive Summary
 Executive Summary Based on this week s deduction of observable facts, we continue to favor the major a at SPX 1867, major b at SPX 2021 and major c down to SPX 1830-1850ies around October 9-12. How exactly
14 th November General Outlook. Ian Copsey
 2006 General Outlook The Dollar is higher across the board and looks generally positive for one more rally to marginal new highs at least. The 1.2745 EURUSD, 1.2523 USDCHF and 1.8925-45 GBPUSD areas all
Test Your Chapter 1 Knowledge
 Self-Test Answers Test Your Chapter 1 Knowledge 1. Which is the preferred chart type in LOCKIT? The preferred chart type in LOCKIT is the candle chart because candle patterns are part of the decision-making
Schwab Investing Insights Trading Edition Text Close Window Size: November 15, 2007
 Schwab Investing Insights Trading Edition Text Close Window Size: from TheStreet.com November 15, 2007 ON TECHNIQUES Two Indicators Are Better Than One The Relative Strength Index works well but it s better
Trading the Hidden Divergence. Presented by Sunil Mangwani
 Trading the Hidden Divergence Indicators in technical analysis. Indicators along with chart patterns, trend lines, resistance / support levels etc., are an essential part of technical analysis. But there
Monthly Investment Compass Charting The Course Of The Markets
 Monthly Investment Compass Charting The Course Of The Markets January 12 th, 2017 Monthly Investment Compass Executive Summary: January 12 th 2017 U.S. Stock Market: A number of near term metrics warn
 Jack Schwager s Planned Trading Approach 1.Define your trading philosophy or system 2. Choose your markets to be traded 3. Specify your risk parameters A. Minimum risk per trade B. Stop loss strategy C.
PART 3 - CHART PATTERNS & TECHNICAL INDICATORS
 Tyler Chianelli s EASYOPTIONTRADING by OPTION TRADING COACH PART 3 - CHART PATTERNS & TECHNICAL INDICATORS A SIMPLE SYSTEM FOR TRADING OPTIONS WORKS IN UP, DOWN, AND SIDEWAYS MARKETS PART 3.1 - PRIMARY
Monthly Investment Compass Charting The Course Of The Markets
 Monthly Investment Compass Charting The Course Of The Markets September 21st, 2017 Monthly Investment Compass 1) Executive Summary: September 21 st, 2017 U.S. Stock Market: Virtually all of our near term
Technical Analysis. A Language of the Market
 Technical Analysis A Language of the Market Acknowledgement: Most of the slides were originally from CFA Institute and I adapted them for QF206 https://www.cfainstitute.org/learning/products/publications/inv/documents/forms/allitems.aspx
Market Update April 20, 2015
 SeattleTA provides investment managers with technical analysis of the equity, fixed-income, commodity, and The forecast for a high on April 15 was spot-on (there s no kill switch on awesome!). The monthly
Submerging Markets. Market Update August 3, Seattle Technical Advisors
 SeattleTA provides investment managers with technical analysis of the equity, fixed-income, commodity, and currency markets. A cycle low is expected in emerging markets this week and is confirmed by a
BTIG Technical Strategy Year-End Chart Book December 2014
 BTIG Technical Strategy Year-End Chart Book December 2014 This year has been one for the technicians - trends and momentum have dominated conversations about the markets, and for good reason. The following
Gold, Mining Stocks on the Verge of a Major Bull Market
 Gold, Mining Stocks on the Verge of a Major Bull Market By Robert McHugh, Ph.D. In looking at the charts for Gold, Silver and Mining Stocks, it is clear that patterns and wave mappings suggest a bottom
Technical Analysis. Dealing Room Peter Leonidou. Peter Leonidou
 Technical Analysis Dealing Room Questions Traders Should Ask What is the trend? What is the pivot point? What is the support levels? What is the resistance levels? Strong or weaker USD? What 1. Trade
Martin Pring s. Weekly InfoMovie Report. April 8, 2014
 Martin Pring s Weekly InfoMovie Report April 8, 2014 Issue 1093 Weekly InfoMovie Report 1 Key level remains $184 on the SPY. US Equity Market - Last time I pointed out that the $184 level on the S&P ETF
The Technical Edge Page 1. The Technical Edge. Part 1. Indicator types: price, volume, and moving averages and momentum
 The Technical Edge Page 1 The Technical Edge INDICATORS Technical analysis relies on the study of a range of indicators. These come in many specific types, based on calculations or price patterns. For
Technical Indicators that Really Work
 Technical Indicators that Really Work TECHNICAL INDICATORS Technical indicators have become more important than Fundamentals. With the proper use of technical indicators investors are able to determine
1 P a g e. Executive Summary
 Executive Summary Our standard sub division (SSD) Elliot Wave count for the S&P500 continues to track the market well, and we ll keep it as is until the market will tell us different. We continue to expect
How I Trade Profitably Every Single Month without Fail
 How I Trade Profitably Every Single Month without Fail First of all, let me take some time to introduce myself to you. I am Koon Hwee (KH Lee) and I am a full time currency trader. I have a passion for
Morning Trading Comments
 Monday, June 18, 2018 1 Morning Trading Comments SUMMARY OF TRADING VIEWS Technical breakdowns seen on a lot of commodities at the end of last week, combined with further weakness in emerging markets,
Williams Percent Range
 Williams Percent Range (Williams %R or %R) By Marcille Grapa www.surefiretradingchallenge.com RISK DISCLOSURE STATEMENT / DISCLAIMER AGREEMENT Trading any financial market involves risk. This report and
Icoachtrader Consulting Service WELCOME TO. Trading Boot Camp. Day 5
 Icoachtrader Consulting Service www.icoachtrader.weebly.com WELCOME TO Trading Boot Camp Day 5 David Ha Ngo Trading Coach Phone: 1.650.899.1088 Email: icoachtrader@gmail.com The information presented is
Divergence and Momentum Trading
 presented by Thomas Wood MicroQuant SM Divergence Trading Workshop Day One Divergence and Momentum Trading Risk Disclaimer Trading or investing carries a high level of risk, and is not suitable for all
1 P a g e. Executive Summary
 Executive Summary My call two weeks ago to revoke the major-3 top for the S&P500 based on OEW downtrend confirmations on several indices including the S&P500. was the correct thing today as I was then
Technical Analysis and Charting Part II Having an education is one thing, being educated is another.
 Chapter 7 Technical Analysis and Charting Part II Having an education is one thing, being educated is another. Technical analysis is a very broad topic in trading. There are many methods, indicators, and
FOREX. analysing made easy. UNDERSTANDING TECHNICAL ANALYSIS An educational tool by Blackwell Global
 FOREX analysing made easy UNDERSTANDING TECHNICAL ANALYSIS An educational tool by Blackwell Global Risk Warning: Forex and CFDs are leveraged products and you may lose your initial deposit as well as substantial
SOUTH ASIA CHARTSPEAK ISSUE 4 MARCH 2015 ISSUE 5, MAR 2015
 ISSUE 4 MARCH 2015 CONTENTS FX Technical outlook Pg USDINR Bias is for USD weakness till 63 holds 1 EURUSD Thrust is terminal; 1.07 is major support 2 GBPUSD Approaching the critical 1.4800 area 3 USDJPY
Technical Chart Book. ANS Research Desk. Daily Report For, th Dec Weekly Price Outlooks of Various Indices
 ANS Research Desk ARHAM Financial Centre Harihar Chowk, RAJKOT (Guj) Speak to: 0281 6699401 Drop a line to: research@anspl.net Daily Report For, 26-30 th Dec 2011 Technical Chart Book Weekly Price Outlooks
Investing During The Trump Administration: Opportunity & Danger
 Investing During The Trump Administration: Opportunity & Danger Prepared for the Los Angeles Chapter of the American Association of Individual Investors (AAII ) June 17 th, 2017 About Asbury Research John
12 th Oct2018. Gold Silver Copper Zinc Lead Aluminium Nickel Crude Oil Natural Gas. Bullion. Base Metal. Energy. Chana. Agro.
 12 th Oct2018 Bullion Base Metal Energy Agro Gold Silver Copper Zinc Lead Aluminium Nickel Crude Oil Natural Gas Chana Soybean Gold prices climbed almost 1.6% up on Thursday, regaining the psychologically
CMT LEVEL I CURRICULUM Self-Evaluation
 CMT LEVEL I CURRICULUM Self-Evaluation DEAR CFA CHARTERHOLDER, As a CFA charterholder, the requirement that you sit for the CMT Level I exam is waived. However, the content in the CMT Level I Curriculum
Technical Analysis. Weekly Comment. Global. SPX Overbought Relief Rally in Europe!! Equities Sales Trading Commentary
 h Technical Analysis Equities Sales Trading Commentary Weekly Comment Global Michael Riesner Marc Müller 03/07/2012 michael.riesner@ubs.com marc.mueller@ubs.com +41-44-239 1676 +41-44-239 1789 SPX Overbought
AUTHOR: NG EE HWA, TRAINER, CHARTNEXUS TRADING WITH RSI
 AUTHOR: NG EE HWA, TRAINER, CHARTNEXUS TRADING WITH RSI While the use of Relative Strength Index (RSI) to get technical buy and sell signals in a range-bound market is well understood, the use of this
FinQuiz Notes
 Reading 13 Technical analysis is a security analysis technique that involves forecasting the future direction of prices by studying past market data, primarily price and volume. Technical Analysis 2. TECHNICAL
Inter-market Technical Analysis for April 22, Summary Chart TheoTrade LLC. All rights reserved.
 1 Weekly Inter-market Technical Report Summary Chart 1 2018 TheoTrade LLC. All rights reserved. 2 Intraday Intermarket Volatility is returning to the markets, particularly with the collapse/sell-swing
Intermediate-a? SPX2533
 Summary Based on the prior week s price action, I found in last week s digest uncertainty has increased once again on where the market exactly is from and EWT-count perspective. The standard impulse (preferred),
Technical Analysis Workshop Series. Session 11 Semester 2 Week 5 Oscillators Part 2
 Technical Analysis Workshop Series Session 11 Semester 2 Week 5 Oscillators Part 2 DISCLOSURES & DISCLAIMERS This research material has been prepared by NUS Invest. NUS Invest specifically prohibits the
Research Desk StockBroking
 Research Desk StockBroking ValueMax Apr 02, 2018 ValueMax Monthly Investment Ideas ValueMax helps clients to take a long stance on stocks from the S&P BSE-100 universe. Comprising monthly technical investment
15 th March Gold Silver Copper Zinc Lead Aluminium Nickel Crude Oil Natural Gas Guar seed Castor seed. Bullion. Base Metal. Energy.
 15 th March 2018 Bullion Base Metal Energy Agro Gold Silver Copper Zinc Lead Aluminium Nickel Crude Oil Natural Gas Guar seed Castor seed On the daily chart MCX Gold price has given rising wedge breakdown
Chapter 2.3. Technical Analysis: Technical Indicators
 Chapter 2.3 Technical Analysis: Technical Indicators 0 TECHNICAL ANALYSIS: TECHNICAL INDICATORS Charts always have a story to tell. However, from time to time those charts may be speaking a language you
Real-time Analytics Methodology
 New High/Low New High/Low alerts are generated once daily when a stock hits a new 13 Week, 26 Week or 52 Week High/Low. Each second of the trading day, the stock price is compared to its previous 13 Week,
Summary Merry Christmass,
 Summary For weeks I ve been looking for the indices to reach ideally SPX2500-2475, NAS6395-6295 and NDX6080 +/- 10, DJIA $23,200 +/-100 and RUT $1355-1310. as at these levels the minute, minor and intermediate-waves
1 P a g e. Executive Summary
 Executive Summary Last week I was looking for SPX2455-2475 and the S&P500 gave us SPX2454 on Monday and then started to pullback and consolidate causing for many pundits to already start top calling. Close
Intermediate-a? SPX2533
 Summary Like last week, also this week s Friday-price action left a lot to be desired for the Bulls and ambiguity regarding which exact Elliot Wave price pattern remains: major-4 still underway? Major-4
 1 www.candlecharts.com 2 BONUS www. candlecharts.com/special/swing-trading-2/ 3 www. candlecharts.com/special/swing-trading-2/ 4 www. candlecharts.com/special/swing-trading-2/ 5 www. candlecharts.com/special/swing-trading-2/
S&P 500 Update: Week ending May 11th 2018
 S&P 500 Update: Week ending May 11th 2018 1. Market Recap: The S&P 500 closed higher by 2.2% for week and broke out of some key resistance areas and a short term downtrend. There are 4 topics now setting
Technical analysis & Charting The Foundation of technical analysis is the Chart.
 Technical analysis & Charting The Foundation of technical analysis is the Chart. Charts Mainly there are 2 types of charts 1. Line Chart 2. Candlestick Chart Line charts A chart shown below is the Line
Top-Down Approach to Stock Selection Using AIQ's Group/Sector Capabilities
 Section III. Top-Down Approach to Stock Selection Using AIQ's Group/Sector Capabilities In This Section TradingExpert provides the tools 54 View Market Log for sector rotation 54 Next: view Group Analysis
WEEKLY GLOBAL ROADMAP
 11 February 2016 1 WEEKLY GLOBAL ROADMAP Why a lower US dollar will help to stabilize markets What s new this week? This week, we started to see reactions typically observed in major financial crisis.
Level I Learning Objectives by chapter
 Level I Learning Objectives by chapter 1. Introduction to the Evolution of Technical Analysis Describe the development of modern technical analysis Describe the origins of technical analysis 2. A New Age
Lara s Weekly. S&P500 + GOLD + USOIL Elliott Wave & Technical Analysis. Lara Iriarte CMT 23 February, 2018
 Lara s Weekly S&P500 + GOLD + USOIL Elliott Wave & Technical Analysis Lara Iriarte CMT 23 February, 2018 S&P 500 Contents S&P 500 GOLD USOIL About Disclaimer 3 18 36 48 48 S&P 500 S&P 500 Upwards movement
1 P a g e. Summary. However, a move over SPX2817 from current levels will mean we re still dealing with a larger, more complex bounce to SPX
 Summary Last week I provided some additional information from John Murphy and about typical end-of-bull sector rotation as added weight of evidence for a larger correction being underway. This week the
1 P a g e. Executive Summary
 Executive Summary Over the past week we re-introduced some alternative counts, all of which bullish and some simple more bullish than others. The market keeps tracking them well; and we still can t eliminate
1 P a g e. Executive Summary
 Executive Summary We can keep the executive summary very simple, and repeat what we said last week: A break below SPX2405 is now needed to put the Bull-count in jeopardy. Until then we have to look up,
TECHNICAL ANALYSIS. SURI DUDDELLA Trading Broadening Top/Bottom Patterns
 SURI DUDDELLA Trading Broadening Top/Bottom Patterns 8 Broadening top and bottom patterns are considered reversal patterns and usually appear at the major tops/ bottoms. Suri Duddella discusses how to
1 P a g e. Executive Summary
 Executive Summary For three weeks we provided a primary (major b) and alternative count (primary V) up and we keep tracking both until one or the other is disproven. Two weeks ago we projected a major
Figure 3.6 Swing High
 Swing Highs and Lows A swing high is simply any turning point where rising price changes to falling price. I define a swing high (SH) as a price bar high, preceded by two lower highs (LH) and followed
HEIKIN-ASHI TRENDS NEWSLETTER
 HEIKIN-ASHI TRENDS NEWSLETTER INDEXES EQUITIES FOREX CRYPTOCURRENCIES #227 05.13.2018 EDUCOFIN 2013-2018. ALL RIGHTS RESERVED 25% DISCOUNT BE YOUR MASTER, A HEIKIN-ASHI MASTER. ORDER BOTH HEIKIN-ASHI TRADING
The sideways churn in the major U.S. Stock indexes since late March continues. We have a lot of new members that have
 May 17, 2016 Dear Members, The sideways churn in the major U.S. Stock indexes since late March continues. We have a lot of new members that have recently joined us in the past couple of months. For you
17 th Dec Gold Silver Copper Zinc Lead Aluminium Nickel Crude Oil Natural Gas. Bullion. Base Metal. Energy. Jeera. Agro.
 17 th Dec 2018 Bullion Base Metal Energy Agro Gold Silver Copper Zinc Lead Aluminium Nickel Crude Oil Natural Gas Jeera Chana MCX Gold price has moved lower on Friday session. On a weekly chart, price
Weekly outlook for May 28/9 - June 1, 2018
 Weekly outlook for May 28/9 - June 1, 2018 Summary The S&P500 index is expected to be dull due to the short week, barring major news. A minor pullback maybe seen, but it should be a very short-lived. It
Technical Strategy. Q1 Dollar top as the basis for a sharp correction
 2017 Chart 38. ) DXY with Advance/Decline Line (20 Key Dollar Pairs) Chart 39. ) US Dollar with Presidential Cycle Tactically, we have been bullish US dollar since the May 2016 bottom, which is the base
What is Technical Analysis
 Reg. office: International School of Financial Market, Plot no. 152 - P (LGF), Sec - 38, Medicity Road, Gurgaon - 122002 Contact no. : 0124-2200689,+919540008689, 9654446629 Web : www.isfm.co.in, Email
Intelligent Investing, LLC Major Indices Daily Update 02/26/ 19
 Elliot Wave Updates Yesterday I found a move below last Friday s high (SPX2794.20) will be a first sign of lower prices as then the decline can t be a 4 th wave because 4 th and 1 st waves can t overlap
The Trifecta Guide to Technical Analysis 1
 The Trifecta Guide to Technical Analysis 1 No trading system is bullet-proof. The list of factors that can impact a stock s share price is long and growing from investor sentiment to economic growth to
Morning Trading Comments
 Monday, September 03, 2018 1 Morning Trading Comments SUMMARY OF TRADING VIEWS European stockmarket indices resumed their downtrend over the last few sessions showing that, despite the recent technical
The goal for Part One is to develop a common language that you and I
 PART ONE Basic Training The goal for Part One is to develop a common language that you and I can use. The rest of the book will discuss how the technical indicators highlighted in the first two chapters
MULTI-TIMEFRAME TREND TRADING
 1. SYNOPSIS The system described is a trend-following system on a slow timeframe that uses optimized (that is, contrarian) entries and exits on a fast timeframe at the tops and bottoms of retraces against
Table of Contents. Risk Disclosure. Things we will be going over. 2 Most Common Chart Layouts Anatomy of a candlestick.
 Table of Contents Risk Disclosure Things we will be going over 2 Most Common Chart Layouts Anatomy of a candlestick Candlestick chart Anatomy of a BAR PLOT Indicators Trend-Lines Volume MACD RSI The Stochastic
Technical Indicators
 Taken From: Technical Analysis of the Financial Markets A Comprehensive Guide to Trading Methods & Applications John Murphy, New York Institute of Finance, Published 1999 Technical Indicators Technical
Fast Track Stochastic:
 Fast Track Stochastic: For discussion, the nuts and bolts of trading the Stochastic Indicator in any market and any timeframe are presented herein at the request of Beth Shapiro, organizer of the Day Traders
Monthly Dairy Technical Commentary August 19, 2015
 Monthly Dairy Technical Commentary August 19, 2015 CME Class III Milk Futures Range contraction continues for Class III Milk as it continues to correct the September 2014 through January 2015 downdraft.
On Our Technical Watch
 By the Kenanga Research Team l research@kenanga.com.my Figure 1: Daily Charting FBMKLCI Basic Data 52-week High 1,759.76 (in Million) 52-week Low 1,611.88 KLCI Vol 112.14 Current Level 1,735.84 Bursa Vol
Saudi Market (TADAWUL)... 2 Boursa Kuwait... 3 Abu Dhabi Exchange... 4 Dubai Financial Market... 5 Definitions... 6 Contacts... 7.
... 2 Boursa Kuwait... 3 Abu Dhabi Exchange... 4 Dubai Financial Market... 5 Definitions... 6 Contacts... 7.") QNBFS Technical Technical Spotlight Spotlight Sunday, February January 14, 11, 2018 2018 Contents Saudi Market (TADAWUL)... 2 Boursa Kuwait... 3 Abu Dhabi Exchange... 4 Dubai Financial Market... 5 Definitions...
QNBFS Technical Technical Spotlight Spotlight Sunday, February January 14, 11, 2018 2018 Contents Saudi Market (TADAWUL)... 2 Boursa Kuwait... 3 Abu Dhabi Exchange... 4 Dubai Financial Market... 5 Definitions...
In the Charts Forex. Today s key points. CROSS ASSET TECHNICAL ANALYSIS 01 October 2013
 CROSS ASSET TECHNICAL ANALYSIS 01 October 2013 In the Charts Forex Today s key points EUR/USD has given a break above the weekly channel resistance of 1.3454/20 which also happens to be 76.4% retracement
THE CYCLE TRADING PATTERN MANUAL
 TIMING IS EVERYTHING And the use of time cycles can greatly improve the accuracy and success of your trading and/or system. THE CYCLE TRADING PATTERN MANUAL By Walter Bressert There is no magic oscillator