Europeans knowledge of economic indicators
|
|
|
- Jeffery Ellis
- 5 years ago
- Views:
Transcription
1 Special Eurobarometer 323 European Commission Europeans knowledge of economic indicators Fieldwork: August - September 2009 Publication: January 2010 Special Eurobarometer 323 / Wave 72.1 TNS Opinion & Social This survey was requested and coordinated by the Directorate-General for Communication ( Research and Political Analysis Unit) This document does not represent the point of view of the European Commission. The interpretations and opinions contained in it are solely those of the authors.
2
3 Special Eurobarometer 323 EUROPEANS KNOWLEDGE OF ECONOMIC INDICATORS Conducted by TNS Opinion & Social at the request of Directorate General Communication Survey co-ordinated by Directorate General Communication TNS Opinion & Social Avenue Herrmann Debroux, Brussels Belgium
4
5 Table of contents INTRODUCTION CLIMATE OF OPINION ON ECONOMIC MATTERS National situation compared to European average Employment situation National economy KNOWLEDGE OF ECONOMIC INDICATORS Growth rate of the economy Inflation rate Unemployment rate THE IMPORTANCE OF STATISTICAL FIGURES Perceived necessity of knowing economic statistics Political role of statistics Trust in official statistics...44 CONCLUSION...48 ANNEX TECHNICAL SPECIFICATIONS QUESTIONNAIRE TABLES - 1 -
6 INTRODUCTION This survey was originally inspired by a meeting of OECD World Forum on Statistics, Knowledge and Policy which took place in Istanbul in June 2007, and which identified a need for a more comprehensive view on societal progress one that takes into account social, environmental and economic concerns rather than just focusing on economic indicators. This raised a number of questions about how awareness and understanding of economic indicators could be fostered among EU citizens. To measure the extent of knowledge the Directorate-General Communication of the European Commission initiated a survey in March-April to evaluate opinion on the general economic climate, the levels of understanding and knowledge of the economic growth rate, inflation rate and unemployment rate and the importance that Europeans give to these figures. This survey was repeated in Since the surveys span a period of intense economic and political change, it will be particularly interesting to note whether the global crisis has had a significant bearing on Europeans awareness of economic indicators. The most recent survey on Europeans awareness of economic indicators was conducted in the 27 European Member States in Autumn Fieldwork took place between 28 th August and 17 th September 2009, as part of the Eurobarometer
7 In order to maintain homogeneity in the results, the real figures of economic indicators that have been used in this survey were sourced from Eurostat s data base. When analysing the results, it has been taken into account that the real figures that have been circulating in the national media may have differed slightly from those published by Eurostat, usually being rounded up or down to integer numbers. It became obvious that the large majority of respondents gave integer numbers for the economic indicators. In fact the figures are calculated in a different way in some countries. Moreover, the respondents could have based their knowledge on more recent publications than the ones referred to in the questionnaire. When citizens were asked to estimate the different economic indicators in their countries, answers that are fairly close to the real figure, though not exact are considered to be 'correct'. In this regard, it was chosen to consider all estimates differing 20% either side from the real figure as being 'correct'. For example, an unemployment rate of 10% is estimated correctly when the answers are between 8% and 12%. The survey was commissioned by the European Commission s Directorate-General for Communication and was carried out by TNS Opinion & Social, a consortium formed by TNS plc and TNS opinion. The methodology used is that of the Standard Eurobarometer surveys of the Directorate-General for Communication ( Research and Political Analysis Unit). A technical note concerning the interviews, carried out by the institutes of the TNS Opinion & Social network, is annexed in this report. This note specifies the interview method used, as well as the confidence intervals
8 In this report, the countries are represented by their official abbreviations. The abbreviations used in this report correspond to: ABBREVIATIONS EU27 DK/NA BE BG CZ DK D-E DE D-W EE EL ES FR IE IT CY LT LV LU HU MT NL AT PL PT RO SI SK FI SE UK European Union 27 Member States Don t know / No answer Belgium Bulgaria Czech Republic Denmark East Germany Germany West Germany Estonia Greece Spain France Ireland Italy Republic of Cyprus Lithuania Latvia Luxembourg Hungary Malta The Netherlands Austria Poland Portugal Romania Slovenia Slovakia Finland Sweden The United Kingdom - 4 -
9 1. CLIMATE OF OPINION ON ECONOMIC MATTERS 1.1 National situation compared to European average - Europeans perceive their employment situation to be worse than the EU average Employment situation When invited to comment on their national employment situation as compared to the European average 2, most Europeans (56%) state that it is "worse", while just 35% think that it is "better". Europeans' views tend to be strongly negative, as 19% believe that their national situation is "definitely less good". Only 3% say that it is "much better". QC8.1 For each of the following domains, would you say that the situation in (OUR COUNTRY) is better or less good than the average of the European Union countries? - The employment situation in (OUR COUNTRY) - % EU Total "Better" Total "Less good" DK EB 72.1 Aug.-Sep % 56% 9% EB 70 Aut % 59% 10% EB 69 Sp % 57% 9% 0% 100% Compared to the results of a survey conducted in Autumn 2008 (EB70), more Europeans (35% in 2009 vs. 31% in 2008) think their national employment situation is "better" than the European average. However the majority still think that the job - 5 -
10 situation in their country is "worse" than the European average (56%, down from 59% in Autumn 2008). Optimism is particularly high in Luxembourg (94%) and Denmark (91%) where the overwhelming majority believes their national employment situation is "better" than the European average. In the Netherlands (87%), Austria (77%), Sweden (72%), Finland (67%), Belgium (63%), Cyprus (61%), Germany (57%) and France (49%) the majority believe their national employment situation is stronger than the European average. In Lithuania (2%), Bulgaria (3%), Latvia (3%), Romania (7%), Greece (7%), Hungary (8%), Slovakia (10%), Spain (11%) and Estonia (11%), respondents are more pessimistic about their national employment prospects. 2 QC8.1 For each of the following domains, would you say that the situation in (OUR COUNTRY) is better or less good than the average of the European Union countries? The employment situation in (OUR COUNTRY) - 6 -
, Spain (+14 points), Slovakia (+12 points),")
 we see increases in the proportions of people")

11 In Czech Republic (+17 percentage points), Lithuania (+14 points), Spain (+14 points), Slovakia (+12 points), Ireland (+13 points), Bulgaria (+12 points) and Latvia (+10) we see increases in the proportions of people agreeing the employment situation is less good in their country compared to the average of the European countries
 and in Luxembourg (+14")
12 In two countries we note much greater optimism. Compared to Autumn 2008, more respondents in France (+25 percentage points) and in Luxembourg (+14 points) think the employment situation is "better"
 to consider the employment situation in their")
13 The socio-demographic analysis reveals little difference in the responses by gender or age, but we observe distinct differences in the education level of respondents; although the majority of people polled thinks the employment situation is "less good" in their country than in the EU as a whole, those who left education earlier are more likely (61%) to consider the employment situation in their country "less good" than the EU average (56%). People who studied longer, perhaps because of the opportunities this affords them, are less likely (50%) to be pessimistic about the employment situation in their country, compared to the European average
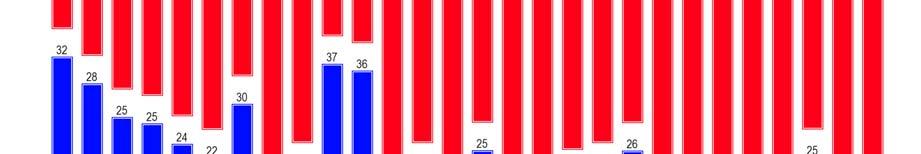
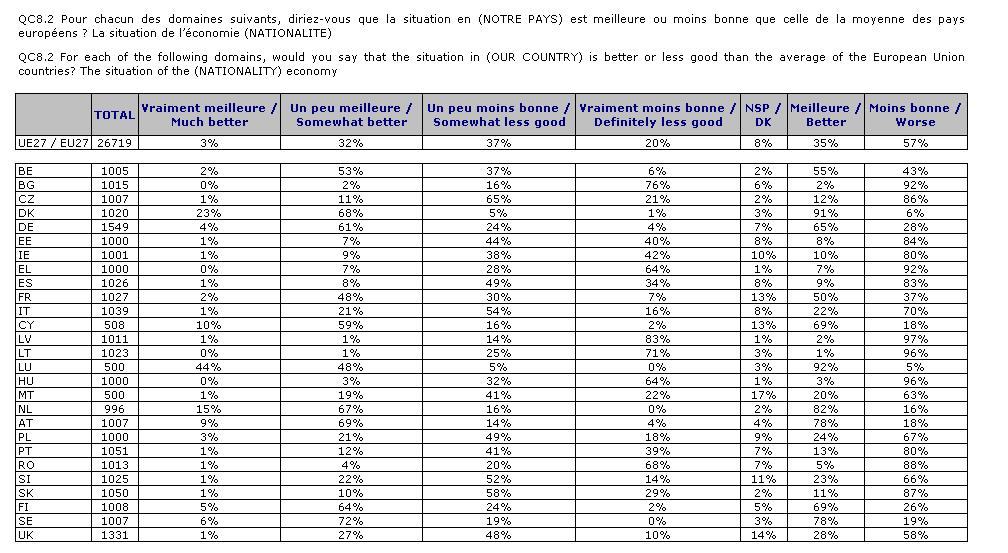
14 QC8.1 For each of the following domains, would you say that the situation in (OUR COUNTRY) is better or less good than the average of the European Union countries? The employment situation in (OUR COUNTRY) Total Better Total Less good DK EU27 35% 56% 9% Sex Male 36% 57% 7% Female 34% 56% 10% Age % 55% 8% % 59% 7% % 58% 7% % 54% 12% Education (End of) 15-27% 61% 12% % 59% 8% % 50% 7% Still studying 39% 53% 8% National economy - Europeans think their national economy is worse than the EU average - When asked to comment on the situation of the national economy compared to the European average 3, most Europeans (57%) state that it is "less good". Only 35% believe that it is "better". Europeans' views of their national economy tend to be rather negative, as 20% believe that it is "definitely less good", while just 3% think it "much better". 3 QC8.2 For each of the following domains, would you say that the situation in (OUR COUNTRY) is better or less good than the average of the European Union countries? The situation of the (NATIONALITY) economy
15 QC8.2 For each of the following domains, would you say that the situation in (OUR COUNTRY) is better or less good than the average of the European Union countries? - The situation of the (NATIONALITY) economy - % EU Total "Better" Total "Less good" DK EB 72.1 Aug.-Sep % 57% 8% EB 70 Aut % 55% 9% EB 69 Sp % 56% 9% 0% 100% Compared to the results of a study conducted in Autumn 2008 (EB70), more Europeans think their national economy is "less good" now (57%), compared to 55% in Autumn The number of respondents with the strongest view on this question has increased, as the percentage of those who think their economy is definitely less good" has risen from 15% to 20%. Respondents in Luxembourg (92%), Denmark (91%), the Netherlands (82%), Austria (78%), Sweden (78%), Cyprus (69%), Finland (69%), Germany (65%), Belgium (55%) and France (50%) all consider their national economy to be stronger than the European average. In Lithuania (1%), Latvia (2%), Bulgaria (2%), Hungary (3%), Romania (5%), Greece (7%), Estonia (8%), Spain (9%) and Ireland (10%) respondents are far less positive about their national economy compared to European averages. It should be noted that most of these countries have been impacted strongly by the economic crisis
 are more likely to agree that their economy")

16 Since Autumn 2008, respondents from Ireland (+22 percentage points) and Slovakia (+20 percentage points) are more likely to agree that their economy has gotten worse. French respondents buck the European trend in that they are more likely to think (+13 percentage points) that their national economy has improved
 tend to believe the economy is \"better\" than the European average, compared to those who left education earlier (26%).")
17 Although we note little difference between age groups, the educational achievement of respondents affects their view of their national economy., The majority of those who studied longer (45%) tend to believe the economy is "better" than the European average, compared to those who left education earlier (26%). The relationship is inverted for those who left school early the majority of whom (62%) perceive the economy to be "less good" than the EU average, compared to 50% of those who were in education for longer. Employment status also has bearing on the respondents view of the economy. Managers, like the well-educated, (as they likely share a common background), tend to be most positive about the economy; 47% think it is "better" than the EU average. Those people with an internet connection at home are more optimistic (42% of them think that the national economy isbetter) than those without (26% of them claimed this). This is probably related to the financial position of respondents, which is often better for those who have an internet connection at home
18 Respondents ability to pay their household bills is also strongly correlated with their view of the national economy; those who experience little difficulty (42% of whom think the national economy is better) have a brighter outlook than those who struggle (18% of whom share this belief). We also note that self-positioning on the social staircase is strongly linked to a view of the economic situation; people who rate themselves highly (43%) are more likely to have a positive view of the economy than those who perceive themselves lower down the social scale (26%)
19 QC8.2 For each of the following domains, would you say that the situation in (OUR COUNTRY) is better or less good than the average of the European Union countries? The situation of the (NATIONALITY) economy Total Better Total Less good EU27 35% 57% 8% Sex Male 37% 57% 6% Female 34% 56% 10% Age % 55% 8% % 59% 7% % 58% 6% % 55% 10% Education (End of) 15-26% 62% 12% % 59% 7% % 50% 5% Still studying 39% 54% 7% Respondent occupation scale Self- employed 35% 60% 5% Managers 47% 49% 4% Other white collars 36% 59% 5% Manual workers 34% 59% 7% House persons 29% 60% 11% Unemployed 24% 67% 9% Retired 34% 55% 11% Students 39% 54% 7% Internet connection at home Yes 42% 52% 6% No 26% 64% 10% Difficulties paying bills Most of the time 18% 73% 9% From time to time 27% 65% 8% Almost never 42% 51% 7% Self-positioning on the social staircase Low (1-4) 26% 65% 9% Medium (5-6) 35% 57% 8% High (7-10) 43% 52% 5% DK
20 2. KNOWLEDGE OF ECONOMIC INDICATORS As already noted, Europeans tend to be somewhat pessimistic about both their national economic state and their employment situation relative to the EU average. Although Europeans believe that the employment market in their country has improved slightly since Autumn 2008, for many the economic situation has worsened. In this next section we examine Europeans level of knowledge about specific economic measures. In particular, we will look at their understanding of three key statistics; the growth rate of the economy in terms of Gross Domestic Product (GDP), the inflation rate and the unemployment rate in their countries. When considering the results, it is very important to bear in mind the high proportions of respondents who spontaneously say they are unable to form an opinion. Upwards of one-third of those polled answer "don t know" to questions on national growth, inflation and unemployment rates. The significant levels of "don t knows" are likely due to the nature of the subject, as for many people this is a difficult and abstract topic
21 2.1 Growth rate of the economy - Most Europeans, asked about the growth rate in their country, give an incorrect answer - The size of an economy, or the results of economic activity in a country, are measured as Gross Domestic Product (GDP) 4. To gauge the respondents understanding more accurately, the sample was split into two (Split A or Split B) using a technique known as a split ballot. This allows the pollster to ask one half of the respondents one of two slightly different questions. The other half is asked a slightly modified version of the question. A comparison of the results to both versions of the question reveals how the difference in the questions wording impacts the respondents answers. In this set of split questions, respondents to the questions in Split B 5 were given more information than those in Split A. When asked what was the official growth rate in 2008 in their country, respondents in Split B were told the exact rate of growth in their country in 2007, whereas respondents in Split A 6 were given no such guidance. The overwhelming majority of respondents in both groups (both 95%) give a wrong answer, but it is particularly striking to note that those Europeans who were given the 2007 GDP (Split B) for their country tended to be less accurate than those who were not given this information (Split A). The results show that respondents in both Split A and Split B tend to overestimate the rate of growth in their country. On average, respondents think their national growth rate was approximately double the actual figure. 4 Definition by Eurostat: Basically, GDP is a concept of value added. It is the sum of gross value added of all resident producer units (institutional sectors or, alternatively, industries) plus that part (possibly the total) of taxes, less subsidies, on products which is not included in the valuation of output. Gross value added is the difference between output and intermediate consumption. &StrNom=CODED2&StrLanguageCode=EN&IntKey= &RdoSearch=BEGIN&TxtSearch=Gross%20do mestic&cbotheme=&intcurrentpage=1 5 QC1b In 2007, the official growth rate of our country (measured in terms of Gross Domestic Product) in (OUR COUNTRY) was [INSERT THE EXACT RATE OF YOUR COUNTRY]%. What was the official growth rate of the economy in (OUR COUNTRY) in 2008? I can tell you that this figure is between -5% and +10%. 6 QC1a What was the official growth rate of the economy (measured in terms of Gross Domestic Product) in (OUR COUNTRY) in 2008? I can tell you that this figure is between -5% and +10%.
22 QC1a What was the official growth rate of the economy (measured in terms of Gross Domestic Product) in (OUR COUNTRY) in 2008? I can tell you that this figure is between -5% and +10%. QC1b In 2007, the official growth rate (measured in terms of Gross Domestic product) in (OUR COUNTRY) was [INSERT THE EXACT RATE OF YOUR COUNTRY]%. What was the official growth rate of the economy in (OUR COUNTRY) in 2008? I can tell you that this figure is between -5% and +10%. Average estimated rate (%) Official rate 2008 (%)* Difference (estimated rate - official rate 2008) DK Average estimated rate (%) Official rate 2008 (%)* Difference (estimated rate - official rate 2008) LV % LV % EE % EE % IE % IE % LU % LU % DK % IT % IT % DK % SE % LT % FR % SE % FI % FI % HU % BE % BE % FR % LT % PT % PT % HU % EU % UK % EL % EU % MT % CZ % SI % MT % CZ % EL % DE % CY % UK % DE % AT % SI % CY % PL % PL % AT % NL % SK % ES % NL % SK % BG % BG % ES % RO % RO % *Source: Eurostat DK
23 In total, 19 countries overestimate their national growth rate in Split A, but respondents in 20 countries overestimate the rate in Split B, despite having more information about the previous year's growth figures. Comparing the results with the previous survey conducted in March-April 2007, we note that Europeans displayed a tendency to overstate their national growth rate in this study as well, but in this survey those given more information (Split B) generally gave more precise answers. Looking at the answers to both Split A and B, we see that respondents in Latvia, Estonia and Ireland are most likely to overrate the growth rates in their countries. Those in Romania, Spain, and Bulgaria form a group of countries that is more pessimistic and underestimates their national growth rate - Romania very significantly so. Respondents in Germany, Cyprus, Austria, Greece, Czech Republic, Poland and Slovenia appear the best informed about their growth rates. Rather unusually, as mentioned previously, Europeans tend to be less accurate once given the previous year's growth rate as a guide (Split B). This pattern is witnessed in a number of countries; Belgium, Czech Republic, Germany, Estonia, Ireland, Cyprus, Latvia, Lithuania, Luxembourg, Malta, Austria, Portugal, Romania, Slovenia, Slovakia and the UK. In Bulgaria, Denmark, Greece, France, Italy, Hungary, the Netherlands, Poland and Sweden respondents become more accurate once they are given additional information. In Spain and Finland the accuracy of responses remained unchanged when the previous year s rate was given. However, as referenced earlier, we note high don t know rates across Europe. This was also witnessed in the survey conducted in March-April In this wave, conducted in August-September 2009, in Latvia, Romania and Portugal don t know are very high indeed, with around 4 in 5 people unable to form a view. Don t know rates are lower in Austria and the Netherlands in particular, but even here they still form at least 25% of all responses
24 Somewhat counter-intuitively, the additional information provided in Split B does little to reduce the don t know rates. Indeed, in some cases don t know rates increase once the supplemental data are provided. This is particularly striking in Lithuania were don t knows increase from 51% in Split A, to 57% in Split B. - Variations in accuracy of national growth rates across Europe - As the economic indicator figures published in national media may vary, to calculate the rate of correct estimation of the national growth rate, all answers differing by 20% in either direction from the official growth rate have been defined as correct. Looking at those responses defined as correct we see that respondents from the Netherlands, Poland and Slovakia (all 18%) are the most accurate, although this means the majority of those able to give an opinion (82%) are giving incorrect answers. Bulgarians (16%), Slovenians (15%) and Austrians (10%) are all at least twice as accurate as the EU average (5%). In Luxembourg and Italy (both 1%), Portugal, Latvia and Denmark (all 2%) a very low proportion of respondents give an accurate answer. Levels of accuracy appear to have declined since March-April 2007, when the average correct estimation rate was 12% across the European Union, to 5% in In 21 out of the 27 countries polled there is a decrease in awareness of the national growth rate from 2007 to In Bulgaria we see the greatest increase in accuracy, from 10% in 2007, to 16% in 2009 (+6 percentage points). In Malta correct answers increased from 4% in 2007 to 6% in 2009 (+2 percentage points), and in Spain from 4% to 5%, in Belgium from 8% to 9% and in Poland from 17% to 18% (all +1 point). In Cyprus there is no change and accuracy has remained constant at 6% in 2007 and However, there are significant declines in Czech Republic from 26% in 2007 to 6% in 2009 (-20 percentage points), in Estonia from 24% to 4% in 2009 (-20 points) and Ireland from 23% to 3% (-20 points)
25 QC1T National Growth rate in 2008 ('SPLIT A' + 'SPLIT B') -Correct answers* EU27 20% 18% 18% 18 % 18 % 16% 16% 15 % 14% 12% 10% 10% 9% 8% 6% 4% 2% 0% NL PL SK BG SI AT BE 6% 6% 6% 6% CZ DE CY MT EU27 5% 5% ES EE EL FI 4% 4% 4% *Answers not differing more than 20% from the official growth rate IE LT 3% 3% 2% 2% 2% DK LV PT IT LU FR HU RO SE 1% 1% 0% 0% 0% 0% 0% UK
26 2.2 Inflation rate - Most Europeans don t know their national inflation rate - The inflation rate is the annual percentage increase in the price of goods and services 7. When asked to estimate the official inflation rate in their country 8, the great majority (89%) of Europeans give an incorrect answer. Taking an average of all responses, Europeans slightly underestimate the actual inflation rate. Almost half (45%) of all Europeans polled are unable to offer an opinion on the rate of inflation in their country, reflecting the difficulty many respondents face in answering questions about this topic. Europeans awareness of inflation rates has increased since the last poll in March-April 2007, when more than half (53%) said they did not know their country s inflation rate. This increase in awareness may well be due to the greater focus on the economy as the financial crisis made itself felt across the European Union in Definition of inflation rate according to Eurostat 8 QC2 What was the official inflation rate, the rate of which consumer prices increased or decreased, in (OUR COUNTRY) in 2008? I can tell you that the exact figure is between -5% and 20%
27 QC2 What was the official inflation rate, the rate of which consumer prices increased or decreased, in (OUR COUNTRY) in 2008? I can tell you that the exact figure is between -5% and 20%. Average estimated rate (%) Official rate 2008 (%)* Difference (estimated rate - official rate 2008) DK CY 6,6 4,4 2,2 63% EL 6,1 4,2 1,9 44% IE 4,4 3,1 1,3 35% SK 4,9 3,9 1,0 45% HU 7,0 6,0 1,0 26% PT 3,7 2,7 1,0 74% PL 4,8 4,2 0,6 40% AT 3,6 3,2 0,4 29% FR 3,5 3,2 0,3 50% IT 3,8 3,5 0,3 56% MT 4,8 4,7 0,1 64% LU 3,9 4,1-0,2 58% DE 2,5 2,8-0,3 35% FI 3,6 3,9-0,3 35% EU27 3,4 3,7-0,3 45% NL 1,9 2,2-0,3 26% DK 3,2 3,6-0,4 36% BE 4,1 4,5-0,4 30% UK 3,1 3,6-0,5 55% SE 2,6 3,3-0,7 36% SI 4,8 5,5-0,7 39% CZ 4,9 6,3-1,4 48% RO 5,7 7,9-2,2 73% ES 0,4 4,1-3,7 35% LV 11,4 15,3-3,9 51% EE 6,6 10,6-4,0 53% LT 7,1 11,1-4,0 52% BG 7,0 12,0-5,0 59% *Source : Eurostat The accuracy of the responses given differs across the European Union, with respondents in a total of 16 countries underestimating their national rate of inflation. The remaining 11 countries overestimate the inflation rate to some degree or another
28 The greatest underestimation was in Bulgaria, Estonia and Lithuania. At the other end of the spectrum, respondents from Cyprus and Greece are most likely to overestimate the rate of inflation in their respective countries. The Maltese, Luxembourgers, Germans, French and Italians are among the most accurate when estimating their national inflation rate. They form a group along with Belgians, Danes, Dutch, Austrians and the Finns, who give answers closest to their national rates. As seen previously in responses about national growth rates, Portuguese (74%) and Romanian (73%) respondents have the greatest difficulty in forming an opinion on this subject 9. - Many Europeans correctly assume national inflation has increased - When asked if in their country if the inflation rate in 2008 was higher, lower or equal to the one in , most Europeans (44%) answer that it was "higher" 11. Just 21% think it was lower and a further 14% think it was equal. A little over 1 in 5 respondents are unable to form an opinion, but this is substantially fewer than the percentage of don t know answers to questions about the national growth rate in the earlier part of the survey. When looking at the actual rates of inflation across European Member States from 2007 to 2008, they were all higher except for Hungary, where the rate fell from 7.9% in 2007 to 6.0% in The majority of respondents in EU Member States state that the national inflation rate increased from 2007 to However, there are a number of noteworthy variations. First is the strength of opinion in Latvia, where 69% of those polled believe that inflation rose year-on-year. They are correct, as inflation in Latvia rose from 10.1% in 2007 to 15.3 in There is even stronger agreement (73%) that inflation rose in 9 Care should be taken when attributing meaning to the results of the survey particularly in countries where there are such high levels of don t know answers. 10 QC3 Do you think that, in (OUR COUNTRY), the inflation rate in 2008 was higher, lower or equal to the one in 2007? 11 The inflation rate in 2007 was 2.4, in 2008 it was &footnotes=yes&labeling=labels&plugin=1-24 -
29 Hungary, but here Eurostat data show that inflation actually fell, as noted earlier, from 7.9% to 6.0%. In Spain a small majority of respondents (32%) believe inflation was lower in 2008, but official figures show it rose slightly from 2.8% in 2007 to 4.1% in % of the Irish respondents also believe that inflation was lower in 2008, but official figures show that it rose slightly from 2.9% in 2007 to 3.1% in QC3 Do you think that, in (OUR COUNTRY), the inflation rate in 2008 was higher, lower or equal to the one in 2007? Official rate 2008 (%) Official rates Official rate 2007 (%) Difference ( ) Estimated rates Higher Lower Equal DK LT % 16% 7% 23% LV % 11% 7% 13% BG % 12% 9% 37% MT % 7% 12% 20% EE % 18% 8% 27% CZ % 16% 21% 14% RO % 14% 7% 36% BE % 19% 14% 8% FI % 24% 15% 23% CY % 7% 8% 32% SK % 25% 20% 11% DK % 21% 23% 12% SI % 19% 7% 20% FR % 18% 10% 23% PL % 13% 21% 27% SE % 36% 11% 11% IT % 19% 14% 21% EU % 21% 14% 21% LU % 14% 12% 28% UK % 28% 9% 20% ES % 32% 12% 25% EL % 10% 16% 15% AT % 17% 21% 10% NL % 32% 13% 10% DE % 22% 19% 15% PT % 14% 11% 38% IE % 30% 13% 28% HU % 7% 9% 11% *Source : Eurostat
30 - Wide variations in knowledge of inflation rates - Respondents from Hungary (27%), Poland (24%) and the Netherlands (23%) are the most likely to give an accurate response to the question about national inflation rates. Their accuracy rates are well above the EU average of 11%. At the other end of the spectrum, the Spanish (3%), Luxembourgers (4%), Portuguese (5%) and Bulgarians (5%) are the least likely to be correct. There have been some interesting changes in the levels of awareness since In Hungary the proportion of respondents giving an accurate answer has increased from 3% in 2007 to 27% in 2009 (+24 percentage points), and in Poland a similar rise is seen from 2% to 24% (+22 percentage points). In Slovenia we see the greatest fall in accurate answers given, from 35% in 2007 to 18% in 2009 (-17 percentage points). In Germany the percentage of accurate answers also fell from 26% to 14% (-12 percentage points)
31 QC2 What was the official inflation rate, the rate of which consumer prices increased or decreased, in (OUR COUNTRY) in 2008? I can tell you that the exact figure is between -5% and 20%. -Correct answers* EU27 30% 27% 25% 24% 23% 20% 15% 19% 18% 17 % 16% 15% 14 % 14% 13 % 13% 10% 5% 0% HU PL NL AT SI LV BE EL DE EE DK LT EU27 11% 11% 10% 10% 9% 9% 9% 8% 8% 7% 7% 6% CZ SE UK CY MT FI IE RO IT SK FR 5% 5% BG PT LU ES 4% 3% *Answers not differing more than 20% from the official growth rate
32 2.3 Unemployment rate - Europeans overstate the number of people out of work - The unemployment rate is the number of people unemployed as a percentage of the total labour force 12. When asked to state the unemployment rate in their country 13, Europeans tend to overstate the percentage of people out of work (estimating 11.1% against an actual figure of 7%). All the countries polled in the survey overestimate their national unemployment rate. A similar pattern of overestimation was seen in the previous March-April 2007 survey, when 25 of the 27 Member States polled thought the employment rate was higher than in reality. Although there is widespread overestimation of unemployment rates, there is considerable variation in levels of inaccuracy. Countries that most overstate their unemployment rates include Slovenia, Austria and Bulgaria. At the other end of the scale, respondents in Sweden, Slovakia, Luxembourg and Spain are closest to the actual figures. In March-April 2007, the Spaniards and Slovaks were also the more optimistic respondents, on that occasion underestimating the unemployment rates in their nations. A high proportion (35%) of Europeans are unable to form a view, but even higher levels of don't knows are seen in Romania (68%), Malta (60%), Cyprus (58%) and Portugal (55%). 12 Definition by Eurostat: The unemployment rate represents unemployed persons as a percentage of the labour force based on International Labour Office (ILO) definition. The labour force is the total number of people employed and unemployed. Unemployed persons comprise persons aged 15 to 74 who: - are without work during the reference week; - are available to start work within the next two weeks; - and have been actively seeking work in the past four weeks or had already found a job to start within the next three months. Data are presented in seasonally adjusted form
33 QC4 What was the official unemployment rate, the percentage of active people who do not have a job, in (OUR COUNTRY) in 2008? I can tell you that the exact figure is between 0% and 20%. Average estimated rate (%) Official rate 2008 (%)* Difference (estimated rate - official rate 2008) DK SI 11,9 4,4 7,5 33% AT 11,0 3,8 7,2 24% BG 12,7 5,6 7,1 51% IE 12,5 6,3 6,2 35% RO 12,0 5,8 6,2 68% HU 13,9 7,8 6,1 18% PT 13,2 7,7 5,5 55% CY 9,1 3,8 5,3 58% NL 8,0 2,8 5,2 18% IT 11,8 6,8 5,0 46% CZ 9,4 4,4 5,0 31% UK 10,4 5,6 4,8 47% PL 11,8 7,1 4,7 34% LT 10,3 5,8 4,5 44% EE 9,8 5,5 4,3 38% EU27 11,1 7,0 4,1 35% BE 11,1 7,0 4,1 16% MT 9,7 5,9 3,8 60% FI 9,7 6,4 3,3 20% FR 11,0 7,8 3,2 35% DK 6,4 3,3 3,1 21% LV 10,4 7,5 2,9 43% EL 10,6 7,7 2,9 25% DE 10,1 7,3 2,8 28% ES 14,0 11,3 2,7 27% LU 7,6 4,9 2,7 35% SK 12,0 9,5 2,5 29% SE 8,4 6,2 2,2 14% *Source : Eurostat 13 QC4 What was the official unemployment rate, the percentage of active people who do not have a job, in (OUR COUNTRY) in 2008? I can tell you that the exact figure is between 0% and 20%
34 - Significant changes in accuracy of unemployment rate estimations - In Sweden (36%) and Slovakia (28%) over a quarter of respondents make accurate estimates of the national unemployment rate. However, in Slovenia, Poland and Austria (all 2%) only a very few respondents know the correct figures. There have been some significant changes in awareness of the unemployment rates since the last time the question was asked in March-April This, of course, was when the economic climate was better and, perhaps, the ensuing crisis has done much to affect levels of awareness and concern. The most dramatic changes are seen in France, where correct estimations have fallen from 47% in 2007 to 21% in 2009 (-26 percentage points) and also in Poland from 23% in 2007 to 2% in 2009 (-21 percentage points). On the other hand, in Latvia there has been a significant increase in the proportions of people giving a correct answer, up from 8% in 2007 to 21% in 2009 (+13%). It seems likely that the depth and severity of the crisis affecting the Latvian people has increased awareness of the unemployment rates
35 40% QC4 What was the official unemployment rate, the percentage of active people who do not have a job, in (OUR COUNTRY) in 2006? The exact figure is between 0% and 20%. -Correct answers* 35% 36% 30% 28% 25% 24% 20% 21% 21% 21% 19 % 17 % 15% 14% 13 % 13 % 10% 11% 11% 5% 0% SE SK LU DE FR LV FI ES MT EU27 HU DK EE LT IT 9% 8% 8% 8% 7% 7% *Answers not differing more than 20% from the official growth rate PT UK BE CZ 6% 6% 5% 4% 4% EL NL IE CY RO BG 3% 2% 2% 2% AT PL SI - Socio-demographic status correlates strongly with knowledge - A socio-demographic analysis of understanding reveals very interesting patterns. For national growth, inflation and unemployment rates certain groups are more likely to give a correct answer. Specifically, men, the more highly-educated, managers and white-collar workers are consistently more likely to give a correct answer. While it may be possible that their occupation and study has increased their familiarity with the economic indicators and their meaning, it is also the case that these groups are more willing to give an answer thereby increasing the chance they will be correct. In addition to these groups, we note that those with an Internet connection at home and people who have little difficulty in paying their household bills are more likely to
36 give an accurate answer in response to questions about national rates of growth, inflation and unemployment. Knowledge of the national growth rate, inflation rate and unemployment rate Percentage of correct answers* for QC1, QC2 and QC4 QC1T National Growth rate in 2008 (SPLIT A + SPLIT B) QC2 National Inflation rate in 2008 QC4 National Unemployment rate in 2008 EU27 5% 11% 13% Sex Male 6% 13% 16% Female 4% 10% 9% Age % 10% 9% % 12% 12% % 12% 14% % 11% 14% Education (End of) 15-2% 7% 10% % 12% 11% 20+ 7% 15% 18% Still studying 5% 9% 11% Respondent occupation scale Self- employed 6% 13% 16% Managers 8% 16% 22% Other white collars 6% 13% 13% Manual workers 4% 11% 11% House persons 3% 7% 9% Unemployed 5% 10% 7% Retired 4% 11% 13% Students 5% 9% 11% Internet connection at home Yes 6% 13% 15% No 4% 9% 9% Difficulties paying bills Most of the time 3% 7% 7% From time to time 4% 10% 10% Almost never 6% 12% 15% Self-positioning on the social staircase Low (1-4) 4% 11% 9% Medium (5-6) 4% 10% 13% High (7-10) 6% 14% 15% *Answers not differing more than 20% from the official growth rate
37 - Overall levels of accuracy across Europe vary - As we have noted, awareness of economic indicators varies across Europe, but many struggle to give any accurate response. Romania (89%), Portugal (87%) and Ireland (86%) top the list of countries that give no correct answer when asked to estimate national growth, inflation and unemployment rates. Achieving one correct answer is difficult for respondents from most countries; Sweden leads with 37% of respondents managing to do so. Romania (10%) and Portugal (11%) are the countries least likely to provide a minimum of one accurate answer. A very small proportion of respondents (1%) in only 4 countries (Slovakia, the Netherlands, Germany and Malta) manage to give a total of 3 correct answers to these questions


38 - 34 -
39 3. THE IMPORTANCE OF STATISTICAL FIGURES Having looked at Europeans understanding of economic indicators, we now turn to the importance they attach to the statistics and the trust they place in the numbers. 3.1 Perceived necessity of knowing economic statistics - Despite inaccuracies in their estimates, most Europeans think it is important to know economic indicators - When asked if it is necessary to know the economic figures for inflation, growth and employment rates 14, most Europeans (71%) agree. Just 20% disagree and a further 9% are not able to form an opinion. Approximately one-fifth (21%) of Europeans "totally agree" that it is necessary to know the figures, and half (50%) "tend to agree". Just 5% "totally disagree", and 15% "tend to disagree". Since the question was last asked in March-April 2007, when the global economic climate was considerably better, the agreement percentages have increased slightly from 69% to 71%. QC7 Do you agree or disagree with the following statement concerning economic figures like the ones just discussed: It is necessary to know these figures. - % EU Totally agree Tend to agree Tend to disagree Totally disagree DK EB 72.1 Aug.-Sep % 50% 15% 5% 9% EB 67.2 Mar.-Apr % 48% 17% 5% 9% 0% 100%
.")


40 Cypriots are most inclined to agree that it is necessary to be familiar with these indicators (95% agree). Within this group, 68% totally agree. Compared to other European countries, the strength of their opinion is striking. 14 QC7 Do you agree or disagree with the following statement concerning economic figures like the ones just discussed: It is necessary to know these figures
41 Luxembourg (84%), France (82%), Romania (81%), Latvia (80%) and Finland (79%) top the list of countries that feel it is important to know the figures. Slovenia (60%), Germany (61%), Bulgaria (65%), Austria (65%), Poland (66%) and the Netherlands (66%) are least likely to think this necessary. Since the question was last posed in March-April 2007, respondents from the Netherlands (+19 percentage points), Lithuania (+16 points), Latvia (+15 points), Bulgaria (+13 points), Denmark (+12 points) and Czech Republic (+10 points) registered the greatest increase in agreement
 than women (69%) to think it necessary to know economic indicators.")
42 Just 3 countries have seen increases in disagreement scores since March-April 2007: France (+4 percentage points), Hungary (+4 points) and the UK (+2 points). A socio-demographic analysis shows that men are more inclined (74%) than women (69%) to think it necessary to know economic indicators. Although there is little variation among age groups, we see educational achievement impacts responses; those who stayed in education longest (after age 20) are most likely to think it is important to know the economic figures, although this is also the majority view among the lesser-educated (64%). Managers (79%), self-employed (75%), other white-collar workers (75%) and students (75%) are also likely to concede it is necessary to know economic figures. The unemployed (66%) and retired (66%) are less likely to agree
43 QC7 Do you agree or disagree with the following statement concerning economic figures like the ones just discussed: It is necessary to know these figures. Total Agree Total Disagree DK EU27 71% 20% 9% Sex Male 74% 19% 7% Female 69% 20% 11% Age % 18% 9% % 19% 8% % 20% 7% % 20% 12% Education (End of) 15-64% 22% 14% % 21% 9% % 18% 4% Still studying 75% 17% 8% Respondent occupation scale Self- employed 75% 16% 9% Managers 79% 18% 3% Other white collars 75% 19% 6% Manual workers 71% 21% 8% House persons 68% 18% 14% Unemployed 66% 23% 11% Retired 66% 22% 12% Students 75% 17% 8%
44 3.2 Political role of statistics - Europeans believe political decision are based on economic indicators - The majority of Europeans appear to be convinced of the importance of economic indicators; 61% of them believe that political decisions are made on the basis of that information 15. Among them, 16% agree "certainly" and 45% agree "probably". Just 27% disagree, and a further 12% have not formed a view. Since the last time this question was posed in March-April 2007, there has been little change in the results. Agreement levels have fallen just 1% from 62% to 61% in the period elapsed. This is perhaps surprising given the impact of the crisis since that date. QC5 Some people say that statistical information play an important role in business, public and political decision making. Personally, do you think that, in (OUR COUNTRY), political decisions are made on the basis of statistical information? - % EU Yes, certainly Yes, probably No, probably not No, certainly not DK EB 72.1 Aug.-Sep % 45% 19% 8% 12% EB 67.2 Mar.-Apr % 46% 20% 6% 12% 0% 100% Agreement is strongest in Denmark (84%), followed by the Netherlands (79%), Sweden (77%), Luxembourg (72%) and Belgium (70%). At the other end of the scale, Latvians (38%), Bulgarians (46%), Hungarians (49%) and Maltese (50%) are least inclined to agree. However it should be noted that there high levels of "don t know" 15 QC5 Some people say that statistical information play an important role in business, public and political decision making. Personally, do you think that, in (OUR COUNTRY), political decisions are made on the basis of statistical information?
 and Ireland (21%) - and this tends to affect the results.")


45 answers in Bulgaria (25%) - as there are in Portugal (24%), Romania (22%) and Ireland (21%) - and this tends to affect the results. There have been few dramatic changes in opinion since the previous survey in March- April 2007; however, the changes in Malta and Latvia stand out. Here agreement that political decisions are made on statistical information has fallen 13 percentage points and 11 points respectively

46 The socio-demographic profile of the respondents impacts their answers: men are more likely (64%) than women (58%) to agree political decisions are made on the basis of statistical information in their country. We also see some variation between those who were educated longer (69%) and those who left education earlier (58%), however those who left education sooner are more likely to say they 'don't know', which appears to account for the differences. Managers (71%) are more likely to agree than those who stay at home (56%), the retired (57%) and unemployed (58%)
47 QC5 Some people say that statistical information play an important role in business, public and political decision making. Personally, do you think that, in (OUR COUNTRY), political decisions are made on the basis of statistical information? Total Yes Total No DK EU27 61% 27% 12% Sex Male 64% 26% 10% Female 58% 27% 15% Age % 25% 12% % 28% 11% % 28% 9% % 26% 16% Education (End of) 15-53% 27% 20% % 29% 11% % 25% 6% Still studying 64% 25% 11% Respondent occupation scale Self- employed 61% 29% 10% Managers 71% 24% 5% Other white collars 65% 27% 8% Manual workers 61% 28% 11% House persons 56% 26% 18% Unemployed 58% 28% 14% Retired 57% 27% 16% Students 64% 25% 11%
48 3.3 Trust in official statistics - Europeans' trust in economic indicators is not assured - While Europeans appear persuaded of the importance of economic indicators and believe they influence political decision-making, opinions on the trustworthiness of figures are less clear-cut. Europeans' opinions on the trustworthiness of the official statistics are split 16 ; 46% of Europeans "tend not to trust them", while an almost equal proportion, 44%, "tend to trust them". Some 10% are unable to form an opinion on this subject. This represents a small evolution since March-April 2007, when 45% tended not to trust the statistics, and 46% tended to trust them, representing then the majority view. Even though this evolution is minor, the majority has now been inverted. QC6 Personally, how much trust do you have in the official statistics in (OUR COUNTRY), for example the statistics on unemployment, inflation or economic growth? Would you say that you tend to trust these official statistics or tend not to trust them? - % EU Tend to trust Tend not to trust DK EB 72.1 Aug.-Sep % 46% 10% EB 67.2 Mar.-Apr % 45% 9% 0% 100% 16 QC6 Personally, how much trust do you have in the official statistics in (OUR COUNTRY), for example the statistics on unemployment, inflation or economic growth? Would you say that you tend to trust these official statistics or tend not to trust them?
, Luxembourg (68%) and Finland (67%).")


49 Levels of trust are highest in Denmark and Sweden (both 70%), closely followed by the Netherlands (69%), Luxembourg (68%) and Finland (67%). At the other end of the scale, the UK (33%), Germany (36%) and Hungary (37%) express the lowest levels of trust in the official statistics. Since the survey was last conducted in March-April 2007, levels of trust in official statistics have risen in 11 countries, fallen in 13 countries and remained stable in 3 countries. Among those countries where trust has increased, Sweden (+9 percentage points), Bulgaria (+8 points) and Slovakia (+7 points) stand out for their intensity of

50 opinion. The greatest falls in trust are seen in Malta (-10 percentage points), Estonia (-9 points) and the Netherlands (-8 points). A socio-demographic analysis reveals that respondents' age, educational level and occupational status has a bearing on their view of official statistics. Younger respondents are more inclined to trust statistics (51%) than their older counterparts (40%). Those who left education later (51%) have greater trust in the statistics than those who left education earlier (37%). We also see that other white collars (51%) tend to have a higher level of trust than the unemployed (38%) or the retired (39%). Self-positioning on the social ladder also correlates with levels of trust; those who place themselves lower tend to have less trust (35%) than those who consider themselves higher up on the scale (54%)
51 QC6 Personally, how much trust do you have in the official statistics in (OUR COUNTRY), for example the statistics on unemployment, inflation or economic growth? Would you say that you tend to trust these official statistics or tend not to trust them? Tend to trust Tend not to trust EU27 44% 46% 10% Sex Male 45% 46% 9% Female 43% 46% 11% Age % 39% 10% % 44% 9% % 49% 9% % 48% 12% Education (End of) 15-37% 48% 15% % 49% 9% % 44% 5% Still studying 54% 36% 10% Respondent occupation scale Self- employed 44% 46% 10% Managers 46% 49% 5% Other white collars 51% 41% 8% Manual workers 43% 49% 8% House persons 42% 43% 15% Unemployed 38% 52% 10% Retired 39% 48% 13% Students 54% 36% 10% Self-positioning on the social staircase Low (1-4) 35% 51% 14% Medium (5-6) 43% 47% 10% High (7-10) 54% 40% 6% DK
52
53 CONCLUSION The purpose of this study was to gauge citizens' opinion on the general economic climate, the levels of understanding of the economic growth rate, inflation rate and unemployment rate, as well as the importance that Europeans give to these figures. When considering the responses to this survey, it is essential to bear in mind the enormous impact of the global economic and financial crisis that occurred in Given the strength of the crisis, it is perhaps surprising the results do not differ more from the previous survey. However, the depth of the crisis is certainly reflected in the pessimistic responses given to questions on their national economy and unemployment, relative to the European average. Throughout the results it is clear that men, the highly educated, and people in managerial roles more likely to estimate figures correctly. However it is important to note that they are also more likely to attempt an answer and, therefore, have a greater chance to get it right. Overall a mixed picture emerges in that Europeans are, on average, unaware of the economic growth rates, inflation rates and unemployment rates in their countries. However, when asked the majority say that knowing these figures is necessary, and that they are important to political decision-making in their country
54
55 ANNEXES
56
57 TECHNICAL SPECIFICATIONS
58
59 TECHNICAL SPECIFICATIONS Between the 28th of August and the 17th of September 2009, TNS Opinion & Social, a consortium created between TNS plc and TNS opinion, carried out wave 72.1 of the EUROBAROMETER, on request of the EUROPEAN COMMISSION, Directorate-General for Communication, Research and Political Analysis. The EUROBAROMETER 72.1 covers the population of the respective nationalities of the European Union Member States, resident in each of the Member States and aged 15 years and over. The basic sample design applied in all states is a multi-stage, random (probability) one. In each country, a number of sampling points was drawn with probability proportional to population size (for a total coverage of the country) and to population density. In order to do so, the sampling points were drawn systematically from each of the "administrative regional units", after stratification by individual unit and type of area. They thus represent the whole territory of the countries surveyed according to the EUROSTAT NUTS II (or equivalent) and according to the distribution of the resident population of the respective nationalities in terms of metropolitan, urban and rural areas. In each of the selected sampling points, a starting address was drawn, at random. Further addresses (every Nth address) were selected by standard "random route" procedures, from the initial address. In each household, the respondent was drawn, at random (following the "closest birthday rule"). All interviews were conducted face-to-face in people's homes and in the appropriate national language. As far as the data capture is concerned, CAPI (Computer Assisted Personal Interview) was used in those countries where this technique was available
60 ABBREVIATIONS COUNTRIES INSTITUTES N INTERVIEWS FIELDWORK DATES POPULATION 15+ BE Belgium TNS Dimarso /08/ /09/ BG Bulgaria TNS BBSS /08/ /09/ CZ Czech Rep. TNS Aisa /08/ /09/ DK Denmark TNS Gallup DK /08/ /09/ DE Germany TNS Infratest /08/ /09/ EE Estonia Emor 1 28/08/ /09/ IE Ireland TNS MRBI /08/ /09/ EL Greece TNS ICAP 1 28/08/ /09/ ES Spain TNS Demoscopia /09/ /09/ FR France TNS Sofres /08/ /09/ IT Italy TNS Infratest /08/ /09/ CY Rep. of Cyprus Synovate /08/ /09/ LV Latvia TNS Latvia /08/ /09/ LT Lithuania TNS Gallup Lithuania /08/ /09/ LU Luxembourg TNS ILReS /08/ /09/ HU Hungary TNS Hungary 1 28/08/ /09/ MT Malta MISCO /08/ /09/ NL Netherlands TNS NIPO /08/ /09/ Österreichisches Gallup- AT Austria Institut /08/ /09/ PL Poland TNS OBOP 1 29/08/ /09/ PT Portugal TNS EUROTESTE /09/ /09/ RO Romania TNS CSOP /08/ /09/ SI Slovenia RM PLUS /08/ /09/ SK Slovakia TNS AISA SK /08/ /09/ FI Finland TNS Gallup Oy /08/ /09/ SE Sweden TNS GALLUP /08/ /09/ UK United Kingdom TNS UK /08/ /09/ TOTAL /08/ /09/
61 For each country a comparison between the sample and the universe was carried out. The Universe description was derived from Eurostat population data or from national statistics offices. For all countries surveyed, a national weighting procedure, using marginal and intercellular weighting, was carried out based on this Universe description. In all countries, gender, age, region and size of locality were introduced in the iteration procedure. For international weighting (i.e. EU averages), TNS Opinion & Social applies the official population figures as provided by EUROSTAT or national statistic offices. The total population figures for input in this post-weighting procedure are listed above. Readers are reminded that survey results are estimations, the accuracy of which, everything being equal, rests upon the sample size and upon the observed percentage. With samples of about 1,000 interviews, the real percentages vary within the following confidence limits: Observed percentages 10% or 90% 20% or 80% 30% or 70% 40% or 60% 50% Confidence limits ± 1.9 points ± 2.5 points ± 2.7 points ± 3.0 points ± 3.1 points
62
63 QUESTIONNAIRE
64
65 Now let's talk about another topic. Passons maintenant à un autre sujet. ASK QC1a TO SPLIT A OTHERS GO TO QC1b POSER QC1a AU SPLIT A LES AUTRES ALLER EN QC1b QC1a What was the official growth rate of the economy (measured in terms of Gross Domestic Product) in (OUR COUNTRY) in 2008? I can tell you that this figure is between -5% and +5%. (M) QC1a Quel était le taux officiel de la croissance économique (mesuré en termes de Produit Intérieur Brut) en (NOTRE PAYS) en 2008? Je peux vous dire qu il se situe entre -5% et +5%. (M) (WRITE DOWN ONE ANSWER ONLY) (IF "DK", PLEASE CODE '99999') (NOTER UNE SEULE REPONSE) (SI "NSP", CODER '99999') EB67.2 QA50a TREND MODIFIED EB67.2 QA50a TREND MODIFIED ASK QC1b TO SPLIT B OTHERS GO TO QC2 POSER QC1b AU SPLIT B LES AUTRES ALLER EN QC2 QC1b In 2007, the official growth rate (measured in terms of Gross Domestic product) in (OUR COUNTRY) was [INSERT THE EXACT RATE OF YOUR COUNTRY]%. What was the official growth rate of the economy in (OUR COUNTRY) in 2008? I can tell you that this figure is between -5% and +5%. (M) QC1b En 2007, le taux officiel de la croissance (mesuré en termes de Produit Intérieur Brut) en (NOTRE PAYS) était de [INSERER LE TAUX EXACT DE VOTRE PAYS]%. Quel était le taux officiel de croissance de l économie en (NOTRE PAYS) en 2008? Je peux vous dire qu il se situait entre -5% et +5%. (M) (WRITE DOWN ONE ANSWER ONLY) (IF "DK", PLEASE CODE '99999') (NOTER UNE SEULE REPONSE) (SI "NSP", CODER '99999') EB67.2 QA50b TREND MODIFIED EB67.2 QA50b TREND MODIFIED TO ALL A TOUS QC2 What was the official inflation rate, the rate of which consumer prices increased or QC2 Quel était le taux officiel de l inflation, c est-à-dire le taux qui mesure l augmentation ou la decreased, in (OUR COUNTRY) in 2008? I can tell you that the exact figure is between -5% diminution des prix à la consommation en (NOTRE PAYS) en 2008? Je peux vous dire qu il and 10%. (M) se situe entre -5% et 10%. (M) (WRITE DOWN ONE ANSWER ONLY) (IF "DK", PLEASE CODE '99999') (NOTER UNE SEULE REPONSE) (SI "NSP", CODER '99999') EB67.2 QA52 TREND MODIFIED EB67.2 QA52 TREND MODIFIED MasterIN721_final 49/58 07/08/2009
66 QC3 Do you think that, in (OUR COUNTRY), the inflation rate in 2008 was higher, lower or equal to the one in 2007? (M) QC3 Pensez-vous qu en (NOTRE PAYS), le taux d inflation de 2008 était supérieur, inférieur ou égal à celui de 2007? (M) Higher Lower Equal DK EB67.2 QA53 TREND MODIFIED 1 Supérieur 1 2 Inférieur 2 3 Egal 3 4 NSP 4 EB67.2 QA53 TREND MODIFIED QC4 What was the official unemployment rate, the percentage of active people who do not have a job, in (OUR COUNTRY) in 2008? I can tell you that the exact figure is between 0% and 20%. (M) QC4 Quel était le taux officiel du chômage, c est-à-dire le pourcentage de la population active qui n a pas d emploi, en (NOTRE PAYS) en 2008? Je peux vous dire que ce taux se situe entre 0% et 20%. (M) (WRITE DOWN ONE ANSWER ONLY) (IF "DK", PLEASE CODE ) (NOTER UNE SEULE REPONSE) (SI "NSP", CODER '99999') EB67.2 QA54 TREND MODIFIED EB67.2 QA54 TREND MODIFIED QC5 Some people say that statistical information play an important role in business, public and political decision making. Personally, do you think that, in (OUR COUNTRY), political decisions are made on the basis of statistical information? QC5 Certaines personnes affirment que les informations statistiques jouent un rôle important dans le monde des affaires et dans les prises de décisions publiques et politiques. Personnellement, pensez-vous qu en (NOTRE PAYS), les décisions politiques sont prises sur base d informations statistiques? (READ OUT ONE ANSWER ONLY) (LIRE UNE SEULE REPONSE) Yes, certainly Yes, probably No, probably not No, certainly not DK EB67.2 QA57 1 Oui, certainement 1 2 Oui, probablement 2 3 Non, probablement pas 3 4 Non, certainement pas 4 5 NSP 5 EB67.2 QA57 MasterIN721_final 50/58 07/08/2009
67 QC6 Personally, how much trust do you have in the official statistics in (OUR COUNTRY), for example the statistics on unemployment, inflation or economic growth? Would you say that you tend to trust these official statistics or tend not to trust them? QC6 Personnellement, dans quelle mesure faites-vous confiance aux statistiques officielles en (NOTRE PAYS), par exemple les statistiques sur le chômage, l inflation ou la croissance économique? Diriez-vous que vous avez plutôt confiance ou plutôt pas confiance en ces statistiques officielles? (READ OUT ONE ANSWER ONLY) (LIRE UNE SEULE REPONSE) Tend to trust Tend not to trust DK EB67.2 QA58 1 Plutôt confiance 1 2 Plutôt pas confiance 2 3 NSP 3 EB67.2 QA58 QC7 Do you agree or disagree with the following statement concerning economic figures like the ones just discussed: "It is necessary to know these figures"? QC7 Etes-vous d accord ou pas avec la proposition suivante à propos des statistiques dont nous venons de parler : "Il est nécessaire de connaître ces chiffres". (READ OUT ONE ANSWER ONLY) (LIRE UNE SEULE REPONSE) Totally agree Tend to agree Tend to disagree Totally disagree DK EB67.2 QA56 1 Tout à fait d accord 1 2 Plutôt d accord 2 3 Plutôt pas d accord 3 4 Pas du tout d accord 4 5 NSP 5 EB67.2 QA56 QC8 For each of the following domains, would you say that the situation in (OUR COUNTRY) is better or less good than the average of the European Union countries? QC8 Pour chacun des domaines suivants, diriez-vous que la situation en (NOTRE PAYS) est meilleure ou moins bonne que celle de la moyenne des pays européens? (SHOW CARD WITH SCALE ONE ANSWER PER LINE) (MONTRER CARTE AVEC ECHELLE UNE REPONSE PAR LIGNE) Much better Somewhat better Somewhat less good Definitely less good DK Vraiment meilleure Un peu meilleure Un peu moins bonne Vraiment moins bonne NSP 1 The employment situation in La situation de l emploi en (OUR COUNTRY) (NOTRE PAYS) 2 The situation of the La situation de l économie (NATIONALITY) economy (NATIONALITE) EB70.1 QA7a TREND MODIFIED EB70.1 QA7a TREND MODIFIED MasterIN721_final 51/58 07/08/2009
68
69 TABLES
70
71
72
73
74

75
76
77
78

79
80
81
82
83
84

85

86
87
Flash Eurobarometer N o 189a EU communication and the citizens. Analytical Report. Fieldwork: April 2008 Report: May 2008
 Gallup Flash Eurobarometer N o 189a EU communication and the citizens Flash Eurobarometer European Commission Expectations of European citizens regarding the social reality in 20 years time Analytical
PUBLIC PERCEPTIONS OF VAT
 Special Eurobarometer 424 PUBLIC PERCEPTIONS OF VAT REPORT Fieldwork: October 2014 Publication: March 2015 This survey has been requested by the European Commission, Directorate-General for Taxations and
Special Eurobarometer 418 SOCIAL CLIMATE REPORT
 Special Eurobarometer 418 SOCIAL CLIMATE REPORT Fieldwork: June 2014 Publication: November 2014 This survey has been requested by the European Commission, Directorate-General for Employment, Social Affairs
Fieldwork February March 2008 Publication June 2008
 Special Eurobarometer 297 European Commission Attitudes towards radioactive waste Fieldwork February March 2008 Publication June 2008 Report Special Eurobarometer 297 / Wave 69.1 TNS Opinion & Social This
October 2010 Euro area unemployment rate at 10.1% EU27 at 9.6%
 STAT//180 30 November 20 October 20 Euro area unemployment rate at.1% EU27 at 9.6% The euro area 1 (EA16) seasonally-adjusted 2 unemployment rate 3 was.1% in October 20, compared with.0% in September 4.
Standard Eurobarometer
 Standard Eurobarometer 67 / Spring 2007 Standard Eurobarometer European Commission SPECIAL EUROBAROMETER EUROPEANS KNOWELEDGE ON ECONOMICAL INDICATORS 1 1 This preliminary analysis is done by Antonis PAPACOSTAS
Flash Eurobarometer 470. Report. Work-life balance
 Work-life balance Survey requested by the European Commission, Directorate-General for Justice and Consumers and co-ordinated by the Directorate-General for Communication This document does not represent
Flash Eurobarometer 398 WORKING CONDITIONS REPORT
 Flash Eurobarometer WORKING CONDITIONS REPORT Fieldwork: April 2014 Publication: April 2014 This survey has been requested by the European Commission, Directorate-General for Employment, Social Affairs
Europeans attitudes towards the issue of sustainable consumption and production. Analytical report
 Flash Eurobarometer 256 The Gallup Organisation Analytical Report Flash EB N o 251 Public attitudes and perceptions in the euro area Flash Eurobarometer European Commission Europeans attitudes towards
January 2010 Euro area unemployment rate at 9.9% EU27 at 9.5%
 STAT//29 1 March 20 January 20 Euro area unemployment rate at 9.9% EU27 at 9.5% The euro area 1 (EA16) seasonally-adjusted 2 unemployment rate 3 was 9.9% in January 20, the same as in December 2009 4.
Social climate. Fieldwork May-June 2009 Publication January 2010
 Special Eurobarometer European Commission Social climate Full report Fieldwork May-June 2009 Publication January 2010 Special Eurobarometer 315 / Wave - European Opinion Research Group EEIG This survey
SOLIDARITY THAT SPANS THE GLOBE: EUROPEANS AND DEVELOPMENT AID
 Special Eurobarometer 392 SOLIDARITY THAT SPANS THE GLOBE: EUROPEANS AND DEVELOPMENT AID REPORT Fieldwork: June 2012 Publication: October 2012 This survey has been requested by Directorate-General Development
Flash Eurobarometer 408 EUROPEAN YOUTH REPORT
 Flash Eurobarometer EUROPEAN YOUTH REPORT Fieldwork: December 2014 Publication: April 2015 This survey has been requested by the European Commission, Directorate-General for Education and Culture and co-ordinated
Employment and Social Policy
 Special Eurobarometer 377 European Commission Employment and Social Policy REPORT Special Eurobarometer 377 / Wave TNS opinion & social Fieldwork: September October 2011 Publication: December 2011 This
Fieldwork November - December 2009 Publication June 2010
 Special Eurobarometer 337 European Commission Geographical and labour market mobility Report Fieldwork November - December 2009 Publication June 2010 Special Eurobarometer 337 / Wave TNS Opinion & Social
Europeans and the Common Agricultural Policy
 Special Eurobarometer European Commission Europeans and the Common Agricultural Policy Fieldwork October - November 2005 Publication January 2006 Special Eurobarometer 242 / Wave 64.2 - TNS Opinion & Social
Special Eurobarometer 459. Report. Climate change
 Climate change Survey requested by the European Commission, Directorate-General for Climate Action and co-ordinated by the Directorate- General for Communication This document does not represent the point
Europeans attitudes towards climate change. Report. Special Eurobarometer 300. Fieldwork March April 2008 Publication September 2008
 Special Eurobarometer 300 EUROPEAN PARLIAMENT European Commission Europeans attitudes towards climate change Fieldwork March April 2008 Publication September 2008 Report Special Eurobarometer 300 / Wave
Flash Eurobarometer 458. Report. The euro area
 The euro area Survey requested by the European Commission, Directorate-General for Economic and Financial Affairs and co-ordinated by the Directorate-General for Communication This document does not represent
Gender pension gap economic perspective
 Gender pension gap economic perspective Agnieszka Chłoń-Domińczak Institute of Statistics and Demography SGH Part of this research was supported by European Commission 7th Framework Programme project "Employment
Social Protection and Social Inclusion in Europe Key facts and figures
 MEMO/08/625 Brussels, 16 October 2008 Social Protection and Social Inclusion in Europe Key facts and figures What is the report and what are the main highlights? The European Commission today published
EUROBAROMETER 71. Fieldwork: June - July 2009 Publication: January 2010
 EUROBAROMETER 66 Standard Eurobarometer Report European Commission EUROBAROMETER 71 Future of Europe Fieldwork: June - July 2009 Publication: January 2010 Standard Eurobarometer 71/ Spring 2009 - TNS Opinion
Two years to go to the 2014 European elections European Parliament Eurobarometer (EB/EP 77.4)
") Directorate-General for Communication PUBLIC OPINION MONITORING UNIT Brussels, 23 October 2012. Two years to go to the 2014 European elections European Parliament Eurobarometer (EB/EP 77.4) FOCUS ON THE
Directorate-General for Communication PUBLIC OPINION MONITORING UNIT Brussels, 23 October 2012. Two years to go to the 2014 European elections European Parliament Eurobarometer (EB/EP 77.4) FOCUS ON THE
Fieldwork February March 2008 Publication October 2008
 Special Eurobarometer 298 European Commission Consumer protection in the internal market Fieldwork February March 2008 Publication October 2008 Report Special Eurobarometer 298 / Wave 69.1 TNS Opinion
Eco-label Flower week 2006
 Special Eurobarometer European Commission Eco-label Flower week 2006 Fieldwork: November-December 2006 Publication: January 2007 Special Eurobarometer 275 / Wave 66.3 TNS Opinion & Social This survey was
Flash Eurobarometer 386 THE EURO AREA REPORT
 Eurobarometer THE EURO AREA REPORT Fieldwork: October 2013 Publication: November 2013 This survey has been requested by the European Commission, Directorate-General for Economic and Financial Affairs and
Flash Eurobarometer 458. The euro area
 The euro area Survey requested by the European Commission, Directorate-General for Economic and Financial Affairs and co-ordinated by the Directorate-General for Communication This document does not represent
Fieldwork: October 2006 Report: December 2006
 Flash Eurobarometer European Commission Business attitudes towards cross-border sales and consumer protection Summary Fieldwork: October 2006 Report: December 2006 Flash Eurobarometer 186 The Gallup Organization
Taxation trends in the European Union EU27 tax ratio at 39.8% of GDP in 2007 Steady decline in top personal and corporate income tax rates since 2000
 DG TAXUD STAT/09/92 22 June 2009 Taxation trends in the European Union EU27 tax ratio at 39.8% of GDP in 2007 Steady decline in top personal and corporate income tax rates since 2000 The overall tax-to-gdp
The 2009 European elections
 Special Eurobarometer 299 EUROPEAN PARLIAMENT European Commission The 2009 European elections Fieldwork: March May 2008 Publication: September 2008 Report Special Eurobarometer 299/ Wave 69.2 TNS opinion
0pinions on organised, cross-border crime and corruption
 Special Eurobarometer European Commission 0pinions on organised, cross-border crime and corruption Fieldwork: November - December 2005 Publication: March 2006 Special Eurobarometer 245 / Wave 64.3 TNS
Development Aid in times of economic turmoil
 Special Eurobarometer European Commission Development Aid in times of economic turmoil Fieldwork: May 2009 June 2009 Publication: October 2009 Special Eurobarometer 318 / Wave 71.2 TNS Opinion & Social
Flash Eurobarometer 441. Report. European SMEs and the Circular Economy
 European SMEs and the Circular Economy Survey requested by the European Commission, Directorate-General Environment and co-ordinated by the Directorate-General for Communication This document does not
Humanitarian Aid. Fieldwork June July 2006 Publication October 2006
 Special Eurobarometer European Commission Humanitarian Aid Fieldwork June July 2006 Publication October 2006 Special Eurobarometer 268 / Wave 65.4 TNS Opinion & Social This survey was requested by Directorate
Pan-European opinion poll on occupational safety and health
 REPORT Pan-European opinion poll on occupational safety and health Results across 36 European countries Final report Conducted by Ipsos MORI Social Research Institute at the request of the European Agency
Parlemeter - November 2012 European Parliament Eurobarometer (EB/EP 78.2)
") Directorate-General for Communication Public Opinion Monitoring Unit Parlemeter - November European Parliament Eurobarometer (EB/EP 78.2) ANALYTICAL SYNTHESIS Brussels, 14 February 2013. Coverage: Population:
Directorate-General for Communication Public Opinion Monitoring Unit Parlemeter - November European Parliament Eurobarometer (EB/EP 78.2) ANALYTICAL SYNTHESIS Brussels, 14 February 2013. Coverage: Population:
Safer Internet. Fieldwork Dec Jan 2006 Publication May 2006
 Special Eurobarometer European Commission Safer Internet Fieldwork Dec 2005 - Jan 2006 Publication May 2006 Special Eurobarometer 250 / Wave 64.4 TNS Opinion & Social This survey was requested by Directorate
Trust, Statistics & Knowledge Evidence from the EC Special Eurobarometer survey 2009
 Charting Progress, Building Visions, Improving Life Busan, Korea - 27 October 2009 Trust, Statistics & Knowledge Evidence from the EC Special Eurobarometer survey 2009 Marco Mira d Ercole (OECD), A. Papacostas(Eurobarometer)
PROGRESS TOWARDS THE LISBON OBJECTIVES 2010 IN EDUCATION AND TRAINING
 PROGRESS TOWARDS THE LISBON OBJECTIVES IN EDUCATION AND TRAINING In 7, reaching the benchmarks for continues to pose a serious challenge for education and training systems in Europe, except for the goal
Vocational Training. Fieldwork October-November 2004 Publication August 2005
 Special Eurobarometer European Commission Vocational Training Fieldwork October-November 2004 Publication August 2005 Special Eurobarometer 216 / Wave 62..1 TNS Opinion & Social This survey was requested
August 2008 Euro area external trade deficit 9.3 bn euro 27.2 bn euro deficit for EU27
 STAT/08/143 17 October 2008 August 2008 Euro area external trade deficit 9.3 27.2 deficit for EU27 The first estimate for the euro area 1 (EA15) trade balance with the rest of the world in August 2008
Growth, competitiveness and jobs: priorities for the European Semester 2013 Presentation of J.M. Barroso,
 Growth, competitiveness and jobs: priorities for the European Semester 213 Presentation of J.M. Barroso, President of the European Commission, to the European Council of 14-1 March 213 Economic recovery
Active Ageing. Fieldwork: September November Publication: January 2012
 Special Eurobarometer 378 Active Ageing SUMMARY Special Eurobarometer 378 / Wave EB76.2 TNS opinion & social Fieldwork: September November 2011 Publication: January 2012 This survey has been requested
Standard Eurobarometer 83 Spring 2015 THE EU BUDGET REPORT
 Standard Eurobarometer 83 Spring 2015 THE EU BUDGET REPORT Fieldwork: May 2015 This survey has been requested and co-ordinated by the European Commission, Directorate-General for Communication. http://ec.europa.eu/public_opinion/index_en.htm
PROGRESS TOWARDS THE LISBON OBJECTIVES 2010 IN EDUCATION AND TRAINING
 PROGRESS TOWARDS THE LISBON OBJECTIVES IN EDUCATION AND TRAINING In, reaching the benchmarks for continues to pose a serious challenge for education and training systems in Europe, except for the goal
Special Eurobarometer 465. Gender Equality 2017
 Summary Gender Equality 01 Gender Pay Gap Survey requested by the European Commission, Directorate-General for Justice and Consumers and co-ordinated by the Directorate-General for Communication This document
May 2009 Euro area external trade surplus 1.9 bn euro 6.8 bn euro deficit for EU27
 STAT/09/106 17 July 2009 May 2009 Euro area external trade surplus 1.9 6.8 deficit for EU27 The first estimate for the euro area 1 (EA16) trade balance with the rest of the world in May 2009 gave a 1.9
Eurofound in-house paper: Part-time work in Europe Companies and workers perspective
 Eurofound in-house paper: Part-time work in Europe Companies and workers perspective Presented by: Eszter Sandor Research Officer, Surveys and Trends 26/03/2010 1 Objectives Examine the patterns of part-time
DATA SET ON INVESTMENT FUNDS (IVF) Naming Conventions
 Naming Conventions") DIRECTORATE GENERAL STATISTICS LAST UPDATE: 10 APRIL 2013 DIVISION MONETARY & FINANCIAL STATISTICS ECB-UNRESTRICTED DATA SET ON INVESTMENT FUNDS (IVF) Naming Conventions The series keys related to Investment
DIRECTORATE GENERAL STATISTICS LAST UPDATE: 10 APRIL 2013 DIVISION MONETARY & FINANCIAL STATISTICS ECB-UNRESTRICTED DATA SET ON INVESTMENT FUNDS (IVF) Naming Conventions The series keys related to Investment
January 2009 Euro area external trade deficit 10.5 bn euro 26.3 bn euro deficit for EU27
 STAT/09/40 23 March 2009 January 2009 Euro area external trade deficit 10.5 26.3 deficit for EU27 The first estimate for the euro area 1 (EA16) trade balance with the rest of the world in January 2009
Entrepreneurship in the EU and beyond. Analytical report
 Flash Eurobarometer The Gallup Organization Flash Eurobarometer European Commission Entrepreneurship in the EU and beyond A survey in the EU, EFTA countries, Croatia, Turkey, the US, Japan, South Korea
Securing sustainable and adequate social protection in the EU
 Securing sustainable and adequate social protection in the EU Session on Social Protection & Security IFA 12th Global Conference on Ageing 11 June 2014, HICC Hyderabad India Dr Lieve Fransen European Commission
Employment of older workers Research Note no. 5/2015
 Research Note no. 5/2015 E. Őzdemir, T. Ward M. Fuchs, S. Ilinca, O. Lelkes, R. Rodrigues, E. Zolyomi February - 2016 EUROPEAN COMMISSION Directorate-General for Employment, Social Affairs and Inclusion
NOTE ON EU27 CHILD POVERTY RATES
 NOTE ON EU7 CHILD POVERTY RATES Research note prepared for Child Poverty Action Group Authors: H. Xavier Jara and Chrysa Leventi Institute for Social and Economic Research (ISER) University of Essex The
Air Passengers Rights
 Special Eurobarometer European Commission Air Passengers Rights Report Fieldwork: May June 2009 Publication: December 2009 Special Eurobarometer 319 / Wave 71.2 TNS Opinion & Social This survey was requested
of the European Commission. Communication. This document of the authors. Standard Eurobarometer 75 / Spring 2011 TNS opinion & social
 Standard Eurobarometer European Commission EUROBAROMETER 75 SPRING 2011 Europeans and the European Union budget REPORT Standard Eurobarometer 75 / Spring 2011 TNS opinion & social Fieldwork: May 2011 Publication:
Transition from Work to Retirement in EU25
 EUROPEAN CENTRE EUROPÄISCHES ZENTRUM CENTRE EUROPÉEN 1 Asghar Zaidi is Director Research at the European Centre for Social Welfare Policy and Research, Vienna; Michael Fuchs is Researcher at the European
Attitudes of Europeans Towards Tourism REPORT
 Flash Eurobarometer Attitudes of Europeans Towards Tourism REPORT Fieldwork: January 22 Publication: March 22 This survey has been requested by the Directorate-General Enterprise and co-ordinated by Directorate-
I. EUROPEANS AND THE TAX ON FINANCIAL TRANSACTION (TFT)...10 IV. THE REACTIONS OF THE MEMBER STATES TO THE CRISIS...19
...10 IV. THE REACTIONS OF THE MEMBER STATES TO THE CRISIS...19") Directorate General for Communication Directorate C - Relations with Citizens PUBLIC OPINION MONITORING UNIT Brussels, 22 June 2011 EUROPEANS AND THE CRISIS European Parliament Eurobarometer ( Parlemeter
Directorate General for Communication Directorate C - Relations with Citizens PUBLIC OPINION MONITORING UNIT Brussels, 22 June 2011 EUROPEANS AND THE CRISIS European Parliament Eurobarometer ( Parlemeter
European Employment and Social Policy
 Special Eurobarometer European Commission European Employment and Social Policy Report Fieldwork : May 2009 June 2009 Publication: September 2009 Special Eurobarometer 316 / Wave 71.2 TNS Opinion & Social
Traffic Safety Basic Facts Main Figures. Traffic Safety Basic Facts Traffic Safety. Motorways Basic Facts 2015.
 Traffic Safety Basic Facts 2013 - Main Figures Traffic Safety Basic Facts 2015 Traffic Safety Motorways Basic Facts 2015 Motorways General Almost 30.000 people were killed in road accidents on motorways
New Europeans. Fieldwork : March 2010 April 2010 Publication: April 2011
 Special Eurobarometer European Commission New Europeans Report Fieldwork : March 2010 April 2010 Publication: April 2011 Special Eurobarometer 346 / Wave TNS Opinion & Social This survey was requested
Fiscal sustainability challenges in Romania
 Preliminary Draft For discussion only Fiscal sustainability challenges in Romania Bucharest, May 10, 2011 Ionut Dumitru Anca Paliu Agenda 1. Main fiscal sustainability challenges 2. Tax collection issues
Fieldwork November 2004 Publication February This survey was requested and coordinated by Directorate General Press and Communication
 Special Eurobarometer European Commission Lisbon Fieldwork November 2004 Publication February 2005 Special Eurobarometer 215 / Wave 62.1 - TNS Opinion & Social This survey was requested and coordinated
COMMISSION DECISION of 23 April 2012 on the second set of common safety targets as regards the rail system (notified under document C(2012) 2084)
 2084)") 27.4.2012 Official Journal of the European Union L 115/27 COMMISSION DECISION of 23 April 2012 on the second set of common safety targets as regards the rail system (notified under document C(2012) 2084)
27.4.2012 Official Journal of the European Union L 115/27 COMMISSION DECISION of 23 April 2012 on the second set of common safety targets as regards the rail system (notified under document C(2012) 2084)
Themes Income and wages in Europe Wages, productivity and the wage share Working poverty and minimum wage The gender pay gap
 5. W A G E D E V E L O P M E N T S At the ETUC Congress in Seville in 27, wage developments in Europe were among the most debated issues. One of the key problems highlighted in this respect was the need
Investment in France and the EU
 Investment in and the EU Natacha Valla March 2017 22/02/2017 1 Change relative to 2008Q1 % of GDP Slow recovery of investment, and with strong heterogeneity Overall Europe s recovery in investment is slow,
Aggregation of periods for unemployment benefits. Report on U1 Portable Documents for mobile workers Reference year 2016
 Aggregation of periods for unemployment benefits Report on U1 Portable Documents for mobile workers Reference year 2016 Frederic De Wispelaere & Jozef Pacolet - HIVA KU Leuven June 2017 EUROPEAN COMMISSION
Flash Eurobarometer N o 189a EU communication and the citizens. Analytical report. Fieldwork: February 2008 Publication: July 2008
 Gallup Flash Eurobarometer N o 189a EU communication and the citizens Flash Eurobarometer European Commission Business attitudes towards cross-border and consumer protection Analytical report Fieldwork:
Health and food. Fieldwork November December 2005 Publication November 2006
 Special Eurobarometer European Commission Health and food Fieldwork November December 2005 Publication November 2006 Special Eurobarometer 246 / Wave 64.3 TNS Opinion & Social This survey was requested
E-Communications Household Survey
 Special Eurobarometer 293 European Commission E-Communications Household Survey Fieldwork November December 2007 Publication June 2008 Report Special Eurobarometer 293 / Wave 68.2 TNS opinion & social
Introduction of the euro in the new member states
 EOS Gallup Europe Introduction of the euro in the new member states - Report p. 1 Introduction of the euro in the new member states Conducted by EOS Gallup Europe upon the request of the European Commission.
Investment in Ireland and the EU
 Investment in and the EU Debora Revoltella Director Economics Department Dublin April 10, 2017 20/04/2017 1 Real investment: IE v EU country groupings Real investment (2008 = 100) 180 160 140 120 100 80
COMMISSION STAFF WORKING DOCUMENT Accompanying the document. Report form the Commission to the Council and the European Parliament
 EUROPEAN COMMISSION Brussels, 4.5.2018 SWD(2018) 246 final PART 5/9 COMMISSION STAFF WORKING DOCUMENT Accompanying the document Report form the Commission to the Council and the European Parliament on
HOW RECESSION REFLECTS IN THE LABOUR MARKET INDICATORS
 REPUBLIC OF SLOVENIA HOW RECESSION REFLECTS IN THE LABOUR MARKET INDICATORS Matej Divjak, Irena Svetin, Darjan Petek, Miran Žavbi, Nuška Brnot ??? What is recession?? Why in Europe???? Why in Slovenia?
The Skillsnet project on Medium-term forecasts of occupational skill needs in Europe: Replacement demand and cohort change analysis
 The Skillsnet project on Medium-term forecasts of occupational skill needs in Europe: Replacement demand and cohort change analysis Paper presented at the Workshop on Medium-term forecast of occupational
Country Health Profiles
 State of Health in the EU Country Health Profiles Brussels, November 2017 1 The Country Health Profiles 1. Highlights 2. Health status 3. Risk Factors 4. Health System (description) 5. Performance of Health
Traffic Safety Basic Facts Main Figures. Traffic Safety Basic Facts Traffic Safety. Motorways Basic Facts 2016.
 Traffic Safety Basic Facts 2013 - Main Figures Traffic Safety Basic Facts 2015 Traffic Safety Motorways Basic Facts 2016 Motorways General Almost 26.000 people were killed in road accidents on motorways
Fiscal competitiveness issues in Romania
 Fiscal competitiveness issues in Romania Ionut Dumitru President of the Fiscal Council, Chief Economist Raiffeisen Bank* October 2014 World Bank Doing Business Report Ranking (out of 189 countries) Ease
The Future Constitutional Treaty
 Special Eurobarometer European Commission The Future Constitutional Treaty Fieldwork: November 2004 Publication: March 2005 Special Eurobarometer 214 / Wave 62.1 TNS Opinion & Social This survey was requested
Traffic Safety Basic Facts Main Figures. Traffic Safety Basic Facts Traffic Safety. Motorways Basic Facts 2017.
 Traffic Safety Basic Facts 2013 - Main Figures Traffic Safety Basic Facts 2015 Traffic Safety Motorways Basic Facts 2017 Motorways General More than 24.000 people were killed in road accidents on motorways
14349/16 MP/SC/mvk 1 DG D 2B
 Council of the European Union Brussels, 15 November 2016 (OR. en) 14349/16 COPEN 336 EUROJUST 146 EJN 72 NOTE From: To: General Secretariat of the Council Delegations No. prev. doc.: 9638/15 Subject: Implementation
May 2009 Euro area annual inflation down to 0.0% EU down to 0.7%
 STAT/09/88 16 June 2009 May 2009 Euro area annual inflation down to 0.0% EU down to 0.7% Euro area 1 annual inflation was 0.0% in May 2009 2, down from 0.6% in April. A year earlier the rate was 3.7%.
Investment and Investment Finance. the EU and the Polish story. Debora Revoltella
 Investment and Investment Finance the EU and the Polish story Debora Revoltella Director - Economics Department EIB Warsaw 27 February 2017 Narodowy Bank Polski European Investment Bank Contents We look
Weighting issues in EU-LFS
 Weighting issues in EU-LFS Carlo Lucarelli, Frank Espelage, Eurostat LFS Workshop May 2018, Reykjavik carlo.lucarelli@ec.europa.eu, frank.espelage@ec.europa.eu 1 1. Introduction The current legislation
Overview of Eurofound surveys
 Overview of Eurofound surveys Dublin 21 st October 2010 Maija Lyly-Yrjänäinen Eurofound data European Working Conditions Survey 91, 95, 00, 05, 10 European Quality of Life Survey 03, 07, 09, 10 (EB), 11
Two years to go to the 2014 European elections European Parliament Eurobarometer (EB/PE 77.4)
") Directorate-General for Communication Public Opinion Monitoring Unit Two years to go to the 2014 European elections European Parliament Eurobarometer (EB/PE 77.4) Brussels, 6 February 2013 FOCUS REPORT
Directorate-General for Communication Public Opinion Monitoring Unit Two years to go to the 2014 European elections European Parliament Eurobarometer (EB/PE 77.4) Brussels, 6 February 2013 FOCUS REPORT
Taylor & Francis Open Access Survey Open Access Mandates
 Taylor & Francis Open Access Survey Open Access Mandates Annex C European Union November 2014 November 2014 0 The results presented in this report are based on research carried out on behalf of Taylor
The EFTA Statistical Office: EEA - the figures and their use
 The EFTA Statistical Office: EEA - the figures and their use EEA Seminar Brussels, 13 September 2012 1 Statistics Comparable, impartial and reliable statistical data are a prerequisite for a democratic
STAT/14/ October 2014
 STAT/14/158-21 October 2014 Provision of deficit and debt data for 2013 - second notification Euro area and EU28 government deficit at 2.9% and 3.2% of GDP respectively Government debt at 90.9% and 85.4%
December 2010 Euro area annual inflation up to 2.2% EU up to 2.6%
 STAT/11/9 14 January 2011 December 2010 Euro area annual inflation up to 2.2% EU up to 2.6% Euro area 1 annual inflation was 2.2% in December 2010 2, up from 1.9% in November. A year earlier the rate was
in focus Statistics T he em ploym ent of senior s in t he Eur opean Union Contents POPULATION AND SOCIAL CONDITIONS 15/2006 Labour market
 T he em ploym ent of senior s in t he Eur opean Union Statistics in focus OULATION AND SOCIAL CONDITIONS 15/2006 Labour market Authors Christel ALIAGA Fabrice ROMANS Contents In 2005, in the EU-25, 22.2
European Commission Directorate-General "Employment, Social Affairs and Equal Opportunities" Unit E1 - Social and Demographic Analysis
 Research note no. 1 Housing and Social Inclusion By Erhan Őzdemir and Terry Ward ABSTRACT Housing costs account for a large part of household expenditure across the EU.Since everyone needs a house, the
Europeans, development aid and the Millennium Development Goals
 Special Eurobarometer 352 European Commission Europeans, development aid and the Millennium Development Goals Fieldwork: June 2010 Publication: September 2010 Special Eurobarometer 352 / Wave TNS Opinion
LEADER implementation update Leader/CLLD subgroup meeting Brussels, 21 April 2015
 LEADER 2007-2013 implementation update Leader/CLLD subgroup meeting Brussels, 21 April 2015 #LeaderCLLD 2,416 2,416 8.9 Progress on LAG selection in the EU (2007-2013) 3 000 2 500 2 000 2 182 2 239 2 287
Investment in Germany and the EU
 Investment in Germany and the EU Pedro de Lima Head of the Economics Studies Division Economics Department Berlin 19/12/2016 11/01/2017 1 Slow recovery of investment, with strong heterogeneity Overall
H Marie Skłodowska-Curie Actions (MSCA)
") H2020 Key facts and figures (2014-2020) Number of IE researchers funded by MSCA: EU budget awarded to IE organisations (EUR million): Number of IE organisations in MSCA: 253 116,04 116 In detail, the number
H2020 Key facts and figures (2014-2020) Number of IE researchers funded by MSCA: EU budget awarded to IE organisations (EUR million): Number of IE organisations in MSCA: 253 116,04 116 In detail, the number
H Marie Skłodowska-Curie Actions (MSCA)
") H2020 Key facts and figures (2014-2020) Number of BE researchers funded by MSCA: EU budget awarded to BE organisations (EUR million): Number of BE organisations in MSCA: 274 161,04 227 In detail, the number
H2020 Key facts and figures (2014-2020) Number of BE researchers funded by MSCA: EU budget awarded to BE organisations (EUR million): Number of BE organisations in MSCA: 274 161,04 227 In detail, the number
in focus Statistics Contents Labour Mar k et Lat est Tr ends 1st quar t er 2006 dat a Em ploym ent r at e in t he EU: t r end st ill up
 Labour Mar k et Lat est Tr ends 1st quar t er 2006 dat a Em ploym ent r at e in t he EU: t r end st ill up Statistics in focus This publication belongs to a quarterly series presenting the European Union
State of play of CAP measure Setting up of Young Farmers in the European Union
 State of play of CAP measure Setting up of Young Farmers in the European Union Michael Gregory EN RD Contact Point Seminar CEJA 20 th September 2010 Measure 112 rationale: Measure 112 - Setting up of young