The EFTA Statistical Office: EEA - the figures and their use
|
|
|
- Shanna Golden
- 5 years ago
- Views:
Transcription
1 The EFTA Statistical Office: EEA - the figures and their use EEA Seminar Brussels, 13 September
2 Statistics Comparable, impartial and reliable statistical data are a prerequisite for a democratic society and a necessary condition for the smooth and sustainable running of any economy. Statistics are crucial for understanding the society around us, and to inform the public at large Statistics are important for evidenced based policy making and for monitoring the effects Comparable statistics across countries and regions are a necessity in a globalised society 2
3 EFTA Statistical Office (ESO) Established in 1991 as a result of the EFTA State s informal cooperation with the European Statistical System (ESS) Formalised in 1994 in its role as liaison office between Eurostat and the EFTA national statistical institutes through the EEA Agreement Part of the EFTA Secretariat and driven by the working group of the Heads of the EFTA National Statistical Offices Located on the premises of Eurostat, the Statistical Office of the European Union, in Luxembourg 3
4 EEA Statistical Cooperation Legal Basis for the EEA Statistical Cooperation Art. 76 of the EEA Agreement concerns statistical cooperation Provisions for the organisation of statistical cooperation, including EFTA Statistical Office (ESO), are mentioned in Protocol 30 Annex XXI deals with EC legislation in the field of statistics relevant for the EEA 4

5 European Statistical System (ESS) 5
6 European Statistical System (ESS) European Statistical System Committee (ESSC) The ESSC is the management body of the ESS. The ESSC discusses and agrees on the objectives and actions of the ESS. It has comitology functions in all issues delegated to the Commission by the Council and the Parliament. The ESSC is chaired by Eurostat and brings together the Heads of all EU and EFTA National Statistical Institutes (NSIs). The ESSC meetings are combined meetings with the EEA Statistical Conference (EEA NSIs, Eurostat and ESO) Other EU committees and groups EFTA States participate fully, without the right to vote, in EU committees, working groups and other bodies dealing with statistics. 6
7 EFTA Statistical Cooperation Technical Assistance in the field of statistics Assisting countries neighbouring the EU to develop their statistical capacity and to harmonise statistical methods and standards with international norms European Statistical Training Programme (ESTP) EFTA participation in the design and the implementation of a training programme for official statisticians of the EU and EFTA States Secondment of National Experts to Eurostat EFTA States second 9 SNEs, of which 2 as part of technical assistance, 4 through EEA agreement and 3 through the CH/EU agreement. 7
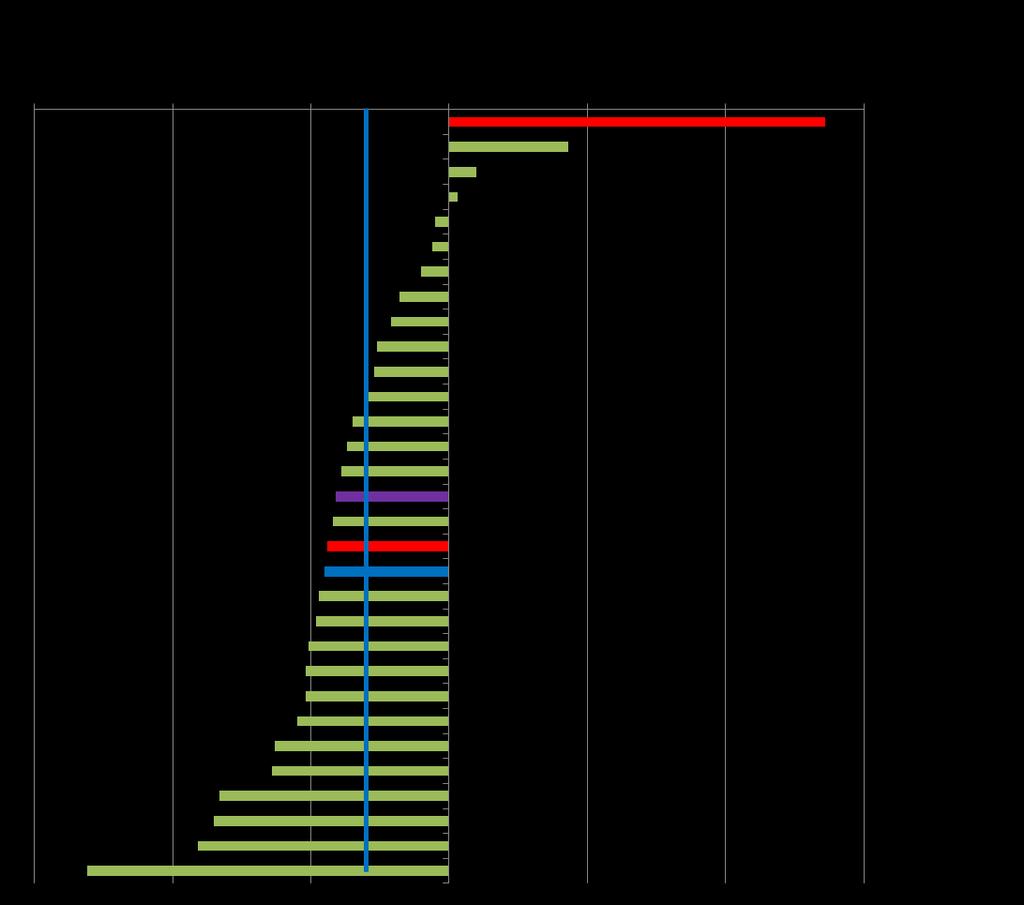
8 The use of statistics in EEA and EU Statistics a common language, used e.g. for several administrative and political purposes, e.g.: EEA EFTA States' total contribution to the EEA, and how it is divided between them EU States' contributions to the EU budget, and redistribution of the budget Policy targets measured by statistical indicators EU's Monitoring of its Member States 8
9 Luxembourg Norway Switzerland United States Netherlands Austria Ireland Sweden Denmark Germany Belgium Finland Iceland UK Euro area France Japan Italy EU Spain Cyprus Slovenia Malta Greece Czech Rep Portugal Slovakia Estonia Hungary Poland Lithuania Latvia Romania Bulgaria GDP per capita Purchasing power standards (PPS), EU27=100,
10 US LU NO DE AT FR CH UK BE SE NL FI EA17 DK CY IT IE EU27 ES EL SI PT SK CZ PL HU LT EE LV RO BG Adjusted gross disposable income for households per capita in 2010 Purchasing power standards (PPS), EU27=100%
11 11
12 12
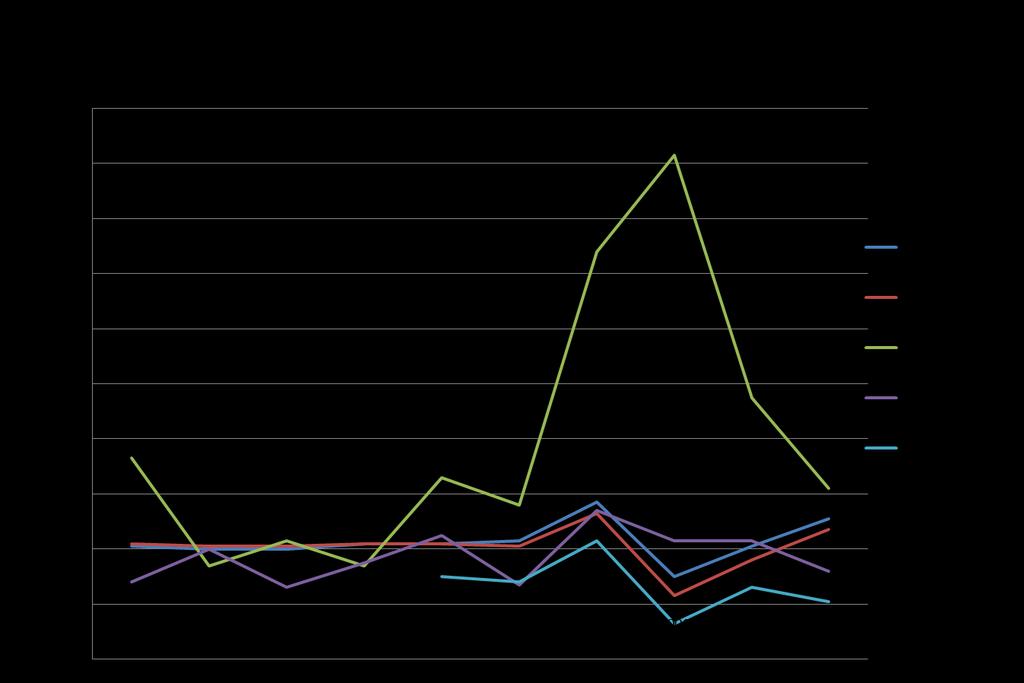
13 14.0 Harmonized Consumer Prices Index Difference EU High-Low, percentage points
14 Price convergence indicator (coefficient of variation of comparative price level index for final household consumption in %) European Union (27 countries) European Union (25 countries) European Union (15 countries) Euro area (17 countries) Euro area (16 countries) Euro area (15 countries) Euro area (13 countries) Euro area (12 countries)
15 Unemployment rates Jun-12 Total Under 25 Men Women EU Euro area Denmark Germany Spain Iceland Norway
16 Germany Greece Portugal Malta Euro area (17 countries) Belgium Austria Netherlands Sweden Italy EU (27) Ireland Denmark Luxembourg France Finland United Kingdom Spain Cyprus Norway Czech Republic Slovenia Poland Slovakia Hungary Lithuania Estonia Bulgaria Latvia Romania Average annual % change in labour cost, nominal values
17 Europe 2020 Headline targets Indicator(s) EU IS NO CH 75 % of the population aged should be employed 3% of the EU's GDP should be invested in R&D The "20/20/20" climate/energy targets should be met (including an increase to 30% of emissions reduction if the conditions are right) The share of early school leavers should be under 10% and at least 40% of years old should have completed a tertiary or equivalent education Employment rate by gender, age group Gross domestic expenditure on R&D (GERD) Greenhouse gas emissions, base year 1990 Share of renewables in gross final energy consumption Early leavers from education and training by gender /20 : 61.7/67.5 : Tertiary educational attainment by gender, age group Reduction of poverty by aiming to lift at least 20 million people out of the risk of poverty or exclusion Population at risk of poverty or exclusion (union of the three sub-indicators below) Persons living in households with very low work intensity Persons at risk of poverty after social transfers Severely materially deprived persons
18 18
19 19
20 20
21 21
22 22
23 External Trade Statistics EFTA's top import and export sources of merchandise trade, 2010 Russian Federation 1.2% Brazil 0.8% Vietnam 1.2% Japan 2.1% Rest of the world 5.1% Brazil 1.0% Russian Federation 1.2% India 0.9% Rest of the world 5.4% China 4.8% China 2.9% Japan 2.5% nited States 5.4% United States 8.1% EFTA's 33 FTA partners 6.2% EU % EFTA's 33 FTA partners 10.7% EU % 2009
24 External Trade Statistics EFTA second largest trade partner of EU-27 (goods and services) 2010 figures, Mio EUR 800, , , , , , , , , , ,000 United States EFTA China Russian Federation Japan Trade Balance
25 Useful links Eurostat website ESO webpage
26 Takk! Merci! Takk fyrir! Grazie! Danke! Thanks!
October 2010 Euro area unemployment rate at 10.1% EU27 at 9.6%
 STAT//180 30 November 20 October 20 Euro area unemployment rate at.1% EU27 at 9.6% The euro area 1 (EA16) seasonally-adjusted 2 unemployment rate 3 was.1% in October 20, compared with.0% in September 4.
January 2010 Euro area unemployment rate at 9.9% EU27 at 9.5%
 STAT//29 1 March 20 January 20 Euro area unemployment rate at 9.9% EU27 at 9.5% The euro area 1 (EA16) seasonally-adjusted 2 unemployment rate 3 was 9.9% in January 20, the same as in December 2009 4.
Growth, competitiveness and jobs: priorities for the European Semester 2013 Presentation of J.M. Barroso,
 Growth, competitiveness and jobs: priorities for the European Semester 213 Presentation of J.M. Barroso, President of the European Commission, to the European Council of 14-1 March 213 Economic recovery
COMMISSION DECISION of 23 April 2012 on the second set of common safety targets as regards the rail system (notified under document C(2012) 2084)
 2084)") 27.4.2012 Official Journal of the European Union L 115/27 COMMISSION DECISION of 23 April 2012 on the second set of common safety targets as regards the rail system (notified under document C(2012) 2084)
27.4.2012 Official Journal of the European Union L 115/27 COMMISSION DECISION of 23 April 2012 on the second set of common safety targets as regards the rail system (notified under document C(2012) 2084)
August 2008 Euro area external trade deficit 9.3 bn euro 27.2 bn euro deficit for EU27
 STAT/08/143 17 October 2008 August 2008 Euro area external trade deficit 9.3 27.2 deficit for EU27 The first estimate for the euro area 1 (EA15) trade balance with the rest of the world in August 2008
May 2009 Euro area external trade surplus 1.9 bn euro 6.8 bn euro deficit for EU27
 STAT/09/106 17 July 2009 May 2009 Euro area external trade surplus 1.9 6.8 deficit for EU27 The first estimate for the euro area 1 (EA16) trade balance with the rest of the world in May 2009 gave a 1.9
January 2009 Euro area external trade deficit 10.5 bn euro 26.3 bn euro deficit for EU27
 STAT/09/40 23 March 2009 January 2009 Euro area external trade deficit 10.5 26.3 deficit for EU27 The first estimate for the euro area 1 (EA16) trade balance with the rest of the world in January 2009
Themes Income and wages in Europe Wages, productivity and the wage share Working poverty and minimum wage The gender pay gap
 5. W A G E D E V E L O P M E N T S At the ETUC Congress in Seville in 27, wage developments in Europe were among the most debated issues. One of the key problems highlighted in this respect was the need
Taxation trends in the European Union EU27 tax ratio at 39.8% of GDP in 2007 Steady decline in top personal and corporate income tax rates since 2000
 DG TAXUD STAT/09/92 22 June 2009 Taxation trends in the European Union EU27 tax ratio at 39.8% of GDP in 2007 Steady decline in top personal and corporate income tax rates since 2000 The overall tax-to-gdp
DATA SET ON INVESTMENT FUNDS (IVF) Naming Conventions
 Naming Conventions") DIRECTORATE GENERAL STATISTICS LAST UPDATE: 10 APRIL 2013 DIVISION MONETARY & FINANCIAL STATISTICS ECB-UNRESTRICTED DATA SET ON INVESTMENT FUNDS (IVF) Naming Conventions The series keys related to Investment
DIRECTORATE GENERAL STATISTICS LAST UPDATE: 10 APRIL 2013 DIVISION MONETARY & FINANCIAL STATISTICS ECB-UNRESTRICTED DATA SET ON INVESTMENT FUNDS (IVF) Naming Conventions The series keys related to Investment
December 2010 Euro area annual inflation up to 2.2% EU up to 2.6%
 STAT/11/9 14 January 2011 December 2010 Euro area annual inflation up to 2.2% EU up to 2.6% Euro area 1 annual inflation was 2.2% in December 2010 2, up from 1.9% in November. A year earlier the rate was
Gender pension gap economic perspective
 Gender pension gap economic perspective Agnieszka Chłoń-Domińczak Institute of Statistics and Demography SGH Part of this research was supported by European Commission 7th Framework Programme project "Employment
NOTE ON EU27 CHILD POVERTY RATES
 NOTE ON EU7 CHILD POVERTY RATES Research note prepared for Child Poverty Action Group Authors: H. Xavier Jara and Chrysa Leventi Institute for Social and Economic Research (ISER) University of Essex The
PROGRESS TOWARDS THE LISBON OBJECTIVES 2010 IN EDUCATION AND TRAINING
 PROGRESS TOWARDS THE LISBON OBJECTIVES IN EDUCATION AND TRAINING In 7, reaching the benchmarks for continues to pose a serious challenge for education and training systems in Europe, except for the goal
Securing sustainable and adequate social protection in the EU
 Securing sustainable and adequate social protection in the EU Session on Social Protection & Security IFA 12th Global Conference on Ageing 11 June 2014, HICC Hyderabad India Dr Lieve Fransen European Commission
PROGRESS TOWARDS THE LISBON OBJECTIVES 2010 IN EDUCATION AND TRAINING
 PROGRESS TOWARDS THE LISBON OBJECTIVES IN EDUCATION AND TRAINING In, reaching the benchmarks for continues to pose a serious challenge for education and training systems in Europe, except for the goal
May 2009 Euro area annual inflation down to 0.0% EU down to 0.7%
 STAT/09/88 16 June 2009 May 2009 Euro area annual inflation down to 0.0% EU down to 0.7% Euro area 1 annual inflation was 0.0% in May 2009 2, down from 0.6% in April. A year earlier the rate was 3.7%.
European Commission. Statistical Annex of Alert Mechanism Report 2017
 European Commission Statistical Annex of Alert Mechanism Report 2017 COMMISSION STAFF WORKING DOCUMENT STATISTICAL ANNEX Accompanying the document REPORT FROM THE COMMISSION TO THE EUROPEAN PARLIAMENT,
Social Protection and Social Inclusion in Europe Key facts and figures
 MEMO/08/625 Brussels, 16 October 2008 Social Protection and Social Inclusion in Europe Key facts and figures What is the report and what are the main highlights? The European Commission today published
HOW RECESSION REFLECTS IN THE LABOUR MARKET INDICATORS
 REPUBLIC OF SLOVENIA HOW RECESSION REFLECTS IN THE LABOUR MARKET INDICATORS Matej Divjak, Irena Svetin, Darjan Petek, Miran Žavbi, Nuška Brnot ??? What is recession?? Why in Europe???? Why in Slovenia?
STAT/14/ October 2014
 STAT/14/158-21 October 2014 Provision of deficit and debt data for 2013 - second notification Euro area and EU28 government deficit at 2.9% and 3.2% of GDP respectively Government debt at 90.9% and 85.4%
COMMISSION STAFF WORKING DOCUMENT Accompanying the document
 EUROPEAN COMMISSION Brussels, 9.10.2017 SWD(2017) 330 final PART 13/13 COMMISSION STAFF WORKING DOCUMENT Accompanying the document REPORT FROM THE COMMISSION TO THE EUROPEAN PARLIAMENT, THE COUNCIL, THE
Macroeconomic Policies in Europe: Quo Vadis A Comment
 Macroeconomic Policies in Europe: Quo Vadis A Comment February 12, 2016 Helene Schuberth Outline Staff Projection of the Euro Area Monetary Policy Investment Rebalancing in the euro area Fiscal Policy
FIRST REPORT COSTS AND PAST PERFORMANCE
 FIRST REPORT COSTS AND PAST PERFORMANCE DECEMBER 2018 https://eiopa.europa.eu/ PDF ISBN 978-92-9473-131-9 ISSN 2599-8862 doi: 10.2854/480813 EI-AM-18-001-EN-N EIOPA, 2018 Reproduction is authorised provided
EUROPE 2020 STRATEGY FORECASTING THE LEVEL OF ACHIEVING ITS GOALS BY THE EU MEMBER STATES
 Abstract. Based on the interdependencies that exist between world economies, the effects of the Europe 2020 strategy is going to affect every company no matter if it operates or not in an EU member state.
COMMISSION STAFF WORKING DOCUMENT Accompanying the document. Report form the Commission to the Council and the European Parliament
 EUROPEAN COMMISSION Brussels, 4.5.2018 SWD(2018) 246 final PART 5/9 COMMISSION STAFF WORKING DOCUMENT Accompanying the document Report form the Commission to the Council and the European Parliament on
COVER NOTE The Employment Committee Permanent Representatives Committee (Part I) / Council EPSCO Employment Performance Monitor - Endorsement
 / Council EPSCO Employment Performance Monitor - Endorsement") COUNCIL OF THE EUROPEAN UNION Brussels, 15 June 2011 10666/1/11 REV 1 SOC 442 ECOFIN 288 EDUC 107 COVER NOTE from: to: Subject: The Employment Committee Permanent Representatives Committee (Part I) / Council
COUNCIL OF THE EUROPEAN UNION Brussels, 15 June 2011 10666/1/11 REV 1 SOC 442 ECOFIN 288 EDUC 107 COVER NOTE from: to: Subject: The Employment Committee Permanent Representatives Committee (Part I) / Council
2 ENERGY EFFICIENCY 2030 targets: time for action
 ENERGY EFFICIENCY 2030 targets: time for action The Coalition for Energy Savings The Coalition for Energy Savings strives to make energy efficiency and savings the first consideration of energy policies
The Eurostars Programme
 The Eurostars Programme The EU-EUREKA joint funding programme for R&D-performing SMEs What is EUREKA? > 2 > EUREKA is a public network supporting R&D-performing businesses > Established in 1985 by French
Investment and Investment Finance. the EU and the Polish story. Debora Revoltella
 Investment and Investment Finance the EU and the Polish story Debora Revoltella Director - Economics Department EIB Warsaw 27 February 2017 Narodowy Bank Polski European Investment Bank Contents We look
Aggregation of periods for unemployment benefits. Report on U1 Portable Documents for mobile workers Reference year 2016
 Aggregation of periods for unemployment benefits Report on U1 Portable Documents for mobile workers Reference year 2016 Frederic De Wispelaere & Jozef Pacolet - HIVA KU Leuven June 2017 EUROPEAN COMMISSION
How much does it cost to make a payment?
 How much does it cost to make a payment? Heiko Schmiedel European Central Bank Directorate General Payments & Market Infrastructure, Market Integration Division World Bank Global Payments Week 23 October
Two years to go to the 2014 European elections European Parliament Eurobarometer (EB/EP 77.4)
") Directorate-General for Communication PUBLIC OPINION MONITORING UNIT Brussels, 23 October 2012. Two years to go to the 2014 European elections European Parliament Eurobarometer (EB/EP 77.4) FOCUS ON THE
Directorate-General for Communication PUBLIC OPINION MONITORING UNIT Brussels, 23 October 2012. Two years to go to the 2014 European elections European Parliament Eurobarometer (EB/EP 77.4) FOCUS ON THE
Fiscal competitiveness issues in Romania
 Fiscal competitiveness issues in Romania Ionut Dumitru President of the Fiscal Council, Chief Economist Raiffeisen Bank* October 2014 World Bank Doing Business Report Ranking (out of 189 countries) Ease
Eurofound in-house paper: Part-time work in Europe Companies and workers perspective
 Eurofound in-house paper: Part-time work in Europe Companies and workers perspective Presented by: Eszter Sandor Research Officer, Surveys and Trends 26/03/2010 1 Objectives Examine the patterns of part-time
EBA REPORT ON HIGH EARNERS
 EBA REPORT ON HIGH EARNERS DATA AS OF END 2017 LONDON - 11/03/2019 1 Data on high earners List of figures 3 Executive summary 4 1. Data on high earners 6 1.1 Background 6 1.2 Data collected on high earners
Country Health Profiles
 State of Health in the EU Country Health Profiles Brussels, November 2017 1 The Country Health Profiles 1. Highlights 2. Health status 3. Risk Factors 4. Health System (description) 5. Performance of Health
COUNCIL OF THE EUROPEAN UNION. Brussels, 13 June /1/13 REV 1 SOC 409 ECOFIN 444 EDUC 190
 COUNCIL OF THE EUROPEAN UNION Brussels, 13 June 2013 10373/1/13 REV 1 SOC 409 ECOFIN 444 EDUC 190 COVER NOTE from: to: Subject: The Employment Committee Permanent Representatives Committee (Part I) / Council
Overview of Eurofound surveys
 Overview of Eurofound surveys Dublin 21 st October 2010 Maija Lyly-Yrjänäinen Eurofound data European Working Conditions Survey 91, 95, 00, 05, 10 European Quality of Life Survey 03, 07, 09, 10 (EB), 11
H Marie Skłodowska-Curie Actions (MSCA)
") H2020 Key facts and figures (2014-2020) Number of IE researchers funded by MSCA: EU budget awarded to IE organisations (EUR million): Number of IE organisations in MSCA: 253 116,04 116 In detail, the number
H2020 Key facts and figures (2014-2020) Number of IE researchers funded by MSCA: EU budget awarded to IE organisations (EUR million): Number of IE organisations in MSCA: 253 116,04 116 In detail, the number
Macroeconomic overview SEE and Macedonia
 Macroeconomic overview SEE and Macedonia Zoltan Arokszallasi Chief Analyst, Macro & FX/FI Research Erste Group Bank Erste Investors Breakfast, 29 September, Skopje 02. Oktober SEE shows mixed performance
H Marie Skłodowska-Curie Actions (MSCA)
") H2020 Key facts and figures (2014-2020) Number of BE researchers funded by MSCA: EU budget awarded to BE organisations (EUR million): Number of BE organisations in MSCA: 274 161,04 227 In detail, the number
H2020 Key facts and figures (2014-2020) Number of BE researchers funded by MSCA: EU budget awarded to BE organisations (EUR million): Number of BE organisations in MSCA: 274 161,04 227 In detail, the number
EUROPEAN COMMISSION EUROSTAT
 EUROPEAN COMMISSION EUROSTAT Directorate F: Social statistics Unit F-3: Labour market Doc.: Eurostat/F3/LAMAS/29/14 WORKING GROUP LABOUR MARKET STATISTICS Document for item 3.2.1 of the agenda LCS 2012
Guidelines compliance table
 Guidelines compliance table EBA/GL/2018/01 12 January 2018; Date of application 20 March 2018 Guidelines on uniform disclosures under Article 473a of Regulation (EU) No 575/2013 as regards the transitional
The Skillsnet project on Medium-term forecasts of occupational skill needs in Europe: Replacement demand and cohort change analysis
 The Skillsnet project on Medium-term forecasts of occupational skill needs in Europe: Replacement demand and cohort change analysis Paper presented at the Workshop on Medium-term forecast of occupational
Weighting issues in EU-LFS
 Weighting issues in EU-LFS Carlo Lucarelli, Frank Espelage, Eurostat LFS Workshop May 2018, Reykjavik carlo.lucarelli@ec.europa.eu, frank.espelage@ec.europa.eu 1 1. Introduction The current legislation
H Marie Skłodowska-Curie Actions (MSCA)
") H2020 Key facts and figures (2014-2020) Number of NL researchers funded by MSCA: EU budget awarded to NL organisations (EUR million): Number of NL organisations in MSCA: 427 268.91 351 In detail, the number
H2020 Key facts and figures (2014-2020) Number of NL researchers funded by MSCA: EU budget awarded to NL organisations (EUR million): Number of NL organisations in MSCA: 427 268.91 351 In detail, the number
Aleksandra Dyba University of Economics in Krakow
 61 Aleksandra Dyba University of Economics in Krakow dyba@uek.krakow.pl Abstract Purpose development is nowadays a crucial global challenge. The European aims at building a competitive economy, however,
Investment in Ireland and the EU
 Investment in and the EU Debora Revoltella Director Economics Department Dublin April 10, 2017 20/04/2017 1 Real investment: IE v EU country groupings Real investment (2008 = 100) 180 160 140 120 100 80
in focus Statistics Contents Labour Mar k et Lat est Tr ends 1st quar t er 2006 dat a Em ploym ent r at e in t he EU: t r end st ill up
 Labour Mar k et Lat est Tr ends 1st quar t er 2006 dat a Em ploym ent r at e in t he EU: t r end st ill up Statistics in focus This publication belongs to a quarterly series presenting the European Union
LEADER implementation update Leader/CLLD subgroup meeting Brussels, 21 April 2015
 LEADER 2007-2013 implementation update Leader/CLLD subgroup meeting Brussels, 21 April 2015 #LeaderCLLD 2,416 2,416 8.9 Progress on LAG selection in the EU (2007-2013) 3 000 2 500 2 000 2 182 2 239 2 287
COMMISSION STAFF WORKING DOCUMENT STATISTICAL ANNEX. Accompanying the document
 EUROPEAN COMMISSION Brussels, 22.11.2017 SWD(2017) 661 final COMMISSION STAFF WORKING DOCUMENT STATISTICAL ANNEX Accompanying the document REPORT FROM THE COMMISSION TO THE EUROPEAN PARLIAMENT, THE COUNCIL,
H Marie Skłodowska-Curie Actions (MSCA)
") H2020 Key facts and figures (2014-2020) Number of FR researchers funded by MSCA: EU budget awarded to FR organisations (EUR million): Number of FR organisations in MSCA: 1 072 311.72 479 In detail, the
H2020 Key facts and figures (2014-2020) Number of FR researchers funded by MSCA: EU budget awarded to FR organisations (EUR million): Number of FR organisations in MSCA: 1 072 311.72 479 In detail, the
Library statistical spotlight
 /9/2 Library of the European Parliament 6 4 2 This document aims to provide a picture of the, in particular by looking at car production trends since 2, at the number of enterprises and the turnover they
State of play of CAP measure Setting up of Young Farmers in the European Union
 State of play of CAP measure Setting up of Young Farmers in the European Union Michael Gregory EN RD Contact Point Seminar CEJA 20 th September 2010 Measure 112 rationale: Measure 112 - Setting up of young
H Marie Skłodowska-Curie Actions (MSCA)
") H2020 Key facts and figures (2014-2020) Number of FI researchers funded by MSCA: EU budget awarded to FI organisations (EUR million): Number of FI organisations in MSCA: 155 47.93 89 In detail, the number
H2020 Key facts and figures (2014-2020) Number of FI researchers funded by MSCA: EU budget awarded to FI organisations (EUR million): Number of FI organisations in MSCA: 155 47.93 89 In detail, the number
Fiscal sustainability challenges in Romania
 Preliminary Draft For discussion only Fiscal sustainability challenges in Romania Bucharest, May 10, 2011 Ionut Dumitru Anca Paliu Agenda 1. Main fiscal sustainability challenges 2. Tax collection issues
H Marie Skłodowska-Curie Actions (MSCA)
") H2020 Key facts and figures (2014-2020) Number of PT researchers funded by MSCA: EU budget awarded to PT organisations (EUR million): Number of PT organisations in MSCA: 716 66,67 165 In detail, the number
H2020 Key facts and figures (2014-2020) Number of PT researchers funded by MSCA: EU budget awarded to PT organisations (EUR million): Number of PT organisations in MSCA: 716 66,67 165 In detail, the number
In 2009 a 6.5 % rise in per capita social protection expenditure matched a 6.1 % drop in EU-27 GDP
 Population and social conditions Authors: Giuseppe MOSSUTI, Gemma ASERO Statistics in focus 14/2012 In 2009 a 6.5 % rise in per capita social protection expenditure matched a 6.1 % drop in EU-27 GDP Expenditure
H Marie Skłodowska-Curie Actions (MSCA)
") H2020 Key facts and figures (2014-2020) Number of SE researchers funded by MSCA: EU budget awarded to SE organisations (EUR million): Number of SE organisations in MSCA: 138 114.71 150 In detail, the number
H2020 Key facts and figures (2014-2020) Number of SE researchers funded by MSCA: EU budget awarded to SE organisations (EUR million): Number of SE organisations in MSCA: 138 114.71 150 In detail, the number
Guidelines compliance table
 Guidelines compliance table EBA/GL/2017/01 Appendix 1 08 March 2017; Date of application 31 December 2017 (Updated: 14 November 2017) Guidelines on LCR disclosure to complement the disclosure of liquidity
Recommendations compliance table
 Recommendations compliance table EBA/REC/2017/03 20 December 2017; Date of application 1 July 2018 Recommendations on outsourcing to cloud service providers The following competent authorities* or intend
H Marie Skłodowska-Curie Actions (MSCA)
") H2020 Key facts and figures (2014-2020) Number of LV researchers funded by MSCA: EU budget awarded to LV organisations (EUR million): Number of LV organisations in MSCA: 35 3.91 11 In detail, the number
H2020 Key facts and figures (2014-2020) Number of LV researchers funded by MSCA: EU budget awarded to LV organisations (EUR million): Number of LV organisations in MSCA: 35 3.91 11 In detail, the number
Issues Paper. 29 February 2012
 29 February 212 Issues Paper In the context of the European semester, the March European Council gives, on the basis of the Commission's Annual Growth Survey, guidance to Member States for the Stability
BETTER, WORSE, AVERAGE
 BETTER, WORSE, AVERAGE Statistical Portrait of Slovenia in the International Community 2018 www.stat.si/eng Better, Worse, Average - Statistical Portrait of Slovenia in the International Community 2018
Introduction to EU Regional and Innovation Policy
 China EU Training on Regional Policy () Twinning session in Tianjin: Regional development and innovation Introduction to EU Regional and Innovation Policy Tianjin, 29 July 2014 Pablo Gándara Coordinator
STAT/14/64 23 April 2014
 STAT/14/64 23 April 2014 Provision of deficit and debt data for 2013 - first notification Euro area and EU28 government deficit at 3.0% and 3.3% of GDP respectively Government debt at 92.6% and 87.1% In
Investment in Germany and the EU
 Investment in Germany and the EU Pedro de Lima Head of the Economics Studies Division Economics Department Berlin 19/12/2016 11/01/2017 1 Slow recovery of investment, with strong heterogeneity Overall
H Marie Skłodowska-Curie Actions (MSCA)
") H2020 Key facts and figures (2014-2020) Number of AT researchers funded by MSCA: EU budget awarded to AT organisations (EUR million): Number of AT organisations in MSCA: 215 78.57 140 In detail, the number
H2020 Key facts and figures (2014-2020) Number of AT researchers funded by MSCA: EU budget awarded to AT organisations (EUR million): Number of AT organisations in MSCA: 215 78.57 140 In detail, the number
For further information, please see online or contact
 For further information, please see http://ec.europa.eu/research/sme-techweb online or contact Lieve.VanWoensel@ec.europa.eu Seventh Progress Report on SMEs participation in the 7 th R&D Framework Programme
Table of Contents. Part 1 General Section
 About the Editor Foreword v XV Part 1 General Section About this Guide 1-3 Background to the VAT in Europe 2-1 A. Principles of the VAT 2-2 B. VAT in the European Community 2-4 C. The European Union and
Investment in France and the EU
 Investment in and the EU Natacha Valla March 2017 22/02/2017 1 Change relative to 2008Q1 % of GDP Slow recovery of investment, and with strong heterogeneity Overall Europe s recovery in investment is slow,
Guidelines compliance table
 Guidelines compliance table EBA/GL/2017/05 Appendix 1 11 May 2017; Date of application 01 January 2018 (Updated 19 February 2018) Guidelines on ICT Risk Assessment under the Supervisory Review and Evaluation
EU-28 RECOVERED PAPER STATISTICS. Mr. Giampiero MAGNAGHI On behalf of EuRIC
 EU-28 RECOVERED PAPER STATISTICS Mr. Giampiero MAGNAGHI On behalf of EuRIC CONTENTS EU-28 Paper and Board: Consumption and Production EU-28 Recovered Paper: Effective Consumption and Collection EU-28 -
Guidelines compliance table
 compliance table EBA/GL/2018/05 18 July 2018; Date of application 1 January 2019 on fraud reporting under the Payment Services Directive 2 (PSD2) The following competent authorities* or intend to with
H Marie Sklodowska-Curie Actions (MSCA)
") H2020 Key facts and figures (2014-2020) Number of FR researchers funded by MSCA: EU budget awarded to FR organisations (EUR million): Number of FR organisations in MSCA: 565 198.92 370 In detail, the number
H2020 Key facts and figures (2014-2020) Number of FR researchers funded by MSCA: EU budget awarded to FR organisations (EUR million): Number of FR organisations in MSCA: 565 198.92 370 In detail, the number
H Marie Skłodowska-Curie Actions (MSCA)
") H2020 Key facts and figures (2014-2020) Number of PT researchers funded by MSCA: EU budget awarded to PT organisations (EUR million): Number of PT organisations in MSCA: 592 54.79 135 In detail, the number
H2020 Key facts and figures (2014-2020) Number of PT researchers funded by MSCA: EU budget awarded to PT organisations (EUR million): Number of PT organisations in MSCA: 592 54.79 135 In detail, the number
Harmonised Index of Consumer Prices (HICP) August 2015
 August 2015") Aug-14 Sep-14 Oct-14 Nov-14 Dec-14 Jan-15 Feb-15 Mar-15 Apr-15 May-15 Jun-15 MONTENEGRO STATISTICAL OFFICE R E L E A S E Broj: 201 Podgorica, 18 September 2015 When using the data please name the source
Aug-14 Sep-14 Oct-14 Nov-14 Dec-14 Jan-15 Feb-15 Mar-15 Apr-15 May-15 Jun-15 MONTENEGRO STATISTICAL OFFICE R E L E A S E Broj: 201 Podgorica, 18 September 2015 When using the data please name the source
Traffic Safety Basic Facts Main Figures. Traffic Safety Basic Facts Traffic Safety. Motorways Basic Facts 2015.
 Traffic Safety Basic Facts 2013 - Main Figures Traffic Safety Basic Facts 2015 Traffic Safety Motorways Basic Facts 2015 Motorways General Almost 30.000 people were killed in road accidents on motorways
In 2008 gross expenditure on social protection in EU-27 accounted for 26.4 % of GDP
 Population and social conditions Author: Antonella PUGLIA Statistics in focus 17/2011 In 2008 gross expenditure on social protection in EU-27 accounted for 26.4 % of GDP Social protection benefits are
Czech Republic in the EU Framework Programmes for R&D&I: success or failure? Vladimír Albrecht Technology Centre AS CR
 Czech Republic in the EU Framework Programmes for R&D&I: success or failure? Vladimír Albrecht Technology Centre AS CR albrecht@tc.cz European Research Council (curiosity driven frontier research) HORIZON
Session 3 Wednesday 29 November 2017, 10:00-10:30. State of affairs on TSA compilation in Europe
 DG GROW / UNWTO Workshop Measuring the economic impact of tourism in Europe: the Tourism Satellite Account (TSA) BREY Building, Brussels, Belgium, 29-30 November 2017 Session 3 Wednesday 29 November 2017,
Flash Eurobarometer 408 EUROPEAN YOUTH REPORT
 Flash Eurobarometer EUROPEAN YOUTH REPORT Fieldwork: December 2014 Publication: April 2015 This survey has been requested by the European Commission, Directorate-General for Education and Culture and co-ordinated
COMMISSION WORKING DOCUMENT
 EUROPEAN COMMISSION Brussels, 20.11.2012 COM(2012) 674 final COMMISSION WORKING DOCUMENT assessing the quality of data reported by Member States in 2011 on balance of payments, international trade in services
DG TAXUD. STAT/11/100 1 July 2011
 DG TAXUD STAT/11/100 1 July 2011 Taxation trends in the European Union Recession drove EU27 overall tax revenue down to 38.4% of GDP in 2009 Half of the Member States hiked the standard rate of VAT since
The Reform of the Common Agricultural Policy Implementation. Catherine Combette DG Agriculture and Rural Development European Commission
 The Reform of the Common Agricultural Policy 2014-2020 Implementation Catherine Combette DG Agriculture and Rural Development European Commission catherine.combette@ec.europa.eu Agriculture and Rural Development
Traffic Safety Basic Facts Main Figures. Traffic Safety Basic Facts Traffic Safety. Motorways Basic Facts 2016.
 Traffic Safety Basic Facts 2013 - Main Figures Traffic Safety Basic Facts 2015 Traffic Safety Motorways Basic Facts 2016 Motorways General Almost 26.000 people were killed in road accidents on motorways
Flash Eurobarometer 441. Report. European SMEs and the Circular Economy
 European SMEs and the Circular Economy Survey requested by the European Commission, Directorate-General Environment and co-ordinated by the Directorate-General for Communication This document does not
H Marie Skłodowska-Curie Actions (MSCA)
") H2020 Key facts and figures (2014-2020) Number of LT researchers funded by MSCA: EU budget awarded to LT organisations (EUR million): Number of LT organisations in MSCA: 79 5.03 21 In detail, the number
H2020 Key facts and figures (2014-2020) Number of LT researchers funded by MSCA: EU budget awarded to LT organisations (EUR million): Number of LT organisations in MSCA: 79 5.03 21 In detail, the number
Traffic Safety Basic Facts Main Figures. Traffic Safety Basic Facts Traffic Safety. Motorways Basic Facts 2017.
 Traffic Safety Basic Facts 2013 - Main Figures Traffic Safety Basic Facts 2015 Traffic Safety Motorways Basic Facts 2017 Motorways General More than 24.000 people were killed in road accidents on motorways
THE 2015 EU JUSTICE SCOREBOARD
 THE 215 EU JUSTICE SCOREBOARD Communication from the Commission to the European Parliament, the Council, the European Central Bank, the European Economic and Social Committee and the Committee of the Regions
Flash Eurobarometer 398 WORKING CONDITIONS REPORT
 Flash Eurobarometer WORKING CONDITIONS REPORT Fieldwork: April 2014 Publication: April 2014 This survey has been requested by the European Commission, Directorate-General for Employment, Social Affairs
EU BUDGET AND NATIONAL BUDGETS
 DIRECTORATE GENERAL FOR INTERNAL POLICIES POLICY DEPARTMENT ON BUDGETARY AFFAIRS EU BUDGET AND NATIONAL BUDGETS 1999-2009 October 2010 INDEX Foreward 3 Table 1. EU and National budgets 1999-2009; EU-27
Note to ERAC Delegates
 EUROPEAN COMMISSION DIRECTORATE-GENERAL FOR RESEARCH & INNOVATION Directorate A - Policy Development and Coordition Head of Unit A.2 - Programming and interinstitutiol relations Ref. Ares(214)275666-5/2/214
World Economic Outlook Central Europe and Baltic Countries
 World Economic Outlook Central Europe and Baltic Countries Presentation by Susan Schadler and Christoph Rosenberg September 5 World growth returns to trend. (World real GDP growth, annual percent change)
EMPLOYMENT RATE Employed/Working age population (15 64 years)
") EMPLOYMENT RATE 198 26 Employed/Working age population (15 64 years 8 % Finland 75 EU 15 EU 25 7 65 6 55 5 8 82 84 86 88 9 92 94 96 98 2 4** 6** 14.4.25/SAK /TL Source: European Commission 1 UNEMPLOYMENT
EMPLOYMENT RATE 198 26 Employed/Working age population (15 64 years 8 % Finland 75 EU 15 EU 25 7 65 6 55 5 8 82 84 86 88 9 92 94 96 98 2 4** 6** 14.4.25/SAK /TL Source: European Commission 1 UNEMPLOYMENT
Live Long and Prosper? Demographic Change and Europe s Pensions Crisis. Dr. Jochen Pimpertz Brussels, 10 November 2015
 Live Long and Prosper? Demographic Change and Europe s Pensions Crisis Dr. Jochen Pimpertz Brussels, 10 November 2015 Old-age-dependency ratio, EU28 45,9 49,4 50,2 39,0 27,5 31,8 2013 2020 2030 2040 2050
Social protection in the European Union
 Population and social conditions Author: Alexandra PETRÁŠOVÁ Statistics in focus 46/2008 Social protection in the European Union In 2005, expenditure on social protection accounted for 27.2% of GDP in
Flash Eurobarometer 470. Report. Work-life balance
 Work-life balance Survey requested by the European Commission, Directorate-General for Justice and Consumers and co-ordinated by the Directorate-General for Communication This document does not represent
H Marie Skłodowska-Curie Actions (MSCA)
") H2020 Key facts and figures (2014-2020) Number of CZ researchers funded by MSCA: EU budget awarded to CZ organisations (EUR million): Number of CZ organisations in MSCA: 157 23.11 58 In detail, the number
H2020 Key facts and figures (2014-2020) Number of CZ researchers funded by MSCA: EU budget awarded to CZ organisations (EUR million): Number of CZ organisations in MSCA: 157 23.11 58 In detail, the number