Air Passengers Rights
|
|
|
- Cordelia Weaver
- 5 years ago
- Views:
Transcription

1 Special Eurobarometer European Commission Air Passengers Rights Report Fieldwork: May June 2009 Publication: December 2009 Special Eurobarometer 319 / Wave 71.2 TNS Opinion & Social This survey was requested by the Directorate-General for Energy and Transport and coordinated by the Directorate-General for Communication ( Research and Political Analysis Unit). This document does not represent the point of view of the European Commission. The interpretations and opinions contained in it are solely those of the authors.
2 Special Eurobarometer 319 Air Passengers rights Conducted by TNS Opinion & Social at the request of Directorate General Energy and Transport Survey co-ordinated by Directorate General Communication TNS Opinion & Social Avenue Herrmann Debroux, Brussels Belgium
3 Table of contents INTRODUCTION USE OF TRANSPORT SERVICES AND AWARENESS OF PASSENGERS RIGHTS Types of transport services used Awareness of passengers rights INFORMATION AND AWARENESS OF AIR PASSENGERS RIGHTS Awareness of reinforced air passenger rights in the EU Having seen the list of rights in an airport Being informed about rights by air transport companies SATISFACTION WITH AIR TRAVEL Satisfaction with treatment in the case of inconvenience Satisfaction with service parameters Satisfaction with luggage handling Satisfaction with the clarity of pricing THE LINK BETWEEN THE LEVEL OF INFORMATION AND SATISFACTION WITH SERVICE RECEIVED Degree of information and awareness of rights Level of satisfaction with service received Link between information and service COMPLAINTS CONCERNING AIR TRAVEL ISSUES Inconvenience and complaints Implementation of rights Are complaints procedures efficient?
4 5.4 Contacts when filing a complaint CONCLUSION...52 ANNEX TECHNICAL SPECIFICATIONS QUESTIONNAIRE TABLES - 2 -
5 INTRODUCTION Regulation [EC] 261/2004 introduced new rules on compensation and assistance for air passengers who are denied boarding, suffer cancellations, long delays or involuntary downgrading 1. The Regulation requires airlines to provide passengers with assistance such as accommodation, refreshments, meals and communication facilities. If necessary, re-routing and refunds should be offered. Compensation can be as high as 600 per passenger. Air companies are also required to inform passengers proactively about their rights under the Regulation. Thus, in the case of delays above 5 hours, travellers can obtain a refund if they decide not to travel. If they are denied boarding or their flight is cancelled, passengers are allowed to choose to continue the trip or receive a refund. Beyond this, they are entitled to financial compensation under certain circumstances. Member States were requested to designate national enforcement bodies with the ability to impose dissuasive sanctions in the case of infringements of the Regulation. The Regulation applies to all worldwide airlines when departure takes place within the EU and, in the case of flights from a third country to a destination within the EU, only to Community carriers. Further legislation requires that passengers should be informed in advance of the airline that operates their flights. Moreover, unsafe airlines are now banned from operating in European airspace. Finally, airlines can be held liable for damages, injuries and death, and passengers have the right to receive accurate information on their package holidays and protection from insolvent organisers. 2 1 OJ L 46, , p OJ L 140, , p OJ L 158, , p OJ L 344, , p OJ L 286, , p
6 In 2006, Regulation [EC] 1107/2006 was adopted to protect people with reduced mobility from discrimination. They are entitled to assistance to help them through their journey aboard aircrafts, as well as in airports of the EU. 3 The new legislation is an immense improvement with regard to the situation of air transport users. Nevertheless, the story does not end here. The next vital step is to ensure that passengers are informed about their rights, become aware of them, and, where necessary, request their implementation and enforcement. To this end, the Directorate-General for Energy and Transport launched this special Eurobarometer study to understand public awareness of the issue. A survey was conducted in 2005 among the then 25 Member States of the European Union. Although the questionnaires have changed since the 2005 survey was conducted, certain elements remain constant and their results are comparable. This report presents the results of a special Eurobarometer no. 319 conducted by TNS Opinion & Social network from 25th May to 17th June All interviews were conducted face-to-face in people s homes and in the appropriate national language. The methodology is consistent with that used in Standard Eurobarometer polls managed by the European Commission s Communication Directorate-General ( Public Opinion and Media Monitoring unit). A technical note on the manner in which interviews were conducted is appended as an annex to this report. This note indicates the interview methods and the confidence intervals. The report covers the following areas: 1. Use of different transport means 2. Awareness of passengers rights 3. Satisfaction of EU passengers with the different aspects of air travel 4. Complaints in case of inconvenience suffered and the contact bodies 3 OJ L 204, , p
7 In this report, the countries are represented by their official abbreviations. The abbreviations used in this report correspond to: ABBREVIATIONS EU27 DK/NA BE BG CZ DK D-E DE D-W EE EL ES FR IE IT CY LT LV LU HU MT NL AT PL PT RO SI SK FI SE UK European Union 27 Member States Don t know / No answer Belgium Bulgaria Czech Republic Denmark East Germany Germany West Germany Estonia Greece Spain France Ireland Italy Republic of Cyprus Lithuania Latvia Luxembourg Hungary Malta The Netherlands Austria Poland Portugal Romania Slovenia Slovakia Finland Sweden The United Kingdom ***** The Eurobarometer web site can be consulted at the following address: We would like to take the opportunity to thank all the respondents - 5 -
8 1. USE OF TRANSPORT SERVICES AND AWARENESS OF PASSENGERS RIGHTS 1.1 Types of transport services used - Local urban transport is the most commonly used means of transport- QG1 Which of the following services, if any, have you used during the last twelve months? (MULTIPLE ANSWERS POSSIBLE) - % EU EU 27 EB 71.2 EU 25 EB % 57% Base: All respondents EB71.2, n=26756, EB63.2, n= % 30% 24% 22% 27% 27% 8% 9% 6% 6% Local urban transport (Trams, Buses, Metro, etc.) Inter-city rail transport Air transport Ferry services International bus transport None of these (SPONTANEOUS) Before focusing on air transport, it is worth considering which transport services are the most commonly used by Europeans. In terms of use of the different means of transport over the last year, overall local urban transport is clearly the most commonly used. The majority of Europeans (59%) have used trams, buses and underground at some point during the last year. About one third of respondents (30%) have used inter city rail transport and about a quarter (24%) have used air transport. When it comes to ferries or international bus journeys, Europeans are less active users: 8% of them used ferry services and 6% used international bus transport. However, the survey also reveals that more than a quarter of respondents (27%) did not use any of these means of transport over the last year. Bearing in mind that cars are still the main means of transport for a large proportion of Europeans this figure comes as no big surprise. Overall, the results are very similar to those of March The use of local transport and air transport has increased slightly, whereas the use of ferry services has decreased somewhat
 have used air transport over the last twelve months. Sweden (53%), Denmark (49%) and Luxembourg (42%) all have large proportions of air travellers.")
9 Base; All respondents EB71.2, n=26756 An analysis of national answers concerning the use of air transport shows that the island nations all have relatively large proportions of recent air travellers. Almost six in every ten Irish respondents (58%) have used air transport over the last twelve months. Sweden (53%), Denmark (49%) and Luxembourg (42%) all have large proportions of air travellers. Cyprus (46%) and Malta (38%), being islands with few connections to mainland Europe and few alternatives to air travel, also reported relatively high scores. Hungary comes in bottom place, with only 3% of respondents having travelled by air over the last year. The results in Bulgaria (5%) and Romania (7%), the two most recent Member States, are also particularly low
10 QG1.3 Which of the following services, if any, have you used during the last twelve months? - % EU Air transport Yes EU27* 24% Sex Male 27% Female 22% Age % % % % Education (End of) 15-13% % % Still studying 28% Respondent occupation scale Self-employed 37% Managers 49% Other white collars 29% Manual workers 22% House persons 15% Unemployed 15% Retired 16% Students 28% Subjective urbanisation Rural village 20% Small/ mid size town 24% Large town 30% Difficulties paying bills Most of the time 14% From time to time 18% Almost never/ never 30% *Base: all respondents EB71.2, n=26756 At this point it is interesting to examine the profile of regular air passengers. A socio-demographic breakdown reveals that men (27%) are slightly more likely than women (22%) to travel by air. Age also has an influence: respondents aged (29%) and (27%) are more likely to travel regularly by air than respondents aged over 55 years (19%) and young respondents aged (24%). The education criterion also reveals a clear trend. Respondents who studied beyond the age of 20 (40%) are more likely to travel by air than the least educated respondents: only 13% of those that left school at the age of 15 or earlier travelled by air in the last year
11 Moving on to the respondent s occupational status, we can see that almost half (49%) of those working as managers are recent air travellers, as are a noticeable proportion of self-employed people (37%), other white collar workers (29%) and students (28%). Subjective urbanisation is also an important factor in explaining the use of air transport. Almost a third (30%) of respondents living in a large city has recently travelled by air, whereas this number goes down to 20% for respondents living in a rural area. Quite naturally, the respondent s financial situation has a big impact on travel habits. A third (30%) of those who have never had problems paying their bills are likely to travel by air. Not unexpectedly, this figure shrinks to 14% among those who struggle to pay their bills. Travelling by air thus emerges as a choice of transport only when other costs have already been covered
 are unaware of their contractual rights and obligations when buying a ticket")

12 1.2 Awareness of passengers rights - Six in ten Europeans are unaware of their contractual rights and obligations - Base; All respondents EB71.2, n=26756, EB63.2 n =24709 When it comes to awareness of passengers rights, the survey reveals that almost six out of ten Europeans (59%) are unaware of their contractual rights and obligations when buying a ticket from a transport company. Only 34% of the respondents declared that they are aware of these rights and a further 7% have not yet formed an opinion on this matter. There has been no significant change in results since the previous survey in 2005: at that time 60% were unaware of their rights and obligations and 35% claimed that they were aware of them. This data suggests that transport companies and/or the authorities have not done much over the last four years to improve passengers awareness of their contractual rights and obligations. The EU average has changed by a just one percentage point. However, there have been considerable changes at national level, as examined below


 as well as in Ireland and Portugal (both +7")
13 Base; All respondents EB71.2, n=26756, EB63.2, n=24709 The map above illustrates the change in awareness of contractual rights at country level. The left column shows the current percentage of respondents feeling aware, and the left column gives us the evolution in percentage points since EB63.2, Spring The direction of change varies significantly between EU countries. The most positive shifts have occurred in Cyprus (+13 percentage points), Spain (+9 percentage points), Sweden and Estonia (both +8 percentage points) as well as in Ireland and Portugal (both +7 percentage points). Despite these positive shifts, there has been a significant decrease in awareness in Italy (-11 percentage points), Austria (
14 percentage points), Malta (-8 percentage points), Hungary (-7 percentage points) and the Netherlands (-6 percentage points). QG2 When buying a ticket from a transport company, you have a contract with this company. Are you aware of rights and obligations linked to this contract? - % EU Yes No DK EU27* 34% 59% 7% Sex Male 36% 57% 7% Female 31% 61% 8% Age % 60% 6% % 56% 6% % 57% 6% % 63% 9% Education (End of) 15-23% 67% 10% % 60% 6% % 50% 5% Still studying 35% 59% 6% Respondent occupation scale Self-employed 41% 53% 6% Managers 53% 43% 4% Other white collars 39% 55% 6% Manual workers 32% 62% 6% House persons 24% 66% 10% Unemployed 31% 62% 7% Retired 27% 63% 10% Students 35% 59% 6% Subjective urbanisation Rural village 28% 65% 7% Small/ mid size town 33% 59% 8% Large town 42% 52% 6% Difficulties paying bills Most of the time 27% 64% 9% From time to time 30% 62% 8% Almost never/ never 37% 57% 6% *Base: all respondents EB71.2, n=26756 A socio-demographic breakdown reveals a number of interesting differences. With regard to gender, it appears that men (36%) are more likely than women (31%) to consider that they are well-informed about their rights and obligations. A stronger pattern emerges as regards age: respondents aged (38%) and (37%) appear to be the best informed, whereas awareness decreases to 28% for those aged 55 or over. As expected, education strongly influences the respondent s level of information. A substantial majority (45%) of those who studied beyond the age of 20 are aware of their contractual rights. This figure shrinks to 23% for those who left school at
15 Turning to occupational status, more than half of managers (53%) declared that they are aware of their rights and obligations pursuant to the contract entered into with the company when buying transport tickets. Self-employed people also seem fairly confident when it comes to their rights, although they still remain in a minority (41%). The same applies as regards other white collar workers (39%) and students (35%). Retired people seem to be the least aware of their rights, with just over a quarter (27%) of them declaring that they know their rights. Some 42% of respondents living in a large city know their rights compared with 33% of respondents living in a small/medium -sized town and 28% of respondents living in a rural area. Turning to financial situation it shows that 37% of those who never or almost never have difficulties paying their bills are familiar with their rights when it comes to transport tickets. This is 10 percentage points higher than the figure for respondents who have difficulties paying their bills most of the time (27%). About a third (30%) of those who have difficulties paying bills say that they know their rights
16 2. INFORMATION AND AWARENESS OF AIR PASSENGERS RIGHTS 2.1 Awareness of reinforced air passenger rights in the EU - A significant drop in awareness of reinforced air passenger rights - As we have just seen, the vast majority of Europeans are unaware of the contractual rights and obligations linked to the purchase of a ticket. In this chapter we will focus on the rights of citizens as air passengers. Although the 2004 EU Regulation established common rules on compensation and assistance to passengers in the event that they are denied boarding or if their flight is cancelled or subject to long delays, a large segment of the respondents are unaware of the reinforced air passenger rights. Overall, only 23% of respondents claimed to have heard of these rights. A staggering 71% say they have not heard about their strengthened rights and a further 6% feel unsure about the matter
, Greece (+3 percentage points) and Malta (+2 percentage points).")
17 Base; All respondents EB71.2, n=26756, EB63.2, n=24709 In comparison to the previous survey of 2005, the overall picture is even less positive. The EU average has decreased by 10 percentage points. The only countries to report an upward trend are Denmark (+4 percentage points), Greece (+3 percentage points) and Malta (+2 percentage points). In contrast, the level of awareness of passenger rights has fallen sharply in Poland (-15 percentage points), Portugal and Austria (both -12 percentage points). The situation is particularly severe in Poland where only a very small proportion (11%) of respondents has now heard of these rights

18 As expected, awareness is much higher among respondents who have used air transport services over the past twelve months than among those who have not travelled recently: 43% of the interviewees who have flown during the last year said that they had heard about their reinforced rights, while 55% claimed that they had not heard about them. Despite the overall negative trend previously noted, a comparison of results regarding this core group is encouraging: recent air travellers are now more aware of their rights than 4 years ago (+ 10 percentage points). In the table below we present the results for the countries for which we have a sufficient base (>200 respondents) to provide reliable results
19 QG3.1 The European Union has strengthened the rights of air transport passengers. Have you already? Heard of these rights - % Total Yes Air transport users in the last 12 months EU27 43% DE 63% ES 59% AT 57% SI 52% IE 47% EL 44% CY 40% BE 39% DK 38% NL 37% LU 36% FI 33% FR 30% UK 25% SE 24% *Base: those who have used air transport in the last 12 months EB71.2, n= 6505 A country breakdown reveals significant variations within the EU. Among European citizens who have used air transport within the last 12 months, Germans seem to be the most aware of the recently reinforced air passenger rights since 63% of them declared that they had heard of such rights. But apart from Germany, the only Member States where a majority of respondents said that they knew about such rights were Spain (59%), Austria (57%) and Slovenia (52%). For all other countries the figure is less positive and it is exceptionally low in Sweden (24%) and the UK (25%) where only one out of every four passengers travelling over the last 12 months have heard of such rights
20 QG3.1 The European Union has strengthened the rights of air transport passengers. Have you already? - % EU Heard of these rights Yes EU27* 43% Sex Male 49% Female 36% Age % % % % Education (End of) 15-32% % % Still studying 29% Respondent occupation scale Self-employed 49% Managers 50% Other white collars 44% Manual workers 39% House persons 28% Unemployed 43% Retired 45% Students 29% Subjective urbanisation Rural village 37% Small/ mid size town 43% Large town 47% Difficulties paying bills Most of the time 34% From time to time 37% Almost never/ never 45% *Base: those who have used air transport in the last 12 months EB71.2, n= 6505 Among recent air travellers, socio-demographically, more men (49%) than women (36%) have heard that the EU has reinforced the rights of air transport passengers. The older age groups are more aware of such changes than the younger ones: 47% of those aged have heard of them and 44% of respondents 55 or over are familiar with them. The figure drops to 34% for the age group. Yet again, those who studied the longest (49%) are more aware of these changes than those who left school before the age of 15 (32%). However, the category that seems to be the least aware of such changes, surprisingly enough, is the student group; only 29% of them have heard that the EU has reinforced the rights of air transport passengers
21 From the point of view of occupation, managers are the most aware of the changes (50%), closely followed by self-employed people (49%). House persons are the least aware of the changes (28%), closely followed by students (29%). As was previously noted, 30% of those living in a large city have recently travelled by air, whereas this number falls to 20% for respondents living in a rural area. This pattern is also reflected in the results obtained when these recent air travellers were asked if they knew about the EU s measures to reinforce passengers rights. While 47% of respondents living in large towns answered in the affirmative, only 37% of those living in rural areas answered in the affirmative. The same applies to the respondent s economic situation. It was previously explained that 30% of those who never have problems paying their bills are more likely to travel by air, while this figure drops to 14% among those who struggle to pay their bills. Among recent air travellers, some 45% of those who said that they never or almost never have difficulties paying their bills declared that they had heard of the changes giving air travellers more rights. Only 34% of those who have difficulties paying their bills most of the time expressed the same opinion
22 2.2 Having seen the list of rights in an airport - Two in ten recent air travellers say that they have seen the list - Although awareness among recent air travellers of the reinforced rights of air transport passengers is higher than in 2005, there is still much room for improvement. When it comes to the visibility of the list presenting the reinforced rights in the airports, only one in five of recent air travellers say that they have seen it. QG3.2 The European Union has strengthened the rights of air transport passangers. Have your already? Seen the list of those rights in an airport (Charter of Air Passenger Rights) Air transport users in the last 12 months EU27 21% ES 31% SI 31% AT 28% IE 25% EL 22% BE 20% CY 19% UK 19% DE 18% FR 18% FI 18% LU 14% DK 12% NL 11% SE 10% *Base: those who have used air transport in the last 12 months EB71.2, n=6505 A country breakdown for this issue both confirms and contrasts awareness of passenger rights. In Spain, Austria and Slovenia, there seems to be a clear link between respondents having seen the list of passenger rights and those who are aware of their rights. Those countries showed not only a high degree of awareness (Spain 59%, Austria 57% and Slovenia 52%), but also obtained a high score as
23 regards having seen the list (Spain and Slovenia 31%, Austria 28%). On the other hand, only 18% of the Germans have seen the list, but a noticeable 63% of German respondents are aware of their new rights. Having seen the list in the airport is therefore not necessarily the principal means Europeans use to find out about their rights as air transport passengers. There are also other sources in this regard, such as the Internet, media and direct information from the airline company. A socio-demographic analysis reveals only very slight differences and these are in line with our previous findings. Overall, it can be said that self-employed people, managers and other white collar workers are more likely to have seen the list than persons representing other less qualified occupations. There is also a clear link to the level of education of respondents: the more educated the respondents are the more likely they are to have seen the list. However, it is reasonable to assume that a major explanatory factor here is the respondent s air travel habits. Indeed, those who have seen the list share very similar characteristics with those who have heard about their rights

24 2.3 Being informed about rights by air transport companies - A significant improvement when it comes to the information provided by air transport companies - Compared with spring 2005, the results of spring 2009 are encouraging when it comes to the information on passengers rights provided by air transport companies. More than half (51%) of those who have used air transport during the past twelve months confirm that they have been informed about their rights by the air transport company they used. The notable 6 percentage point increase in awareness is in line with our findings regarding the improved level of awareness among this group of respondents
25 QG4.1 For each of the following statements related to air transport services, could you please tell me to what extent you agree or disagree? You are informed as a passenger about your rights by the air transport companies - % Total agree Air transport users in the last 12 months EU27 51% SI 79% ES 53% DE 51% IE 50% LU 50% SE 49% EL 49% UK 47% FI 46% FR 46% AT 45% NL 44% BE 43% CY 40% DK 38% *Base: those who have used air transport in the last 12 months EB71.2, n=6505 Among those who have travelled by air at some point over the last year, a countryby-country analysis shows that almost eight out of ten Slovenian passengers (79%) consider that they were well informed of their rights by air transport companies. The next highest scores are significantly lower, i.e. Spain and Germany with 53% and 51% respectively. A majority of respondents in Ireland and Luxembourg also agree that they were well informed (both 50%). This figure contrasts with the answers given by Danish respondents: only 38% believe they were given sufficient information
26 QG4.1 For each of the following statements related to air transport services, could you please tell me to what extent you agree or disagree? - % EU You are informed as a passenger about your rights by the air transport companies Agree Disagree DK EU27* 51% 44% 5% Sex Male 50% 45% 5% Female 51% 43% 6% Age % 50% 4% % 46% 4% % 41% 7% % 43% 5% Education (End of) 15-52% 41% 7% % 44% 5% % 46% 4% Still studying 47% 48% 5% Respondent occupation scale Self-employed 53% 41% 6% Managers 53% 44% 3% Other white collars 49% 45% 6% Manual workers 52% 44% 4% House persons 47% 42% 11% Unemployed 44% 49% 7% Retired 51% 43% 6% Students 47% 48% 5% Subjective urbanisation Rural village 49% 46% 5% Small/ mid size town 50% 45% 5% Large town 52% 42% 6% Difficulties paying bills Most of the time 51% 45% 4% From time to time 52% 42% 6% Almost never/ never 50% 45% 5% *Base: those who have used air transport in the last 12 months EB71.2, n=6505 Again, a socio-demographic breakdown does not reveal interesting differences. With regard to gender, only a marginal difference can be seen with a majority of both men (50%) and women (51%) considering that they were informed of their rights by the air transport companies. Respondents aged (52%) and 55+ (52%) are the most positive regarding the information provided to air passengers both categories exceeding half of respondents. A majority (50%) of those between 25 and 39 years of age, but only 46% of young respondents aged feel that they were sufficiently informed as air travellers
27 Education does not appear to have any significant influence in this regard. Those who are still studying (47%) feel that they are least informed by air transport companies, while the age group with the highest percentage who agree that they are well-informed is that of those who left school before the age of 15 (52%). The latter group also has the largest proportion of don t know replies (7%). Moving on to the respondent s occupational status, we see that more than half of those working as managers and self-employed people (both 53%) feel that they are sufficiently informed by companies when travelling by air. However, a closer look at the results shows that only 44% of the unemployed feel they are well-informed in this regard. House persons, on the other hand, are the most undecided on this issue as 11% of them felt unable to express an opinion. Urbanisation and the respondent s financial situation are less relevant here. Respondents living in large towns feel that they are more informed (52%) and those that live in rural areas feel slightly less so (49%). Respondents saying they have difficulties paying bills from time to time (52%) are the most confident group as regards information by air companies. This figure falls only slightly among those who declare that they never or almost never have difficulties paying their bills (50%)

28 3. SATISFACTION WITH AIR TRAVEL To understand the extent of satisfaction with air travel, the respondents were polled on various aspects that can be used to assess the quality of services received. First, we will analyse the satisfaction of travellers with the treatment they receive when they suffer an inconvenience. We will also focus on the satisfaction of travellers with the different service parameters. After that, we will focus on their opinion concerning luggage handling. Finally, we will see how satisfied Europeans are with the clarity of airline prices. 3.1 Satisfaction with treatment in the case of inconvenience - More than half agree they receive satisfactory treatment when things do not go as scheduled - The majority of those who have used air transport services in the past twelve months (52%) agreed that the treatment they receive from the company when things do not go as scheduled is satisfactory. This opinion shows practically no change since spring To get a better picture of the situation we chose to focus only on passengers who experienced such an inconvenience when travelling by air in the last year 4. Overall, 19% of recent air travellers indicated they had suffered an inconvenience. This group of people were, not surprisingly, less satisfied with the treatment they 4 QG7a During the last twelve months, have you had to put up with a cancellation, a long delay, a denied boarding or loss\ damage of your luggage? Those who answered yes: overall 1223 respondents
29 received: only 46% of those agreed that the handling of the problem was satisfactory, whereas a slightly larger proportion (48%) disagreed. A country-by-country analysis shows that among respondents who have used air transport over the last twelve months, Austrians (61%) are mostly satisfied with the treatment they received when things did not go as scheduled, followed by travellers from the Netherlands (60%) and Spain (58%). Levels of satisfaction are lower in Slovenia (49%), the UK (48%), France, Luxembourg (both 41%) and particularly Ireland (38%), with scores below, or much below, the EU average of 52%. QG4.3 For each of the following statements related to air transport services, could you please tell me to what extent you agree or disagree? The treatment you receive from the company when things do not go as scheduled is satisfactory - % Total agree Air transport users in the last 12 months EU27 52% AT 61% NL 60% ES 58% EL 57% FI 56% CY 54% DE 54% SE 52% BE 51% DK 50% SI 49% UK 48% FR 41% LU 41% IE 38% *Base: those who have used air transport in the last 12 months EB71.2, n=
30 QG4.3 For each of the following statements related to air transport services, could you please tell me to what extent you agree or disagree? - % EU The treatment you receive from the company when things do not go as scheduled is satisfactory Agree Disagree DK EU27* 52% 34% 14% Sex Male 52% 35% 13% Female 50% 35% 15% Age % 37% 13% % 37% 12% % 34% 14% % 32% 16% Education (End of) 15-55% 29% 16% % 36% 12% % 35% 14% Still studying 48% 37% 15% Respondent occupation scale Self-employed 51% 37% 12% Managers 52% 38% 15% Other white collars 47% 38% 15% Manual workers 54% 33% 13% House persons 50% 33% 17% Unemployed 53% 32% 15% Retired 54% 29% 17% Students 48% 37% 15% Subjective urbanisation Rural village 52% 33% 15% Small/ mid size town 50% 38% 12% Large town 54% 32% 14% Difficulties paying bills Most of the time 50% 33% 17% From time to time 50% 39% 11% Almost never/ never 52% 34% 14% *Base: those who have used air transport in the last 12 months EB71.2, n=6505 A socio-demographic analysis reveals unusually high levels of don t know across the board, with low double digit figures for all categories. This may be an indication of respondents not being familiar with journeys that do not go as scheduled. With regard to gender, slightly more male respondents (52%) than female respondents (50%) stated that they are satisfied with the treatment they received when their journey did not go as planned. Those aged 40 to 54, and those aged 55 or over, are the most satisfied (both 52%). The least satisfied are those in the age group, where 50% declared that they were satisfied. This figure still outweighs the number of respondents feeling unsatisfied (37%). When it comes to occupation, manual workers and retired people are the most satisfied (both 54%), closely followed by unemployed people (53%). Other white
31 collar workers (47%) and students (48%) are less satisfied. A large proportion of house persons and retired people felt unable to express an opinion on the matter (both 17%). Turning to urbanisation, the results show that those living in small/medium-sized towns are the least satisfied with the service in case of problems (50%) while this figure is slightly higher among those living in larger towns (54%). The respondent s financial situation does not seem to have any significant influence as regards satisfaction with services offered when things do not go according to plan. Those who never or almost never have difficulties paying bills (52%) are only marginally more satisfied than those less financially secure (both 50%).This might suggest that once a person has purchased services his/ her expectations do not really depend on his/her financial background
32 3.2 Satisfaction with service parameters - Satisfaction is lowest as regards compensation offered in case of service failures - Overall, there is a European consensus among recent air travellers that punctuality and comfort are satisfactory, (80% and 76% respectively). The results are less clear-cut when it comes to the information provided in case of delays or cancellations and lost, damaged or delayed luggage and the compensation provided in the event of service failures. However, it is not correct to conclude that recent air passengers are less satisfied with these three issues, they are just not able to take a position on them, resulting in a much higher proportion of don t know answers on the issues in question. QG5.1 For each of the following elements regarding air transport services, would you say that, in general, you are very satisfied, rather satisfied, rather unsatisfied or not at all satisfied with it? Base : Those who traveled with air transport in the last 12 months = 6505 Punctuality 80% Comfort 76% Information in case of delays or cancellations 63% Information in case of loss, damage or delay of luggage 46% Compensation offered in case of service failures 37% Again, it is worth looking at the answers from the group of people who have suffered an inconvenience in the last year 5. These respondents were the most satisfied with the responses they received: 67% of them claimed to be satisfied, while 33% claimed to be dissatisfied. 5 QG7a During the last twelve months, have you had to put up with a cancellation, a long delay, a denied boarding or loss/damage of your luggage? Those who answered yes: overall 1223 respondents
33 The level of satisfaction is similar with regard to the punctuality of flights: 65% were satisfied, whereas 34% claimed to be dissatisfied. Considerably fewer (50%) are satisfied with the information provided in the event of delays or cancellations. The satisfaction level is even worse when it comes to the information provided in the event of lost, damaged or delayed luggage. On this issue only 36% of those who have suffered an inconvenience in the past year said that they were satisfied. More than half of this group of people (51%) claimed not to be satisfied with this service parameter. Not surprisingly, this group of respondents is the least satisfied with the compensation offered in case of service failures (30%).The above results show that there is a strong need for air transport companies to improve their compensation policies and their communication strategy regarding inconveniencies
34 Again the socio-demographic analysis does not reveal important divergences. Amongst recent air travellers, 82% of women and 80% of men are satisfied with the punctuality of air services. When respondents are classified according to age, we find that those aged 55 or over are the most satisfied (83%), whereas those in the age bracket are the least content (77%). QG5.1 For each of the following elements regarding air transport services, would you say that, in general, you are very satisfied, rather satisfied, rather unsatisfied or not at all satisfied with it? - % EU Punctuality Satisfied Not satisfied DK EU27* 80% 18% 2% Sex Male 80% 18% 2% Female 82% 16% 2% Age % 22% 1% % 17% 2% % 18% 1% % 16% 1% Education (End of) 15-85% 14% 1% % 19% 1% % 19% 2% Still studying 82% 16% 2% Respondent occupation scale Self-employed 79% 19% 2% Managers 84% 15% 1% Other white collars 80% 19% 1% Manual workers 79% 19% 2% House persons 79% 18% 3% Unemployed 82% 16% 2% Retired 84% 14% 2% Students 78% 21% 1% Subjective urbanisation Rural village 80% 19% 1% Small/ mid size town 81% 18% 1% Large town 80% 17% 3% Difficulties paying bills Most of the time 80% 18% 2% From time to time 77% 21% 2% Almost never/ never 83% 16% 1% *Base: those who have used air transport in the last 12 months EB71.2, n=6505 When it comes to education, this factor does not seem to have too much influence on the respondent s degree of satisfaction. Those who finished their studies before the age of 15 are the most satisfied (85%) while those who finished their studies between the ages of 16-19, or studied beyond the age of 20 are the least satisfied (80%) Subjective urbanization also appears to be relatively irrelevant when it comes to satisfaction with air transport punctuality
35 The occupation scale reveals more variations. Managers and retired people (both 84%) are the most satisfied with air transport punctuality, while students (78%) are the least pleased. As many as 21% of students are dissatisfied
 found this service satisfactory.")

36 3.3 Satisfaction with luggage handling - A third of respondents are not satisfied with luggage handling - The survey also asked about levels of satisfaction with luggage handling. Results show that the majority of recent air travellers were pleased with the way their luggage was handled: indeed, almost seven out of ten respondents (67%) found this service satisfactory. Some 30% were dissatisfied, while 3% do not have an opinion on the matter. Despite these positive findings, the survey results show a slight negative change: the level of satisfaction with luggage handling has fallen by 3 percentage points since EB63.2 in March Wording question from EB63.2 slightly modified; QB15. For each of the following elements regarding air transport services, would you say that, in general, you are very satisfied, rather satisfied, rather unsatisfied or not satisfied at all with it? 5. Baggage handling

 found this information unclear. A further 5% feel undecided about this matter.")
37 3.4 Satisfaction with the clarity of pricing - A majority of respondents find price information unclear - Finally, the survey also measures levels of satisfaction with pricing information. Base; All respondents EB71.2, n=26756 The results show that there is still much to be done when it comes to information about air transport prices: only 43% of those who travelled by air over the last year said that prices were indicated in a clear manner, whereas a majority (52%) found this information unclear. A further 5% feel undecided about this matter. These results might suggest that there is a strong need to tackle the pricing policies of certain air transport companies
38 QG9 Do you think prices are indicated unambiguously for air transport? - % EU Yes No DK EU27* 43% 52% 5% Sex Male 41% 54% 5% Female 45% 50% 5% Age % 52% 7% % 54% 4% % 52% 4% % 50% 7% Education (End of) 15-48% 43% 9% % 53% 4% % 55% 4% Still studying 41% 50% 9% Respondent occupation scale Self-employed 41% 55% 4% Managers 43% 54% 3% Other white collars 47% 50% 3% Manual workers 42% 50% 3% House persons 42% 53% 5% Unemployed 35% 62% 3% Retired 44% 48% 8% Students 41% 50% 9% Subjective urbanisation Rural village 45% 49% 6% Small/ mid size town 41% 54% 5% Large town 42% 53% 5% Difficulties paying bills Most of the time 45% 47% 8% From time to time 43% 52% 5% Almost never/ never 42% 53% 5% *Base: all respondents EB71.2, n=26756 A socio-demographic breakdown reveals some interesting differences, even if the variation is relatively small. With regard to gender, slightly more women (45%) than men (41%) think that air transport prices are indicated unambiguously. Turning to age, respondents aged are the most confident in this respect with 44% of them saying that prices are well-indicated. The most sceptical are those aged 15-24, since only 41% of them answered that prices are indicated clearly. Among those who finished their studies before the age of 15, 48% agree that prices are well indicated, whereas only 41% of those who studied beyond the age of 20 and those who are still studying share the same view. The respondent s occupation reveals greater differences. Unemployed people are the most sceptical, with only 35% of respondents from this group declaring that
39 they find that prices are clearly indicated. Other white collars workers are the most confident group with 47% of these respondents answering that they found air transport prices unambiguous. A relatively large proportion of students (9%) feel undecided about the matter. Respondents living in rural areas (45%) trust air transport prices more than those living in large- and small/mid-size towns (42% and 41% respectively), notwithstanding the fact that rural dwellers are the ones that seem to know the least about their rights as air passengers. Moreover, there are few differences according to the respondent s financial situation. Those who have difficulties paying their bills all the time are slightly more confident as to the clarity of air transport prices (45%) than those who never or almost never have difficulties paying their bills (42%)
40 4. THE LINK BETWEEN THE LEVEL OF INFORMATION AND SATISFACTION WITH SERVICE RECEIVED Having studied the use by Europeans of air transport, their level of information and satisfaction with air transport, it is interesting to explore how awareness of rights relates to the quality of service received. Do well-informed passengers receive a better service than those who are not as aware of their rights? Alternatively, is there no correlation whatsoever between the two factors? To answer this we shall examine first of all the overall picture for each parameter. 4.1 Degree of information and awareness of rights Several questions in the survey were asked in order to assess the level of information and awareness of Europeans regarding their rights as air transport passengers and their use of the said rights. 7 Up to this point we have treated these items separately, thereby obtaining an informative picture. Treating these items jointly we can reach a complementary understanding of how well-informed Europeans are in general about their rights with respect to air transport. To achieve this, all questions regarding levels of awareness and information are first rescaled so that, the higher the degree of information and awareness, the higher the score given by the respondents. This means that a respondent answering that he/she is aware of his/her rights as an air transport user scores higher than someone responding negatively. Thereafter, all items are added together. This summation of scores gives us a new variable that we have chosen to categorise into low, medium and high. The table below presents the proportion of respondents whose level of information is high. Only countries for which we have a significant base are included. 7 QG2, QG3.1-3, QG7b
41 DEGREE OF INFORMATION OF PASSENGER RIGHTS AMONG RECENT AIR TRAVELLERS High Medium Low EU27* 22% 75% 3% ES 36% 64% 0% AT 34% 63% 3% SI 33% 65% 3% CY 22% 75% 3% EL 22% 78% 0% IE 22% 73% 4% FI 21% 78% 1% UK 21% 76% 3% DE 19% 79% 2% BE 19% 78% 3% FR 18% 82% 0% LU 16% 79% 5% DK 14% 84% 2% SE 14% 83% 3% NL 13% 86% 1% *Base: those who have used air transport in the last 12 months EB71.2, n=6505 The best informed respondents tend to be in Spain (36%), closely followed by Austria (34%) and Slovenia (both 33%). The EU average (22%) indicates that more than one in five recent air travellers are well informed about their rights. By contrast, Dutch (13%), Swedes and Danes (both 14%) together with Luxembourgers (16%) all have a much lower degree of awareness of their new rights. 4.2 Level of satisfaction with service received The survey conducted includes a battery of questions 8 about the respondent s satisfaction with the services received before, during and after travelling by air. As just mentioned, a summation for these variables helps us understanding the overall level of satisfaction with air travel related services. 8 QG4.1, 3, QG5.1-5, QG7a, c, QG8a
42 DEGREE OF SATISFACTION OF SERVICES RECEIVED AMONG RECENT AIR TRAVELLERS High Medium Low EU27* 16% 79% 6% SI 24% 75% 1% AT 22% 76% 3% BE 20% 79% 1% DK 20% 77% 3% EL 20% 80% 1% SE 20% 78% 2% UK 20% 73% 7% CY 16% 79% 6% IE 16% 78% 6% FI 15% 81% 4% LU 15% 76% 7% NL 14% 81% 5% DE 13% 81% 7% FR 11% 82% 8% *Base: those who have used air transport in the last 12 months EB71.2, n=6505 Citizens in Slovenia (24%) and Austria (22%) appear to be the most satisfied air travellers, closely followed by respondents from Belgium, Denmark, Greece, Sweden and the UK (all 20%). Travellers from France (11%), Germany (13%) and the Netherlands (14%), on the other hand, appear the least satisfied with their recent air travel experience. 4.3 Link between information and service After having studied the two tables presented above, we can start to analyse the correlation between information and the quality of service received. It is to be noted that several countries which obtained high scores as regards the level of information, also recorded high levels of satisfaction with services. However, these tables only show the results for some countries and definite conclusions cannot be drawn from this. In order to reveal how the level of information relates to satisfaction with the service received at the aggregate EU level, we have cross-tabulated the two
43 abovementioned summations concerning the level of information and quality of service. As mentioned, on this point, we have studied only the situation for the EU, as the base for single countries would not be sufficient to draw any significant conclusions. TABULATION SERVICE BY INFORMATION - % WITHIN INFORMATION Quality of service EU27* Low Medium High Degree of information Low Medium High 16% 79% 5% 7% 82% 11% 1% 68% 32% *Travellers of air transport during the last 12 months. Don't knows/refusals excluded from the sample. The cross-tabulation reveals that among those who have a low level of information, a large majority (79%) received a medium-high service. A noticeable 16% of badly informed respondents rated the service provided by the airline and airport as being low and a meagre 5% perceived the service as being of a high quality. Turning to respondents with a medium-high information level, a vast majority (82%) of them feel that the service given was medium-high in quality. This is in line with the trend for the previous category, the respondents with a low level of information. However, compared with badly informed travellers, the proportion of respondents receiving a poor quality service falls to 7%. Similarly, the proportion of respondents receiving a high quality service increases to 11%. Finally, when we study air transport travellers with a high level of information, this trend becomes even more perceptible; only 1% of respondent have received low quality service and a significant 32% rate the service received as high. Even in that case the majority (68%) feel that the service received was of medium-high quality. The conclusion we can draw from the above observations is that the level of information has a significant correlation with the quality of service received. The higher the level of information, the higher the satisfaction with the service received. It is important to emphasise that we cannot conclude what is the cause and what is the effect here

44 5. COMPLAINTS CONCERNING AIR TRAVEL ISSUES 5.1 Inconvenience and complaints We previously noted that overall 19% 9 of respondents who had travelled by air in the past year had suffered from an inconvenience such as a cancellation, a long delay, denied boarding or lost/damaged luggage. Among this group of respondents, 44% had filed a complaint 10. Half of those who had filed a complaint considered that their complaint was dealt with correctly Implementation of rights - Almost no one requested the implementation of their rights - As we saw in chapter two, a large proportion of Europeans are unaware of the reinforced air passenger rights. An even larger proportion of travellers (90%) have not requested the implementation of their rights, leaving only 4% of Europeans saying that they have asked to exercise their rights. Base; All respondents EB71.2, n=26756 Looking at the answers from the group of respondents who have experience as passengers in the last twelve months, 7% requested the implementation of their rights, which is still remarkably low. 9 QG7a During the last twelve months, have you had to put up with a cancellation, a long delay, a denied boarding or loss\ damage of your luggage? 10 QG7b Have you already complained about this incident to a body in charge of complaint handling? 11 QG7c Would you say that your complaint was dealt with very well, rather well, rather badly or very badly?
45 QG3.3 The European Union has strengthened the rights of air transport passengers. Have you already? Requested the implementation of these rights - % Total Yes Air transport users in the last 12 months EU27 7% ES 16% AT 10% EL 8% BE 9% CY 7% SI 7% NL 6% FI 6% FR 6% DE 5% IE 5% DK 4% LU 4% UK 3% SE 2% *Base: those who have used air transport in the last 12 months EB71.2, n=6505 A country by country analysis of those who have used air transport within the last twelve months shows that Spaniards (16%), followed by Austrians (10%), have requested the implementation of their newly-acquired rights far more frequently than the EU average. Indeed, the EU average is as low as 7%, as travellers from most other countries have not asked for the application of their rights. The lowest percentage of such cases is found in the UK (3%) and Sweden (2%) where only a miniscule fragment of travellers have sought to exercise their rights. Several reasons may explain this low European average. A first hypothesis would be that there was no reason to request the implementation of these rights; but we have seen that 34% of those who had used air transport services in the past twelve months disagreed that the treatment they received from the company when things did not go as scheduled was satisfactory which casts some doubt on this hypothesis


46 A second and more probable reason is that there is a lack of public awareness of the issue. As has been shown, awareness among respondents who used air transport services in the past twelve months is rather low: 55% of them had not heard about their strengthened air passenger s rights. Further, it might be difficult for passengers to claim their rights when it comes to air travel. To have a clearer picture of the issue, it is useful to understand how those who had to cope with inconveniences when travelling by air stand on the matter. Among this target group, 12% had requested the implementation of their rights while 88% had not. This is clearly too low for this group of people, since a higher proportion of them know about the existence of these rights. Why, then, are they not claiming their rights? There is most probably a lack of information concerning what passengers should do. We will further elaborate on this in the next sections. 5.3 Are complaints procedures efficient? - Filing complaints is seen as an efficient means of improving air transport services - As previously shown only a minor proportion of respondents requested the implementation of their rights as air passengers. This picture is now supplemented by the views of respondents about the efficiency of making suggestions or filing complaints in improving air transport services. Base; All respondents EB71.2, n=


47 Although only a small proportion of the respondents had previously complained, we see that European public opinion leans towards the idea that filing complaints or making suggestions is an efficient means of improving air transport services. A majority of 53% of Europeans agree on this issue. The percentage is as high as 75% when the don t know answers are excluded. Among those who travelled by plane in the last twelve months, almost seven out of ten (69%) believe that making suggestions or filing complaints is an efficient way of improving air transport services. Here again, the exclusion of the don t know answers from the results allows us to focus on those who have an opinion on the question. We find that the results are in line with those for the entire population, with a difference of only 2 percentage points (73%). Given the fact that only 7% of recent air travellers have requested the implementation of their rights, it is somewhat surprising that a vast majority of 69% agree that, in theory, filing complaints is an efficient means of improving transport services. There is clearly a gap between what respondents see as theoretically viable and what they deem as reasonable in practice
48 QG4.2 For each of the following statements related to air transport services, could you please tell me to what extent you agree or disagree? Making suggestions or filing complaints is an efficient means of improving air transport services - % Total Yes Air transport users in the last 12 months EU27 69% CY 92% NL 82% AT 79% EL 78% ES 74% LU 73% SI 73% BE 72% DE 70% IE 64% UK 64% FI 63% DK 62% SE 61% FR 58% *Base: those who have used air transport in the last 12 months EB71.2, n=6505 A country comparison reveals significant differences. The very large proportion of Cypriots (92%) who think that making suggestions or making complaints is an efficient means of improving air transport services is well above the EU average at 69%. The Netherlands comes next with 82% of respondents trusting such means as improving air transport while 79% of Austrians, 78% of Greeks as well as 74% of Spaniards are also of the same opinion. French respondents regard making suggestions and filing complaints as a less efficient way of improving air transport services as only 58% of them think that it is a useful means of achieving that goal. The Scandinavian countries also attach relatively little weight to this procedure
49 QG4.2 For each of the following statements related to air transport services, could you please tell me to what extent you agree or disagree? - % EU Making suggestions or filing complaints is an efficient means of improving air transport services Agree Disagree DK EU27* 53% 18% 29% Sex Male 55% 19% 26% Female 51% 17% 32% Age % 19% 26% % 21% 25% % 18% 26% % 16% 36% Education (End of) 15-46% 15% 39% % 18% 30% % 20% 20% Still studying 56% 18% 26% Respondent occupation scale Self-employed 60% 17% 23% Managers 64% 22% 14% Other white collars 58% 20% 22% Manual workers 53% 19% 28% House persons 49% 15% 36% Unemployed 48% 48% 34% Retired 45% 15% 26% Students 56% 18% 26% Subjective urbanisation Rural village 48% 18% 34% Small/ mid size town 54% 17% 29% Large town 56% 20% 24% Difficulties paying bills Most of the time 48% 15% 37% From time to time 51% 18% 31% Almost never/ never 54% 19% 27% *Base: All respondents EB71.2, n=26756 A socio-demographic breakdown shows interesting differences and reveals that significant proportions of respondents feel unable to express an opinion on the matter. For some categories, this figure is over a third of the sample. As regards gender, slightly more men (55%) than women (51%) think that making suggestions or filing complaints is an efficient means of improving air transport services than women. The don t know rate among women is high, with almost a third (32%) being unable to form an opinion. Age appears to be more relevant in this regard: those aged have the most confidence in this kind of system (56%), closely followed by those aged
50 (55%) and those aged (54%). The percentage is somewhat more modest for those aged 55 or over (48%). This latter group also has a very large proportion of don t know answers (36%). The respondent s level of education and occupational status also appear to be relatively important in shaping the respondent s attitude to filing complaints. Those who left school before the age of 15 (46%) are the least likely to trust such procedures, whereas those who studied beyond the age of 20 are the most likely to trust them (60%). An analysis based on the occupation of respondents reveals even wider variations. A large proportion of managers (64%) and self-employed people (60%) trust this method of improving services, while only 45% of retired people and 48% of unemployed people feel the same. Managers are also the group with the lowest number of don t know answers (14%). Moreover, 56% of those living in large towns said that they trust such systems while only 48% of those living in rural areas trust them. Turning to the respondent s financial situation, we can see that those who have difficulties paying their bills most of the time do not trust in particular such systems (only 48% said that they agree they are an efficient means of improving air transport services). A slightly larger proportion of those who have difficulties paying their bills from time to time (51%), and those who never or almost never have difficulties paying bills (54%) agree that filing complaints is an efficient means of redress. In other words, a slight majority of the latter two categories agree that filing complaints does help to improve transport services. At the same time, a staggering 37% of those who have problems paying their bills most of the time do not know what to think about the matter. 5.4 Contacts when filing a complaint - A clear majority would focus on the airline company in order to exercise their rights - A large segment of respondents from the total population (61%) think that in the event of a problem regarding a cancelled or delayed flight they would contact the airline company in order to exercise their rights. A further 16% would contact a consumer association, 12% would contact the national authority in charge of the application of passenger rights, 9% would contact the Civil Aviation Authority and 6% would contact a lawyer. Once again the number of don t know answers is relatively high (20%)
51 QG6 Which of the following services would you contact in case of a problem of cancellation or delay of your flight in order to obtain your rights? Total population (26756) 84% Air transport users in the last year (6505) 61% 16% 21% 12% 15% 13% 9% 6% 8% 7% 20% 1% 1% 2% 2% The airline company A consumer association The national The civil aviation authority in authority charge of the application of passanger rights Lawyers Other None (SPONTANEOUS) (Spontaneous) Don't know The second bar in the above chart represents the opinion of those respondents who used air transport in the last year. We can see that the ranking of the different services to contact is identical. 84% of air transport users would contact the airline company, 21% would contact a consumer association, 15% would contact the national authority in charge of the application of passenger rights, 13% would contact the Civil Aviation Authority and 8% would contact a lawyer. The results of this question support the previous findings of this research. The responses suggest that respondents would focus on the airline company in order to obtain their rights. It is obvious that people might not trust the airline company involved in an issue to make an objective judgment of the situation. This is probably one of the reasons why such a small proportion of people are currently claiming their rights. It is also obvious that at the current time people do not think of turning to a neutral body such as the national authority in charge of the application of passengers' rights to file a complaint. The number of complaints would probably go up if people did think of these authorities and could contact them more easily

 have not been able to form an opinion on the matter.")
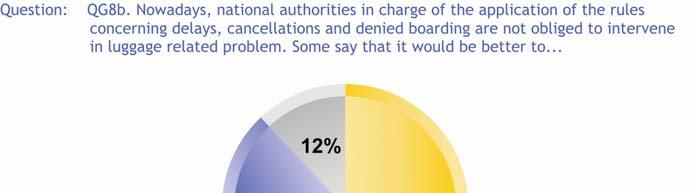
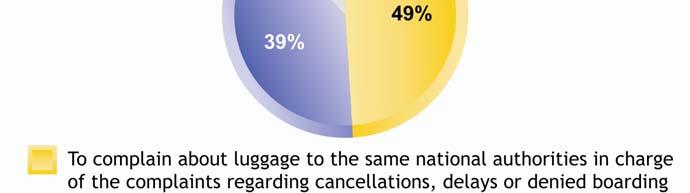
52 Base; All respondents EB71.2, n=26756 People are also looking for easier ways to complain. Overall, 38% agreed that it would be better to complain about luggage to the same national authorities in charge of complaints regarding cancellations, delays or when boarding is denied, whereas 29% would prefer the associations currently in charge of problems related to luggage. It should also be noted that a large proportion of Europeans (33%) have not been able to form an opinion on the matter. Nevertheless, these results indicate a preference for a single, national contact body for filing complaints. There is almost an absolute majority for this solution if we narrow the group of respondents to those who have used air transport during the last year
53 - 51 -
54 CONCLUSION This report helps us to gain a better understanding of the use made by European citizens of different transport methods and of their opinions and attitudes with regard to their rights as passengers, with a special focus on air travel. One of our main findings is that Europeans are inadequately informed about their rights and obligations when travelling with an EU-registered carrier. The respondents are similarly unaware of their reinforced rights pursuant to Regulation [EC] 261/2004. Even when studying only those respondents who have travelled by air at some point over the last 12 months (22% of the sample), a majority of them are relatively unaware of their contractual rights. Turning to the perception of different service parameters, our analysis reveals that the majority of European travellers are satisfied with the punctuality and comfort of flights. Luggage handling is also considered satisfactory, albeit to a lesser extent. On the other hand, respondents are dissatisfied with the information they are provided with when they suffer an inconvenience and especially with the compensation they receive in such cases. Furthermore, a majority of the interviewees found information about air ticket prices ambiguous. The study shows that there is a clear link between the passenger s level of awareness of his/her rights and the satisfaction with the services received when travelling by air. The data indicates that the higher the degree of awareness, the higher the quality of services received. Although we cannot come to a definite conclusion about what is the cause and what is the effect here, it appears reasonable to aim for higher information levels and thereby also achieve a higher quality of service. Moreover, it is to be noted that Europeans think that filing complaints or making suggestions can contribute towards improving air transport services. Most respondents would contact the air transport company for such claims, but the survey also indicates a preference for a single, streamlined authority to handle complaints. Indeed, the discrepancy between the low frequency with which passengers request the implementation of their rights and the repeated dissatisfaction with the services received, indicates a need to streamline procedures and raise awareness about enforcement bodies. A viable solution is an accessible national authority which would deal with all the different types of passenger problems that may occur in connection with air transport
55 ANNEXES
56 TECHNICAL SPECIFICATIONS
57 EUROBAROMETER 71.2 TECHNICAL SPECIFICATIONS Between the 25 th of May and the 17 th of June 2009, TNS Opinion & Social, a consortium created between TNS plc and TNS opinion, carried out wave 71.2 of the EUROBAROMETER, on request of the EUROPEAN COMMISSION, Directorate-General for Communication, Research and Political Analysis. The SPECIAL EUROBAROMETER N 319 is part of wave 71.2 and covers the population of the respective nationalities of the European Union Member States, resident in each of the Member States and aged 15 years and over. The basic sample design applied in all states is a multi-stage, random (probability) one. In each country, a number of sampling points was drawn with probability proportional to population size (for a total coverage of the country) and to population density. In order to do so, the sampling points were drawn systematically from each of the "administrative regional units", after stratification by individual unit and type of area. They thus represent the whole territory of the countries surveyed according to the EUROSTAT NUTS II (or equivalent) and according to the distribution of the resident population of the respective nationalities in terms of metropolitan, urban and rural areas. In each of the selected sampling points, a starting address was drawn, at random. Further addresses (every Nth address) were selected by standard "random route" procedures, from the initial address. In each household, the respondent was drawn, at random (following the "closest birthday rule"). All interviews were conducted face-to-face in people's homes and in the appropriate national language. As far as the data capture is concerned, CAPI (Computer Assisted Personal Interview) was used in those countries where this technique was available. ABBREVIATIONS COUNTRIES INSTITUTES N FIELDWORK POPULATION INTERVIEWS DATES 15+ BE Belgium TNS Dimarso /05/ /06/ BG Bulgaria TNS BBSS /05/2009 8/06/ CZ Czech Rep. TNS Aisa /05/ /06/ DK Denmark TNS Gallup DK /05/ /06/ DE Germany TNS Infratest /05/ /06/ EE Estonia Emor /05/ /06/ IE Ireland TNS MRBI /05/ /06/ EL Greece TNS ICAP /05/ /06/ ES Spain TNS Demoscopia /05/ /06/ FR France TNS Sofres /05/ /06/ IT Italy TNS Infratest /05/ /06/ CY Rep. of Cyprus Synovate /05/ /06/ LV Latvia TNS Latvia /05/ /06/ LT Lithuania TNS Gallup Lithuania /05/ /06/ LU Luxembourg TNS ILReS /05/ /06/ HU Hungary TNS Hungary /05/ /06/ MT Malta MISCO /05/ /06/ NL Netherlands TNS NIPO /05/ /06/ AT Austria Österreichisches Gallup-Institut /05/ /06/ PL Poland TNS OBOP /05/ /06/ PT Portugal TNS EUROTESTE /05/ /06/ RO Romania TNS CSOP /05/ /06/ SI Slovenia RM PLUS /05/ /06/ SK Slovakia TNS AISA SK /05/ /06/ FI Finland TNS Gallup Oy /05/ /06/ SE Sweden TNS GALLUP /05/ /06/ UK United Kingdom TNS UK /05/ /06/ TOTAL /05/ /06/


58 For each country a comparison between the sample and the universe was carried out. The Universe description was derived from Eurostat population data or from national statistics offices. For all countries surveyed, a national weighting procedure, using marginal and intercellular weighting, was carried out based on this Universe description. In all countries, gender, age, region and size of locality were introduced in the iteration procedure. For international weighting (i.e. EU averages), TNS Opinion & Social applies the official population figures as provided by EUROSTAT or national statistic offices. The total population figures for input in this post-weighting procedure are listed above. Readers are reminded that survey results are estimations, the accuracy of which, everything being equal, rests upon the sample size and upon the observed percentage. With samples of about 1,000 interviews, the real percentages vary within the following confidence limits: Observed percentages 10% or 90% 20% or 80% 30% or 70% 40% or 60% 50% Confidence limits ± 1.9 points ± 2.5 points ± 2.7 points ± 3.0 points ± 3.1 points
PUBLIC PERCEPTIONS OF VAT
 Special Eurobarometer 424 PUBLIC PERCEPTIONS OF VAT REPORT Fieldwork: October 2014 Publication: March 2015 This survey has been requested by the European Commission, Directorate-General for Taxations and
Flash Eurobarometer 398 WORKING CONDITIONS REPORT
 Flash Eurobarometer WORKING CONDITIONS REPORT Fieldwork: April 2014 Publication: April 2014 This survey has been requested by the European Commission, Directorate-General for Employment, Social Affairs
Special Eurobarometer 418 SOCIAL CLIMATE REPORT
 Special Eurobarometer 418 SOCIAL CLIMATE REPORT Fieldwork: June 2014 Publication: November 2014 This survey has been requested by the European Commission, Directorate-General for Employment, Social Affairs
Flash Eurobarometer 470. Report. Work-life balance
 Work-life balance Survey requested by the European Commission, Directorate-General for Justice and Consumers and co-ordinated by the Directorate-General for Communication This document does not represent
Flash Eurobarometer 408 EUROPEAN YOUTH REPORT
 Flash Eurobarometer EUROPEAN YOUTH REPORT Fieldwork: December 2014 Publication: April 2015 This survey has been requested by the European Commission, Directorate-General for Education and Culture and co-ordinated
Fieldwork February March 2008 Publication June 2008
 Special Eurobarometer 297 European Commission Attitudes towards radioactive waste Fieldwork February March 2008 Publication June 2008 Report Special Eurobarometer 297 / Wave 69.1 TNS Opinion & Social This
Europeans knowledge of economic indicators
 Special Eurobarometer 323 European Commission Europeans knowledge of economic indicators Fieldwork: August - September 2009 Publication: January 2010 Special Eurobarometer 323 / Wave 72.1 TNS Opinion &
Flash Eurobarometer 386 THE EURO AREA REPORT
 Eurobarometer THE EURO AREA REPORT Fieldwork: October 2013 Publication: November 2013 This survey has been requested by the European Commission, Directorate-General for Economic and Financial Affairs and
Flash Eurobarometer 458. Report. The euro area
 The euro area Survey requested by the European Commission, Directorate-General for Economic and Financial Affairs and co-ordinated by the Directorate-General for Communication This document does not represent
Fieldwork February March 2008 Publication October 2008
 Special Eurobarometer 298 European Commission Consumer protection in the internal market Fieldwork February March 2008 Publication October 2008 Report Special Eurobarometer 298 / Wave 69.1 TNS Opinion
Flash Eurobarometer N o 189a EU communication and the citizens. Analytical Report. Fieldwork: April 2008 Report: May 2008
 Gallup Flash Eurobarometer N o 189a EU communication and the citizens Flash Eurobarometer European Commission Expectations of European citizens regarding the social reality in 20 years time Analytical
Europeans attitudes towards the issue of sustainable consumption and production. Analytical report
 Flash Eurobarometer 256 The Gallup Organisation Analytical Report Flash EB N o 251 Public attitudes and perceptions in the euro area Flash Eurobarometer European Commission Europeans attitudes towards
Social climate. Fieldwork May-June 2009 Publication January 2010
 Special Eurobarometer European Commission Social climate Full report Fieldwork May-June 2009 Publication January 2010 Special Eurobarometer 315 / Wave - European Opinion Research Group EEIG This survey
New Europeans. Fieldwork : March 2010 April 2010 Publication: April 2011
 Special Eurobarometer European Commission New Europeans Report Fieldwork : March 2010 April 2010 Publication: April 2011 Special Eurobarometer 346 / Wave TNS Opinion & Social This survey was requested
SOLIDARITY THAT SPANS THE GLOBE: EUROPEANS AND DEVELOPMENT AID
 Special Eurobarometer 392 SOLIDARITY THAT SPANS THE GLOBE: EUROPEANS AND DEVELOPMENT AID REPORT Fieldwork: June 2012 Publication: October 2012 This survey has been requested by Directorate-General Development
Attitudes of Europeans Towards Tourism REPORT
 Flash Eurobarometer Attitudes of Europeans Towards Tourism REPORT Fieldwork: January 22 Publication: March 22 This survey has been requested by the Directorate-General Enterprise and co-ordinated by Directorate-
Employment and Social Policy
 Special Eurobarometer 377 European Commission Employment and Social Policy REPORT Special Eurobarometer 377 / Wave TNS opinion & social Fieldwork: September October 2011 Publication: December 2011 This
Standard Eurobarometer
 Standard Eurobarometer 67 / Spring 2007 Standard Eurobarometer European Commission SPECIAL EUROBAROMETER EUROPEANS KNOWELEDGE ON ECONOMICAL INDICATORS 1 1 This preliminary analysis is done by Antonis PAPACOSTAS
Vocational Training. Fieldwork October-November 2004 Publication August 2005
 Special Eurobarometer European Commission Vocational Training Fieldwork October-November 2004 Publication August 2005 Special Eurobarometer 216 / Wave 62..1 TNS Opinion & Social This survey was requested
0pinions on organised, cross-border crime and corruption
 Special Eurobarometer European Commission 0pinions on organised, cross-border crime and corruption Fieldwork: November - December 2005 Publication: March 2006 Special Eurobarometer 245 / Wave 64.3 TNS
Safer Internet. Fieldwork Dec Jan 2006 Publication May 2006
 Special Eurobarometer European Commission Safer Internet Fieldwork Dec 2005 - Jan 2006 Publication May 2006 Special Eurobarometer 250 / Wave 64.4 TNS Opinion & Social This survey was requested by Directorate
Flash Eurobarometer 458. The euro area
 The euro area Survey requested by the European Commission, Directorate-General for Economic and Financial Affairs and co-ordinated by the Directorate-General for Communication This document does not represent
Two years to go to the 2014 European elections European Parliament Eurobarometer (EB/EP 77.4)
") Directorate-General for Communication PUBLIC OPINION MONITORING UNIT Brussels, 23 October 2012. Two years to go to the 2014 European elections European Parliament Eurobarometer (EB/EP 77.4) FOCUS ON THE
Directorate-General for Communication PUBLIC OPINION MONITORING UNIT Brussels, 23 October 2012. Two years to go to the 2014 European elections European Parliament Eurobarometer (EB/EP 77.4) FOCUS ON THE
Europeans and the Common Agricultural Policy
 Special Eurobarometer European Commission Europeans and the Common Agricultural Policy Fieldwork October - November 2005 Publication January 2006 Special Eurobarometer 242 / Wave 64.2 - TNS Opinion & Social
Eco-label Flower week 2006
 Special Eurobarometer European Commission Eco-label Flower week 2006 Fieldwork: November-December 2006 Publication: January 2007 Special Eurobarometer 275 / Wave 66.3 TNS Opinion & Social This survey was
Flash Eurobarometer 441. Report. European SMEs and the Circular Economy
 European SMEs and the Circular Economy Survey requested by the European Commission, Directorate-General Environment and co-ordinated by the Directorate-General for Communication This document does not
October 2010 Euro area unemployment rate at 10.1% EU27 at 9.6%
 STAT//180 30 November 20 October 20 Euro area unemployment rate at.1% EU27 at 9.6% The euro area 1 (EA16) seasonally-adjusted 2 unemployment rate 3 was.1% in October 20, compared with.0% in September 4.
Special Eurobarometer 459. Report. Climate change
 Climate change Survey requested by the European Commission, Directorate-General for Climate Action and co-ordinated by the Directorate- General for Communication This document does not represent the point
EUROBAROMETER 71. Fieldwork: June - July 2009 Publication: January 2010
 EUROBAROMETER 66 Standard Eurobarometer Report European Commission EUROBAROMETER 71 Future of Europe Fieldwork: June - July 2009 Publication: January 2010 Standard Eurobarometer 71/ Spring 2009 - TNS Opinion
Special Eurobarometer 465. Gender Equality 2017
 Summary Gender Equality 01 Gender Pay Gap Survey requested by the European Commission, Directorate-General for Justice and Consumers and co-ordinated by the Directorate-General for Communication This document
Active Ageing. Fieldwork: September November Publication: January 2012
 Special Eurobarometer 378 Active Ageing SUMMARY Special Eurobarometer 378 / Wave EB76.2 TNS opinion & social Fieldwork: September November 2011 Publication: January 2012 This survey has been requested
Europeans attitudes towards climate change. Report. Special Eurobarometer 300. Fieldwork March April 2008 Publication September 2008
 Special Eurobarometer 300 EUROPEAN PARLIAMENT European Commission Europeans attitudes towards climate change Fieldwork March April 2008 Publication September 2008 Report Special Eurobarometer 300 / Wave
Parlemeter - November 2012 European Parliament Eurobarometer (EB/EP 78.2)
") Directorate-General for Communication Public Opinion Monitoring Unit Parlemeter - November European Parliament Eurobarometer (EB/EP 78.2) ANALYTICAL SYNTHESIS Brussels, 14 February 2013. Coverage: Population:
Directorate-General for Communication Public Opinion Monitoring Unit Parlemeter - November European Parliament Eurobarometer (EB/EP 78.2) ANALYTICAL SYNTHESIS Brussels, 14 February 2013. Coverage: Population:
European Employment and Social Policy
 Special Eurobarometer European Commission European Employment and Social Policy Report Fieldwork : May 2009 June 2009 Publication: September 2009 Special Eurobarometer 316 / Wave 71.2 TNS Opinion & Social
Fieldwork November - December 2009 Publication June 2010
 Special Eurobarometer 337 European Commission Geographical and labour market mobility Report Fieldwork November - December 2009 Publication June 2010 Special Eurobarometer 337 / Wave TNS Opinion & Social
Social Protection and Social Inclusion in Europe Key facts and figures
 MEMO/08/625 Brussels, 16 October 2008 Social Protection and Social Inclusion in Europe Key facts and figures What is the report and what are the main highlights? The European Commission today published
Eurofound in-house paper: Part-time work in Europe Companies and workers perspective
 Eurofound in-house paper: Part-time work in Europe Companies and workers perspective Presented by: Eszter Sandor Research Officer, Surveys and Trends 26/03/2010 1 Objectives Examine the patterns of part-time
January 2010 Euro area unemployment rate at 9.9% EU27 at 9.5%
 STAT//29 1 March 20 January 20 Euro area unemployment rate at 9.9% EU27 at 9.5% The euro area 1 (EA16) seasonally-adjusted 2 unemployment rate 3 was 9.9% in January 20, the same as in December 2009 4.
Pan-European opinion poll on occupational safety and health
 REPORT Pan-European opinion poll on occupational safety and health Results across 36 European countries Final report Conducted by Ipsos MORI Social Research Institute at the request of the European Agency
Fieldwork: October 2006 Report: December 2006
 Flash Eurobarometer European Commission Business attitudes towards cross-border sales and consumer protection Summary Fieldwork: October 2006 Report: December 2006 Flash Eurobarometer 186 The Gallup Organization
Introduction of the euro in the new member states
 EOS Gallup Europe Introduction of the euro in the new member states - Report p. 1 Introduction of the euro in the new member states Conducted by EOS Gallup Europe upon the request of the European Commission.
Development Aid in times of economic turmoil
 Special Eurobarometer European Commission Development Aid in times of economic turmoil Fieldwork: May 2009 June 2009 Publication: October 2009 Special Eurobarometer 318 / Wave 71.2 TNS Opinion & Social
Standard Eurobarometer 83 Spring 2015 THE EU BUDGET REPORT
 Standard Eurobarometer 83 Spring 2015 THE EU BUDGET REPORT Fieldwork: May 2015 This survey has been requested and co-ordinated by the European Commission, Directorate-General for Communication. http://ec.europa.eu/public_opinion/index_en.htm
Humanitarian Aid. Fieldwork June July 2006 Publication October 2006
 Special Eurobarometer European Commission Humanitarian Aid Fieldwork June July 2006 Publication October 2006 Special Eurobarometer 268 / Wave 65.4 TNS Opinion & Social This survey was requested by Directorate
Gender pension gap economic perspective
 Gender pension gap economic perspective Agnieszka Chłoń-Domińczak Institute of Statistics and Demography SGH Part of this research was supported by European Commission 7th Framework Programme project "Employment
Themes Income and wages in Europe Wages, productivity and the wage share Working poverty and minimum wage The gender pay gap
 5. W A G E D E V E L O P M E N T S At the ETUC Congress in Seville in 27, wage developments in Europe were among the most debated issues. One of the key problems highlighted in this respect was the need
Two years to go to the 2014 European elections European Parliament Eurobarometer (EB/PE 77.4)
") Directorate-General for Communication Public Opinion Monitoring Unit Two years to go to the 2014 European elections European Parliament Eurobarometer (EB/PE 77.4) Brussels, 6 February 2013 FOCUS REPORT
Directorate-General for Communication Public Opinion Monitoring Unit Two years to go to the 2014 European elections European Parliament Eurobarometer (EB/PE 77.4) Brussels, 6 February 2013 FOCUS REPORT
COMMISSION DECISION of 23 April 2012 on the second set of common safety targets as regards the rail system (notified under document C(2012) 2084)
 2084)") 27.4.2012 Official Journal of the European Union L 115/27 COMMISSION DECISION of 23 April 2012 on the second set of common safety targets as regards the rail system (notified under document C(2012) 2084)
27.4.2012 Official Journal of the European Union L 115/27 COMMISSION DECISION of 23 April 2012 on the second set of common safety targets as regards the rail system (notified under document C(2012) 2084)
The 2009 European elections
 Special Eurobarometer 299 EUROPEAN PARLIAMENT European Commission The 2009 European elections Fieldwork: March May 2008 Publication: September 2008 Report Special Eurobarometer 299/ Wave 69.2 TNS opinion
Health and food. Fieldwork November December 2005 Publication November 2006
 Special Eurobarometer European Commission Health and food Fieldwork November December 2005 Publication November 2006 Special Eurobarometer 246 / Wave 64.3 TNS Opinion & Social This survey was requested
PROGRESS TOWARDS THE LISBON OBJECTIVES 2010 IN EDUCATION AND TRAINING
 PROGRESS TOWARDS THE LISBON OBJECTIVES IN EDUCATION AND TRAINING In 7, reaching the benchmarks for continues to pose a serious challenge for education and training systems in Europe, except for the goal
Taylor & Francis Open Access Survey Open Access Mandates
 Taylor & Francis Open Access Survey Open Access Mandates Annex C European Union November 2014 November 2014 0 The results presented in this report are based on research carried out on behalf of Taylor
Overview of Eurofound surveys
 Overview of Eurofound surveys Dublin 21 st October 2010 Maija Lyly-Yrjänäinen Eurofound data European Working Conditions Survey 91, 95, 00, 05, 10 European Quality of Life Survey 03, 07, 09, 10 (EB), 11
of the European Commission. Communication. This document of the authors. Standard Eurobarometer 75 / Spring 2011 TNS opinion & social
 Standard Eurobarometer European Commission EUROBAROMETER 75 SPRING 2011 Europeans and the European Union budget REPORT Standard Eurobarometer 75 / Spring 2011 TNS opinion & social Fieldwork: May 2011 Publication:
PROGRESS TOWARDS THE LISBON OBJECTIVES 2010 IN EDUCATION AND TRAINING
 PROGRESS TOWARDS THE LISBON OBJECTIVES IN EDUCATION AND TRAINING In, reaching the benchmarks for continues to pose a serious challenge for education and training systems in Europe, except for the goal
DATA SET ON INVESTMENT FUNDS (IVF) Naming Conventions
 Naming Conventions") DIRECTORATE GENERAL STATISTICS LAST UPDATE: 10 APRIL 2013 DIVISION MONETARY & FINANCIAL STATISTICS ECB-UNRESTRICTED DATA SET ON INVESTMENT FUNDS (IVF) Naming Conventions The series keys related to Investment
DIRECTORATE GENERAL STATISTICS LAST UPDATE: 10 APRIL 2013 DIVISION MONETARY & FINANCIAL STATISTICS ECB-UNRESTRICTED DATA SET ON INVESTMENT FUNDS (IVF) Naming Conventions The series keys related to Investment
in focus Statistics T he em ploym ent of senior s in t he Eur opean Union Contents POPULATION AND SOCIAL CONDITIONS 15/2006 Labour market
 T he em ploym ent of senior s in t he Eur opean Union Statistics in focus OULATION AND SOCIAL CONDITIONS 15/2006 Labour market Authors Christel ALIAGA Fabrice ROMANS Contents In 2005, in the EU-25, 22.2
Taxation trends in the European Union EU27 tax ratio at 39.8% of GDP in 2007 Steady decline in top personal and corporate income tax rates since 2000
 DG TAXUD STAT/09/92 22 June 2009 Taxation trends in the European Union EU27 tax ratio at 39.8% of GDP in 2007 Steady decline in top personal and corporate income tax rates since 2000 The overall tax-to-gdp
Flash Eurobarometer N o 189a EU communication and the citizens. Analytical report. Fieldwork: February 2008 Publication: July 2008
 Gallup Flash Eurobarometer N o 189a EU communication and the citizens Flash Eurobarometer European Commission Business attitudes towards cross-border and consumer protection Analytical report Fieldwork:
The EU's relations with its neighbours
 Special Eurobarometer European Commission The EU's relations with its neighbours A survey of attitudes in the European Union Fieldwork: May-June 2007 Publication: September 2007 Special Eurobarometer 285
H Marie Skłodowska-Curie Actions (MSCA)
") H2020 Key facts and figures (2014-2020) Number of IE researchers funded by MSCA: EU budget awarded to IE organisations (EUR million): Number of IE organisations in MSCA: 253 116,04 116 In detail, the number
H2020 Key facts and figures (2014-2020) Number of IE researchers funded by MSCA: EU budget awarded to IE organisations (EUR million): Number of IE organisations in MSCA: 253 116,04 116 In detail, the number
H Marie Skłodowska-Curie Actions (MSCA)
") H2020 Key facts and figures (2014-2020) Number of BE researchers funded by MSCA: EU budget awarded to BE organisations (EUR million): Number of BE organisations in MSCA: 274 161,04 227 In detail, the number
H2020 Key facts and figures (2014-2020) Number of BE researchers funded by MSCA: EU budget awarded to BE organisations (EUR million): Number of BE organisations in MSCA: 274 161,04 227 In detail, the number
Securing sustainable and adequate social protection in the EU
 Securing sustainable and adequate social protection in the EU Session on Social Protection & Security IFA 12th Global Conference on Ageing 11 June 2014, HICC Hyderabad India Dr Lieve Fransen European Commission
Attitudes of consumers towards the welfare of farmed animals
 Special Eurobarometer European Commission Attitudes of consumers towards the welfare of farmed animals Fieldwork : February- March 2005 Publication : June 2005 Special Eurobarometer 229 / Wave 63.2 TNS
H Marie Skłodowska-Curie Actions (MSCA)
") H2020 Key facts and figures (2014-2020) Number of NL researchers funded by MSCA: EU budget awarded to NL organisations (EUR million): Number of NL organisations in MSCA: 427 268.91 351 In detail, the number
H2020 Key facts and figures (2014-2020) Number of NL researchers funded by MSCA: EU budget awarded to NL organisations (EUR million): Number of NL organisations in MSCA: 427 268.91 351 In detail, the number
EUROPEAN SMALL CLAIMS PROCEDURE
 Special Eurobarometer 395 EUROPEAN SMALL CLAIMS PROCEDURE SUMMARY Fieldwork: November December 2012 Publication: April 2013 This survey has been requested by the European Commission, Directorate-General
The Future Constitutional Treaty
 Special Eurobarometer European Commission The Future Constitutional Treaty Fieldwork: November 2004 Publication: March 2005 Special Eurobarometer 214 / Wave 62.1 TNS Opinion & Social This survey was requested
E-Communications Household Survey
 Special Eurobarometer 293 European Commission E-Communications Household Survey Fieldwork November December 2007 Publication June 2008 Report Special Eurobarometer 293 / Wave 68.2 TNS opinion & social
H Marie Skłodowska-Curie Actions (MSCA)
") H2020 Key facts and figures (2014-2020) Number of FR researchers funded by MSCA: EU budget awarded to FR organisations (EUR million): Number of FR organisations in MSCA: 1 072 311.72 479 In detail, the
H2020 Key facts and figures (2014-2020) Number of FR researchers funded by MSCA: EU budget awarded to FR organisations (EUR million): Number of FR organisations in MSCA: 1 072 311.72 479 In detail, the
Growth, competitiveness and jobs: priorities for the European Semester 2013 Presentation of J.M. Barroso,
 Growth, competitiveness and jobs: priorities for the European Semester 213 Presentation of J.M. Barroso, President of the European Commission, to the European Council of 14-1 March 213 Economic recovery
H Marie Skłodowska-Curie Actions (MSCA)
") H2020 Key facts and figures (2014-2020) Number of FI researchers funded by MSCA: EU budget awarded to FI organisations (EUR million): Number of FI organisations in MSCA: 155 47.93 89 In detail, the number
H2020 Key facts and figures (2014-2020) Number of FI researchers funded by MSCA: EU budget awarded to FI organisations (EUR million): Number of FI organisations in MSCA: 155 47.93 89 In detail, the number
H Marie Skłodowska-Curie Actions (MSCA)
") H2020 Key facts and figures (2014-2020) Number of PT researchers funded by MSCA: EU budget awarded to PT organisations (EUR million): Number of PT organisations in MSCA: 716 66,67 165 In detail, the number
H2020 Key facts and figures (2014-2020) Number of PT researchers funded by MSCA: EU budget awarded to PT organisations (EUR million): Number of PT organisations in MSCA: 716 66,67 165 In detail, the number
H Marie Skłodowska-Curie Actions (MSCA)
") H2020 Key facts and figures (2014-2020) Number of SE researchers funded by MSCA: EU budget awarded to SE organisations (EUR million): Number of SE organisations in MSCA: 138 114.71 150 In detail, the number
H2020 Key facts and figures (2014-2020) Number of SE researchers funded by MSCA: EU budget awarded to SE organisations (EUR million): Number of SE organisations in MSCA: 138 114.71 150 In detail, the number
European Commission Directorate-General "Employment, Social Affairs and Equal Opportunities" Unit E1 - Social and Demographic Analysis
 Research note no. 1 Housing and Social Inclusion By Erhan Őzdemir and Terry Ward ABSTRACT Housing costs account for a large part of household expenditure across the EU.Since everyone needs a house, the
Investment in Ireland and the EU
 Investment in and the EU Debora Revoltella Director Economics Department Dublin April 10, 2017 20/04/2017 1 Real investment: IE v EU country groupings Real investment (2008 = 100) 180 160 140 120 100 80
May 2009 Euro area external trade surplus 1.9 bn euro 6.8 bn euro deficit for EU27
 STAT/09/106 17 July 2009 May 2009 Euro area external trade surplus 1.9 6.8 deficit for EU27 The first estimate for the euro area 1 (EA16) trade balance with the rest of the world in May 2009 gave a 1.9
Traffic Safety Basic Facts Main Figures. Traffic Safety Basic Facts Traffic Safety. Motorways Basic Facts 2015.
 Traffic Safety Basic Facts 2013 - Main Figures Traffic Safety Basic Facts 2015 Traffic Safety Motorways Basic Facts 2015 Motorways General Almost 30.000 people were killed in road accidents on motorways
I. EUROPEANS AND THE TAX ON FINANCIAL TRANSACTION (TFT)...10 IV. THE REACTIONS OF THE MEMBER STATES TO THE CRISIS...19
...10 IV. THE REACTIONS OF THE MEMBER STATES TO THE CRISIS...19") Directorate General for Communication Directorate C - Relations with Citizens PUBLIC OPINION MONITORING UNIT Brussels, 22 June 2011 EUROPEANS AND THE CRISIS European Parliament Eurobarometer ( Parlemeter
Directorate General for Communication Directorate C - Relations with Citizens PUBLIC OPINION MONITORING UNIT Brussels, 22 June 2011 EUROPEANS AND THE CRISIS European Parliament Eurobarometer ( Parlemeter
Report on the distribution of direct payments to agricultural producers (financial year 2016)
") Report on the distribution of direct payments to agricultural producers (financial year 2016) Every year, the Commission publishes the distribution of direct payments to farmers by Member State. Figures
Report on the distribution of direct payments to agricultural producers (financial year 2016) Every year, the Commission publishes the distribution of direct payments to farmers by Member State. Figures
H Marie Skłodowska-Curie Actions (MSCA)
") H2020 Key facts and figures (2014-2020) Number of LV researchers funded by MSCA: EU budget awarded to LV organisations (EUR million): Number of LV organisations in MSCA: 35 3.91 11 In detail, the number
H2020 Key facts and figures (2014-2020) Number of LV researchers funded by MSCA: EU budget awarded to LV organisations (EUR million): Number of LV organisations in MSCA: 35 3.91 11 In detail, the number
August 2008 Euro area external trade deficit 9.3 bn euro 27.2 bn euro deficit for EU27
 STAT/08/143 17 October 2008 August 2008 Euro area external trade deficit 9.3 27.2 deficit for EU27 The first estimate for the euro area 1 (EA15) trade balance with the rest of the world in August 2008
NOTE ON EU27 CHILD POVERTY RATES
 NOTE ON EU7 CHILD POVERTY RATES Research note prepared for Child Poverty Action Group Authors: H. Xavier Jara and Chrysa Leventi Institute for Social and Economic Research (ISER) University of Essex The
Weighting issues in EU-LFS
 Weighting issues in EU-LFS Carlo Lucarelli, Frank Espelage, Eurostat LFS Workshop May 2018, Reykjavik carlo.lucarelli@ec.europa.eu, frank.espelage@ec.europa.eu 1 1. Introduction The current legislation
2 ENERGY EFFICIENCY 2030 targets: time for action
 ENERGY EFFICIENCY 2030 targets: time for action The Coalition for Energy Savings The Coalition for Energy Savings strives to make energy efficiency and savings the first consideration of energy policies
H Marie Skłodowska-Curie Actions (MSCA)
") H2020 Key facts and figures (2014-2020) Number of AT researchers funded by MSCA: EU budget awarded to AT organisations (EUR million): Number of AT organisations in MSCA: 215 78.57 140 In detail, the number
H2020 Key facts and figures (2014-2020) Number of AT researchers funded by MSCA: EU budget awarded to AT organisations (EUR million): Number of AT organisations in MSCA: 215 78.57 140 In detail, the number
Transition from Work to Retirement in EU25
 EUROPEAN CENTRE EUROPÄISCHES ZENTRUM CENTRE EUROPÉEN 1 Asghar Zaidi is Director Research at the European Centre for Social Welfare Policy and Research, Vienna; Michael Fuchs is Researcher at the European
December 2010 Euro area annual inflation up to 2.2% EU up to 2.6%
 STAT/11/9 14 January 2011 December 2010 Euro area annual inflation up to 2.2% EU up to 2.6% Euro area 1 annual inflation was 2.2% in December 2010 2, up from 1.9% in November. A year earlier the rate was
Traffic Safety Basic Facts Main Figures. Traffic Safety Basic Facts Traffic Safety. Motorways Basic Facts 2017.
 Traffic Safety Basic Facts 2013 - Main Figures Traffic Safety Basic Facts 2015 Traffic Safety Motorways Basic Facts 2017 Motorways General More than 24.000 people were killed in road accidents on motorways
Investment and Investment Finance. the EU and the Polish story. Debora Revoltella
 Investment and Investment Finance the EU and the Polish story Debora Revoltella Director - Economics Department EIB Warsaw 27 February 2017 Narodowy Bank Polski European Investment Bank Contents We look
The Trend Reversal of the Private Credit Market in the EU
 The Trend Reversal of the Private Credit Market in the EU Key Findings of the ECRI Statistical Package 2016 Roberto Musmeci*, September 2016 The ECRI Statistical Package 2016, Lending to Households and
The Skillsnet project on Medium-term forecasts of occupational skill needs in Europe: Replacement demand and cohort change analysis
 The Skillsnet project on Medium-term forecasts of occupational skill needs in Europe: Replacement demand and cohort change analysis Paper presented at the Workshop on Medium-term forecast of occupational
January 2009 Euro area external trade deficit 10.5 bn euro 26.3 bn euro deficit for EU27
 STAT/09/40 23 March 2009 January 2009 Euro area external trade deficit 10.5 26.3 deficit for EU27 The first estimate for the euro area 1 (EA16) trade balance with the rest of the world in January 2009
Traffic Safety Basic Facts Main Figures. Traffic Safety Basic Facts Traffic Safety. Motorways Basic Facts 2016.
 Traffic Safety Basic Facts 2013 - Main Figures Traffic Safety Basic Facts 2015 Traffic Safety Motorways Basic Facts 2016 Motorways General Almost 26.000 people were killed in road accidents on motorways
Investment in France and the EU
 Investment in and the EU Natacha Valla March 2017 22/02/2017 1 Change relative to 2008Q1 % of GDP Slow recovery of investment, and with strong heterogeneity Overall Europe s recovery in investment is slow,
COMMISSION STAFF WORKING DOCUMENT Accompanying the document
 EUROPEAN COMMISSION Brussels, 9.10.2017 SWD(2017) 330 final PART 13/13 COMMISSION STAFF WORKING DOCUMENT Accompanying the document REPORT FROM THE COMMISSION TO THE EUROPEAN PARLIAMENT, THE COUNCIL, THE
ENTREPRENEURSHIP IN THE EU AND BEYOND
 Flash Eurobarometer 354 ENTREPRENEURSHIP IN THE EU AND BEYOND COUNTRY REPORT SPAIN Fieldwork: June 2012 This survey has been requested by the European Commission, Directorate-General Enterprise and Industry
LEADER implementation update Leader/CLLD subgroup meeting Brussels, 21 April 2015
 LEADER 2007-2013 implementation update Leader/CLLD subgroup meeting Brussels, 21 April 2015 #LeaderCLLD 2,416 2,416 8.9 Progress on LAG selection in the EU (2007-2013) 3 000 2 500 2 000 2 182 2 239 2 287
H Marie Skłodowska-Curie Actions (MSCA)
") H2020 Key facts and figures (2014-2020) Number of PT researchers funded by MSCA: EU budget awarded to PT organisations (EUR million): Number of PT organisations in MSCA: 592 54.79 135 In detail, the number
H2020 Key facts and figures (2014-2020) Number of PT researchers funded by MSCA: EU budget awarded to PT organisations (EUR million): Number of PT organisations in MSCA: 592 54.79 135 In detail, the number
State of play of CAP measure Setting up of Young Farmers in the European Union
 State of play of CAP measure Setting up of Young Farmers in the European Union Michael Gregory EN RD Contact Point Seminar CEJA 20 th September 2010 Measure 112 rationale: Measure 112 - Setting up of young
Aggregation of periods for unemployment benefits. Report on U1 Portable Documents for mobile workers Reference year 2016
 Aggregation of periods for unemployment benefits Report on U1 Portable Documents for mobile workers Reference year 2016 Frederic De Wispelaere & Jozef Pacolet - HIVA KU Leuven June 2017 EUROPEAN COMMISSION