of the European Commission. Communication. This document of the authors. Standard Eurobarometer 75 / Spring 2011 TNS opinion & social
|
|
|
- Clare Henderson
- 6 years ago
- Views:
Transcription


1 Standard Eurobarometer European Commission EUROBAROMETER 75 SPRING 2011 Europeans and the European Union budget REPORT Standard Eurobarometer 75 / Spring 2011 TNS opinion & social Fieldwork: May 2011 Publication: August 2011 This survey has been requested and co-ordinated by Directorate-General for Communication. This document does not represent the point of view of the European Commission. The interpretations and opinions contained in it are solely those of the authors.
2 Standard Eurobarometer 75 Spring 2011 Europeans and the European Union budget Study conducted by TNS Opinion & Social at the request of the European Commission - Directorate-General Communication Coordinated by the European Commission - Directorate-General Communication 1
3 TABLE OF CONTENTS INTRODUCTION EUROPEANS AND THE EUROPEAN UNION BUDGET THE EUROPEAN UNION BUDGET: PERCEPTIONS THE BUDGET AND THE EUROPEAN UNION: EXPECTATIONS TECHNICAL SPECIFICATIONS
4 INTRODUCTION On 20 April 2011 the European Commission passed the European Union s 2012 draft budget 1. Budget and Financial Programming Commissioner Janusz Lewandoski described it as A delicate balancing act combining austerity and growth boosting measures for 500 million Europeans ( ) The key objective of the 2012 Draft Budget is to fully support the European economy and EU citizens. Some weeks later on 29 June, about a month after the end of the Standard Eurobarometer fieldwork, the European Commission set out its proposed multiannual financial framework for the European Union for 2014 to This is the background against which the spring 2011 Standard Eurobarometer 75 was carried out. The European Union budget is under debate, in terms of both its general level and the allocation of expenditure. But what do Europeans think? The objective of this survey is to shed some light on: - Europeans perceptions of the European Union s budget and its main areas of expenditure; - Future expectations of the budget. The full report of the spring 2011 Standard Eurobarometer is made up of several volumes. The first volume analyses the results of the historical indicators of the Standard Eurobarometer. Three other volumes cover the state of European public opinion on: the financial and economic crisis; the Europe 2020 strategy; the European Union budget. The current volume examines the European Union s budget. The general analysis, as well as the socio-demographic analyses, is based on the average of the 27 Member States. This average is weighted to reflect the actual population of each Member State. The averages for previous years represent the results obtained in all the Member States who made up the Union at the time when the survey was conducted. * * * 1 uilanguage=fr 2 uilanguage=en 3
5 The methodology used is that of the Eurobarometer surveys of the Directorate-General Communication ( Research and Speechwriting Unit). A technical note concerning the interviews carried out by the institutes of the TNS Opinion & Social network is appended to this report. It specifies the interview methodology as well as the confidence intervals 3. * * * The Eurobarometer website can be found at the following address: We would like to take this opportunity to thank all those interviewed across Europe for taking the time to take part in this survey. Without their active participation this survey would not have been possible. 3 The results tables are in the appendix. Please note that the percentage totals in the tables can be more than 100% where the interviewee could choose more than one response to a question. 4
6 In this report the countries are referred to by their official abbreviation. abbreviations used in this report and their corresponding meanings are as follows: The ABBREVIATIONS EU27 EU15 NMS12 DK/NA BE BG CZ DK DE EE EL ES FR IE IT CY CY (tcc) LT LV LU HU MT NL AT PL PT RO SI SK FI SE UK European Union 27 Member States EU15 countries * NMS12 countries ** Don t know/no answer Belgium Bulgaria Czech Republic Denmark Germany Estonia Greece Spain France Ireland Italy Republic of Cyprus*** Zone not controlled by the government of the Republic of Cyprus Lithuania Latvia Luxembourg Hungary Malta The Netherlands Austria Poland Portugal Romania Slovenia Slovakia Finland Sweden United Kingdom HR TR MK IS ME Croatia Turkey Former Yugoslav Republic of Macedonia**** Iceland Montenegro * EU15 refers to the 15 countries forming the European Union before the enlargements of 2004 and 2007: Belgium, Denmark, Germany, Greece, Spain, France, Ireland, Italy, Luxembourg, The Netherlands, Austria, Portugal, Finland, Sweden and the United Kingdom. ** The NMS12 are the 12 new Member States which joined the European Union during the 2004 and 2007 enlargements. These are Bulgaria, the Czech Republic, Estonia, the Republic of Cyprus, Lithuania, Latvia, Hungary, Malta, Poland, Romania, Slovenia and Slovakia. *** Cyprus as a whole is one of the 27 European Union Member States. However, the acquis communautaire has been suspended in the part of the country which is not controlled by the government of the Republic of Cyprus. For practical reasons, only the interviews carried out in the part of the country controlled by the government of the Republic of Cyprus are included in the CY category and in the EU27 average. The interviews carried out in the part of the country that is not controlled by the government of the Republic of Cyprus are included under CY (tcc) [tcc: Turkish Cypriot Community - Communauté chypriote turque]. **** Provisional abbreviation which in no way prejudges the definitive name of this country, which will be agreed once the current negotiations at the United Nations have been completed. 5
7 1. EUROPEANS AND THE EUROPEAN UNION BUDGET - Support for increasing the European Union budget is growing but is still the minority view - When asked for their position on the European Union (EU) budget, a majority of Europeans agree that the political objectives of the EU do not justify an increase in the Union s budget. (47%) 4, but this opinion is slightly less widespread than the last time it was measured, in the autumn 2005 Standard Eurobarometer 64 (-2 points). 36% of respondents (+4 points) believe that given its political objectives, the EU should have greater financial means. A significant number respond don t know to this question, though this has fallen slightly (17%, -2 points). Differences appear by Member State: a majority in the NMS12 are in favour of increasing the Union s budget (46% versus 33%), while this is opposed by a majority in the EU15 (33% versus 51%). The countries where public opinion is most opposed to an increase in the European Union s budget are Denmark (75%), the Netherlands (67%), Sweden (67%), Slovakia (63%), the United Kingdom (63%) and Germany (61%). Conversely, there is majority support for an increase in the budget in twelve Member States, led by Cyprus (63%), Greece (58%), Hungary (53%) and Poland (53%), ahead of Estonia (49%), Romania (46%), Bulgaria (45%), Malta (44%), Italy (43%), Portugal (41%), Spain (39%) and Ireland (36%). 4 QA20 With which of the following two statements do you most agree? The EU should have greater financial means given its political objectives; The EU's political objectives do not justify an increase in the Union's budget. 6


8 In all the candidate countries public opinion is in favour of an increase in the Union s budget, with the exception of Iceland (where 61% of respondents do not think that this would be justified). 7
 6.")

9 The majority of Europeans say that the EU budget gives poor value for money for EU citizens (44%, versus 27% good value for money ) 5. It should be noted that the don t know rate is very high for this question (29%) 6. Public opinion about whether the European Union s budget provides value for money is most positive in Poland (49%), Estonia (45%), Cyprus (42%) and Slovakia (42%). Overall a majority in 21 Member States are criticical of the value for money represented by the EU budget. Greece, which is among the countries which most strongly support an increase in the European Union budget, is also one of the most critical regarding its value for money (54% say it is poor ). 5 QD3 Generally speaking, thinking about the EU budget, would you say that? It gives good value for money for EU citizens; It gives poor value for money for EU citizens. 6 The most significant don t know rates for this question were recorded in Romania (47%), Bulgaria (46%), Malta (44%), Ireland (38%), Lithuania (37%), Spain (36%), Italy (35%), Portugal (32%) and France (32%). 8
; then the others (and then), with the possibility of giving up to three responses 7.")
. In this report we will concentrate on the combined results (the total of the responses) as given in the table below 8.")
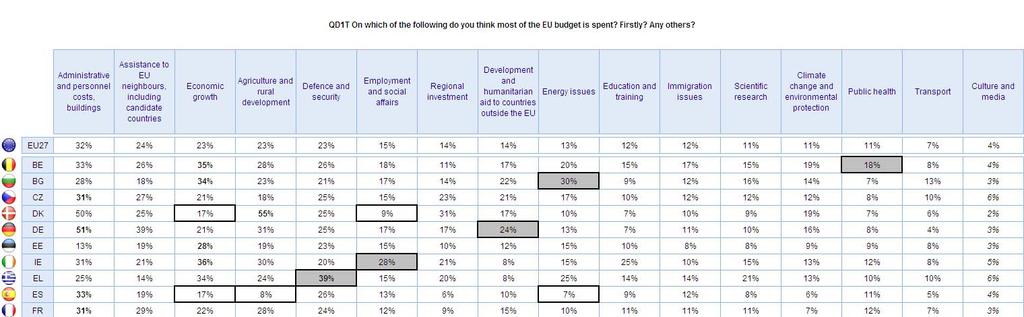
10 2. THE EUROPEAN UNION BUDGET: PERCEPTIONS - Administrative costs are perceived as the main area of expenditure of the European Union - Europeans were asked to identify the area in which they thought the European Union spent most (first); then the others (and then), with the possibility of giving up to three responses 7. The sum of the answers given to the two parts of the question provides an overall ranking aggregation of the first response (first?) and the other responses given second (and then?). In this report we will concentrate on the combined results (the total of the responses) as given in the table below 8. Europeans think that the European Union budget is primarily spent on the administrative costs of staff and buildings (32%). This opinion has strengthened since the autumn 2008 Standard Eurobarometer EB70 (+6 points). The item leads the ranking even when we only consider the first responses (16%). Economic growth (23%, -1), agriculture and rural development (23%, -1) and security and defence (23%, +3) are also among the main areas of expenditure identified. Help to the EU s neighbouring countries, including candidate countries attracts a significantly higher score (24%, +6). Somewhat behind these, social welfare and employment (15%, +3) and immigration (12%, +4) are also mentioned more than previously. 7 QD1 On which of the following do you think most of the EU budget is spent? Firstly? Any others? 8 The accumulated results are the sum of the results from the questions firstly and any others : for example the item the administrative costs of personnel and buildings is mentioned first by 16% of the total sample (QD1a), then by 19% of those who responded to the question any others (QD1b). The total of the answers to these two questions represents 32% of the total sample of those interviewed (QD1T). 9
11 Administrative costs are the most mentioned item in ten Member States, led by Slovenia (53%), Germany (51%) and Austria (51%). In general the EU15 countries (34%) mention this expenditure more than the NMS12 (21%). Help to neighbouring countries is mentioned very frequently in Slovenia (49%) and leads the responses given in Luxembourg (32%) and Slovakia (31%). The topic is also mentioned more in the EU15 countries (26% compared to 17% for the NMS12). Economic growth is the first response given in eleven Member States including Cyprus (41%), Lithuania (37%) and Ireland (36%). There are some differences by country which should be highlighted: - In Sweden (57%), Denmark (55%) and Poland (30%) agriculture is given as the Union s main area of expenditure; - In Greece it is security and defence (39%); - Ireland is much more likely than its European neighbours to mention employment and social welfare among the main areas of expenditure for the European budget (28%); - Bulgaria mentions energy (30%) more than the rest of Europe; - Immigration is particularly mentioned in Italy (23%) and Cyprus (21%). 10

12 11
13 Respondents who say that they are interested in European politics are more likely to mention the following main areas of EU expenditure: agriculture (28% compared to 16% of those who are not interested in European politics), regional investment (17% compared to 10%), and help to neighbouring countries (26% compared to 20%); but they also mention administrative costs (34% compared to 27%). There are also other socio-demographic differences: young Europeans (15 to 24 years old) are less likely than average to mention administrative costs (25% compared to an average of 32%) and agriculture (15% compared to an average of 23%) as items of EU expenditure, but they are more likely to mention economic growth (28% compared to an average of 23%), employment and social welfare (19% compared to an average of 15%) and education (17% compared to an average of 12%). Education is also a discriminating variable: those who finished their education after 19 years of age are more likely to mention agriculture and rural development (32% compared to an average of 23%), economic growth (26% compared to an average of 23%) and regional investment (19%, compared to 14%). 12
14 The eleven first responses given by Europeans 13
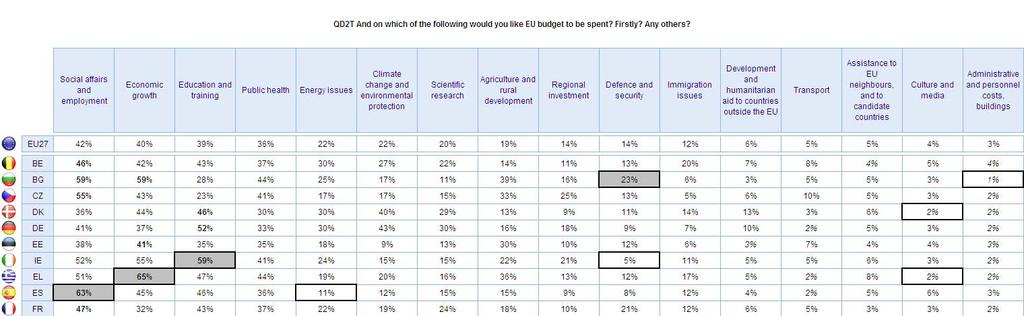
15 3. THE BUDGET AND THE EUROPEAN UNION: EXPECTATIONS - Expectations revolve around employment, the economy and social welfare - Europeans were then asked to identify the area in which they would like the European Union to spend most (first?); then others (any others?), with the possibility of giving up to three responses 9. The sum of the responses to the two parts of the question provides an overall ranking sum of the first response given (first?) and the other responses given second (any others?). The ranking of the areas in which the public would prefer the European Union to allocate its budget has changed since the last time this was measured in the autumn 2008 EB Social welfare and employment is now first (42% of total responses, +6 points), ahead of economic growth which was mentioned slightly less and drops to second place (40%, +2). Europeans put education and training in third place with an increase of 9 points (to 39%). Public health is also mentioned more (36%, +4). When the focus is on the first response given, the ranking is very slightly modified with economic growth (19%) outstripping social welfare and employment (17%). Environmental and energy also remain areas where the European Union is expected to spend money. There is no change in these expectations compared to EB70. Agriculture is one of the areas which is mentioned more than previously (19%, +5), whereas defence and security have lost ground (14%, -3). Among the least-mentioned items are two areas in which Europeans were most likely to think that the EU budget was spent: help to neighbouring countries outside the EU (5%, -2), and administrative costs (3%, no change). 9 QD2 And on which of the following would you like the EU budget to be spent? Firstly? Any others? 10 The fieldwork for the autumn 2008 Standard Eurobarometer 70 took place from 6 October to 6 November 2008, a few weeks after the bankruptcy of the US investment bank, Lehman Brothers, on 15 September
 and")
16 The graph below illustrates the cumulative results - first?, any others? 11 There is a sharp contrast between expectations in the EU15 countries and in the NMS12: - The EU15 countries put education and training at the top (42%, compared to 28% for NMS12 countries) and give more importance to climate change and environmental protection (25%, versus 14%); - The NMS12 countries place agriculture fourth after employment, growth and public health (33% compared to 15% for the EU15). The differences are equally pronounced between Member States. Social welfare and employment are placed first in ten Member States, led by Spain (63%, +12 points), Slovenia (60%, +4) and Finland (60%, +16). This item has gained ground in the majority of Member States with the sharpest increases in Bulgaria (59%, +22), Ireland (52%, +21) and Cyprus (39%, +20). Expectations regarding economic growth remain especially strong in Greece (65%, no change) and Hungary (61%, +6 points), and in six other countries which also put this area first. In terms of positive evolutions, expectations have increased the most in Denmark (44%, +19) and Slovenia (57%, +14). 11 The cumulative results are the sum of the responses to the question Firstly and Any others. 15
17 Education and training have gained some ground in several countries, some of which now put this item at the top of the areas seen as most appropriate for the Union s expenditure. This is particularly the case in Ireland (59%, +25 points), the Netherlands (57%, +19) and Denmark (46%, +19). The three other Member States which would like the EU to prioritise the allocation of its budget to education and training are Germany (52%), Luxembourg (49%) and Malta (42%). Public health is the first response given in Cyprus (64%, +8 points), Austria (42%, no change), the United Kingdom (40%, +13) and Poland (39%, +2). Climate change is the leading response given in Sweden (53%), despite a drop of six points, whereas agriculture tops expectations in Romania (44%, +9, on a par with economic growth), and is also mentioned very frequently in Hungary (46%, +10). 16

18 17
19 Analysing the results by socio-demographic criteria reveals some differences between categories: - The most educated respondents (who studied beyond the age of 19) are more likely to mention education (42%), climate change and environmental protection (27%) and scientific research (25%) among their expectations; whereas those who left school before 16 are more likely than average to prioritise agriculture and rural development (23%) and the health system (39%); - Likewise, respondents who place themselves at the bottom of the social scale have stronger expectations for employment and social welfare (49%), health (39%) and agriculture (24%), whereas Europeans who place themselves at the top of the social scale are more likely than the average to mention scientific research (25%), energy (25%), and climate change (26%). 18

20 The eleven first responses given by Europeans 19
 and public health (36%) - are not identified as the areas on which the European Union budget is currently spent (perceived as 15%, 12% and 11% respectively).")
; - Agriculture (cited in 23% of responses as a major area of expenditure), regional investment (14%)")
21 Comparing Europeans perceptions with their expectations of the European Union s budget shows significant differences: - The areas in which respondents expectations are greatest - employment (42%), education (39%) and public health (36%) - are not identified as the areas on which the European Union budget is currently spent (perceived as 15%, 12% and 11% respectively). Therefore, these are the main levers for improving public opinion; - Administrative costs (32%) and help to neighbouring countries (24%) are identified as the Union s main areas of expenditure, but they are the areas in which Europeans least want the budget to be spent (3% and 5% respectively); - Agriculture (cited in 23% of responses as a major area of expenditure), regional investment (14%) and immigration issues (12%) are issues on which perceptions are in line with expectations (scoring 19%, 14% and 12% respectively as areas of expectation); - Finally, environmental issues (expectations: 22% compared to perceived expenditure: 11%), energy (22% / 13%) and scientific research (20% / 11%) also seem to be areas in which Europeans want more evidence of financial investment by the EU. 20
22 The differences between public perceptions and expectations of the European Union s budget merit close examination. The gap between perceptions and expectations widened by between three and eight points between autumn 2008 and spring 2011 in respect of half these issues. For example, where the difference between perceptions and expectations in education and training was 20 points in the autumn 2008 EB70, it is now 27 points. The gap has widened from 11 to 19 points for help to neighbouring countries, and from 23 to 29 points for administrative costs; this is the area in which the gap between perceptions and expectations remains the greatest. 21
23 TECHNICAL SPECIFICATIONS TNS Opinion & Social, a consortium created between TNS plc and TNS opinion, carried out the wave 75.3 of the EUROBAROMETER, on request of the EUROPEAN COMMISSION, Directorate-General for Communication, Research and Speechwriting. Interviews took place between 6 May and 26 May The STANDARD EUROBAROMETER 75 is part of wave 75.3 and covers the population of the respective nationalities of the European Union Member States, resident in each of the Member States and aged 15 years and over. The STANDARD EUROBAROMETER 75 has also been conducted in the five candidate countries (Croatia, Turkey, the Former Yugoslav Republic of Macedonia, Iceland and Montenegro) and in the Turkish Cypriot Community. In these countries, the survey covers the national population of citizens and the population of citizens of all the European Union Member States that are residents in these countries and have a sufficient command of the national languages to answer the questionnaire. The basic sample design applied in all states is a multi-stage, random (probability) one. In each country, a number of sampling points was drawn with probability proportional to population size (for a total coverage of the country) and to population density. In order to do so, the sampling points were drawn systematically from each of the "administrative regional units", after stratification by individual unit and type of area. They thus represent the whole territory of the countries surveyed according to the EUROSTAT NUTS II (or equivalent) and according to the distribution of the resident population of the respective nationalities in terms of metropolitan, urban and rural areas. In each of the selected sampling points, a starting address was drawn, at random. Further addresses (every Nth address) were selected by standard "random route" procedures, from the initial address. In each household, the respondent was drawn, at random (following the "closest birthday rule"). All interviews were conducted face-to-face in people's homes and in the appropriate national language. As far as the data capture is concerned, CAPI (Computer Assisted Personal Interview) was used in those countries where this technique was available. 22
24 ABREVIATIONS COUNTRIES INSTITUTES N INTERVIEWS FIELDWORK DATES POPULATION 15+ BE Belgium TNS Dimarso /05/ /05/ BG Bulgaria TNS BBSS /05/ /05/ CZ Czech Rep. TNS Aisa /05/ /05/ DK Denmark TNS Gallup DK /05/ /05/ DE Germany TNS Infratest /05/ /05/ EE Estonia Emor /05/ /05/ IE Ireland Ipsos MRBI /05/ /05/ EL Greece TNS ICAP /05/ /05/ ES Spain TNS Demoscopia /05/ /05/ FR France TNS Sofres /05/ /05/ IT Italy TNS Infratest /05/ /05/ CY Rep. of Cyprus Synovate /05/ /05/ LV Latvia TNS Latvia /05/ /05/ LT Lithuania TNS Gallup Lithuania /05/ /05/ LU Luxembourg TNS ILReS /05/ /05/ HU Hungary TNS Hungary /05/ /05/ MT Malta MISCO /05/ /05/ NL Netherlands TNS NIPO /05/ /05/ AT Austria Österreichisches Gallup- Institut /05/ /05/ PL Poland TNS OBOP /05/ /05/ PT Portugal TNS EUROTESTE /05/ /05/ RO Romania TNS CSOP /05/ /05/ SI Slovenia RM PLUS /05/ /05/ SK Slovakia TNS Slovakia /05/ /05/ FI Finland TNS Gallup Oy /05/ /05/ SE Sweden TNS GALLUP /05/ /05/ UK United Kingdom TNS UK /05/ /05/ TOTAL EU /05/ /05/ CY(tcc) Turkish Cypriot Community Kadem /05/ /05/ HR Croatia Puls /05/ /05/ TR Turkey TNS PIAR /05/ /05/ MK Former Yugoslav Rep. of Macedonia TNS Brima /05/ /05/ IS Iceland Capacent /05/ /05/ ME Montenegro TNS Medium Gallup /05/ /05/ TOTAL /05/ /05/ For each country a comparison between the sample and the universe was carried out. The Universe description was derived from Eurostat population data or from national statistics offices. For all countries surveyed, a national weighting procedure, using marginal and intercellular weighting, was carried out based on this Universe description. In all countries, gender, age, region and size of locality were introduced in the iteration procedure. For international weighting (i.e. EU averages), TNS Opinion & Social applies the official population figures as provided by EUROSTAT or national statistic offices. The total population figures for input in this post-weighting procedure are listed above. Readers are reminded that survey results are estimations, the accuracy of which, everything being equal, rests upon the sample size and upon the observed percentage. With samples of about 1,000 interviews, the real percentages vary within the following confidence limits: Observed percentages 10% or 90% 20% or 80% 30% or 70% 40% or 60% 50% Confidence limits ± 1.9 points ± 2.5 points ± 2.7 points ± 3.0 points ± 3.1 points 23
Standard Eurobarometer 83 Spring 2015 THE EU BUDGET REPORT
 Standard Eurobarometer 83 Spring 2015 THE EU BUDGET REPORT Fieldwork: May 2015 This survey has been requested and co-ordinated by the European Commission, Directorate-General for Communication. http://ec.europa.eu/public_opinion/index_en.htm
Eco-label Flower week 2006
 Special Eurobarometer European Commission Eco-label Flower week 2006 Fieldwork: November-December 2006 Publication: January 2007 Special Eurobarometer 275 / Wave 66.3 TNS Opinion & Social This survey was
Standard Eurobarometer
 Standard Eurobarometer 67 / Spring 2007 Standard Eurobarometer European Commission SPECIAL EUROBAROMETER EUROPEANS KNOWELEDGE ON ECONOMICAL INDICATORS 1 1 This preliminary analysis is done by Antonis PAPACOSTAS
PUBLIC PERCEPTIONS OF VAT
 Special Eurobarometer 424 PUBLIC PERCEPTIONS OF VAT REPORT Fieldwork: October 2014 Publication: March 2015 This survey has been requested by the European Commission, Directorate-General for Taxations and
ENTREPRENEURSHIP IN THE EU AND BEYOND
 Flash Eurobarometer 354 ENTREPRENEURSHIP IN THE EU AND BEYOND COUNTRY REPORT SPAIN Fieldwork: June 2012 This survey has been requested by the European Commission, Directorate-General Enterprise and Industry
Special Eurobarometer 418 SOCIAL CLIMATE REPORT
 Special Eurobarometer 418 SOCIAL CLIMATE REPORT Fieldwork: June 2014 Publication: November 2014 This survey has been requested by the European Commission, Directorate-General for Employment, Social Affairs
EUROPEAN SMALL CLAIMS PROCEDURE
 Special Eurobarometer 395 EUROPEAN SMALL CLAIMS PROCEDURE SUMMARY Fieldwork: November December 2012 Publication: April 2013 This survey has been requested by the European Commission, Directorate-General
Active Ageing. Fieldwork: September November Publication: January 2012
 Special Eurobarometer 378 Active Ageing SUMMARY Special Eurobarometer 378 / Wave EB76.2 TNS opinion & social Fieldwork: September November 2011 Publication: January 2012 This survey has been requested
Flash Eurobarometer 398 WORKING CONDITIONS REPORT
 Flash Eurobarometer WORKING CONDITIONS REPORT Fieldwork: April 2014 Publication: April 2014 This survey has been requested by the European Commission, Directorate-General for Employment, Social Affairs
Flash Eurobarometer 408 EUROPEAN YOUTH REPORT
 Flash Eurobarometer EUROPEAN YOUTH REPORT Fieldwork: December 2014 Publication: April 2015 This survey has been requested by the European Commission, Directorate-General for Education and Culture and co-ordinated
Flash Eurobarometer N o 189a EU communication and the citizens. Analytical Report. Fieldwork: April 2008 Report: May 2008
 Gallup Flash Eurobarometer N o 189a EU communication and the citizens Flash Eurobarometer European Commission Expectations of European citizens regarding the social reality in 20 years time Analytical
Two years to go to the 2014 European elections European Parliament Eurobarometer (EB/EP 77.4)
") Directorate-General for Communication PUBLIC OPINION MONITORING UNIT Brussels, 23 October 2012. Two years to go to the 2014 European elections European Parliament Eurobarometer (EB/EP 77.4) FOCUS ON THE
Directorate-General for Communication PUBLIC OPINION MONITORING UNIT Brussels, 23 October 2012. Two years to go to the 2014 European elections European Parliament Eurobarometer (EB/EP 77.4) FOCUS ON THE
E-Communications Household Survey. Summary
 Special Eurobarometer European Commission E-Communications Household Survey Fieldwork November - December 2006 Publication April 2007 Summary Special Eurobarometer 274 / Wave 66.3 TNS Opinion & Social
COMMISSION STAFF WORKING DOCUMENT Accompanying the document
 EUROPEAN COMMISSION Brussels, 9.10.2017 SWD(2017) 330 final PART 13/13 COMMISSION STAFF WORKING DOCUMENT Accompanying the document REPORT FROM THE COMMISSION TO THE EUROPEAN PARLIAMENT, THE COUNCIL, THE
Flash Eurobarometer 441. Report. European SMEs and the Circular Economy
 European SMEs and the Circular Economy Survey requested by the European Commission, Directorate-General Environment and co-ordinated by the Directorate-General for Communication This document does not
Flash Eurobarometer 470. Report. Work-life balance
 Work-life balance Survey requested by the European Commission, Directorate-General for Justice and Consumers and co-ordinated by the Directorate-General for Communication This document does not represent
Europeans attitudes towards the issue of sustainable consumption and production. Analytical report
 Flash Eurobarometer 256 The Gallup Organisation Analytical Report Flash EB N o 251 Public attitudes and perceptions in the euro area Flash Eurobarometer European Commission Europeans attitudes towards
For further information, please see online or contact
 For further information, please see http://ec.europa.eu/research/sme-techweb online or contact Lieve.VanWoensel@ec.europa.eu Seventh Progress Report on SMEs participation in the 7 th R&D Framework Programme
Employment and Social Policy
 Special Eurobarometer 377 European Commission Employment and Social Policy REPORT Special Eurobarometer 377 / Wave TNS opinion & social Fieldwork: September October 2011 Publication: December 2011 This
Themes Income and wages in Europe Wages, productivity and the wage share Working poverty and minimum wage The gender pay gap
 5. W A G E D E V E L O P M E N T S At the ETUC Congress in Seville in 27, wage developments in Europe were among the most debated issues. One of the key problems highlighted in this respect was the need
EUROBAROMETER 71. Fieldwork: June - July 2009 Publication: January 2010
 EUROBAROMETER 66 Standard Eurobarometer Report European Commission EUROBAROMETER 71 Future of Europe Fieldwork: June - July 2009 Publication: January 2010 Standard Eurobarometer 71/ Spring 2009 - TNS Opinion
Attitudes of Europeans Towards Tourism REPORT
 Flash Eurobarometer Attitudes of Europeans Towards Tourism REPORT Fieldwork: January 22 Publication: March 22 This survey has been requested by the Directorate-General Enterprise and co-ordinated by Directorate-
Fieldwork: November December 2007 Publication: March 2008
 Special Eurobarometer European Commission Attitudes of European citizens towards the environment Fieldwork: November December 2007 Publication: March 2008 Summary Special Eurobarometer 295/ Wave 68.2 TNS
Overview of Eurofound surveys
 Overview of Eurofound surveys Dublin 21 st October 2010 Maija Lyly-Yrjänäinen Eurofound data European Working Conditions Survey 91, 95, 00, 05, 10 European Quality of Life Survey 03, 07, 09, 10 (EB), 11
Parlemeter - November 2012 European Parliament Eurobarometer (EB/EP 78.2)
") Directorate-General for Communication Public Opinion Monitoring Unit Parlemeter - November European Parliament Eurobarometer (EB/EP 78.2) ANALYTICAL SYNTHESIS Brussels, 14 February 2013. Coverage: Population:
Directorate-General for Communication Public Opinion Monitoring Unit Parlemeter - November European Parliament Eurobarometer (EB/EP 78.2) ANALYTICAL SYNTHESIS Brussels, 14 February 2013. Coverage: Population:
October 2010 Euro area unemployment rate at 10.1% EU27 at 9.6%
 STAT//180 30 November 20 October 20 Euro area unemployment rate at.1% EU27 at 9.6% The euro area 1 (EA16) seasonally-adjusted 2 unemployment rate 3 was.1% in October 20, compared with.0% in September 4.
Flash Eurobarometer 458. The euro area
 The euro area Survey requested by the European Commission, Directorate-General for Economic and Financial Affairs and co-ordinated by the Directorate-General for Communication This document does not represent
Europeans attitudes towards climate change. Report. Special Eurobarometer 300. Fieldwork March April 2008 Publication September 2008
 Special Eurobarometer 300 EUROPEAN PARLIAMENT European Commission Europeans attitudes towards climate change Fieldwork March April 2008 Publication September 2008 Report Special Eurobarometer 300 / Wave
January 2010 Euro area unemployment rate at 9.9% EU27 at 9.5%
 STAT//29 1 March 20 January 20 Euro area unemployment rate at 9.9% EU27 at 9.5% The euro area 1 (EA16) seasonally-adjusted 2 unemployment rate 3 was 9.9% in January 20, the same as in December 2009 4.
Flash Eurobarometer 458. Report. The euro area
 The euro area Survey requested by the European Commission, Directorate-General for Economic and Financial Affairs and co-ordinated by the Directorate-General for Communication This document does not represent
PROGRESS TOWARDS THE LISBON OBJECTIVES 2010 IN EDUCATION AND TRAINING
 PROGRESS TOWARDS THE LISBON OBJECTIVES IN EDUCATION AND TRAINING In 7, reaching the benchmarks for continues to pose a serious challenge for education and training systems in Europe, except for the goal
SOLIDARITY THAT SPANS THE GLOBE: EUROPEANS AND DEVELOPMENT AID
 Special Eurobarometer 392 SOLIDARITY THAT SPANS THE GLOBE: EUROPEANS AND DEVELOPMENT AID REPORT Fieldwork: June 2012 Publication: October 2012 This survey has been requested by Directorate-General Development
Gender pension gap economic perspective
 Gender pension gap economic perspective Agnieszka Chłoń-Domińczak Institute of Statistics and Demography SGH Part of this research was supported by European Commission 7th Framework Programme project "Employment
DATA SET ON INVESTMENT FUNDS (IVF) Naming Conventions
 Naming Conventions") DIRECTORATE GENERAL STATISTICS LAST UPDATE: 10 APRIL 2013 DIVISION MONETARY & FINANCIAL STATISTICS ECB-UNRESTRICTED DATA SET ON INVESTMENT FUNDS (IVF) Naming Conventions The series keys related to Investment
DIRECTORATE GENERAL STATISTICS LAST UPDATE: 10 APRIL 2013 DIVISION MONETARY & FINANCIAL STATISTICS ECB-UNRESTRICTED DATA SET ON INVESTMENT FUNDS (IVF) Naming Conventions The series keys related to Investment
Growth, competitiveness and jobs: priorities for the European Semester 2013 Presentation of J.M. Barroso,
 Growth, competitiveness and jobs: priorities for the European Semester 213 Presentation of J.M. Barroso, President of the European Commission, to the European Council of 14-1 March 213 Economic recovery
PROGRESS TOWARDS THE LISBON OBJECTIVES 2010 IN EDUCATION AND TRAINING
 PROGRESS TOWARDS THE LISBON OBJECTIVES IN EDUCATION AND TRAINING In, reaching the benchmarks for continues to pose a serious challenge for education and training systems in Europe, except for the goal
COMMISSION STAFF WORKING DOCUMENT Accompanying the document. Report form the Commission to the Council and the European Parliament
 EUROPEAN COMMISSION Brussels, 4.5.2018 SWD(2018) 246 final PART 5/9 COMMISSION STAFF WORKING DOCUMENT Accompanying the document Report form the Commission to the Council and the European Parliament on
NOTE ON EU27 CHILD POVERTY RATES
 NOTE ON EU7 CHILD POVERTY RATES Research note prepared for Child Poverty Action Group Authors: H. Xavier Jara and Chrysa Leventi Institute for Social and Economic Research (ISER) University of Essex The
Social Protection and Social Inclusion in Europe Key facts and figures
 MEMO/08/625 Brussels, 16 October 2008 Social Protection and Social Inclusion in Europe Key facts and figures What is the report and what are the main highlights? The European Commission today published
Investment in Germany and the EU
 Investment in Germany and the EU Pedro de Lima Head of the Economics Studies Division Economics Department Berlin 19/12/2016 11/01/2017 1 Slow recovery of investment, with strong heterogeneity Overall
Investment and Investment Finance. the EU and the Polish story. Debora Revoltella
 Investment and Investment Finance the EU and the Polish story Debora Revoltella Director - Economics Department EIB Warsaw 27 February 2017 Narodowy Bank Polski European Investment Bank Contents We look
European Employment and Social Policy
 Special Eurobarometer European Commission European Employment and Social Policy Report Fieldwork : May 2009 June 2009 Publication: September 2009 Special Eurobarometer 316 / Wave 71.2 TNS Opinion & Social
Entrepreneurship in the EU and beyond. Analytical report
 Flash Eurobarometer The Gallup Organization Flash Eurobarometer European Commission Entrepreneurship in the EU and beyond A survey in the EU, EFTA countries, Croatia, Turkey, the US, Japan, South Korea
Investment in France and the EU
 Investment in and the EU Natacha Valla March 2017 22/02/2017 1 Change relative to 2008Q1 % of GDP Slow recovery of investment, and with strong heterogeneity Overall Europe s recovery in investment is slow,
EUROPEAN COMMISSION EUROSTAT
 EUROPEAN COMMISSION EUROSTAT Directorate F: Social statistics Unit F-3: Labour market Doc.: Eurostat/F3/LAMAS/29/14 WORKING GROUP LABOUR MARKET STATISTICS Document for item 3.2.1 of the agenda LCS 2012
Fieldwork February March 2008 Publication June 2008
 Special Eurobarometer 297 European Commission Attitudes towards radioactive waste Fieldwork February March 2008 Publication June 2008 Report Special Eurobarometer 297 / Wave 69.1 TNS Opinion & Social This
May 2009 Euro area external trade surplus 1.9 bn euro 6.8 bn euro deficit for EU27
 STAT/09/106 17 July 2009 May 2009 Euro area external trade surplus 1.9 6.8 deficit for EU27 The first estimate for the euro area 1 (EA16) trade balance with the rest of the world in May 2009 gave a 1.9
Europeans knowledge of economic indicators
 Special Eurobarometer 323 European Commission Europeans knowledge of economic indicators Fieldwork: August - September 2009 Publication: January 2010 Special Eurobarometer 323 / Wave 72.1 TNS Opinion &
New Europeans. Fieldwork : March 2010 April 2010 Publication: April 2011
 Special Eurobarometer European Commission New Europeans Report Fieldwork : March 2010 April 2010 Publication: April 2011 Special Eurobarometer 346 / Wave TNS Opinion & Social This survey was requested
Taxation trends in the European Union EU27 tax ratio at 39.8% of GDP in 2007 Steady decline in top personal and corporate income tax rates since 2000
 DG TAXUD STAT/09/92 22 June 2009 Taxation trends in the European Union EU27 tax ratio at 39.8% of GDP in 2007 Steady decline in top personal and corporate income tax rates since 2000 The overall tax-to-gdp
The Eurostars Programme
 The Eurostars Programme The EU-EUREKA joint funding programme for R&D-performing SMEs What is EUREKA? > 2 > EUREKA is a public network supporting R&D-performing businesses > Established in 1985 by French
Traffic Safety Basic Facts Main Figures. Traffic Safety Basic Facts Traffic Safety. Motorways Basic Facts 2015.
 Traffic Safety Basic Facts 2013 - Main Figures Traffic Safety Basic Facts 2015 Traffic Safety Motorways Basic Facts 2015 Motorways General Almost 30.000 people were killed in road accidents on motorways
January 2009 Euro area external trade deficit 10.5 bn euro 26.3 bn euro deficit for EU27
 STAT/09/40 23 March 2009 January 2009 Euro area external trade deficit 10.5 26.3 deficit for EU27 The first estimate for the euro area 1 (EA16) trade balance with the rest of the world in January 2009
Special Eurobarometer 459. Report. Climate change
 Climate change Survey requested by the European Commission, Directorate-General for Climate Action and co-ordinated by the Directorate- General for Communication This document does not represent the point
Eurofound in-house paper: Part-time work in Europe Companies and workers perspective
 Eurofound in-house paper: Part-time work in Europe Companies and workers perspective Presented by: Eszter Sandor Research Officer, Surveys and Trends 26/03/2010 1 Objectives Examine the patterns of part-time
H Marie Skłodowska-Curie Actions (MSCA)
") H2020 Key facts and figures (2014-2020) Number of FI researchers funded by MSCA: EU budget awarded to FI organisations (EUR million): Number of FI organisations in MSCA: 155 47.93 89 In detail, the number
H2020 Key facts and figures (2014-2020) Number of FI researchers funded by MSCA: EU budget awarded to FI organisations (EUR million): Number of FI organisations in MSCA: 155 47.93 89 In detail, the number
I. EUROPEANS AND THE TAX ON FINANCIAL TRANSACTION (TFT)...10 IV. THE REACTIONS OF THE MEMBER STATES TO THE CRISIS...19
...10 IV. THE REACTIONS OF THE MEMBER STATES TO THE CRISIS...19") Directorate General for Communication Directorate C - Relations with Citizens PUBLIC OPINION MONITORING UNIT Brussels, 22 June 2011 EUROPEANS AND THE CRISIS European Parliament Eurobarometer ( Parlemeter
Directorate General for Communication Directorate C - Relations with Citizens PUBLIC OPINION MONITORING UNIT Brussels, 22 June 2011 EUROPEANS AND THE CRISIS European Parliament Eurobarometer ( Parlemeter
COMMISSION DECISION of 23 April 2012 on the second set of common safety targets as regards the rail system (notified under document C(2012) 2084)
 2084)") 27.4.2012 Official Journal of the European Union L 115/27 COMMISSION DECISION of 23 April 2012 on the second set of common safety targets as regards the rail system (notified under document C(2012) 2084)
27.4.2012 Official Journal of the European Union L 115/27 COMMISSION DECISION of 23 April 2012 on the second set of common safety targets as regards the rail system (notified under document C(2012) 2084)
Fieldwork February March 2008 Publication October 2008
 Special Eurobarometer 298 European Commission Consumer protection in the internal market Fieldwork February March 2008 Publication October 2008 Report Special Eurobarometer 298 / Wave 69.1 TNS Opinion
Report on the distribution of direct payments to agricultural producers (financial year 2016)
") Report on the distribution of direct payments to agricultural producers (financial year 2016) Every year, the Commission publishes the distribution of direct payments to farmers by Member State. Figures
Report on the distribution of direct payments to agricultural producers (financial year 2016) Every year, the Commission publishes the distribution of direct payments to farmers by Member State. Figures
Safer Internet. Fieldwork Dec Jan 2006 Publication May 2006
 Special Eurobarometer European Commission Safer Internet Fieldwork Dec 2005 - Jan 2006 Publication May 2006 Special Eurobarometer 250 / Wave 64.4 TNS Opinion & Social This survey was requested by Directorate
August 2008 Euro area external trade deficit 9.3 bn euro 27.2 bn euro deficit for EU27
 STAT/08/143 17 October 2008 August 2008 Euro area external trade deficit 9.3 27.2 deficit for EU27 The first estimate for the euro area 1 (EA15) trade balance with the rest of the world in August 2008
H Marie Skłodowska-Curie Actions (MSCA)
") H2020 Key facts and figures (2014-2020) Number of IE researchers funded by MSCA: EU budget awarded to IE organisations (EUR million): Number of IE organisations in MSCA: 253 116,04 116 In detail, the number
H2020 Key facts and figures (2014-2020) Number of IE researchers funded by MSCA: EU budget awarded to IE organisations (EUR million): Number of IE organisations in MSCA: 253 116,04 116 In detail, the number
Weighting issues in EU-LFS
 Weighting issues in EU-LFS Carlo Lucarelli, Frank Espelage, Eurostat LFS Workshop May 2018, Reykjavik carlo.lucarelli@ec.europa.eu, frank.espelage@ec.europa.eu 1 1. Introduction The current legislation
H Marie Skłodowska-Curie Actions (MSCA)
") H2020 Key facts and figures (2014-2020) Number of BE researchers funded by MSCA: EU budget awarded to BE organisations (EUR million): Number of BE organisations in MSCA: 274 161,04 227 In detail, the number
H2020 Key facts and figures (2014-2020) Number of BE researchers funded by MSCA: EU budget awarded to BE organisations (EUR million): Number of BE organisations in MSCA: 274 161,04 227 In detail, the number
H Marie Skłodowska-Curie Actions (MSCA)
") H2020 Key facts and figures (2014-2020) Number of NL researchers funded by MSCA: EU budget awarded to NL organisations (EUR million): Number of NL organisations in MSCA: 427 268.91 351 In detail, the number
H2020 Key facts and figures (2014-2020) Number of NL researchers funded by MSCA: EU budget awarded to NL organisations (EUR million): Number of NL organisations in MSCA: 427 268.91 351 In detail, the number
Fiscal sustainability challenges in Romania
 Preliminary Draft For discussion only Fiscal sustainability challenges in Romania Bucharest, May 10, 2011 Ionut Dumitru Anca Paliu Agenda 1. Main fiscal sustainability challenges 2. Tax collection issues
Social climate. Fieldwork May-June 2009 Publication January 2010
 Special Eurobarometer European Commission Social climate Full report Fieldwork May-June 2009 Publication January 2010 Special Eurobarometer 315 / Wave - European Opinion Research Group EEIG This survey
H Marie Skłodowska-Curie Actions (MSCA)
") H2020 Key facts and figures (2014-2020) Number of FR researchers funded by MSCA: EU budget awarded to FR organisations (EUR million): Number of FR organisations in MSCA: 1 072 311.72 479 In detail, the
H2020 Key facts and figures (2014-2020) Number of FR researchers funded by MSCA: EU budget awarded to FR organisations (EUR million): Number of FR organisations in MSCA: 1 072 311.72 479 In detail, the
Securing sustainable and adequate social protection in the EU
 Securing sustainable and adequate social protection in the EU Session on Social Protection & Security IFA 12th Global Conference on Ageing 11 June 2014, HICC Hyderabad India Dr Lieve Fransen European Commission
H Marie Skłodowska-Curie Actions (MSCA)
") H2020 Key facts and figures (2014-2020) Number of PT researchers funded by MSCA: EU budget awarded to PT organisations (EUR million): Number of PT organisations in MSCA: 716 66,67 165 In detail, the number
H2020 Key facts and figures (2014-2020) Number of PT researchers funded by MSCA: EU budget awarded to PT organisations (EUR million): Number of PT organisations in MSCA: 716 66,67 165 In detail, the number
H Marie Skłodowska-Curie Actions (MSCA)
") H2020 Key facts and figures (2014-2020) Number of SE researchers funded by MSCA: EU budget awarded to SE organisations (EUR million): Number of SE organisations in MSCA: 138 114.71 150 In detail, the number
H2020 Key facts and figures (2014-2020) Number of SE researchers funded by MSCA: EU budget awarded to SE organisations (EUR million): Number of SE organisations in MSCA: 138 114.71 150 In detail, the number
2 ENERGY EFFICIENCY 2030 targets: time for action
 ENERGY EFFICIENCY 2030 targets: time for action The Coalition for Energy Savings The Coalition for Energy Savings strives to make energy efficiency and savings the first consideration of energy policies
0pinions on organised, cross-border crime and corruption
 Special Eurobarometer European Commission 0pinions on organised, cross-border crime and corruption Fieldwork: November - December 2005 Publication: March 2006 Special Eurobarometer 245 / Wave 64.3 TNS
H Marie Skłodowska-Curie Actions (MSCA)
") H2020 Key facts and figures (2014-2020) Number of LV researchers funded by MSCA: EU budget awarded to LV organisations (EUR million): Number of LV organisations in MSCA: 35 3.91 11 In detail, the number
H2020 Key facts and figures (2014-2020) Number of LV researchers funded by MSCA: EU budget awarded to LV organisations (EUR million): Number of LV organisations in MSCA: 35 3.91 11 In detail, the number
Macroeconomic overview SEE and Macedonia
 Macroeconomic overview SEE and Macedonia Zoltan Arokszallasi Chief Analyst, Macro & FX/FI Research Erste Group Bank Erste Investors Breakfast, 29 September, Skopje 02. Oktober SEE shows mixed performance
LEADER implementation update Leader/CLLD subgroup meeting Brussels, 21 April 2015
 LEADER 2007-2013 implementation update Leader/CLLD subgroup meeting Brussels, 21 April 2015 #LeaderCLLD 2,416 2,416 8.9 Progress on LAG selection in the EU (2007-2013) 3 000 2 500 2 000 2 182 2 239 2 287
Europeans and the Common Agricultural Policy
 Special Eurobarometer European Commission Europeans and the Common Agricultural Policy Fieldwork October - November 2005 Publication January 2006 Special Eurobarometer 242 / Wave 64.2 - TNS Opinion & Social
Investment in Ireland and the EU
 Investment in and the EU Debora Revoltella Director Economics Department Dublin April 10, 2017 20/04/2017 1 Real investment: IE v EU country groupings Real investment (2008 = 100) 180 160 140 120 100 80
Fiscal competitiveness issues in Romania
 Fiscal competitiveness issues in Romania Ionut Dumitru President of the Fiscal Council, Chief Economist Raiffeisen Bank* October 2014 World Bank Doing Business Report Ranking (out of 189 countries) Ease
Traffic Safety Basic Facts Main Figures. Traffic Safety Basic Facts Traffic Safety. Motorways Basic Facts 2016.
 Traffic Safety Basic Facts 2013 - Main Figures Traffic Safety Basic Facts 2015 Traffic Safety Motorways Basic Facts 2016 Motorways General Almost 26.000 people were killed in road accidents on motorways
Library statistical spotlight
 /9/2 Library of the European Parliament 6 4 2 This document aims to provide a picture of the, in particular by looking at car production trends since 2, at the number of enterprises and the turnover they
Traffic Safety Basic Facts Main Figures. Traffic Safety Basic Facts Traffic Safety. Motorways Basic Facts 2017.
 Traffic Safety Basic Facts 2013 - Main Figures Traffic Safety Basic Facts 2015 Traffic Safety Motorways Basic Facts 2017 Motorways General More than 24.000 people were killed in road accidents on motorways
H Marie Skłodowska-Curie Actions (MSCA)
") H2020 Key facts and figures (2014-2020) Number of AT researchers funded by MSCA: EU budget awarded to AT organisations (EUR million): Number of AT organisations in MSCA: 215 78.57 140 In detail, the number
H2020 Key facts and figures (2014-2020) Number of AT researchers funded by MSCA: EU budget awarded to AT organisations (EUR million): Number of AT organisations in MSCA: 215 78.57 140 In detail, the number
Guidelines compliance table
 Guidelines compliance table EBA/GL/2018/01 12 January 2018; Date of application 20 March 2018 Guidelines on uniform disclosures under Article 473a of Regulation (EU) No 575/2013 as regards the transitional
H Marie Sklodowska-Curie Actions (MSCA)
") H2020 Key facts and figures (2014-2020) Number of FR researchers funded by MSCA: EU budget awarded to FR organisations (EUR million): Number of FR organisations in MSCA: 565 198.92 370 In detail, the number
H2020 Key facts and figures (2014-2020) Number of FR researchers funded by MSCA: EU budget awarded to FR organisations (EUR million): Number of FR organisations in MSCA: 565 198.92 370 In detail, the number
Recommendations compliance table
 Recommendations compliance table EBA/REC/2017/03 20 December 2017; Date of application 1 July 2018 Recommendations on outsourcing to cloud service providers The following competent authorities* or intend
Country Health Profiles
 State of Health in the EU Country Health Profiles Brussels, November 2017 1 The Country Health Profiles 1. Highlights 2. Health status 3. Risk Factors 4. Health System (description) 5. Performance of Health
THE 2015 EU JUSTICE SCOREBOARD
 THE 215 EU JUSTICE SCOREBOARD Communication from the Commission to the European Parliament, the Council, the European Central Bank, the European Economic and Social Committee and the Committee of the Regions
EBA REPORT ON HIGH EARNERS
 EBA REPORT ON HIGH EARNERS DATA AS OF END 2017 LONDON - 11/03/2019 1 Data on high earners List of figures 3 Executive summary 4 1. Data on high earners 6 1.1 Background 6 1.2 Data collected on high earners
Guidelines compliance table
 compliance table EBA/GL/2018/05 18 July 2018; Date of application 1 January 2019 on fraud reporting under the Payment Services Directive 2 (PSD2) The following competent authorities* or intend to with
H Marie Skłodowska-Curie Actions (MSCA)
") H2020 Key facts and figures (2014-2020) Number of PT researchers funded by MSCA: EU budget awarded to PT organisations (EUR million): Number of PT organisations in MSCA: 592 54.79 135 In detail, the number
H2020 Key facts and figures (2014-2020) Number of PT researchers funded by MSCA: EU budget awarded to PT organisations (EUR million): Number of PT organisations in MSCA: 592 54.79 135 In detail, the number
Flash Eurobarometer 386 THE EURO AREA REPORT
 Eurobarometer THE EURO AREA REPORT Fieldwork: October 2013 Publication: November 2013 This survey has been requested by the European Commission, Directorate-General for Economic and Financial Affairs and
ANNEX CAP evolution and introduction of direct payments
 ANNEX 2 REPORT ON THE DISTRIBUTION OF DIRECT AIDS TO THE PRODUCERS (FINANCIAL YEAR 2005) 1. FOREWORD The Commission regularly publishes the breakdown of direct payments by Member State and size of payment.
HOW RECESSION REFLECTS IN THE LABOUR MARKET INDICATORS
 REPUBLIC OF SLOVENIA HOW RECESSION REFLECTS IN THE LABOUR MARKET INDICATORS Matej Divjak, Irena Svetin, Darjan Petek, Miran Žavbi, Nuška Brnot ??? What is recession?? Why in Europe???? Why in Slovenia?
Health and food. Fieldwork November December 2005 Publication November 2006
 Special Eurobarometer European Commission Health and food Fieldwork November December 2005 Publication November 2006 Special Eurobarometer 246 / Wave 64.3 TNS Opinion & Social This survey was requested
EUROSTAT SUPPLEMENTARY TABLE FOR REPORTING GOVERNMENT INTERVENTIONS TO SUPPORT FINANCIAL INSTITUTIONS
 EUROPEAN COMMISSION EUROSTAT Directorate D: Government Finance Statistics (GFS) and Quality Unit D1: Excessive deficit procedure and methodology Unit D2: Excessive deficit procedure (EDP) 1 Unit D3: Excessive
In 2009 a 6.5 % rise in per capita social protection expenditure matched a 6.1 % drop in EU-27 GDP
 Population and social conditions Authors: Giuseppe MOSSUTI, Gemma ASERO Statistics in focus 14/2012 In 2009 a 6.5 % rise in per capita social protection expenditure matched a 6.1 % drop in EU-27 GDP Expenditure
Vocational Training. Fieldwork October-November 2004 Publication August 2005
 Special Eurobarometer European Commission Vocational Training Fieldwork October-November 2004 Publication August 2005 Special Eurobarometer 216 / Wave 62..1 TNS Opinion & Social This survey was requested
State of play of CAP measure Setting up of Young Farmers in the European Union
 State of play of CAP measure Setting up of Young Farmers in the European Union Michael Gregory EN RD Contact Point Seminar CEJA 20 th September 2010 Measure 112 rationale: Measure 112 - Setting up of young